 Gergely Tikász
 Miklós Gyalai-Korpos1,2
 Sándor Baranya
- 1Department of Hydraulic and Water Resources Engineering, Budapest University of Technology and Economics, Budapest, Hungary
- 2Plastic Cup Society, River Cleanup Technologies and Innovations Unit, Szolnok, Hungary
- 3HUN–REN–BME Water Management Research Group, Hungarian Research Network, Budapest, Hungary
Plastic pollution in freshwater ecosystems poses a growing environmental threat, yet the availability of efficient and scalable monitoring solutions remains limited. This study presents a lightweight, real-time macroplastic detection framework based on the YOLOv8 object detection model, optimized for continuous monitoring using video footage from fixed (pontoon-, bank-, or bridge-mounted) camera systems or mobile (Unmanned Aerial Vehicle, UAV-based) deployments for pollution assessment. The model’s performance was evaluated across multiple environmental scenarios, including simulated pollution and real-world UAV footage under moderate and high plastic pollutant loads. To address key challenges such as small object size and occlusion by vegetation, pre-processing techniques including image tiling and blurring were applied. These enhancements led to notable improvements in recall and mean Average Precision (mAP) scores. The proposed system architecture supports both decentralized (on-site) and centralized processing configurations, allowing flexible deployment across diverse monitoring contexts. Beyond its operational applicability, the system enables the large-scale collection of pre-annotated datasets, supporting future model refinement and site-specific training. When combined with hydrological and meteorological data, the resulting time series may serve as a foundation for predictive models of plastic pollution transport, offering a valuable tool for mitigation efforts and early warning systems.
1 Introduction
1.1 Plastic pollution of rivers
The accelerated production, consumption and (mismanaged) disposal of single-use materials exert a significant stress on the environment, both on land and in water. The production of plastic materials has increased exponentially since the Second World War, reaching a global production of 400.3 million tonnes in 2022 (Geyer et al., 2017; Nayanathara Thathsarani Pilapitiya and Ratnayake, 2024). The continued prevalence and unwavering appeal of polymers can be attributed to their distinctive characteristics, which include a lightweight yet robust composition, high tensile strength, resistance to corrosion, low electrical and thermal conductivity (Ilyas et al., 2018; Nayanathara Thathsarani Pilapitiya and Ratnayake, 2024). Moreover, the cost of production is relatively low. The produce-use-dispose linear economic model is a prevalent paradigm for plastic materials, despite the growth of recycling as a business sector (Morales-Caselles et al., 2021). The majority of single-use plastics is used for packaging purposes, with plastic bags, bottles and food containers representing the most common forms of packaging and accounting for approximately half of the total plastic production. This particular form of waste is among the most frequently mismanaged and is therefore highly likely to enter the environment as pollution (Geyer et al., 2017). The increasing presence of plastic pollution along shorelines and in nearshore waters is largely driven by the accumulation of land-based litter, which is subsequently transported to marine environments via rivers and other watercourses (Jambeck et al., 2015). While open ocean waters are also affected by terrestrial plastic inputs, the predominant source of plastic in these regions is fishing-related debris, particularly lines, nets, and buoys (Morales-Caselles et al., 2021).
Although inland areas generally contribute less to marine and oceanic litter than coastal or near-coastal regions they produce comparable quantities of plastic waste. However, the likelihood of these materials reaching estuaries is reduced due to their tendency to become trapped in floodplains or deposited in reservoir sediments along their longer transport pathways. As a result, while inland plastic waste may exert less direct pressure on coastal and marine systems, significant volumes of anthropogenic debris accumulate within continental freshwater systems. These accumulations are particularly prevalent in floodplains and wetlands, ecologically sensitive areas with diverse and valuable ecosystems (Gallitelli and Scalici, 2022; Lebreton et al., 2017; Schreyers et al., 2024).
Plastic pollutants are commonly classified based on particle size; however, the categorization schemes and associated thresholds vary across the literature. The primary consideration in distinguishing categories is the potential for ingestion by animals. Microplastic particles are small enough to be ingested by a wide range of organisms, including fishes, mammals, reptiles, amphibians, and birds (Cole et al., 2011; Ilyas et al., 2018). In contrast, macroplastics are generally too large to be ingested by most species. The threshold that separates microplastics from macroplastics is inconsistently defined. While some sources adopt a 10 mm upper limit for microplastics (Graham and Thompson, 2009), others propose a 5 mm threshold (Barnes et al., 2009; Betts, 2008), or even 1 mm (Browne et al., 2007; Browne et al., 2010; Claessens et al., 2011).
1.2 Assessment of macroplastics in fluvial water
When assessing the impact of plastic pollution in riverine environments, quantifying the flux of plastic materials is essential. This involves measuring the amount of plastic transported by the river, typically expressed as weight or number of items per unit time (Hurley et al., 2023). Additional relevant parameters include the material composition of the plastic debris (Ronkay et al., 2025; van Calcar and van Emmerik, 2019), the degree of degradation, the environmental residence time of the particles, and the origin of the plastic waste (González-Fernández et al., 2021; Ronkay et al., 2025).
Several viable methods exist for assessing the amount of macroplastic litter in fluvial environments. One of the main approaches involves the physical collection of plastic debris from the river, typically using nets (Haberstroh et al., 2021; Moore et al., 2011; Munari et al., 2021; Schöneich-Argent et al., 2020; Taryono et al., 2020; van Emmerik et al., 2019a; van Emmerik et al., 2019b) or booms (Malik et al., 2020; Roy et al., 2021). In this case, plastic flux can be estimated by dividing the collected quantity by the deployment time of the instrument. An alternative method involves sampling plastic particles trapped on floodplains after flood even (Molnár and Hankó, 2022). While this approach does not support direct flux estimation, it can provide valuable information on plastic characteristics such as material composition, degradation state, and source. Additionally, booms and manual collection methods serve multiple purposes by supporting both data collection, mitigation and cleanup efforts.
The second major category of assessment methods is based on visual observation. This may be conducted by human observers counting particles at fixed cross-sections (Crosti et al., 2018; González-Fernández and Hanke, 2017; van Emmerik et al., 2018; van Emmerik et al., 2020) or through the analysis of imagery captured by fixed cameras (Kataoka and Nihei, 2020; Lieshout et al., 2020), unmanned aerial vehicles (UAV) (Geraeds et al., 2019; Rocamora et al., 2021; Schreyers et al., 2021; Wolf et al., 2020), or satellites (Molnár et al., 2024; Salgado-Hernanz et al., 2021; Tasseron et al., 2021). The increasing availability of digital imagery has enabled the use of computer vision techniques for automated video analysis (Armitage et al., 2022; Cortesi et al., 2021; Cortesi et al., 2023; de Vries et al., 2021; Garcia-Garin et al., 2021; Geraeds et al., 2019; Kataoka and Nihei, 2020; Lieshout et al., 2020; Pinto et al., 2021; Teng et al., 2022; Veerasingam et al., 2022; Wolf et al., 2020). While observation- and image-based methods are limited to visible plastics floating on the surface of water or found on land and do not provide detailed information on material properties or degradation state, they can deliver reliable estimates of flux, quantity, and item categories (Hurley et al., 2023). Moreover, recent advances in deep learning have substantially reduced the cost and labor associated with such approaches, enhancing both spatial and temporal scalability. These developments open the way for the establishment of cost-effective, continuous monitoring networks across entire river systems.
1.3 Application of deep learning for the monitoring of macroplastics
The application of deep learning has proven highly effective in addressing various challenges, including the detection of plastic litter. The aim of the present investigation was to evaluate the applicability of image classification, segmentation, and object detection techniques for the quantification of macroplastics, with the goal of identifying the most suitable approach for detecting and measuring plastic objects. Tile-wise image classification has been shown to be effective in quantifying plastic litter in heavily polluted environments, particularly in satellite and UAV imagery (Gonçalves et al., 2020; Pinto et al., 2021; Wolf et al., 2020). This technique enables the generation of object density maps across large areas. Pixel-wise classification—more commonly referred to as image segmentation—can also be applied to macroplastic detection (Kylili et al., 2021; Lieshout et al., 2020; Shinichiro and Morita, 2020). It is most often used in the analysis of aerial images, including those captured by UAVs and satellites. While these approaches can cover vast areas or long river stretches, they are less suited for continuous monitoring and typically require more effort to achieve reliable quantification. The third method, object detection is the most commonly used for quantifying plastic litter in open water (Armitage et al., 2022; de Vries et al., 2021; Gonçalves et al., 2020; Teng et al., 2022) or riverine environments. Its main advantage is the ability to detect and count individual objects directly. Detected items are localized using bounding boxes (BB), which can be easily counted in still images or tracked over time in video sequences.
All three approaches support the classification of objects into multiple categories, allowing differentiation by litter type or pollution intensity. In this study, the authors adopted object detection as the preferred method, as it enables efficient identification and quantification of individual macroplastic items with minimal manual intervention.
Modern one-stage object detectors can achieve real-time throughput on suitable GPUs (e.g., YOLO; Redmon et al., 2015; Jocher et al., 2023). Real-time systems have been reported for aquatic plastic detection (Lin, 2021; Yang et al., 2025; Balamurugan et al., 2025) and for waste-management applications (Ghatkamble et al., 2022; Hua et al., 2020), but adoption remains limited, particularly for sustained, low-power operation at remote sites. Long-duration river monitoring typically requires continuous video in locations with constrained power and bandwidth and limited maintenance access, which favors low-power edge devices over datacenter hardware. Although larger architectures can, in principle, meet frame-rate targets, the necessary GPUs are generally impractical for long-term field stations in terms of cost and energy demand. Consequently, lightweight models and resource-aware pipelines are preferred for sustained real-time monitoring.
1.4 Aim of this study
The objective of this study is to apply computer vision techniques for the detection of macroplastic pollutants on water surfaces and floodplains, including those of streams, rivers, and lakes. The primary focus is on fluvial environments. The use of computer vision in this context is motivated by its ability to quantify visible plastic items, thereby enabling an estimation of macroplastic flux across river cross-sections. Deploying a system capable of real-time detection and quantification could significantly improve the understanding of macroplastic transport processes and support the development of alert systems to assist in organizing remediation and mitigation efforts during so-called “plastic flood” events. The most common types of plastic litter consist of a heterogeneous mixture of food packaging, including plastic bags, bottles, and containers. Among these, plastic bottles represent a particularly prominent fraction. Due to their lightweight construction and large surface area, plastic bags are highly susceptible to entrapment, degradation, and sinking. In fluvial environments, turbulent flows tend to submerge and fragment plastic bags rapidly, often rendering them visually undetectable.
As a result, this study primarily focuses on plastic bottles, which serve as practical indicators of plastic pollution. Their smooth shape causes them to dislodge first during flood events, and their resistance to degradation, combined with their tendency to retain air—even when uncapped—allows them to remain afloat for extended periods. These characteristics make them particularly suitable for detection using visual or image-based methods.
The main novelty of this work is a scalable, cost-effective framework for real-time macroplastic monitoring, engineered for practical field deployment. Building on a robust body of prior work (Wolf et al., 2020; Kylili et al., 2021; Marin et al., 2021; Teng et al., 2022; Wang and Zhao, 2024; Reddy et al., 2024), the authors move from controlled evaluations to field readiness by presenting an operational system concept suitable for inland waters and adaptable to open-water contexts. The framework supports networked stations along river corridors, enabling reach-scale coverage and basin-scale situational awareness rather than reliance on a single vantage point. The authors also extend applicability to UAV-based rapid assessments and show that simple pre-processing (blurring and tiling) can demonstrably improve detection in vegetation-obscured and small-object scenarios without specialized acquisition hardware.
2 Methods and materials
2.1 Selection of the detector
To address the challenge of quantifying macroplastic pollutants and estimating their flux in fluvial waters, the authors employed an object detection approach. Among available solutions, models from the You Only Look Once (YOLO) family (Redmon et al., 2015) are widely regarded for their high detection accuracy, particularly when trained on relevant datasets. Previous studies have successfully utilized larger YOLOv5 models (Kylili et al., 2021; Teng et al., 2022) for detecting macroplastic pollution in open water, coastal, and, less frequently, inland environments.
The authors adopted the YOLOv8 framework (Jocher et al., 2023) for its modern, anchor-free design, decoupled heads, TensorRT export, and integrated tracking; according to the developers’ benchmark reports, it also delivers higher detection metrics at comparable inference times (Ultralytics, 2023), facilitating real-time deployment under the hardware constraints considered here. YOLOv8 is available in five model sizes—N (nano), S (small), M (medium), L (large), and X (extra-large). Implemented in PyTorch with export options to ONNX/TensorRT, it combines strong detection performance with fast frame processing, supports real-time analysis of video and streaming inputs, and provides built-in tracking, making it a comprehensive, out-of-the-box solution.
YOLOv8 has been successfully implemented in numerous applications for environmental monitoring (Chen et al., 2024; Guo et al., 2024; Wang et al., 2024; Zhu and Xu, 2025; Zhu et al., 2024; Di et al., 2025; Zhang and Wu, 2025; Jiang and Wu, 2024) showcasing its suitability to be deployed in macroplastic detection as well.
Given the constraints of real-time deployment and the need for cost-effective implementation in practical applications, the use of large-capacity GPUs was not feasible. As a result, the larger YOLOv8 models (L and X) were excluded due to their high computational demands, while the N model was found to be inadequate for capturing the complexity of the task. The study therefore focused on training multiple S and M models with varying hyperparameters to identify the optimal balance between performance and efficiency.
2.2 Training images
The training images used in this study were collected from a variety of sources. A portion originated from a previous research project (Paller and Élő, 2022), which provided both the equipment and a functional, though imprecise, Fast R-CNN model based on the method of (Girshick, 2015), along with its training dataset comprising 243 images. In several instances, these images contained only a single plastic bottle placed in an artificial indoor setting, such as on a desk. To obtain additional training data and essential validation videos, an artificial pollution scenario was staged along the right bank of the Danube River at river kilometer (Rkm) 1,645 in Budapest. Plastic bottles were deliberately released into the river and subsequently retrieved. This campaign yielded 348 annotated images. Further contributions came from the Plastic Cup Society, a Hungarian non-governmental organization dedicated to removing plastic waste from the River Tisza and its tributaries. They provided 68 images from the River Bodrog, as well as a substantial volume of UAV footage from both the Tisza and Bodrog rivers. To further expand the dataset, an extensive search was conducted across online platforms for any visual material featuring plastic debris in hydraulic environments. In total, 1,667 images were assembled for training purposes.
2.3 Annotation
Once a sufficient set of training images had been compiled, ground truth (GT) data were generated through manual annotation using BBs for object detection. It is essential to establish and consistently follow a clear annotation methodology, as inconsistencies can significantly compromise model performance. During the planning phase, the definition of detection classes must also be addressed in a consistent and well-justified manner. A review of the dataset revealed that creating multiple classes based on the original use or material composition of anthropogenic waste was not feasible due to the limited number of training samples. As a result, a single detection class—labelled “Plastic”—was adopted. Annotation was carried out solely by the first author to ensure consistency; the guiding principle was that if the annotator could not clearly identify an item as plastic, it was not labelled. While not all annotated objects were strictly composed of plastic, a small amount of visually comparable items such as floating glass bottles and aluminum cans were included, which were less than 5% of all annotated objects. Although these fall outside the formal scope of the study, excluding them would likely have confused the detector during training due to their visual resemblance to plastic objects. Since the primary objective was to quantify plastic pollutants, individual object-level annotation was selected as the most effective strategy, providing optimal conditions for subsequent quantification. The annotation process was carried out using the Roboflow platform, which was chosen for its advanced and user-friendly annotation tools. In total, 1,667 annotated image–label pairs were produced.
2.4 Augmentation
To expand the training dataset, a series of data augmentation techniques were applied using the Imgaug Python library. For each original image, five augmented variants were generated through a combination of geometric transformations. These included scaling (±10%), shearing (±10°), and rotation (±15° in both directions), along with image-level modifications such as motion blur (kernel size: 5–10), perspective transformation (scale: 0.05–0.1), and random padding or cropping (±25% of the image). Not all transformations were applied to every image–annotation pair. Instead, augmentations were applied randomly, within predefined parameter ranges. This process yielded a total of 8,335 image–annotation pairs. In accordance with YOLO requirements, the dataset was split into three subsets: 70% for training, 10% for testing, and 20% for validation.
2.5 Training of the models
The models were trained in a Google Colab environment using a Tesla T4 (16 GB) GPU, which enabled the use of larger batch sizes and higher-resolution training images. Training, in this context, refers to the process of adjusting the parameters of the model, amounting to a substantial number of variables. For instance, the YOLOv8 small (S) model contains approximately 11.2 million parameters, while the medium (M) model comprises around 25.9 million.
YOLOv8 offers several optimizers based on the Gradient Descent algorithm. In all experiments, Stochastic Gradient Descent (SGD) was used consistently as the optimizer. Preliminary tests exploring various hyperparameter settings showed limited improvement compared to the default configuration. As a result, subsequent experiments focused on comparing the effects of increased input image resolution and a larger model architecture (YOLOv8m) to the baseline YOLOv8s model trained with default image size, while keeping all other hyperparameters unchanged. Model training was carried out for a maximum of 300 epochs, or until performance ceased to improve or began to decline, in which case training was terminated early.
2.6 Analysis of the model performances
To evaluate the performance of the models during training, validation, and under varying test conditions, it is essential to define a set of objective indicators that enable consistent comparison. In object detection tasks, evaluation is based on two key criteria: the spatial accuracy of the predicted BBs and the correctness of the predicted class label relative to the GT. In this study, the latter is irrelevant, as the analysis is limited to a single class. The positional accuracy of a predicted BB is assessed using the Intersection over Union (IoU) metric, which quantifies the ratio between the area of overlap and the area of union of the predicted and GT boxes (Rezatofighi et al., 2019). A predicted BB is considered a true positive (TP) if the IoU exceeds a predefined threshold. If the IoU is below the threshold, the prediction is considered a false positive (FP). GT objects that are not detected are counted as false negatives (FN). Model performance is commonly summarized using Precision (P), defined as the ratio of TP to the total number of predicted BBs (TP + FP), and Recall (R), defined as the ratio of TP to the total number of GT BBs (TP + FN) (Padilla et al., 2021). Average Precision (AP) is calculated as the area under the P–R curve for a given IoU threshold. In multi-class problems, the AP is computed per class, and their average yields the mean Average Precision (mAP) (Rezatofighi et al., 2019). For single-class scenarios such as this study, AP and mAP are equivalent. Commonly reported variants include mAP@50 (IoU threshold = 0.5) and mAP@50–95, which is the mean of APs calculated across IoU thresholds from 0.5 to 0.95 in increments of 0.05, providing a more stringent measure of detection accuracy.
2.7 Employment of the models
Given the goal of developing a cost-effective device for macroplastic quantification, it is essential that the detection model operates efficiently on low-to mid-range hardware. To evaluate this requirement, performance testing was conducted on a laptop equipped with an Intel Core i7-8565U CPU and an NVIDIA GeForce GTX 1050 Max-Q Design GPU, representative of affordable yet capable computational platforms. Due to the high computational demands and inherent parallelism of deep learning inference, real-time performance can only be achieved on a GPU. Since YOLO models rely on PyTorch, which utilizes NVIDIA’s CUDA architecture for GPU acceleration, only NVIDIA GPUs are compatible for deployment.
While PyTorch provides considerable flexibility in terms of model configuration and input image resolution, it does not always leverage the full performance potential of the GPU. To address this limitation and improve inference speed, the trained models were exported to TensorRT engines. This conversion significantly accelerated frame analysis when applied to Full HD input images. It should be noted, however, that the exported TensorRT engine is resolution-specific and can only process images at the resolution defined at the time of export.
2.8 Tracking and quantification
YOLOv8 supports a tracking mode for video and live stream inputs, enabling not only object detection but also real-time object tracking. Once an object is detected with a confidence score exceeding a predefined threshold, the tracker activates and continues to follow the object across subsequent frames. This is achieved by predicting the likely location of the object in the next frame based on its previous trajectory. In this study, the default tracking algorithm integrated into YOLOv8, namely BoT-SORT (Aharon et al., 2022), was employed. Upon initiating tracking, each detected object is assigned a unique identification number (ID), which is maintained throughout its presence in the scene. This makes it possible to quantify the number of individual objects observed during a given time interval by comparing the highest assigned ID at the start and end of the interval. Additionally, the use of tracking significantly mitigates the risk of double-counting objects that remain in the frame for an extended period or become temporarily occluded or stationary.
2.9 Improvement of model detecting capabilities on complex UAV footage
Object detectors often encounter challenges in environments where target objects are partially occluded or intersected by other elements, which can distort their visual boundaries and hinder accurate detection. A promising strategy to address this issue is the application of a blurring filter as a preprocessing step (Hanson et al., 2022; Yoshihara et al., 2023). By reducing the sharpness of overlapping elements, blurring diminishes visual noise and enhances the distinguishability of relevant object contours. In the present study, the effectiveness of different blur types and kernel sizes was systematically evaluated to determine their influence on detection performance. Three types of convolution-based blurring methods were tested on a representative UAV video frame: (i) Box blur, which computes the arithmetic mean of all pixel values within the kernel window; (ii) Median blur, which replaces the central pixel with the median of the surrounding values; and (iii) Gaussian blur, which applies a weighted average governed by a Gaussian distribution centered on the kernel.
Another persistent challenge in object detection is the reduced performance when detecting small objects. One adopted approach to improve detection in such cases involves increasing the relative size of objects within the analyzed region (Kos et al., 2025; Yang et al., 2024). In this study, a simple yet effective tiling method was hypothesized and tested: the input image was subdivided into smaller tiles, effectively enlarging the apparent size of small objects in each tile. The procedure involved dividing the image’s vertical and horizontal axes into equal segments, creating a uniform grid of sub-images. The tiling level was defined by the number of subdivisions along one edge. As expected, increasing the tiling resolution led to higher computational costs and longer inference times per frame. Consequently, identifying an optimal tiling configuration is essential to balancing improved detection accuracy against processing efficiency.
2.10 Study sites
The trained model was applied to various media formats, including still images, pre-recorded videos, and live video streams. The still images were collected from the floodplain of the River Bodrog, a tributary of the Tisza River in northeastern Hungary, a region known to be heavily impacted by plastic pollution, as well as from a macroplastic trap installed on the Danube (Case A).
The pre-recorded videos used for evaluation originated from three distinct fluvial environments (Table 1). Case A was recorded in central Budapest, Hungary, on the right bank of the Danube River at river kilometer (Rkm 1,645). This scenario represents a simulated pollution event in which plastic items were deliberately released, and subsequently retrieved, to mimic a plastic leakage scenario. Case B consists of UAV footage captured upstream of the Kisköre Dam on the River Tisza (Rkm 404) following the 2019 flood, showing plastic litter retained by the dam. Case C comprises UAV imagery from the River Bodrog, depicting plastic debris accumulated in the floodplain and riparian forest following a flood event in 2023.
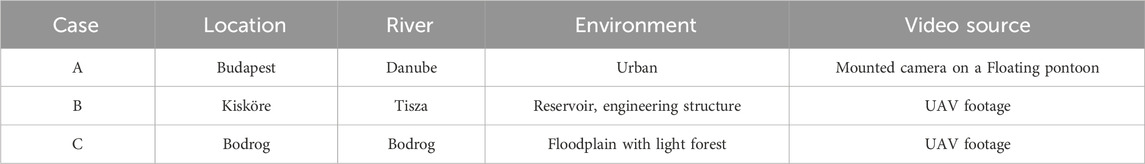
Table 1. Source of the pre-recorded video footages.
In addition, the model was tested on a live video stream recorded by an Internet Protocol (IP) camera mounted on a pontoon approximately 100 m downstream from the Case A location on the Danube. This footage was captured during a flood event in September 2024.
3 Results
3.1 Selection and training of the most appropriate model
To investigate the effect of model architecture and image resolution on detection performance, three YOLOv8 models (A, B, and C) were trained using identical default hyperparameters. Model A served as the baseline, trained with the default image resolution. Two enhancement strategies were then evaluated independently: increasing the input image size (Model B) and using a more complex model architecture (Model C). All models were trained using the same dataset and training protocol. This approach allowed for an isolated assessment of the impact of model complexity and input resolution on key performance metrics, namely P, R, mAP@50, and mAP@50–95, while also considering the suitability of each model for real-time deployment. The image resolutions and batch sizes used in training are summarized in Table 2.
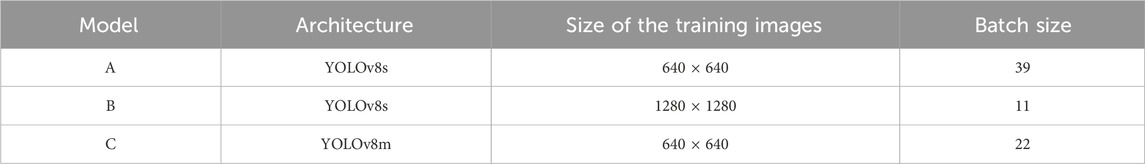
Table 2. The trained model variants.
Training was carried out for a maximum of 300 epochs, or until early stopping criterion was met, namely, stagnation or signs of overfitting (Figure 1). In each case, the weights of the model corresponding to the best validation performance, as recorded by the YOLOv8 training algorithm, were retained for further use (Table 3). Training of Model A was halted once performance plateaued. In contrast, Model B exhibited overfitting, as indicated by a decline in performance on the test set with continued training. For this model, the best-performing weights prior to overfitting were used. In the case of Model C, training continued beyond the onset of stagnation, approximately at epoch 200, in order to observe potential delayed improvements, although this approach may not have been the most resource-efficient.
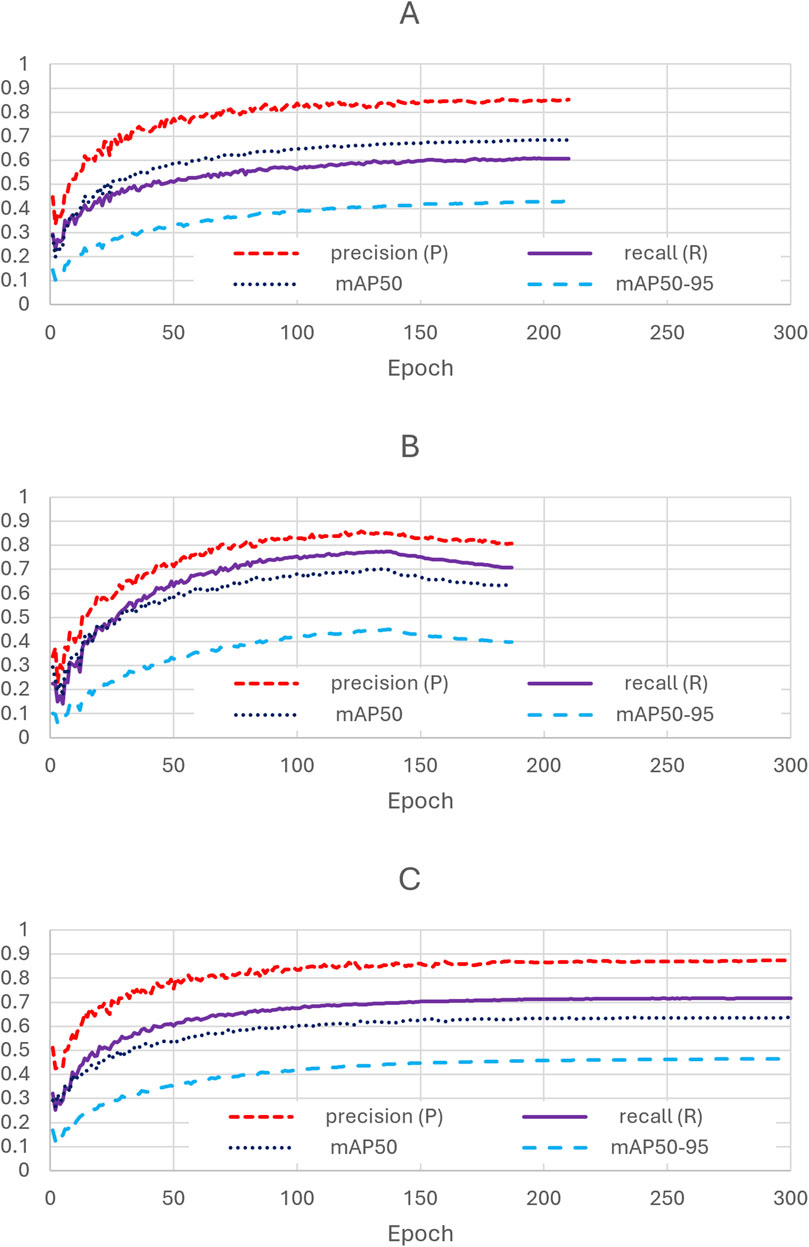
Figure 1. Metrics of the tests of the models during training in function of epochs.
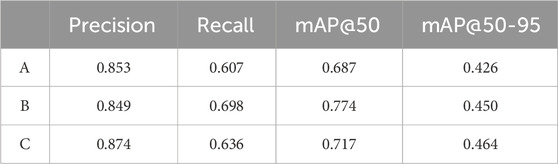
Table 3. The metrics of the models in validation.
The results obtained from the three models reveal broadly similar performance, suggesting that the primary limiting factor is the training dataset itself. Nevertheless, all three models are deemed sufficient for initiating a first deployment phase, during which additional training images can be collected to support the development of more accurate models in the future. As reflected by the higher R values observed on the validation dataset (Table 3), Models B and C exhibited an improved ability to detect plastic objects. To investigate this further, Model B was selected for subsequent testing due to its faster inference speed compared to Model C, with the caveat that the performance differences between the two were marginal (Table 3), with the advantage going to Model B (henceforth referred to as “the model”).
3.2 Deployment of the model on images
The initial deployment of the trained model was conducted on a set of pre-recorded images captured in the floodplain of the River Bodrog and at a macroplastic trap on the Danube in Budapest. The image set, comprising eight representative samples, contained real-world instances of pollution embedded in complex environmental contexts. The model demonstrated acceptable performance across this dataset; however, its detection metrics (Table 4) were lower than those observed during the validation phase (Table 3). This reduction in performance is expected, given the increased complexity of the task, particularly the presence of occluding vegetation and background noise.
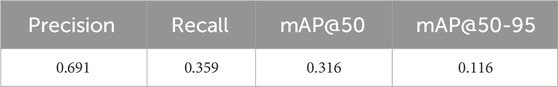
Table 4. Means of the indicators of image deployment.
The model demonstrated a general capability to detect a substantial number of plastic objects. However, in some instances, multiple BBs were assigned to a single object (Figure 2), which complicates accurate quantification. A key challenge identified during testing was the presence of vegetation, particularly branches intersecting the edges of plastic items. These occlusions often distorted the object contours, leading the model to detect only fragments of the actual item. As a result, several otherwise correct detections were classified as FP, despite the object being a genuine plastic item.
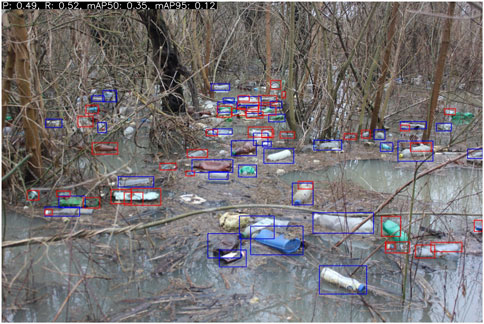
Figure 2. Deployment on pre-recorded images from the floodplain of River Bodrog TP with blue, FP with red.
3.3 Deployment on prerecorded videos
As a step toward real-time application, the trained model was first deployed on pre-recorded video footage from multiple case studies.
In case A (Supplementary Video S1; Figure 3A), which featured simulated light plastic pollution, the model exhibited reliable detection and tracking performance for plastic waste appearing in the central region of the frame. However, it showed limited capability in identifying objects passing through the right side of the image, closer to the main flowline. Most detections occurred near the camera, reflecting a common limitation of object detection models in recognizing small, distant objects.
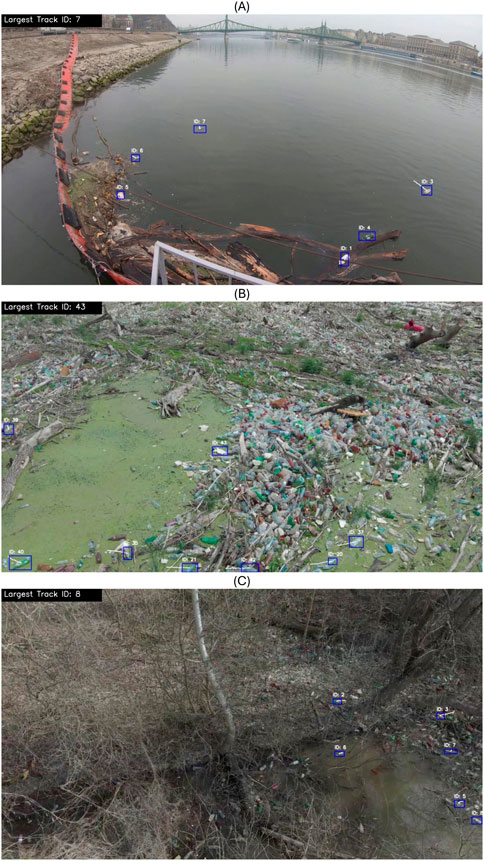
Figure 3. Representative frames from the study videos. (A) Case A; (B) Case B; (C) Case C.
In Case B (Supplementary Video S2; Figure 3B), the model exhibited a limited ability to detect the substantial level of plastic pollution present. It successfully identified individual plastic items, primarily those isolated or situated along the edges of the dense floating debris accumulations. However, it failed to detect most particles embedded within the interior of these aggregations, likely due to their small relative size and the high object density. As a result, pollution events of this nature cannot be reliably quantified using the current model. Nevertheless, the detection of conspicuous concentrations of plastic waste may still serve as an effective basis for issuing pollution alerts.
In Case C (Supplementary Video S3; Figure 3C), the overhead perspective of dense vegetation posed a significant challenge to the model, as tree branches frequently intersected with plastic objects, obscuring their contours and hindering detection. The small relative size of the litter further compounded this difficulty. As a result, the model was unable to detect the majority of the plastic debris present in the footage.
By contrast, the performance observed in Case A suggests that the model is suitable for the originally intended application: monitoring the open water surface from a fixed, shore- or pontoon-mounted camera. In such settings, the absence of occlusions and the proximity of objects to the camera enable effective detection and tracking of floating macroplastic pollutants.
3.4 Deployment on real time video feed
A sensitivity analysis was carried out to determine the minimum frame rate necessary for effective operation of the tracking mode in real-time conditions. The objective was to identify the lowest feasible model inference rate (in frames per second, FPS) at which object tracking remains stable. To this end, the pre-recorded video from Case A was used, and different frame rates were simulated by selectively omitting frames between analyzed images. The results indicated that the number of objects detected remained consistent at or above 6 FPS. However, when the frame rate dropped below this threshold, the tracking performance deteriorated: objects were repeatedly detected with new IDs, indicating instability in the tracking mechanism (Table 5).
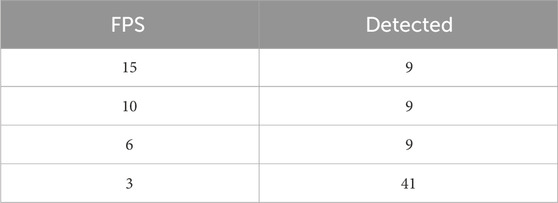
Table 5. Sensitivity analysis of the necessary FPS for tracking.
The results of the sensitivity analysis indicate that a frame rate of 6–10 FPS is required for reliable operation of the tracking mode under conditions similar to those in Case A. This requirement is closely tied to the movement speed of floating objects, which is primarily influenced by hydrodynamic and wind conditions. Accordingly, frame rate requirements should be re-evaluated prior to deployment in new environments. For real-time stream analysis, individual frame inference must be completed in under 160 milliseconds to maintain the necessary throughput, with 100 milliseconds being preferable for optimal performance. On the employed hardware, the original PyTorch-based YOLOv8 model achieved an inference time of approximately 150 milliseconds per 1920 × 1,080 frame using GPU acceleration. To further optimize runtime, the model was converted to a TensorRT engine, which enables more efficient utilization of GPU tensor cores. This conversion reduced inference time to approximately 100 milliseconds per frame.
3.5 Improvements of detection on pre-recorded UAV footage
Case B exhibited challenges stemming from an excessively high object density and a disproportionately small object size relative to the image dimensions. Case C demonstrated the difficulties associated with both suboptimal object sizes and occlusion by intersecting vegetation.
In environments where the object density is high (Case B), distinguishing between objects and background becomes increasingly complex, an essential aspect for reliable object detection. Under such conditions, object detection models may prove insufficient, and the problem domain begins to overlap with that of image segmentation.
3.5.1 Tiling
One way to address the issue of small object size if sufficient image resolution is available is through the application of a tiling strategy. To determine an appropriate tiling resolution, a representative frame from Case B was analyzed using various tile configurations. Due to the substantial number of objects present in the frame, manual annotation was considered impractical; thus, the number of detections was used as a proxy indicator of detection efficacy. The results demonstrated a clear trade-off between grid resolution and computational cost, with higher tiling densities markedly increasing inference time (Figure 4).
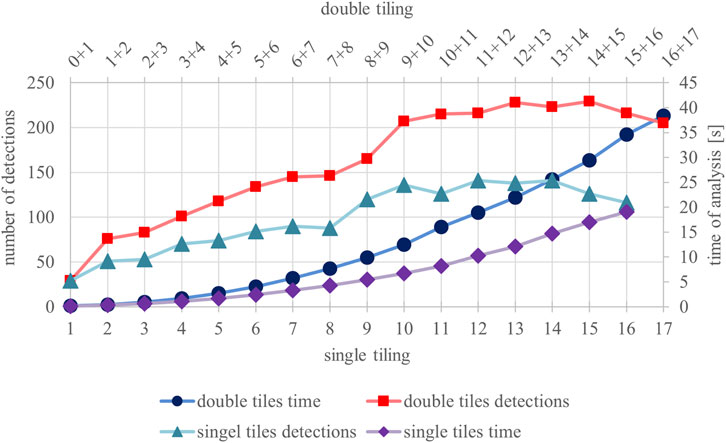
Figure 4. Detected BBs and fame analysis time as a function of single and double tiling.
Performance improved as tiling resolution increased up to a grid size of 10 × 10, plateaued between 10 × 10 and 14 × 14, and subsequently declined beyond 14 × 14 (Figure 4). This pattern suggests that tiling can enhance model sensitivity to small objects to a certain extent, but overly fine grids may introduce redundancy or fragmentation effects that degrade performance.
The limitation of the detection caused by the counterproductive effect of tiling process as it is resulting in fragmentation of objects, making them more difficult to detect, or they may be detected multiple times due to their presence in different tiles. In an attempt to avoid the aforementioned issue, a dual tiling method is employed, where the image is divided into two different tiling sizes, the model analysis both of them, and the obtained results are merged, based on IoU 0.5 threshold. In order to avoid the problem of overlapping gridlines, it was necessary to use a consecutive number of tiles. There are other potential options to consider, including the utilization of n and 2n tiling, as well as the implementation of a single type with a shift of half the tile size. Both methods would result in larger distances between the gridlines, thereby possibly leading to more stable detections. However, the discrepancy in tile size could potentially lower the amount detections.
It is evident that the analysis of the entire image, utilizing the double tiling method, necessitates a substantially greater temporal investment. As previously observed, the presence of overly dense tiling is associated with diminished detection capabilities in this case as well with similar curve for the detections however the number of detections nearly doubled.
Both methods were tested on case B: simple tiling with 10 (Supplementary Video S4) and double tiling with 10 + 12 (Supplementary Video S5). These are the ones showing the highest detection increase with moderate inference time. The double tiling 10 + 12 was chosen because the 1920 × 1,080 image is divided into tiles with integer sizes and the grids exhibit minimal overlapping.
After the tiling process is implemented, the use of the YOLO-built tracker becomes infeasible for tracking over tiles, therefore a custom iteration of the BoT-SORT tracker was used.
The single-tiling approach resulted in a total of 2,610 detections, whereas the application of the double-tiling strategy yielded 3,633 detections, indicating a substantial increase in the number of detected objects when employing the more complex tiling method. Supplementary Video S4 demonstrates the influence of the grid structure on the detection process, as the shifting grid leads to noticeable displacement of the BBs. Up to this point, a rudimentary simplification has been applied, whereby a detection is considered a TP. In case B, the substantial presence of plastic pollutants renders this approach largely accurate; however, a considerable number of FN detections are still observed in the video. A further limitation is the inaccurate re-identification of objects: the same object is frequently detected multiple times under different IDs after a temporary disappearance, indicating that the re-identification algorithm fails to correctly associate subsequent instances with the original detection. Both issues are present in the single- and double-tiling methods alike, ensuring a fair comparison and highlighting the superior performance of the double-tiling approach.
3.5.2 Blurring
To test the effect of the blurring preprocessing step three different types of blurring kernels, each with a range of sizes, were applied to a representative frame from case C. Blurring was implemented through the convolution of a kernel with the image. The tested kernels included Box blur, which computes the arithmetic mean of all pixel values within the kernel window, assigning equal weight to each; Median blur, which replaces the center pixel with the median value of the surrounding pixels; and Gaussian blur, which applies a weighted average where the weights follow a Gaussian distribution centered on the kernel. Hence the blurring method is denoted by the blur type and its kernel size, e.g.: Gaussian 15.
To gain valuable insight the frame was annotated to create GT to calculate the standard indicators.
Although several configurations were evaluated, only Median 5 and Box 4 proved to be viable candidates based on their performance. The primary objective was to enhance R, while also considering P, given the persistent importance of accurate detection. Ultimately, Median 5 was selected for further analysis, as it yielded a higher R (Figure 5).
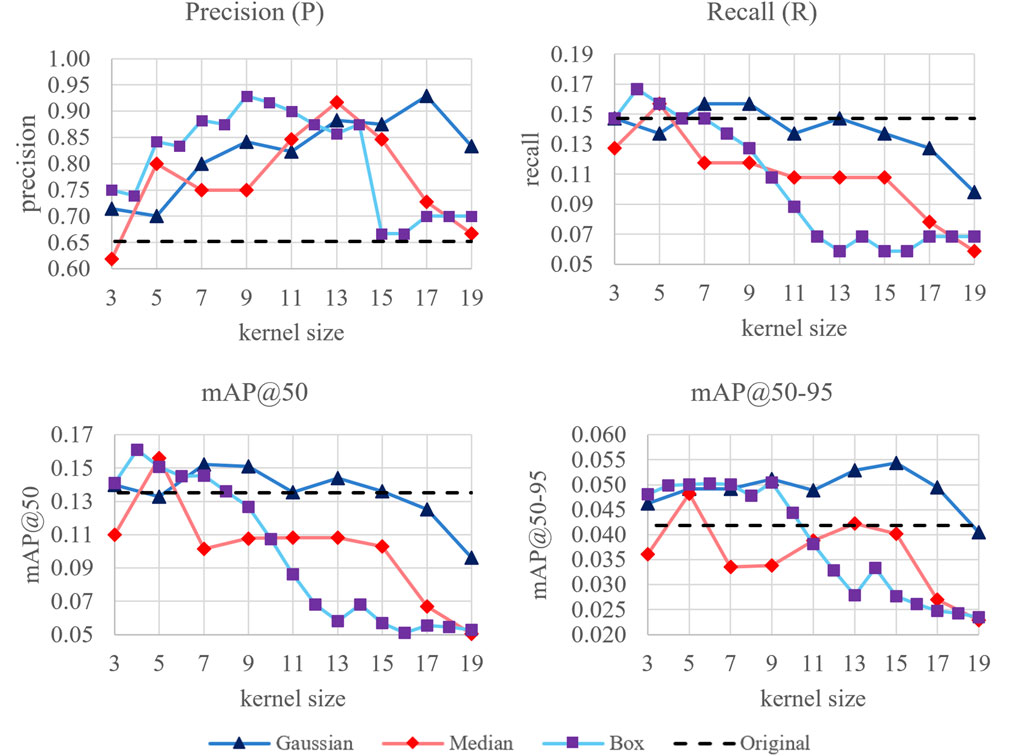
Figure 5. Effects of the tested blurs and kernel sizes on the standard indicators.
As case C exhibits disproportionately small object sizes relative to the image implementing the double tiling 10 + 12 was tested to further enhance the detection performance of the model. (Figure 6). The pipeline is as follows: (i) blur the entire frame (Figures 7A,B); (ii) apply two tiling configurations to the blurred frame and analyze each tile separately (Figures 7C,D; detections on the original full frame are shown in Figure 7E); and (iii) merge the two detection sets using an IoU-based matching rule (Figure 7F). This approach typically increases detections in vegetated areas and for small objects; however, it does not guarantee recovery of all items visible in the unprocessed frame, nor of all items previously detected on the original frame (compare Figures 7E,F).
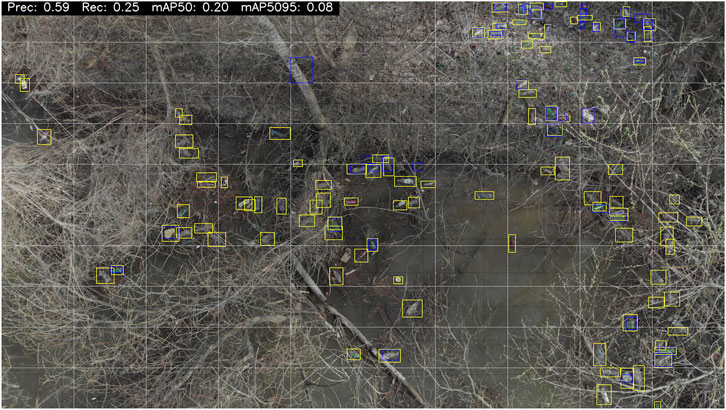
Figure 6. Detections (blue) and GT (yellow) with blur filter Median 5 and tiling 10 + 12.
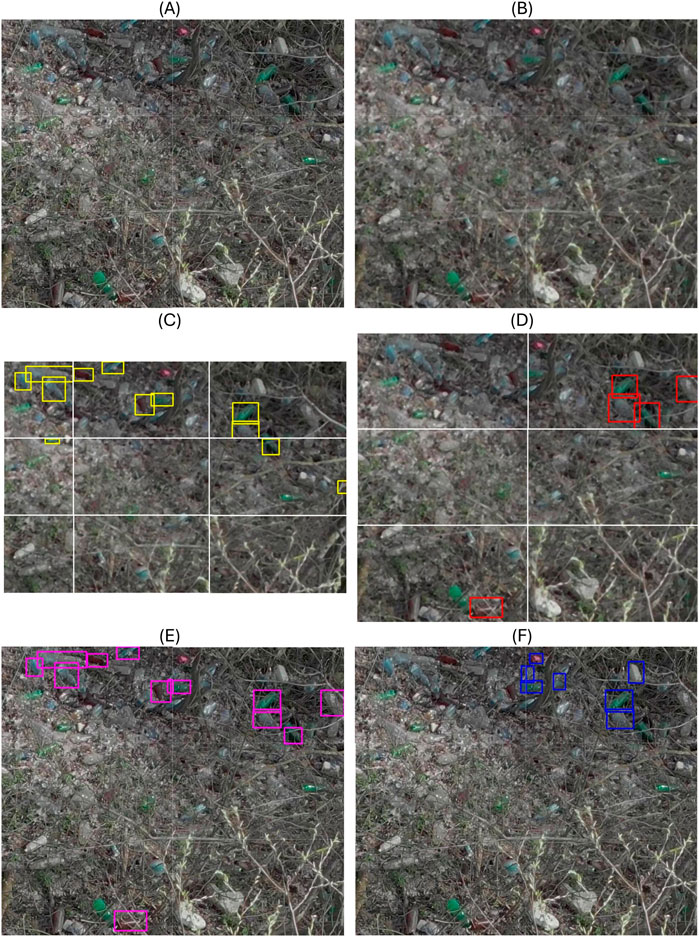
Figure 7. Processing pipeline for UAV footage with dense, obscuring vegetation. (A) Unaltered frame cropped from Case C. (B) Median-blurred frame (kernel size = 5). (C) Detections on the original full frame; corresponding detections overlaid in blue on the cropped image. (D) Detections on the blurred, tiled image (tile size = 10); tile borders in white and detections in red. (E) Detections on the blurred, tiled image (tile size = 12); tile borders in white and detections in yellow. (F) Merged detections on the blurred, double-tiled image (tile sizes 10 and 12); detections in magenta overlaid on the original cropped image.
Applying median blurring with a kernel size of 5 resulted in an improvement across all standard performance metrics. When both enhancement techniques, median blurring and tiling, were applied simultaneously, a notable increase was observed in R, mAP@50, and mAP@50–95. However, P decreased, falling even below the level observed on the raw, unprocessed image (Table 6). Although this reduction in P suggests an increase in false detections relative to the GT, manual inspection revealed that several of the resulting FN detections were in fact valid plastic pollutants that had not been annotated. These included objects that were present in the scene but were omitted from the GT due to factors such as low visibility, partial occlusion, or visual ambiguity.
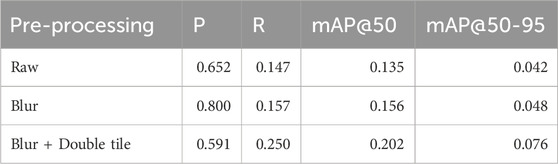
Table 6. Standard indicators of enhancement on case C.
Case C was analyzed using both enhancement methods previously tested on the representative frame (Supplementary Video S6). The model continued to exhibit limited detection performance in areas with dense vegetation, where object visibility was substantially reduced. However, with the application of the enhancement techniques, the number of detected plastic objects increased markedly: 163 detections were recorded, compared to only 16 in the unprocessed (raw) version of the video (Supplementary Video S3).
4 Discussion
4.1 Interpretation of validation metrics in the context of related work
During training, only Model B exhibited signs of overfitting, indicating that it had reached the limits of the training dataset under the given hyperparameter configuration. In contrast, the other two models, trained with input images at half the resolution, demonstrated stagnating validation performance but did not overfit, suggesting that the small object detection challenge persists at the dataset level. While Model B achieved the highest R, its P was slightly lower than that of Model C (Table 3). The overall performance of Models B and C was comparable; however, Model C showed better generalization capabilities. It is likely that Model C could have outperformed Model B if trained on images of the same resolution. However, hardware limitations prevented training with such high-resolution inputs, as this would have resulted in a batch size of only six, potentially leading to noisy gradient estimates and unstable convergence due to gradient oscillations. In its current form, Model C also exhibited significantly longer inference times (1.5–2× slower) compared to Model B, without yielding a substantial improvement in detection performance. Given its higher computational demands, Model C may also be less suitable for practical deployment.
As shown in Table 7, the performance of our model is lower than that of most other approaches in similar environment, which aligns with expectations. The primary objective of this study is to enable real-time analysis on cost-effective hardware platforms. Consequently, large-scale architectures such as YOLOv5x (86.7 million parameters), VGG19 (143.7 million parameters), and Inception-ResNet-v2 (55.9 million parameters), used in the referenced studies, are not suitable for the intended application. In contrast, the most comparable models, typically belonging to the YOLOv5s/m or YOLOv8s/m family, demonstrate superior performance, but are trained on substantially larger datasets. This highlights the potential for performance improvement through the collection of additional training images.
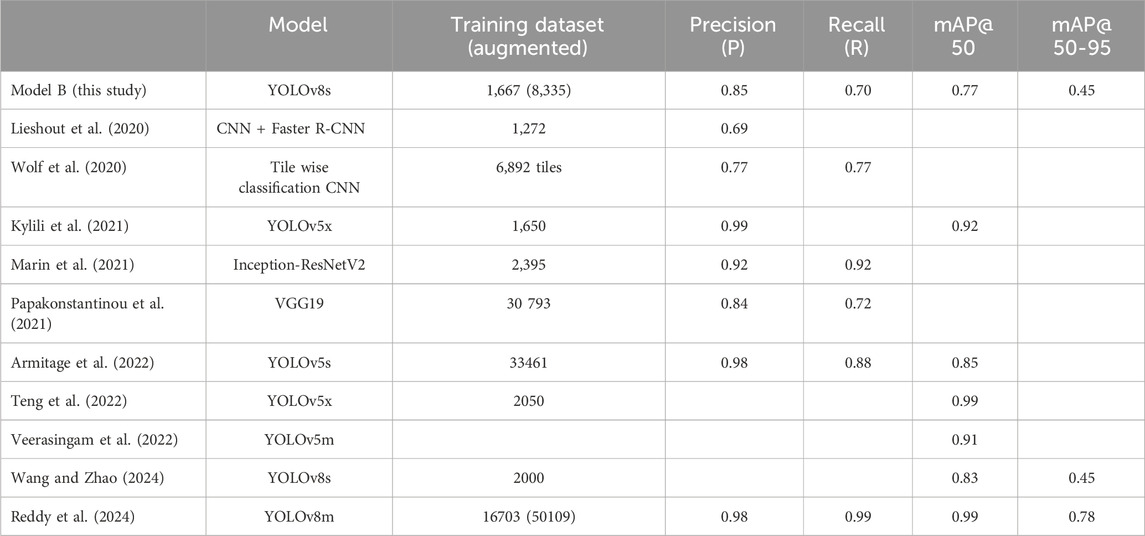
Table 7. Performance of model B in comparison with related work, for training data the whole dataset is indicated regardless of its allocation for training, testing and validation, for multi class detection works the average mAP is indicated.
Although the model developed in this study currently lags behind in detection accuracy, it represents a solid foundation for a scalable, real-time monitoring system. Its deployment in continuous field measurements can facilitate the accumulation of large quantities of new training data. Furthermore, the inference results of the current model may be used as a basis for semi-automatic annotation, where human annotators are required only to correct model predictions rather than label scenes from scratch, thereby significantly accelerating dataset expansion.
4.2 Reflection on dataset limitations
Although the present dataset is modest and geographically concentrated, several factors support transferability of the approach. Macroplastic bottles—the primary target class here—exhibit consistent visual characteristics worldwide and are widely reported as a prevalent component of riverine litter, making them useful indicators of pollution levels (van Calcar and van Emmerik, 2019; González-Fernández et al., 2021; Hurley et al., 2023; Cowger et al., 2024). Background appearance, including bank texture, water color, and turbidity, is typically secondary to object shape and color for the detector, and in our study cases turbidity already limited observations to surface-floating items, which aligns with the intrinsic scope of image-based monitoring. In practice, the authors expect reasonable out-of-region performance with light fine-tuning on a small local set.
Despite being trained on a modest and geographically limited dataset, the model performs reliably across diverse settings, providing a practical base for field deployment and for collecting additional training data and enabling semi-automated pre-annotation, ultimately supporting the training of site-specific and more advanced models.
At the same time, several site-specific factors can constrain performance and should be acknowledged. Optical water properties and illumination (for example suspended sediment, algal films, sunglint) can reduce object–background contrast and thus effective detectability (Kataoka and Nihei, 2020; Garcia-Garin et al., 2021; Salgado-Hernanz et al., 2021). Camera geometry and optics also matter: field of view, focal length, altitude or stand-off distance, and frame rate jointly determine ground sampling distance and motion blur, which in turn set the minimum reliably detectable object size (Lieshout et al., 2020; Geraeds et al., 2019; Yang et al., 2024). Vegetation and debris introduce occlusions and clutter that degrade counting and tracking (Hurley et al., 2023; de Vries et al., 2021). These considerations reinforce the value of local calibration and modest fine-tuning, as well as careful station siting and camera configuration, when transferring the approach to new rivers or hydrological settings.
4.3 Performance evaluation on primary deployment: pontoon-mounted camera
In the simulated pollution scenario (Case A), the model demonstrated adequate performance in detecting floating macroplastic objects. However, the simulation lacked one important aspect: the absence of biotic debris, which is typically abundant during flood events. Under real-world conditions, driftwood often accumulates above pontoons, forming debris traps that also capture plastic waste. In such environments, accurate re-identification becomes critical, particularly for objects that remain in the field of view of the camera over multiple days, to avoid duplicate detections and erroneous counting. Furthermore, objects may intermittently disappear and reappear in the frame due to occlusion by debris. To mitigate this issue, it is recommended to position cameras in locations less prone to the accumulation of floating debris.
The detection capabilities of the current model do not cover the full range of macroplastic pollutants. Specifically, its performance is limited to objects of approximately plastic bottle size or larger; significantly smaller items often remain undetected. Bottles are a good indicator of plastic pollution. Despite this limitation, the model in its current configuration is well suited for deployment in real-time monitoring applications. Importantly, it enables the collection of large volumes of image data under realistic field conditions. These data, when used for iterative model refinement and re-training, particularly through semi-automated annotation workflows, can support the development of more accurate detection models in future research.
Case A simulated continuous leakage via staged releases and therefore did not capture the full complexity of flood-borne debris such as driftwood, algal mats, and mixed organic rafts. These conditions introduce severe occlusions, clutter, and color–texture ambiguity that can degrade both detection and re-identification. Even so, results from the Bodrog floodplain (Figure 2) show that the model can detect plastic items under challenging field conditions, including partial coverage and discoloration. To improve robustness under flood conditions, the authors will prioritize site-specific fine-tuning on additional real flood imagery from the deployment locations and apply targeted pre-processing, notably median blurring and if necessary tiling, to mitigate occlusions and enhance small-object sensitivity.
4.4 Proposed monitoring system configurations
The proposed model is suitable for integration into a large-scale detection and quantification network for monitoring and early warning applications. Due to its relatively low computational requirements, the model can be executed locally at each monitoring station, allowing for on-site processing. In this configuration, only the processed results or summary data need to be transmitted to a central server via the internet. A typical deployment setup consists of an IP camera, a compact processing unit equipped with a low-power GPU, and a router to enable data transmission.
A major limitation of this approach is the need for multiple physical devices to be installed at each site, which increases system vulnerability and power consumption. However, it also offers significant advantages: the system does not rely on high-bandwidth internet connectivity, making it feasible for remote or infrastructure-limited locations. Furthermore, the network is highly scalable, as new monitoring nodes can be added with minimal modifications to the overall system architecture.
An alternative system configuration is enabled by the lightweight nature of the presented model. When executed on a sufficiently powerful GPU, the model can run multiple inference threads in parallel, allowing for the simultaneous analysis of video streams from several IP cameras. In this architecture, only the IP cameras and basic networking equipment (e.g., routers) need to be deployed at the monitoring sites, while all processing is performed centrally. This reduces the number of on-site components, thereby decreasing system vulnerability and energy demand.
However, the viability of this configuration depends on the availability of a stable high-bandwidth internet connection between the monitoring site and the central processing server. One of the key advantages of this approach is its compatibility with low-power infrastructure: due to the minimal on-site energy requirements, such systems can be powered by solar panels and batteries, making them suitable for deployment in remote or off-grid environments.
The centrally processed system is not linearly scalable in terms of cost. Once the processing capacity of the central server is reached, additional computing units must be introduced, each representing a significant investment. However, these units offer comparable processing throughput to their predecessors. To maximize resource efficiency, it is advisable to scale the system by acquiring and integrating additional IP cameras concurrently with the deployment of new processing units.
The two system architectures can be combined within a single network by selecting the most suitable on-site configuration for each deployment environment (Figure 8). This hybrid approach increases the overall flexibility of the monitoring system, allowing it to adapt to varying infrastructural and environmental constraints. Stations designed for centralized processing are generally well suited to solar power if the solar panel and battery are sized appropriately. On-site inference draws more power and is less favorable for solar-only operation.
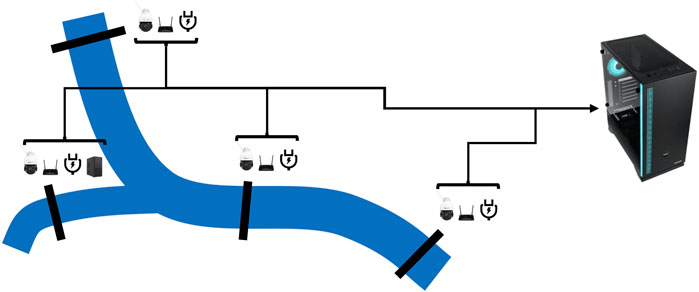
Figure 8. Monitoring system proposal with hybrid (on site and centralized) analysis.
To support deployment planning, the authors provide indicative per-station costs (2025 EUR). For centralized processing (edge-light), typical components include a PTZ camera with optical zoom and infrared capability (€300–800), a router (€50–100), and off-grid infrastructure (solar panels, batteries, enclosure, mounting) at about €1,250. Total capital cost is approximately €1,000 where grid power is available and approximately €2,000 for off-grid sites. For on-site processing (edge-heavy), add a mini-PC with a Jetson Orin NX 8 GB (about €800); in this configuration, total cost is approximately €2,000 with grid power and higher for off-grid deployments owing to the larger power system required.
To ensure station weatherproofing and flood resilience, deployments should address ingress protection, thermal management, and siting relative to local high-water marks. The authors recommend IP66-rated outdoor cameras, with ancillary electronics housed in weatherproof enclosures that provide adequate ventilation for GPU heat. Flood resilience is achieved primarily through careful placement, for example on high banks, on bridge structures, or on floating pontoons designed to remain above anticipated flood levels, with cables and connectors positioned above crest elevations where feasible.
4.5 Model performance in challenging UAV deployments
Although the primary objective of the model is its integration into the previously described monitoring system, its deployability was also evaluated using pre-recorded UAV footage under moderate (Case C) and heavy (Case B) pollution conditions. The goal in these scenarios was to provide a rough estimation of plastic pollution levels. However, the model struggled to perform both detection and tracking tasks in these environments, largely due to the small relative size of the target objects and the presence of dense vegetation. As a result, detection performance on the raw footage was insufficient to yield even a coarse estimate of pollution levels.
To address the issue of small relative object sizes in Case B, both single- and double-tiling methods were applied to increase the apparent size of objects within each analyzed region, thereby enhancing the detection and quantification capabilities of the model. Without any tiling, the model detected 80 plastic pollutants, though this count included multiple detections of the same objects due to faulty re-identification. With single tiling, the count increased to 2,610, and with double tiling to 3,633; however, both configurations still suffered from repeated detections of individual objects caused by inadequate object re-identification.
Despite the substantial increase in detection count, the totals still underestimated the true number of macroplastic items in the footage. The high object density degraded performance by reducing foreground–background separability, making bounding-box detection less reliable.
In such scenes, segmentation (Kylili et al., 2021; Lieshout et al., 2020; Shinichiro and Morita, 2020) or tile-wise classification (Gonçalves et al., 2020; Pinto et al., 2021; Wolf et al., 2020) can yield more stable abundance estimates by measuring area coverage or density rather than counting discrete items. These alternatives require well-annotated training data with explicit definitions of object density for dense fields and will be explored in future work to clarify operating envelopes and error trade-offs.
To mitigate the effect of occluding vegetation in Case C, a blurring pre-processing step was introduced to reduce the visual noise caused by small overhanging branches that overlapped with macroplastic pollutants. The performance of the model improved slightly when blurring was applied alone. However, when combined with double tiling, a more substantial increase in performance was observed. Although P decreased with the combined pre-processing approach, manual inspection revealed that several of the resulting false detections corresponded to macroplastic pollutants that were present in the image but had not been recognized by the annotator and were thus absent from the GT. This observation highlights the inherent complexity of the detection task in such environments.
4.6 Recommendations for image acquisition: fixed-camera and UAV perspectives
For optimal placement of pontoon-, bank-, or bridge-mounted cameras to maximize the usefulness of video streams and training image quality, the following considerations are recommended. First, the model is unable to reliably detect objects located far from the camera; therefore, it is preferable to cover a shorter section of the river at close range rather than a longer stretch aligned parallel to the riverbank. Second, to minimize the risk of multiple counting due to object entrapment within the field of view of the camera, areas that are prone to accumulating large quantities of debris should be avoided. Selecting locations with steady flow and minimal obstruction improves both the accuracy of estimation of macroplastic flux and the usability of the data for further training purposes.
For future UAV deployments, similar principles apply. Wide-angle views intended to capture large areas in a single overpass are generally less effective than using a narrower field of view in combination with a longer flight path over the area of interest. This strategy provides higher spatial resolution and improved object visibility, thereby enhancing detection and tracking performance therefore yielding more reliable object counts. To further improve the accuracy of object re-identification, both the UAV and its camera should move slowly and steadily. This reduces motion blur and facilitates the temporal association of object appearances across frames, supporting more consistent and accurate tracking results.
4.7 Opportunities for further development and future work
The next step in this research is the large-scale and real-world deployment of the proposed monitoring system. Such an implementation will enable the collection of data on macroplastic flux across a network of stations positioned at various cross-sections and river reaches, resulting in valuable continuous time series for studying macroplastic pollutant transport processes. A widespread monitoring network can also support pollution mitigation and damage control by issuing real-time alerts when high pollution levels are detected.
In addition to its operational benefits, continuous large-scale deployment will facilitate the development of a substantial, specialized image dataset which supports the training of more accurate and robust detection models. Since each monitoring station would collect data under its own specific environmental and visual conditions, it will be possible to further enhance detection and quantification performance at the local level by training station-specific models.
A key objective is to integrate detection outputs with environmental drivers to move from monitoring to prediction. The authors envisage a workflow in which station-level time series (e.g., item per day) are time-synchronized and analyzed alongside hydrological and meteorological variables such as discharge, stage, and antecedent rainfall over the contributing watershed. In practice, this involves (i) computing lagged cross-correlations between detection time series and hydro-meteorological records to identify response times and thresholds, (ii) fitting lightweight predictive models—such as ARIMA with exogenous inputs, random forest, or neural networks—to nowcast and forecast pollution pulses, and (iii) exploiting spatiotemporal patterns across the station network to infer transport and retention between reaches. Pilot correlations will become feasible once sufficient continuous observations have been accumulated. The present paper focuses on the operational concept; the outlined analyses indicate how the networked design can evolve into predictive, decision-support tools as longer time series become available.
In addition, incorporating hydrodynamic modeling alongside the station network can strengthen interpretation of transport processes, help identify likely accumulation points along the reach, and provide short-term forecasts under changing discharge and stage conditions (Fleit et al., 2023). Even simple 1D/2D hydraulic fields or particle-tracking surrogates can be coupled with detections to guide station siting and intervention planning.
4.8 Our contribution to the field
Our contribution is twofold: (i) the authors defined a measurement architecture, including decentralized and centralized processing pathways, needed to operate real-time detection reliably and affordably; and (ii) the authors demonstrated methods that raise recall in difficult scenes by pre-processing inputs, while maintaining runtime suitable for low-power GPUs. Importantly, the networked-station concept enables longitudinal tracking of pollution signals, supports intervention planning (e.g., targeted cleanup logistics), and provides a foundation for river-system early-warning services.
5 Conclusion
This study presented a lightweight, real-time macroplastic detection system designed for continuous river monitoring using video streams from fixed or mobile cameras. The core detection model, based on the YOLOv8 architecture, demonstrated acceptable performance under controlled conditions and showed potential for field deployment with further enhancements.
Through a series of tests involving different environmental settings and video characteristics, the study explored challenges such as small object size, occlusions by vegetation, and faulty re-identification. Pre-processing techniques, namely tiling and blurring, were evaluated to address these issues, and their combination led to marked improvements in recall and detection robustness, albeit with a decrease in P due to ground truth limitations.
The proposed system is suitable for integration into a scalable monitoring network, offering both centralized and decentralized processing configurations. Its lightweight nature enables on-site analysis or multi-stream centralized processing, depending on infrastructural constraints. Once deployed, such a system could facilitate the automated collection of large, diverse image datasets, supporting iterative model improvement through semi-automated annotation.
Ultimately, the framework lays the foundation for generating high-resolution macroplastic flux data across different river sections or entire river systems and time scales. When combined with hydrological and meteorological datasets, this information can support the development of predictive models and early warning systems, contributing to improved understanding and mitigation of plastic pollution in freshwater systems.
In summary, the novelty of this work is an operational, scalable framework for real-time macroplastic monitoring that advances field readiness from single cameras to networked deployments. Fixed, low-power stations can be rolled out as multi-site networks to provide reach-to basin-scale surveillance, while complementary UAV campaigns enable rapid assessment and hotspot identification. This architecture keeps hardware, and energy demands modest enough for widespread adoption, including by NGOs, and establishes a practical pathway toward continuous monitoring and decision support.
Data availability statement
The raw data supporting the conclusions of the article will be made available by the authors upon request.
Author contributions
GT: Data curation, Investigation, Visualization, Writing – original draft. MG-K: Project administration, Writing – review and editing. GF: Supervision, Writing – review and editing. SB: Funding acquisition, Project administration, Supervision, Writing – review and editing.
Funding
The author(s) declare that financial support was received for the research and/or publication of this article. The research was funded by the Sustainable Development and Technologies National Programme of the Hungarian Academy of Sciences (FFT NP FTA). The initial version of the plastic waste image recognition model was developed within the framework of the 2018-1.1.2-KFI-2018-00034 project funded by the Hungarian National Research, Development and Innovation Office. Used with the permission of the project beneficiary. This research has also received funding from the European Union’s Horizon Europe research and innovation programme under grant agreement No. 101157360 (iNNO SED–iNNOvative SEDiment management in the Danube River Basin). The project supported by the Doctoral Excellence Fellowship Programme (DCEP) is funded by the National Research Development and Innovation Fund of the Ministry of Culture and Innovation and the Budapest University of Technology and Economics.
Acknowledgments
Parts of this work were previously presented in preliminary form at (Tikász et al., 2024). The present study includes substantial extensions and further results. The full scope of the research is documented in the first author’s Master thesis (Tikász, 2025). The authors acknowledge the enthusiastic volunteers and crew of Plastic Cup Society for providing pictures and videos from the rivers affected by plastic pollution. For development purposes, For development purposes, ChatGPT-4 by OpenAI was used primarily to support coding tasks. For writing, For writing, DeepL Write and ChatGPT-4 were used to assist with language and stylistic editing. All content generated with the help of generative AI tools was reviewed and verified by the authors.
Conflict of interest
The authors declare that the research was conducted in the absence of any commercial or financial relationships that could be construed as a potential conflict of interest.
Generative AI statement
The author(s) declare that Generative AI was used in the creation of this manuscript. For development purposes, ChatGPT-4 by OpenAI was used primarily to support coding tasks. For writing, DeepL Write and ChatGPT-4 were used to assist with language and stylistic editing. All content generated with the help of generative AI tools was reviewed and verified by the authors.
Any alternative text (alt text) provided alongside figures in this article has been generated by Frontiers with the support of artificial intelligence and reasonable efforts have been made to ensure accuracy, including review by the authors wherever possible. If you identify any issues, please contact us.
Publisher’s note
All claims expressed in this article are solely those of the authors and do not necessarily represent those of their affiliated organizations, or those of the publisher, the editors and the reviewers. Any product that may be evaluated in this article, or claim that may be made by its manufacturer, is not guaranteed or endorsed by the publisher.
Supplementary material
The Supplementary Material for this article can be found online at: https://www.frontiersin.org/articles/10.3389/fenvs.2025.1666271/full#supplementary-material
Abbreviations
AP, Average precision; ARIMA, Autoregressive Integrated Moving Average; ARMA, Autoregressive Moving Average; BB, Bounding Box; CNN, Convolutional Neural Network; CPU, Central Processing Unit; FN, False Negative; FP, False Positive; FPS, Frames Per Second; GPU, Graphics Processing Unit; GT, Ground Truth; HD, High Definition; ID, Identification Number; IoU, Intersection over Union; IP, Internet Protocol; mAP, mean Average Precision; P, Precision; R, Recall; Rkm, River kilometer; SGD, Stochastic Gradient Descent; TP, True Positive; UAV, Unmanned Aerial Vehicles; YOLO, You Only Look Once.
References
Aharon, N., Orfaig, R., and Bobrovsky, B.-Z. (2022). BoT-SORT: robust associations multi-pedestrian tracking. arXiv Preprint. Available online at: http://arxiv.org/abs/2206.14651.
Armitage, S., Awty-Carroll, K., Clewley, D., and Martinez-Vicente, V. (2022). Detection and classification of floating plastic litter using a vessel-mounted video camera and deep learning. Remote Sens. 14 (14), 3425. doi:10.3390/rs14143425
Balamurugan, S., Kumaran, S., Sadasivuni, K., Uravakonda, V., Rao, R. B. S., and Xavier, C. S. C. (2025). Integration of deep learning in real-time monitoring and alert system for evaluating plastic pollution levels in oceanic regions. AIP Conf. Proc. 3259, 040002. doi:10.1063/5.0264289
Barnes, D. K. A., Galgani, F., Thompson, R. C., and Barlaz, M. (2009). Accumulation and fragmentation of plastic debris in global environments. Philosophical Trans. R. Soc. Lond. Ser. B 364 (1526), 1985–1998. doi:10.1098/rstb.2008.0205
Betts, K. (2008). Why small plastic particles May pose a big problem in the oceans. Environ. Sci. Technol. 42 (24), 8995. doi:10.1021/es802970v
Browne, M. A., Galloway, T., and Thompson, R. (2007). Microplastic--an emerging contaminant of potential concern?. Integr. Environ. Assess. Manag. 3 (4), 559–61. doi:10.1002/ieam.5630030412
Browne, M. A., Galloway, T. S., and Thompson, R. C. (2010). Spatial patterns of plastic debris along estuarine shorelines. Environ. Sci. Tech. 44 (9), 3404–9.
Chen, L., Li, G., Zhang, S., Mao, W., and Zhang, M. (2024). YOLO-SAG: an improved wildlife object detection algorithm based on YOLOv8n. Ecol. Inf. 83 (102791), 102791. doi:10.1016/j.ecoinf.2024.102791
Claessens, M., Meester, S. D., Landuyt, K. D., Clerck, L. V., and Janssen, C. R. (2011). Occurrence and distribution of microplastics in marine sediments along the Belgian coast. Marine Pollut. Bull. 62 (10), 2199–2204.
Cole, M., Lindeque, P., Halsband, C., and Galloway, T. S. (2011). Microplastics as contaminants in the marine environment: a review. Mar. Pollut. Bull. 62 (12), 2588–2597. doi:10.1016/j.marpolbul.2011.09.025
Cortesi, I., Masiero, A., De Giglio, M., Tucci, G., and Dubbini, M. (2021). Random forest-based river plastic detection with a handheld multispectral camera. ISPRS Int. Archives Photogrammetry Remote Sens. Spatial Inf. Sci. XLIII-B1-2021, 9–14. doi:10.5194/isprs-archives-xliii-b1-2021-9-2021
Cortesi, I., Mugnai, F., Angelini, R., and Masiero, A. (2023). Mini uav-based litter detection on river banks. ISPRS Ann. Photogrammetry Remote Sens. Spatial Inf. Sci. X-4/W1-2022, 117–122. doi:10.5194/isprs-annals-x-4-w1-2022-117-2023
Cowger, W., Willis, K. A., Bullock, S., Conlon, K., Emmanuel, J., Erdle, L. M., et al. (2024). Global producer responsibility for plastic pollution. Sci. Adv. 10 (17), eadj8275. doi:10.1126/sciadv.adj8275
Crosti, R., Arcangeli, A., Campana, I., Paraboschi, M., and González-Fernández, D. (2018). ‘Down to the river’: amount, composition, and economic sector of litter entering the marine compartment, through the tiber River in the Western Mediterranean Sea. Rendiconti Lincei. Sci. Fis. Nat. 29 (4), 859–866. doi:10.1007/s12210-018-0747-y
de Vries, R., Egger, M., Mani, T., and Lebreton, L. (2021). Quantifying floating plastic debris at sea using vessel-based optical data and artificial intelligence. Remote Sens. 13 (17), 3401. doi:10.3390/rs13173401
Di, J., Xi, K., and Yang, Y. (2025). An enhanced YOLOv8 model for accurate detection of solid floating waste. Sci. Rep. 15 (1), 25015. doi:10.1038/s41598-025-10163-2
Fleit, G., Nagy, T., Málnás, A. K., Husztik, D., Ilcsik, C., Molnár, A. D., et al. (2023). Coupled field and numerical analysis of riverine macroplastic. In: Proceedings of the 40th IAHR world congress. Rivers, connecting Mountains and coasts. 40th IAHR world congress–“rivers connecting Mountains and coasts”; Vienna, Austria. doi:10.3850/978-90-833476-1-5_iahr40wc-p0815-cd
Gallitelli, L., and Scalici, M. (2022). Riverine macroplastic gradient along watercourses: a global overview. Front. Environ. Sci. 10, 937944. doi:10.3389/fenvs.2022.937944
Garcia-Garin, O., Monleón-Getino, T., López-Brosa, P., Borrell, A., Aguilar, A., Borja-Robalino, R., et al. (2021). Automatic detection and quantification of floating marine macro-litter in aerial images: introducing a novel deep learning approach connected to a web application in R. Environ. Pollut. (Barking, Essex 1987) 273 (116490), 116490. doi:10.1016/j.envpol.2021.116490
Geraeds, M., van Emmerik, T., de Vries, R., and bin Ab Razak, M. S. (2019). Riverine plastic litter monitoring using unmanned aerial vehicles (UAVs). Remote Sens. 11 (17), 2045. doi:10.3390/rs11172045
Geyer, R., Jambeck, J. R., and Law, K. L. (2017). Production, use, and fate of all plastics ever made. Sci. Adv. 3 (7), e1700782. doi:10.1126/sciadv.1700782
Ghatkamble, R., B, P., and Pareek, P. K. (2022). YOLO network based intelligent municipal waste management in internet of things. In:2022 fourth international conference on emerging research in electronics, computer science and technology (ICERECT); 2022 December 26-27; Mandya, India: IEEE. p. 1–10.
Girshick, R. (2015). Fast R-CNN. In: 2015 IEEE international conference on computer vision (ICCV); 2015 December 07-13; Santiago, Chile: IEEE. p. 1440–1448.
Gonçalves, G., Andriolo, U., Pinto, L., and Duarte, D. (2020). Mapping marine litter with unmanned aerial systems: a showcase comparison among manual image screening and machine learning techniques. Mar. Pollut. Bull. 155 (111158), 111158. doi:10.1016/j.marpolbul.2020.111158
González-Fernández, D., and Hanke, G. (2017). Toward a harmonized approach for monitoring of riverine floating macro litter inputs to the marine environment. Front. Mar. Sci. 4 (MAR), 245955. doi:10.3389/fmars.2017.00086
González-Fernández, D., González-Fernández, D., Cózar, A., Hanke, G., Viejo, J., Morales-Caselles, C., et al. (2021). Floating macrolitter leaked from Europe into the ocean. Nat. Sustain. 4 (6), 474–483. doi:10.1038/s41893-021-00722-6
Graham, E. R., and Thompson, J. T. (2009). Deposit- and suspension-feeding sea cucumbers (Echinodermata) ingest plastic fragments. J. Exp. Mar. Biol. Ecol. 368 (1), 22–29. doi:10.1016/j.jembe.2008.09.007
Guo, X., Zhang, J., Cao, Z., Huang, H., and Luo, C. (2024). Improving the wild boar detection algorithm of YOLOv8n. In: Proceedings of the 2024 2nd international conference on frontiers of intelligent manufacturing and automation; 2024 August 9–11; Baotou China. New York, NY, USA: ACM. p. 12–17.
Haberstroh, C. J., Arias, M. E., Yin, Z., and Wang, M. C. (2021). Effects of hydrodynamics on the cross-sectional distribution and transport of plastic in an urban coastal river. Water Environ. Res. 93 (2), 186–200. doi:10.1002/wer.1386
Hanson, N., Lvov, G., and Padir, T. (2022). Occluded object detection and exposure in cluttered environments with automated hyperspectral anomaly detection. Front. Robotics AI 9, 982131. doi:10.3389/frobt.2022.982131
Hua, D., Gao, J., Mayo, R., Smedley, A., Puranik, P., and Zhan, J. (2020). Segregating hazardous waste using deep neural networks in real-time video. In: 2020 10th annual computing and communication workshop and conference (CCWC); 2020 January 6–8: IEEE. p. 1016–1022.
Hurley, R., Braaten, H. F. V., Nizzetto, L., Steindal, E. H., Lin, Y., Clayer, F., et al. (2023). Measuring riverine macroplastic: methods, harmonisation, and quality control. Water Res. 235 (119902), 119902. doi:10.1016/j.watres.2023.119902
Ilyas, M., Ahmad, W., Khan, H., Yousaf, S., Khan, K., and Nazir, S. (2018). Plastic waste as a significant threat to environment - a systematic literature review. Rev. Environ. Health 33 (4), 383–406. doi:10.1515/reveh-2017-0035
Jambeck, J. R., Geyer, R., Wilcox, C., Siegler, T. R., Perryman, M., Andrady, A., et al. (2015). Plastic waste inputs from land into the ocean. Sci. 347 (6223), 768–771. doi:10.1126/science.1260352
Jiang, L., and Wu, L. (2024). Enhanced Yolov8 network with extended kalman filter for wildlife detection and tracking in complex environments. Ecol. Inf. 84 (102856), 102856. doi:10.1016/j.ecoinf.2024.102856
Jocher, G., Chaurasia, A., and Qiu, J. (2023). Ultralytics YOLOv8 (8.0.0). [Computer software]. Available online at: https://github.com/ultralytics/ultralytics.
Kataoka, T., and Nihei, Y. (2020). Quantification of floating riverine macro-debris transport using an image processing approach. Sci. Rep. 10 (1), 2198. doi:10.1038/s41598-020-59201-1
Kos, A., Majek, K., and Belter, D. (2025). Enhanced lightweight detection of small and tiny objects in high-resolution images using object tracking-based region of interest proposal. Eng. Appl. Artif. Intell. 153 (110852), 110852. doi:10.1016/j.engappai.2025.110852
Kylili, K., Artusi, A., and Hadjistassou, C. (2021). A new paradigm for estimating the prevalence of plastic litter in the marine environment. Mar. Pollut. Bull. 173 (Pt B), 113127. doi:10.1016/j.marpolbul.2021.113127
Lebreton, L. C. M., van der Zwet, J., Damsteeg, J.-W., Slat, B., Andrady, A., and Reisser, J. (2017). River plastic emissions to the world’s oceans. Nat. Commun. 8 (1), 15611. doi:10.1038/ncomms15611
Lieshout, C., Oeveren, K., Emmerik, T., and Postma, E. (2020). Automated river plastic monitoring using deep learning and cameras. Earth Space Sci. (Hoboken, N.J.) 7 (8), e2019EA000960. doi:10.1029/2019ea000960
Lin, W. (2021). YOLO-green: a real-time classification and object detection model optimized for waste management. In: 2021 IEEE international conference on big data (big data); 2021 December 15–18; Orlando, FL, USA: IEEE. p. 51–57.
Malik, N. K. A., Manaf, L. A., Jamil, N. R., Rosli, M. H., Ash’aari, Z. H., and Adhar, A. S. M. (2020). Variation of floatable litter load and its compositions captured at floating debris boom (FDB) structure. J. Material Cycles Waste Manag. 22 (6), 1744–1767. doi:10.1007/s10163-020-01065-8
Marin, I., Mladenović, S., Gotovac, S., and Zaharija, G. (2021). Deep-feature-based approach to marine debris classification. Appl. Sci. 11 (12), 5644. doi:10.3390/app11125644
Molnár, A. D., and Hankó, G. (2022). Transnational river cleanup handguide, aquatic plastic. Budaörs, Hungary: Plastic Cup Society Self-Published.
Molnár, A. D., Málnás, K., Bőhm, S., Gyalai-Korpos, M., Cserép, M., and Kiss, T. (2024). Comparative analysis of riverine plastic pollution combining citizen science, remote sensing and water quality monitoring techniques. Sustainability 16 (12), 5040. doi:10.3390/su16125040
Moore, C. J., Lattin, G. L., and Zellers, A. F. (2011). Este artigo está disponível em. Rev. Gestão Costeira Integr. 11 (1), 65–73. doi:10.5894/rgci194
Morales-Caselles, C., Viejo, J., Martí, E., González-Fernández, D., Pragnell-Raasch, H., González-Gordillo, J. I., et al. (2021). An inshore–offshore sorting system revealed from global classification of ocean litter. Nat. Sustain. 4 (6), 484–493. doi:10.1038/s41893-021-00720-8
Munari, C., Scoponi, M., Sfriso, A. A., Sfriso, A., Aiello, J., Casoni, E., et al. (2021). Temporal variation of floatable plastic particles in the largest Italian river, the Po. Mar. Pollut. Bull. 171 (112805), 112805. doi:10.1016/j.marpolbul.2021.112805
Nayanathara Thathsarani Pilapitiya, P. G. C., and Ratnayake, A. S. (2024). The world of plastic waste: a review. Clean. Mater. 11 (100220), 100220. doi:10.1016/j.clema.2024.100220
Padilla, R., Passos, W. L., Dias, T. L. B., Netto, S. L., and da Silva, E. A. B. (2021). A comparative analysis of object detection metrics with a companion open-source toolkit. Electronics 10 (3), 279. doi:10.3390/electronics10030279
Paller, G., and Élő, G. (2022). Towards a floating plastic waste early warning system. In: Proceedings of the 11th international conference on sensor networks. Red Hook, NY: Curran Associates, Inc. p. 45–50.
Papakonstantinou, A., Batsaris, M., Spondylidis, S., and Topouzelis, K. (2021). A citizen science unmanned aerial system data acquisition protocol and deep learning techniques for the automatic detection and mapping of marine litter concentrations in the coastal zone. Drones 5 (1), 6. doi:10.3390/drones5010006
Pinto, L., Andriolo, U., and Gonçalves, G. (2021). Detecting stranded macro-litter categories on drone orthophoto by a multi-class neural network. Mar. Pollut. Bull. 169 (112594), 112594. doi:10.1016/j.marpolbul.2021.112594
Reddy, V. B. K., Basha, S. S., and Swarnalakshmi, J. (2024). Augmenting underwater plastic detection: a study with YOLO-V8m on enhanced datasets. In: 2024 3rd international conference on applied artificial intelligence and computing (ICAAIC); 2024 June 5–7: IEEE. p. 1309–1315.
Redmon, J., Divvala, S., Girshick, R., and Farhadi, A. (2015). You only look once: unified, real-time object detection. arXiv Preprint. Available online at: http://arxiv.org/abs/1506.02640. doi:10.48550/arXiv.1506.02640
Rezatofighi, H., Tsoi, N., Gwak, J., Sadeghian, A., Reid, I., and Savarese, S. (2019). Generalized intersection over union: a metric and A loss for bounding box regression. arXiv Preprint. p. 658–666. doi:10.1109/cvpr.2019.00075
Rocamora, C., Puerto, H., Abadía, R., Brugarolas, M., Martínez-Carrasco, L., and Cordero, J. (2021). Floating debris in the low segura river basin (spain): avoiding litter through the irrigation network. Water 13 (8), 1074. doi:10.3390/w13081074
Ronkay, F., Slezák, E., Gere, D., Lukács, N., Gyalai-Korpos, M., Molnár, A. D., et al. (2025). Thermoanalytical approach to assess riverine PET litter and its recycling potential. Sci. Rep. 15 (1), 15673. doi:10.1038/s41598-025-94925-y
Roy, D., Pagliara, S., and Palermo, M. (2021). Experimental analysis of structures for trapping SARS-CoV-2-related floating waste in Rivers. Water 13 (6), 771. doi:10.3390/w13060771
Salgado-Hernanz, P. M., Bauzà, J., Alomar, C., Compa, M., Romero, L., and Deudero, S. (2021). Assessment of marine litter through remote sensing: recent approaches and future goals. Mar. Pollut. Bull. 168 (112347), 112347. doi:10.1016/j.marpolbul.2021.112347
Schöneich-Argent, R. I., Dau, K., and Freund, H. (2020). Wasting the north sea? - a field-based assessment of anthropogenic macrolitter loads and emission rates of three German tributaries. Environ. Pollut. 263 (Pt B), 114367. doi:10.1016/j.envpol.2020.114367
Schreyers, L., van Emmerik, T. V., Nguyen, T. L., Castrop, E., Phung, N.-A., Kieu-le, T.-C., et al. (2021). Plastic plants: the role of water hyacinths in plastic transport in tropical Rivers. Front. Environ. Sci. 9, 686334. doi:10.3389/fenvs.2021.686334
Schreyers, L. J., van Emmerik, T. H. M., Bui, T.-K. L., Biermann, L., Uijlenhoet, R., Nguyen, H. Q., et al. (2024). Water hyacinths retain river plastics. Environ. Pollut. 356 (124118), 124118. doi:10.1016/j.envpol.2024.124118
Shinichiro, S., Morita, T., and Taneda, T. (2020). Estimation of plastic marine debris volumes on beaches using unmanned aerial vehicles and image processing based on deep learning. Mar. Pollut. Bull. 155, 111127. doi:10.1016/j.marpolbul.2020.111127
Taryono, E. O. L., Wardiatno, Y., and Mashar, A. (2020). Macroplastic distribution, abundance, and composition which flows to cimandiri Estuary, West java. IOP Conf. Ser. Earth Environ. Sci. 420 (1), 012031. doi:10.1088/1755-1315/420/1/012031
Tasseron, P., van Emmerik, T., Peller, J., Schreyers, L., and Biermann, L. (2021). Advancing floating macroplastic detection from space using experimental hyperspectral imagery. Remote Sens. 13 (12), 2335. doi:10.3390/rs13122335
Teng, C., Kylili, K., and Hadjistassou, C. (2022). Deploying deep learning to estimate the abundance of marine debris from video footage. Mar. Pollut. Bull. 183 (114049), 114049. doi:10.1016/j.marpolbul.2022.114049
Tikász, G. (2025). Image-Based Detection of Macroplastics in Riverine Environments Using Deep Learning. Budapest, Hungary. Budapest University of Technology and Economics. [Master Thesis].
Tikász, G., Baranya, S., and Gyalai-Korpos, M. (2024). Folyami makroműanyag szennyezők detektálásaképalapú mesterséges intelligenciával. In: Országos vándorgyűlés dolgozatai. A Magy. Hidrológiai Társaság Által Rendezett XLI. (Budapest: Magyar Hirdológiai Társaság).
Ultralytics (2023). YOLOv8. Frederick, MD: Ultralytics. Available online at: https://docs.ultralytics.com/models/yolov8/#performance-metrics (Accessed September 14, 2025).
van Calcar, C. J., and van Emmerik, T. H. M. (2019). Abundance of plastic debris across European and Asian Rivers. Environ. Res. Lett. 14 (12), 124051. doi:10.1088/1748-9326/ab5468
van Emmerik, T., Kieu-Le, T.-C., Loozen, M., van Oeveren, K., Strady, E., Bui, X.-T., et al. (2018). A methodology to characterize riverine macroplastic emission into the ocean. Front. Mar. Sci. 5 (OCT), 372. doi:10.3389/fmars.2018.00372
van Emmerik, T., Loozen, M., van Oeveren, K., Buschman, F., and Prinsen, G. (2019a). Riverine plastic emission from jakarta into the ocean. Environ. Res. Lett. 14 (8), 084033. doi:10.1088/1748-9326/ab30e8
van Emmerik, T., Strady, E., Kieu-Le, T.-C., Nguyen, L., and Gratiot, N. (2019b). Seasonality of riverine macroplastic transport. Sci. Rep. 9 (1), 13549. doi:10.1038/s41598-019-50096-1
van Emmerik, T., van Klaveren, J., Meijer, L. J. J., Krooshof, J. W., Palmos, D. A. A., and Tanchuling, M. A. (2020). Manila river mouths act as temporary sinks for macroplastic pollution. Front. Mar. Sci. 7, 545812. doi:10.3389/fmars.2020.545812
Veerasingam, S., Chatting, M., Asim, F. S., Al-Khayat, J., and Vethamony, P. (2022). Detection and assessment of marine litter in an uninhabited island, arabian gulf: a case study with conventional and machine learning approaches. Sci. Total Environ. 838 (Pt 2), 156064. doi:10.1016/j.scitotenv.2022.156064
Wang, J., and Zhao, H. (2024). Improved YOLOv8 algorithm for water surface object detection. Sensors 24 (15), 5059. doi:10.3390/s24155059
Wang, T., Ren, S., and Zhang, H. (2024). Nighttime wildlife object detection based on YOLOv8-night. Electron. Lett. 60 (15), e13305. doi:10.1049/ell2.13305
Wolf, M., van den Berg, K., Garaba, S. P., Gnann, N., Sattler, K., Stahl, F., et al. (2020). Machine learning for aquatic plastic litter detection, classification and quantification (APLASTIC-Q). Environ. Res. Lett. 15 (11), 114042. doi:10.1088/1748-9326/abbd01
Yang, C., Cao, Y., and Lu, X. (2024). Towards better small object detection in UAV scenes: aggregating more object-oriented information. Pattern Recognit. Lett. 182, 24–30. doi:10.1016/j.patrec.2024.04.002
Yang, X., Chen, Y., Zhou, Y., and Tong, F. (2025). A three-dimensional marine plastic litter real-time detection embedded system based on deep learning. Mar. Pollut. Bull. 213 (117603), 117603. doi:10.1016/j.marpolbul.2025.117603
Yoshihara, S., Fukiage, T., and Nishida, S. (2023). Does training with blurred images bring convolutional neural networks closer to humans with respect to robust object recognition and internal representations? Front. Psychol. 14, 1047694. doi:10.3389/fpsyg.2023.1047694
Zhang, Y., and Wu, G. (2025). YOLOv8n-BWG-Enhanced drone smoke detection: advancing environmental monitoring efficiency. PloS One 20 (5), e0322448. doi:10.1371/journal.pone.0322448
Zhu, W., and Xu, R. (2025). Research on an improved YOLOv8 algorithm for water surface object detection. Electronics 14 (18), 3615. doi:10.3390/electronics14183615
Keywords: macroplastic detection, YOLOv8, real-time monitoring, fixed-camera surveillance, riverine plastic pollution, low-power hardware deployment, pollution quantification
Citation: Tikász G, Gyalai-Korpos M, Fleit G and Baranya S (2025) Real-time detection of macroplastic pollution in inland waters: development of a lightweight image recognition system. Front. Environ. Sci. 13:1666271. doi: 10.3389/fenvs.2025.1666271
Received: 15 July 2025; Accepted: 24 September 2025;
Published: 21 October 2025.
Edited by:
Yong Q. Tian, Central Michigan University, United StatesReviewed by:
Veerasingam S., Qatar University, QatarMonica Moroni, DICEA-Sapienza University of Rome, Italy
Copyright © 2025 Tikász, Gyalai-Korpos, Fleit and Baranya. This is an open-access article distributed under the terms of the Creative Commons Attribution License (CC BY). The use, distribution or reproduction in other forums is permitted, provided the original author(s) and the copyright owner(s) are credited and that the original publication in this journal is cited, in accordance with accepted academic practice. No use, distribution or reproduction is permitted which does not comply with these terms.
*Correspondence: Gergely Tikász, dGlrYXN6LmdlcmdlbHlAZWR1LmJtZS5odQ==