 Yandi Hu
 Yingda Xu
- School of Law, Huazhong University of Science and Technology, Wuhan, Hubei, China
Background: With the rapid acceleration of urbanization in China, issues related to urban appearance and public environmental sanitation have become increasingly prominent, and the effectiveness and scientific rigor of relevant policies have attracted widespread attention. Given that China’s governance experience serves as a key reference for developing countries, the quantitative evaluation of these policies holds significant theoretical and practical significance.
Methods: This study aims to conduct a comprehensive analysis, spanning from semantic mining of policy texts in the quantitative assessment, by integrating the Latent Dirichlet Allocation (LDA) and Policy Modeling Consistency (PMC) methods. This approach provides a scientific tool for optimizing urban appearance and public environmental sanitation policies. First, the LDA model was applied to extract themes from policy texts of 159 cities, identifying five core themes: public management tools, governance of citizens’ behaviors, supporting measures, participating subjects, and policy targets. Subsequently, a PMC evaluation system, comprising 9 primary variables and 31 secondary variables, was developed to assign quantitative scores and conduct a visual analysis of policies in 9 representative provinces.
Results: The results showed that policy quality exhibited a “ladder-like disparity aligned with regional economic levels”: policies in international metropolises and economically vibrant regions mainly were of high quality (with scores ranging from 5.5 to 7.5), while those in less developed areas were generally of low quality (with all scores below 4.5), with a correlation coefficient of 0.82 (p<0.01) between policy quality and regional economic level. Meanwhile, the policy structure was characterized by four imbalances: prioritizing institutional frameworks over implementation details, hardware construction over ideological guidance, long-term planning over short-to-medium-term alignment, and administrative management over public participation.
Conclusion: The study indicates that the quality of urban appearance and environmental sanitation policies is significantly correlated with regional economic development, but constrained by structural imbalances. The integrated LDA-PMC approach can effectively support the full-chain analysis of policy texts. In the future, efforts should focus on enhancing inter-regional policy coordination, improving implementation safeguards, refining public participation mechanisms, and establishing a dynamic policy revision system to adapt to the development needs of new-type urbanization.
1 Introduction
Since the adoption of the New Urban Agenda, fostering a better and more sustainable future has emerged as a universal aspiration across nations. The international community widely recognizes that well-planned and managed urbanization serves as a robust catalyst for sustainable development, in both developing and developed economies. It enables citizens to partake equitably in the dividends of urban growth and thrive in environments that are clean, orderly, and aesthetically pleasing (Kenneth and Peter, 2018). As one of the world’s most dynamically developing economies, China’s practices in urban appearance governance and public environmental sanitation management have garnered substantial global attention. Its accumulated experiences and encountered challenges hold valuable referential significance for other countries, particularly those in the developing world.
With the accelerating pace of urbanization, Chinese cities have undergone unprecedented expansion in scale and population, rendering issues about urban appearance and environmental sanitation increasingly salient. These issues are not merely matters of a city’s image and quality; they directly impact residents’ quality of life and health outcomes (Wenting et al., 2021). A well-maintained urban environment enhances a city’s attractiveness and competitive edge, stimulates economic vitality, and mirrors its level of civic advancement and administrative efficacy (Sruthi and Mohammed, 2020). Nevertheless, prevailing challenges persist, such as overwhelming pressure from waste disposal, acute environmental pollution, and disorderly urban operations. These predicaments not only compromise urban aesthetics and cleanliness but also pose tangible threats to residents’ livelihoods and wellbeing.
To address these pressing issues, the Chinese government has implemented a series of policies and regulatory frameworks that encompass urban planning, infrastructure development, and day-to-day management. While these policy initiatives have led to incremental improvements in urban appearance and sanitation, implementation gaps persist, including inadequate policy enforcement and deficient inter-agency coordination (Ming et al., 2024). Consequently, analyzing the effectiveness and limitations inherent in China’s urban appearance and environmental sanitation policies is pivotal for distilling generalizable policy principles and recommendations, thereby contributing to the enhancement of urban governance efficacy.
Against this contextual backdrop, the present study employs an integrated Latent Dirichlet Allocation-Policy Modeling Consistency (LDA-PMC) methodology to undertake an in-depth investigation of China’s urban appearance and environmental sanitation policies. LDA, a sophisticated topic modeling technique, facilitates the automatic extraction of latent thematic constructs from large-scale text corpora (Blei et al., 2003). Applying LDA to policy documents enables the identification of core thematic domains—such as waste management systems, pollution remediation strategies, and urban greening initiatives—which subsequently serve as foundational variables for the PMC index evaluation framework. The PMC approach, a structured policy modeling tool (Gong et al., 2025), facilitates the visual analysis of policy components, including objectives, operational measures, and stakeholder engagement. The integration of LDA and PMC fosters a comprehensive understanding of policy nuances and implementation mechanisms. LDA provides an empirical basis for variable identification and PMC framework construction, while PMC enhances the analytical reach of LDA through intuitive three-dimensional visualization.
In terms of data collection, this study curated a comprehensive corpus of policy texts related to urban appearance and environmental sanitation from 159 Chinese cities, encompassing legislative documents, government circulars, and master planning schemes. These texts underwent rigorous preprocessing utilizing natural language processing techniques, including word segmentation, stop-word elimination, and lemmatization, to enhance data integrity and usability. The preprocessed texts were then subjected to LDA modeling to extract overarching policy themes, which were subsequently operationalized as core variables within the PMC index evaluation system. Drawing on existing scholarly research, this evaluation system was expanded to incorporate nine primary variables and thirty-one secondary variables. Finally, a focused analysis was conducted on nine representative policy texts, with policy modeling canvases constructed to delineate their constituent elements and structural configurations visually.
The innovative contributions of this study are twofold. Methodologically, it pioneers the integration of LDA topic modeling with the PMC policy framework to conduct quantitative analysis and visual representation of urban appearance and environmental sanitation policies. This hybrid approach transcends the limitations of single-methodological analyses, offering novel analytical perspectives and tools for policy research. Perspectively, it adopts a content-centric approach to systematically examine urban appearance and environmental sanitation policies, comprehensively uncovering the quality of policy content, thematic structures, and implementation outcomes. This addresses the oversight in previous studies that prioritized practical efficacy while neglecting institutional text analysis, thereby providing more targeted recommendations for policy refinement and optimization.
Theoretically, this study enriches and expands the methodological repertoire for policy research in urban management. Prior studies have predominantly relied on qualitative analytical approaches or singular quantitative methods, resulting in analyses that lack depth and systemic rigor. By introducing the LDA-PMC integrated approach into the realm of urban appearance and environmental sanitation policy research, this study offers a fresh perspective and analytical toolkit, facilitating the advancement of scientific and refined policy research in urban management. Practically, the findings of this study can provide evidence-based guidance for government authorities in formulating and enhancing urban appearance and environmental sanitation policies. Through a rigorous analysis of policy texts, this research identifies existing policy deficiencies and shortcomings, proffers targeted improvement strategies, and endeavors to enhance policy effectiveness and operational feasibility. Ultimately, this contributes to the continuous improvement of urban appearance and environmental sanitation, elevates residents’ quality of life and sense of happiness, and propels urban sustainable development.
2 Research foundation and literature review
2.1 Current status of policy texts
2.1.1 Evolution of urban appearance and environmental sanitation policies in China
The evolution of China’s urban appearance and environmental sanitation policies is closely intertwined with the country’s economic and social development, undergoing a process from initial exploration to gradual refinement. It can be roughly divided into the following stages:
From the reform and opening-up to the end of the 20th century (1978–2000): Following the reform and opening-up, China’s rapid economic growth and accelerating urbanization led to expanding city scales and a surge in population, making urban appearance and environmental sanitation issues increasingly prominent. During this stage, policies focused on strengthening urban ecological sanitation management, improving sanitation infrastructure, and enhancing urban environmental quality. In 1992, the State Council promulgated the Regulations on the Administration of Urban Appearance and Environmental Sanitation—China’s first administrative regulation dedicated to this field—providing a legal basis for governance. Subsequently, local governments formulated corresponding implementation rules to tighten sanitation management. In terms of infrastructure, investment in waste treatment plants, sewage facilities, and other key infrastructure has increased, with some cities introducing advanced waste treatment technologies, such as incineration for power generation, to improve efficiency. Concurrently, rising living standards heightened demands for urban greening and landscaping, leading to greater emphasis on park and green space development, which improved urban ecological environments.
The early 21st century to the 18th National Congress of the Communist Party of China (2001–2012): Entering the 21st century, China’s urbanization accelerated further, presenting new challenges and opportunities for urban appearance and environmental sanitation. Policies during this period emphasized environmental protection, sustainable development, comprehensive urban environmental governance, and ecological construction. For waste management, the goals of “reduction, recycling, and harmlessness” were proposed, with vigorous promotion of waste classification and resource recycling. In 2000, eight cities, including Beijing, Shanghai, and Guangzhou, were designated as the first national pilot cities for household waste classification, marking the official launch of such initiatives. In air pollution control, strict air quality standards were established, with strengthened regulation of industrial pollution sources and vehicle emissions. In 2001, the State Environmental Protection Administration (now the Ministry of Ecology and Environment) jointly issued the Notice on Effectively Controlling Urban Dust Pollution, requiring local governments to reduce dust emissions and improve air quality. Additionally, efforts were intensified to protect urban water environments, including the treatment of black and odorous water bodies, thereby enhancing urban water quality.
Since the 18th National Congress of the Communist Party of China (2012–present), China has incorporated ecological civilization into its “Five-sphere Integrated Plan,” ushering in urban appearance and environmental sanitation policies into a new developmental phase. Policies now emphasize the concept of green development, refined urban environmental management, and public participation. In waste classification, the National Development and Reform Commission and the Ministry of Housing and Urban-Rural Development issued the Implementation Plan for the Household Waste Classification System in 2017, designating 46 key cities to lead the enforcement of mandatory classification, advancing the initiative to a new stage. In urban environmental governance, technological applications such as big data and the Internet of Things have been strengthened to improve the efficiency and precision of sanitation management. Some cities have established intelligent sanitation management systems, using sensors to monitor waste collection in real-time, road cleaning status, and other operational metrics, enabling real-time supervision and scheduling of sanitation work. Simultaneously, greater emphasis has been placed on public participation through public awareness campaigns and volunteer services, enhancing residents’ environmental awareness and engagement, and fostering a collaborative governance model for urban environments where all stakeholders contribute to and benefit from improvements.
2.1.2 Framework of the existing policy system for urban appearance and environmental sanitation in China
China’s existing policy system for urban appearance and environmental sanitation encompasses multiple levels, including laws and regulations, plans and programs, standards and norms, and policy measures, forming a relatively complete policy framework.
Laws and regulations, as the core of the policy system, possess authority and mandatory force. They mainly include the Law of the People’s Republic of China on the Prevention and Control of Environmental Pollution by Solid Wastes and the Regulations on the Administration of Urban Appearance and Environmental Sanitation. The Law on the Prevention and Control of Environmental Pollution by Solid Wastes regulates the entire process of solid waste generation, collection, transportation, utilization, and disposal, clarifying responsibilities and obligations at each stage and providing a fundamental legal basis for urban waste management. The Regulations on the Administration of Urban Appearance and Environmental Sanitation specify detailed provisions on urban appearance management, environmental sanitation management, and the construction of environmental sanitation facilities, serving as an essential regulatory document for urban appearance and environmental sanitation governance.
Plans and programs involve long-term strategies and phased arrangements for urban appearance and environmental sanitation work. For example, the 14th Five-Year Plan for National Urban Infrastructure Construction outlines clear goals and tasks in areas such as urban environmental sanitation facilities, waste classification and treatment, and urban greening, providing a guiding direction for the implementation of related work. Local governments also formulate corresponding local plans in accordance with national plans. Take the 14th Five-Year Plan for Urban Management Development in Beijing as an instance: it elaborates on urban appearance and environmental sanitation work in Beijing in combination with the city’s characteristics and development needs, including improving domestic waste treatment capacity, strengthening urban road cleaning and maintenance, and enhancing the quality of urban greening.
Standards and norms provide technical support for policy implementation, quantifying and standardizing various aspects of urban appearance and environmental sanitation work. They include the Pollution Control Standard for Domestic Waste Landfills and the Standard for Quality and Evaluation of Urban Road Cleaning and Maintenance. The Pollution Control Standard for Domestic Waste Landfills outlines pollution control requirements for the site selection, design, operation, closure, and monitoring of domestic waste landfills, ensuring that the construction and operation of these facilities comply with environmental protection standards and minimize environmental pollution. The Standard for Quality and Evaluation of Urban Road Cleaning and Maintenance standardizes the operation process, quality requirements, and evaluation methods of urban road cleaning and maintenance, which is conducive to improving the quality and efficiency of urban road cleaning and maintenance.
Policy measures are specific means to promote policy implementation, including financial subsidies, tax incentives, and administrative supervision. In terms of economic subsidies, the government provides funds for the construction of waste treatment facilities and promotes waste classification. For example, it grants certain financial subsidies to newly built waste incineration power plants to encourage social capital to participate in the construction of waste treatment facilities. In terms of tax incentives, enterprises engaged in resource recycling are given tax reductions to promote the development of the resource recycling industry. In terms of administrative supervision, efforts are intensified to investigate and punish illegal acts related to urban appearance and environmental sanitation. For instance, fines and orders for rectification are imposed for acts such as illegal waste dumping and the destruction of urban green spaces, aimed at maintaining the cleanliness and beauty of cities.
However, the existing policy system also has some problems. There is insufficient coordination between some policies, and policies formulated by different departments may conflict or overlap in the implementation process. In the implementation of waste classification policies, the division of responsibilities between the environmental sanitation department and the environmental protection department is not clear enough, resulting in a phenomenon of shifting duties in work. The pertinence and operability of some policies need to be improved. Some policies do not fully account for the unique circumstances of different regions, making it challenging to implement them effectively at the local level. In some economically underdeveloped regions, due to limited funds and technology, it is challenging to meet the high standards for constructing environmental sanitation facilities set by the state.
2.2 Research foundation of methodology
2.2.1 Principles of the LDA model
The Latent Dirichlet Allocation (LDA) model is a classic topic modeling technique widely used in natural language processing. Based on Bayesian theory, the LDA model aims to identify latent topic structures from massive amounts of text data. LDA achieves deep semantic mining of text by constructing a three-layer framework, document, topic, and vocabulary. (Jelodar et al., 2019).
In the LDA model, each document is regarded as a mixture of multiple topics, and each topic is represented as a probability distribution over the vocabulary. Taking urban appearance and environmental sanitation policy texts as an example, a policy document on waste classification might encompass topics such as “waste management,” “resource recycling,” and “public education.” Each topic is associated with high-frequency vocabulary, e.g., “recyclables,” “hazardous waste,” and “publicity campaigns.” Through learning from a large corpus of policy texts, the model automatically identifies these topics and their distribution proportions within each document, thereby revealing the core content and semantic relationships of the policy texts.
Mathematically, the LDA model assumes that each word in a document is generated through the following process. First, a topic is selected from the document’s topic distribution, and then a word is chosen from the vocabulary distribution corresponding to that topic. By introducing Dirichlet distributions as prior distributions for both topic and vocabulary distributions, the LDA model effectively addresses issues of uncertainty and sparsity in text data. In practical applications, algorithms such as Gibbs Sampling or Variational Inference are typically used to estimate model parameters, yielding the topic distributions of texts and the topic-vocabulary distributions.
The LDA model offers significant advantages in text topic extraction. It can automatically detect latent topics in texts without the need for pre-specified topic categories, greatly enhancing the efficiency and accuracy of thematic analysis. In research on urban appearance and environmental sanitation policies, the LDA model facilitates the rapid identification of various topics in policy texts, providing robust support for subsequent policy analysis and evaluation. Additionally, the LDA model can be applied to tasks such as text classification, information retrieval, and similar document discovery, playing a crucial role in multiple domains of natural language processing.
2.2.2 PMC index model
The Policy Modeling Consistency (PMC) Index Model, an effective tool for quantitatively evaluating policy texts, was proposed by Mario Arturo Ruiz Estrada in 2011. Based on the “Omnia Mobilis” hypothesis, this model emphasizes the need to comprehensively consider various relevant variables during policy modeling to ensure policy consistency and effectiveness (Yang et al., 2023).
In the quantitative evaluation of urban appearance and environmental sanitation policies, the PMC Index Model initially requires the development of a scientifically sound and reasonable indicator system. This system typically covers multiple dimensions, including policy objectives, policy measures, policy subjects, policy objects, and policy resources. In the realm of policy objectives, attention is given to whether policies are clear, specific, and measurable—for example, whether particular targets for waste reduction or air quality improvement are established. The policy measures dimension examines whether the means adopted by policies are targeted and operable, such as whether detailed guidelines for waste classification and standards for sanitation operations are formulated. The policy subjects dimension involves policy formulators, implementers, and supervisors, assessing whether the division of responsibilities among these subjects is clear and whether their collaboration is smooth. The policy objects dimension focuses on the groups affected by policies, specifically urban residents and related enterprises, to analyze whether these policies fully consider their interests and needs. The policy resources dimension evaluates whether the human, material, and financial resources required for policy implementation are sufficient and reasonably allocated.
After determining the indicator system, each indicator needs to be scored in detail. By aggregating the scores of all indicators, the PMC index for the policy text can be finally calculated. The PMC index typically ranges from 0 to 9, with higher values indicating better performance of the policy text in various aspects, as well as higher policy quality and feasibility. Through the quantitative evaluation of the PMC index model, the advantages and disadvantages of urban appearance and environmental sanitation policies can be intuitively understood, providing a scientific basis for policy optimization and improvement.
2.2.3 Integration and application of the LDA-PMC analytical method
Integrating the LDA model with the PMC index model can leverage the advantages of both, providing a more comprehensive and in-depth analytical perspective for research on urban appearance and environmental sanitation policies. The LDA model excels at identifying the thematic structure of policy texts, whereas the PMC index model emphasizes the quantitative evaluation of policy content. Their combination can facilitate a comprehensive policy analysis, ranging from semantic understanding to performance evaluation and assessment.
The advantages of this integration are first reflected in the in-depth understanding of policy texts. Extracting the themes of policy texts through the LDA model can quickly grasp the core concerns of policies, such as waste treatment, pollution control, and urban beautification, providing a clear direction for subsequent PMC index evaluation. Based on these themes, using the PMC index model to quantitatively evaluate the specific content of policies in each thematic field can provide a more accurate assessment of policy performance in different aspects.
In the research on urban appearance and environmental sanitation policies, the application process of the LDA-PMC analytical method is as follows: first, collect a large number of urban appearance and ecological sanitation policy texts, including national and local laws and regulations, government documents, and planning schemes. Then, use natural language processing technology to preprocess these texts, such as word segmentation, stop-word removal, and stemming, converting unstructured text data into a format suitable for model analysis. Next, use the LDA model to extract themes from the preprocessed texts, identify the primary themes present in the policy texts, and analyze the distribution of each theme across different policy texts. On this basis, use these main themes as the core variables of the quantitative evaluation framework, employ the PMC index model for quantitative evaluation, and construct a policy model canvas to intuitively display the elements and structure of policies in terms of objectives, measures, subjects, and objects. Finally, comprehensively consider the analysis results of the LDA model and the PMC index model, conduct a comprehensive evaluation of urban appearance and environmental sanitation policies, summarize the effectiveness and shortcomings of these policies, and propose targeted improvement suggestions.
2.3 Literature review on urban appearance and environmental sanitation policies
Urban appearance and environmental sanitation policies aim to create clean, aesthetically pleasing, and livable urban environments. Academic research in this field has yielded rich insights, providing valuable references for policy improvement and implementation.
In terms of policy and regulatory system construction, China’s Regulations on the Administration of Urban Appearance and Environmental Sanitation have served as a model for developing countries in urban environmental sanitation governance (Katherine et al., 2022). It clarifies the principles of unified leadership, regional responsibility, and the integration of professional management with public participation, stipulating regulatory requirements for buildings, municipal public facilities, outdoor advertising, and methods for collecting, transporting, and disposing of domestic waste. However, studies have highlighted that specific provisions in the current regulatory framework are outdated, failing to meet the demands of rapidly evolving urban construction and management (Jiaming et al., 2024). Klaus et al. (2024), through research on multiple developed countries, found that dynamic update mechanisms for regulations are crucial to ensuring effective urban environmental management. Many countries revise their rules in response to urban development to address emerging management challenges. As cities grow, new business models, such as shared bicycles and food delivery services, have emerged, posing new challenges to urban management; yet, existing regulations lack comprehensive provisions for these areas.
Regarding management models, China’s current urban management is predominantly government-led, but this approach has revealed issues such as low efficiency and insufficient public participation (Li and Xu, 2025). Yi et al. (2022) proposed introducing market mechanisms, such as contracting out services and public-private partnerships (PPPs), to transfer part of the sanitation operations to the market, thereby improving service quality and efficiency. The United States has extensive experience in this regard; studies indicate that some U.S. cities have effectively enhanced waste management efficiency and quality through PPP models (Vardoulakis et al., 2016). Meanwhile, scholars worldwide emphasize the importance of public participation, advocating for the inclusion of residents and social organizations in decision-making, supervision, and implementation processes to form a multi-stakeholder governance structure (Taedong and Martin, 2015). International practices have confirmed that sound institutional arrangements can effectively stimulate public engagement in public affairs management and improve governance effectiveness (Das, 2024). Additionally, several cities in China have piloted community self-governance organizations for environmental sanitation supervision, achieving positive results. However, scaling up these initiatives faces obstacles such as inadequate participation channels and low public awareness (Ma et al., 2023).
In the realm of environmental sanitation infrastructure policies, despite increasing investments across China, problems such as irrational layout and outdated facilities persist (Zhu et al., 2023). Particularly in the development of new urban districts and the renovation of old districts, some areas neglect to support sanitation infrastructure. Scholars suggest leveraging big data and the Internet of Things to realize intelligent management of sanitation facilities, enhancing operational efficiency and management standards (Zhou and Ding, 2023). Smith et al. (2012) found that EU countries optimized the layout and utilization of sanitation facilities through smart sensors and data analytics, reducing resource waste.
In general, existing studies have examined various aspects of urban appearance and public environmental sanitation policies, including system design, management models, and specific applications. However, three gaps remain: first, there is a “regional imbalance” in research perspectives. Most existing studies focus on economically developed regions, while paying insufficient attention to the policy dilemmas and innovative practices in the underdeveloped areas, making it challenging to reflect the overall picture of such policies. Second, there is a tendency to “prioritize texts over practice” in research content. The majority of studies are limited to the content of policy texts and fail to effectively integrate practical experiences such as the actual effects of policies after implementation, residents’ perceptions, and regional differences, resulting in a disconnect between research conclusions and practice. Third, there is a “tendency toward methodological singularity” in research methods. Quantitative evaluations mostly rely on a single type of policy text-based tool, and no practical joint application of multiple methods has been formed.
This study aims to achieve breakthroughs in three aspects: first, expand the coverage of research regions to ensure that research samples fully include both economically developed and underdeveloped regions; second, deepen the linkage analysis of “text-practice-effect” and interpret the results of policy text analysis by combining practical experiences; third, innovate research methods by jointly using the Latent Dirichlet Allocation (LDA) thematic analysis and Policy Modeling Consistency (PMC) index model to provide a more accurate scientific basis for policy optimization.
3 Empirical analysis based on the LDA-PMC method
3.1 Data collection and preprocessing
3.1.1 Data sources
Data collection in this study was primarily conducted using the Peking University Lawinfo Retrieval Tool—an intelligent one-stop legal information retrieval platform co-developed by the Peking University Legal Information Center and Peking University Yinghua Technology Co., Ltd. This platform enables the “one-stop integration” of policy texts originating from the official websites of central and local governments, thereby ensuring centralized access to authoritative policy documentation (Zhao, 2025).
To safeguard the accuracy, comprehensiveness, and authority of the collected data, each policy text was cross-verified against its original issuing channels. Key sources of information included the official websites of the Ministry of Housing and Urban-Rural Development and the Ministry of Ecology and Environment, as well as other government portals. This verification process ensured that the research samples accurately reflected the actual status of policies related to China’s urban appearance and environmental sanitation.
The policy texts included in the dataset span the period from 2018 to 2025 and encompass a diverse range of document types, including formal laws, administrative regulations, government-issued documents, and specialized planning schemes. During the text selection phase, a strict relevance principle was applied, retaining only policies that directly related to urban appearance and environmental sanitation. This criterion was designed to enhance the targeting of the research data and ensure its validity for addressing the study’s specific research objectives.
Following a rigorous screening process, 159 policy texts—each sourced from a distinct city—were finalized as the core research sample for subsequent analyses.
3.1.2 Data cleaning
Data cleaning, a critical step in data preprocessing, is designed to eliminate noise and errors, thereby enhancing the overall quality of the dataset. For the policy texts collected in this study, the cleaning process followed a structured, multi-stage workflow:
First, formatting standardization was implemented: policy texts initially stored in diverse file formats (e.g., PDF, DOC, TXT) were converted to a unified TXT format. This standardization ensured compatibility with subsequent analytical procedures and minimized format-induced inconsistencies.
Second, text purification was conducted using regular expressions to remove non-informative elements, including HTML tags, special symbols (e.g., ©), and garbled characters. This step was crucial to maintaining the clarity and accuracy of the core text content, which directly affects the reliability of subsequent analyses.
Third, manual proofreading was performed to identify and correct typos and grammatical errors in the texts. This manual intervention complemented automated cleaning by addressing context-dependent errors that regular expressions could not detect, further improving the readability and precision of the text data.
Throughout the entire data cleaning process, four core principles were strictly adhered to: completeness (retaining all valid policy content), consistency (ensuring uniform formatting and expression), accuracy (eliminating errors and noise), and usability (optimizing data structure for analytical tools). These principles collectively guaranteed that the cleaned data accurately and comprehensively reflect the original content of the policy texts.
3.1.3 Word segmentation
Word segmentation—the process of decomposing continuous text sequences into discrete lexical units—is a foundational step in enabling the computational analysis of unstructured text. For this study, Chinese word segmentation was performed using the jieba library (a widely adopted tool for Chinese text segmentation) within the Python programming environment. The jieba tool operates through two core mechanisms: first, it constructs a Directed Acyclic Graph (DAG) for input sentences and determines segmentation boundaries by identifying the maximum probability path within this graph; second, for out-of-vocabulary (OOV) terms (i.e., words not included in its built-in dictionary), it leverages the Hidden Markov Model (HMM) combined with the Viterbi algorithm to infer the most linguistically probable segmentation sequences (Liao, 2024).
Jieba offers three distinct segmentation modes for Chinese text, each with trade-offs in accuracy, speed, and handling of ambiguity. The first mode is the full mode, which prioritizes processing speed but frequently produces ambiguous segmentations due to its tendency to extract all possible candidate words. The second mode is the search engine mode, which builds on full-mode segmentation by applying advanced algorithms to re-segment long lexical units; this approach improves result reliability but reduces computational efficiency. The third mode is the precise mode, which optimizes for accurate and complete segmentation of core lexical units with minimal ambiguity. Given that text analysis for this study required high accuracy and completeness to ensure the validity of subsequent analyses, the precise mode was selected as the optimal segmentation approach.
To further enhance segmentation accuracy before formal data processing, three preparatory steps were implemented. The first step was synonym merging, through which synonymous terms were consolidated to avoid redundancy in post-segmentation analysis. The second step involved developing a custom dictionary and stopword list. A domain-specific custom dictionary and stop-word list were constructed, iteratively refined, and validated based on the semantic and lexical characteristics of urban appearance and environmental sanitation policy texts, until their content was finalized. The third step involved integrating a professional domain dictionary, a specialized dictionary for the urban appearance and environmental sanitation field, which contains domain-specific terms such as “waste classification,” “sanitation facilities,” and “dust pollution.” This dictionary was integrated into the segmentation workflow. Preloading these terms into Jieba’s dictionary ensured they were recognized as intact lexical units during segmentation, preventing incorrect splitting of domain-critical terminology.
Following segmentation, a manual validation step was conducted to verify the accuracy and rationality of the results. Specifically, segmentations of compound terms and newly emerging policy-specific expressions were manually reviewed; adjustments were made if errors (e.g., incorrect splitting or merging of terms) were identified. The high-frequency terms generated from the segmentation process are presented in Table 1 and a word cloud visualization of these terms is provided in Figure 1.
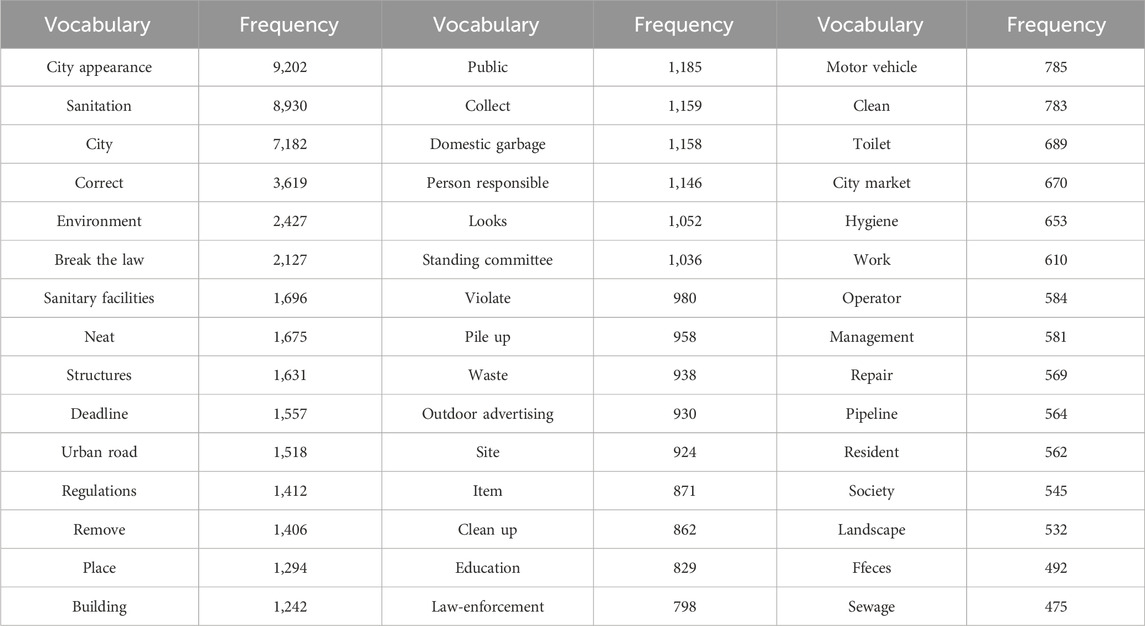
Table 1. High-frequency words of urban appearance and public environmental health policies.
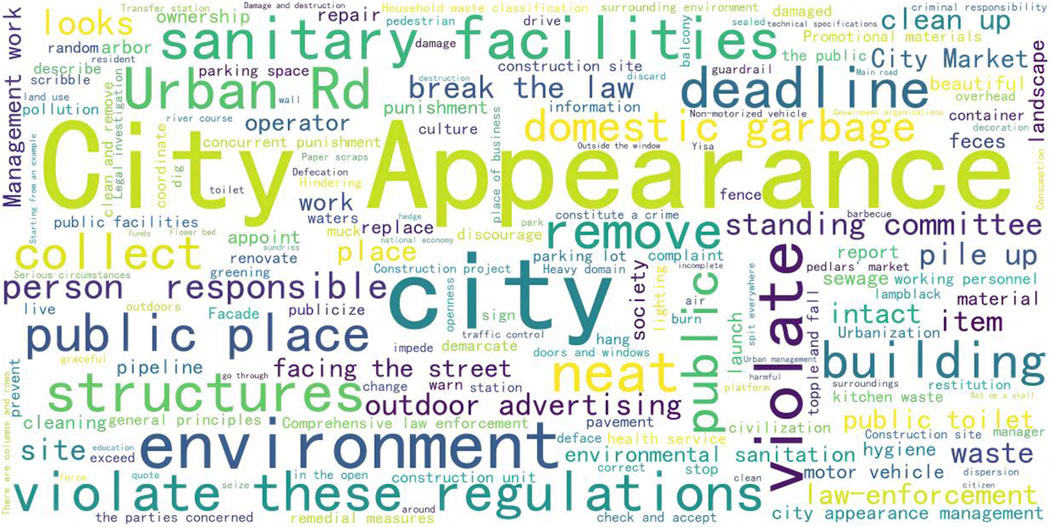
Figure 1. Cloud word map of urban appearance and public environmental health policies.
3.2 Construction and analysis of the LDA topic model
3.2.1 Determination of the number of topics
When constructing an LDA topic model, determining the number of topics is a primary step. This decision significantly impacts the model’s performance and analytical outcomes: an insufficient number of issues may fail to fully reveal the latent semantic information in policy texts, while an excessive number can lead to over-refinement of topics, resulting in semantic overlap and noise interference. In this study, the Perplexity and Coherence metrics were employed to identify the optimal number of issues (Chu et al., 2021). Perplexity measures how well the model fits the documents; a lower perplexity indicates stronger predictive power of the model for the papers.
Specifically, LDA modeling was implemented using Python with the Gibbs sampling method. The LDA Model and Coherence Model from the gensim library were imported. The hyperparameters α and β of LDA were set to 50/k and 0.1, respectively, with the number of iterations set to 1,000. Through multiple experiments, the perplexity and coherence of the model were calculated for different numbers of topics. Curves illustrating the changes in perplexity and coherence with the number of issues (ranging from 1 to 10) are presented in Figures 2, 3, respectively.
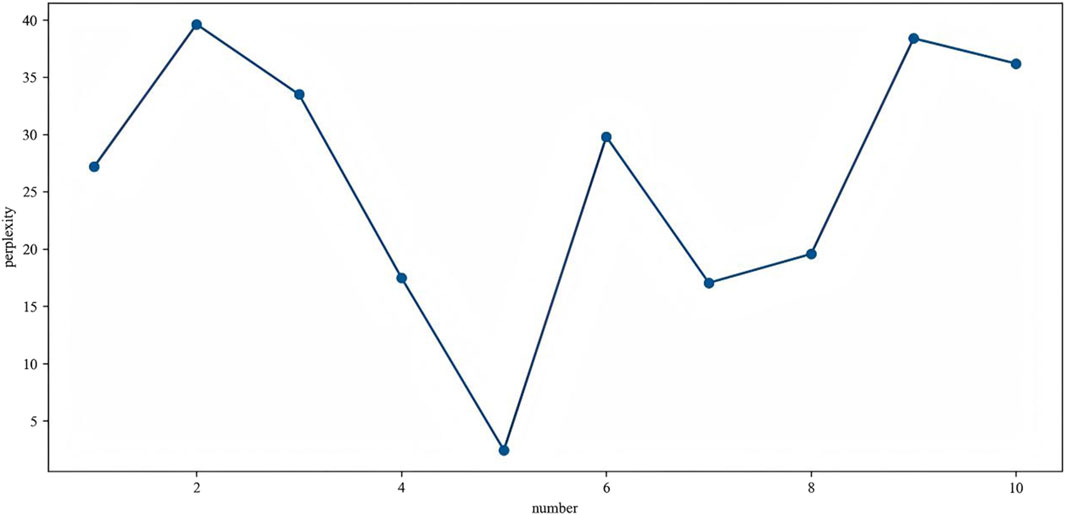
Figure 2. Curve of confusion degree with the number of topics.
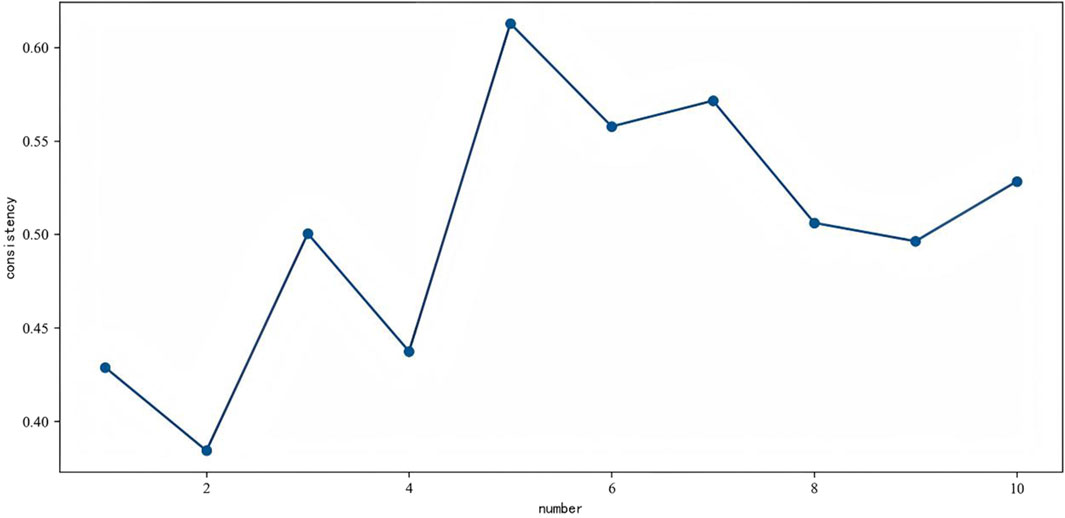
Figure 3. Consistency curve with the number of topics.
The trend of the curves indicates that as the number of topics increases, perplexity initially decreases and then increases, reaching its lowest value at 5 topics. This suggests that the model’s fitting ability to the documents is optimal with 5 topics. Meanwhile, coherence increases first and then decreases, peaking at 5 topics. Considering both perplexity and coherence metrics comprehensively, the optimal number of topics is determined to be 5.
3.2.2 Analysis of topic modeling results
After determining the optimal number of topics as 5, the LDA model was applied to extract topics from the preprocessed policy texts. Following model training, the keyword distribution for each topic and the probability distribution of each policy text across all topics were obtained. A further analysis of the keywords for each topic (see Table 2) leads to the following conclusions:
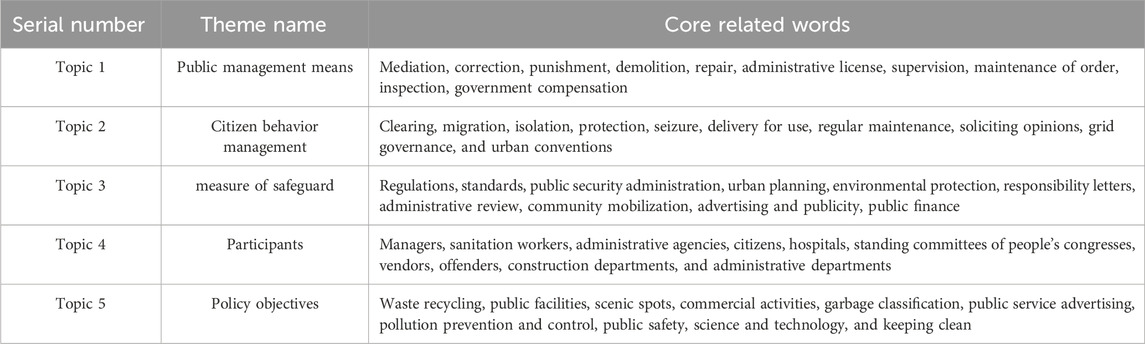
Table 2. Theme classification and its core keywords.
Topic 1 primarily relates to public management tools, with keywords including “mediation,” “revision,” “punishment,” and “demolition.” These keywords indicate that urban appearance enhancement and public sanitation governance rely on specific management measures. These measures can be further categorized by their degree of coerciveness into mandatory, non-mandatory, and mixed types. Mandatory measures include penalties, demolition, and administrative licensing. Non-mandatory measures encompass mediation, guidance, rewards, and government compensation. Mixed measures involve revision, restoration, order maintenance, supervision, and inspection. Only through the comprehensive application of these three types of measures can urban appearance and public environmental sanitation policies achieve their maximum effectiveness.
Topic 2 focuses on the governance of citizens’ behaviors, with keywords such as “dredging,” “relocation,” “isolation,” and “protection,” reflecting the policy attention to various citizen behaviors and corresponding governance measures. These governance measures can be classified by their implementation methods into three types: guiding, restrictive, and protective. Guiding measures include persuasion and guidance, aiming to standardize citizens’ behaviors through positive reinforcement. Restrictive measures involve relocation, restriction, and control, applied to impose necessary constraints on non-compliant behaviors. Protective measures include isolation, protection, and safety reminders, providing security guarantees for citizens’ reasonable behaviors. Only through the scientific combination of these three types of measures can citizens’ behaviors be effectively guided toward meeting urban appearance and environmental sanitation requirements, fostering a sound public order in cities.
Topic 3 is associated with supporting measures, featuring keywords such as “regulations,” “quality standards,” “public security management,” and “urban planning,” which reflect the proactive design by policymakers to ensure effective policy implementation. These supporting measures can be divided by their functional levels into institutional, normative, and executive guarantees. Institutional guarantees include regulations, rules, and management methods, providing a solid institutional foundation for policy implementation; normative guarantees encompass quality standards, technical specifications, and operational procedures, ensuring policy execution follows clear guidelines; executive guarantees involve public security management, supervision, and inspection, and urban planning, offering specific operational support for policy implementation. Therefore, organically combining these three supporting measures can lay a solid foundation for the smooth implementation of urban appearance and environmental sanitation policies and ensure the realization of policy goals.
Topic 4 focuses on the participants in policy implementation, with keywords including “managers,” “sanitation workers,” “management agencies,” and “citizens,” emphasizing the importance of multiple stakeholders in urban appearance and environmental sanitation management. These participants can be categorized by their roles and responsibilities into leaders, implementers, and participants. Leaders primarily refer to management agencies, which are responsible for overall planning and decision-making. Implementers include sanitation workers, managers, and hospitals, undertaking specific management and service tasks. Participants mainly consist of citizens and enterprises, engaging through compliance with regulations and participation in supervision. Only by giving full play to the roles of all participants and fostering a collaborative atmosphere can the overall efficiency of urban appearance and environmental sanitation management be enhanced.
Topic 5 focuses on the targets of policy intervention, with keywords such as “waste recycling,” “public facilities,” “scenic spots,” and “commercial activities,” revealing the scope of policy adjustment. These policy targets can be classified by their attributes into physical entities, activities/behaviors, and resource utilization. Physical entities include public facilities, scenic spots, and buildings; activities/behaviors encompass commercial activities, public events, and production activities; resource utilization involves waste recycling, energy use, and water resource utilization. Only by comprehensively covering and appropriately addressing these policy targets can urban appearance and environmental sanitation policies ensure complete coverage of their adjustment scope, thereby achieving a clean, orderly, and sustainable urban development.
To ensure the scientific rigor and robustness of the aforementioned topic division, this study employed the PyLDAvis visualization library to generate a bubble plot for model validation, resulting in Figure 4. As illustrated in the figure, each topic within China’s urban appearance and environmental sanitation policies is mutually independent (with no overlapping areas in the bubble plot). This indicates that each topic constitutes a focal point of policy research, demonstrating that the policy division not only comprehensively covers all content but also avoids the possibility of redundant discussions.
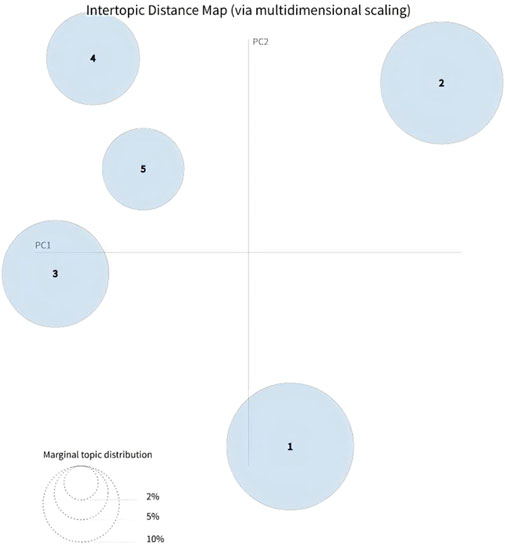
Figure 4. LDAvis visualization.
3.3 Construction and processing of the PMC index model
3.3.1 Construction of the evaluation system for urban appearance and public environmental sanitation policies
In determining the primary indicators, this study integrated experiences and methods from relevant policy evaluation literature in existing studies to further revise the indicator system, ultimately establishing 9 primary indicators. To enhance the applicability of the indicators, when selecting specific primary indicators, in addition to referencing the literature on the PMC index model, the settings for indicators such as X2 (Participating Subjects), X3 (Supporting Measures), X4 (Public Management Tools), X5 (Governance of Citizens’ Behaviors), and X6 (Policy Targets) were mainly combined with the results of the LDA thematic analysis mentioned earlier.
Secondary indicators are more in-depth interpretations and refinements of primary indicators. To ensure rigor, secondary indicators are derived from three primary sources: first, adopting the conventional settings of the PMC model indicator system, such as the secondary variables under the primary variables of X1 (Policy Perspective), X8 (Implementation Cycle), and X9 (Text Quality). These settings are general and applicable to the evaluation of all policy texts; second, referring to the statistical table of high-frequency words generated after word segmentation by the word segmentation tool, such as the setting of secondary variables under the primary variable of X7 (Policy Functions); third, utilizing the thematic word results generated by the LDA topic model mentioned earlier, such as the setting of secondary variables under the primary variables of X2 (Participating Subjects), X3 (Supporting Measures), X4 (Public Management Tools), X5 (Governance of Citizens’ Behaviors), and X6 (Policy Targets). This method of variable identification and indicator selection can not only improve the precision and depth of the research but also fully leverage the advantages of text mining technology in the research, thereby avoiding excessive subjectivity in the expert-set indicator system.
This study identified 9 primary indicators and 31 secondary indicators, with specific variable settings presented in Table 3.
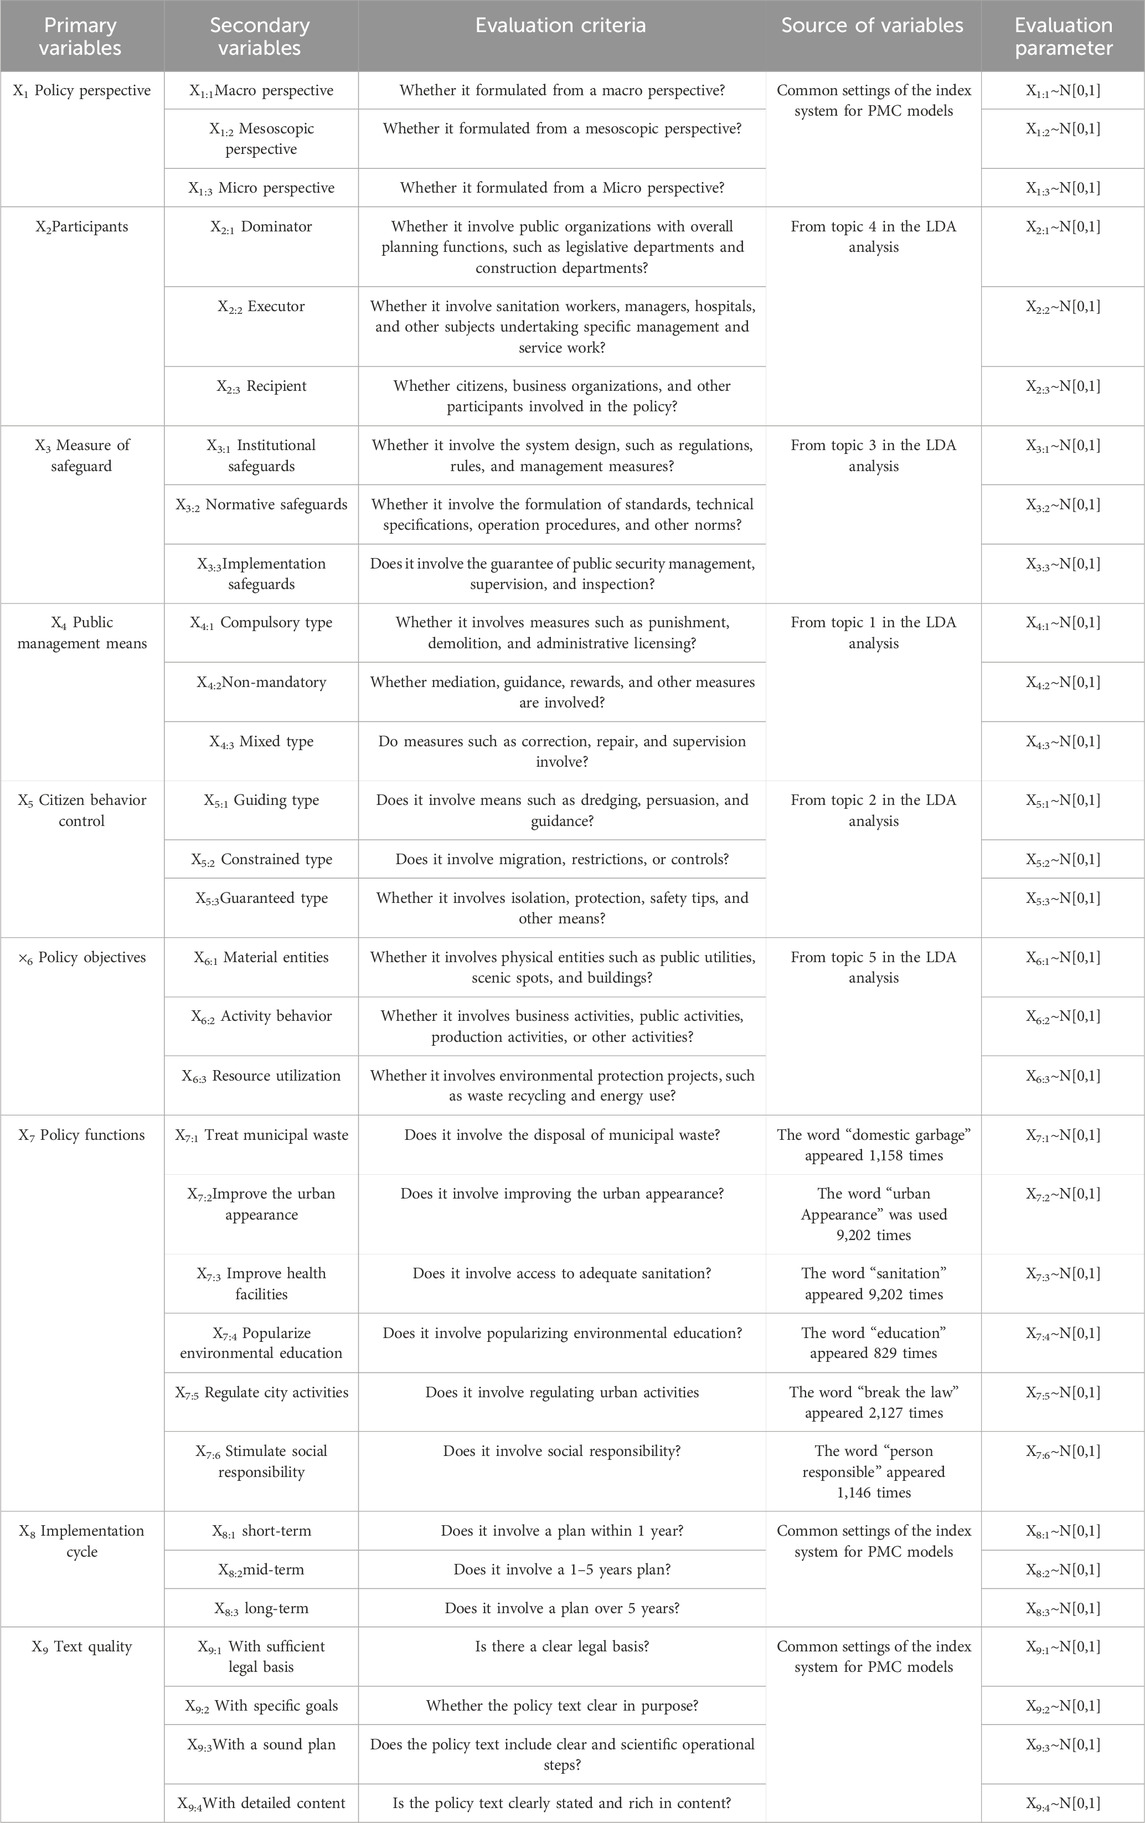
Table 3. Evaluation variables of urban appearance and public environmental health policies based on LDA-PMC mode.
3.3.2 Selection of evaluation samples
To further explore patterns in urban appearance and public health environments, this study focuses on policies from nine Chinese provinces (see Table 4) for enhanced assessment of the PMC index. The rationale for sample selection is as follows: In terms of regional comprehensiveness, the selected provinces accurately cover the seven major geographical regions of China—North China, East China, South China, Southwest China, Central China, Northwest China, and Northeast China—forming a comprehensive geographical representation across the nation. Regarding urban development representativeness, the sample system encompasses the full spectrum from international metropolises to developed central cities and growing cities. Beijing and Shanghai, as economically massive international cities, demonstrate regulatory frameworks that integrate national top-level standards with global best practices; Jiangsu, Zhejiang, Hubei, and Fujian showcase innovative practices in regulatory refinement and market-oriented operations in economically active regions; while Yunnan, Heilongjiang, and Shaanxi reflect considerations regarding regulatory adaptability and regional balance in less developed cities. Overall, the selection of these nine provinces achieves a balance between geographical breadth and developmental depth. Comparative studies of their regulatory systems not only reveal the overarching trends and commonalities in China’s urban sanitation legislation but also identify distinctive characteristics in regulatory formulation and implementation across different regions and city types.
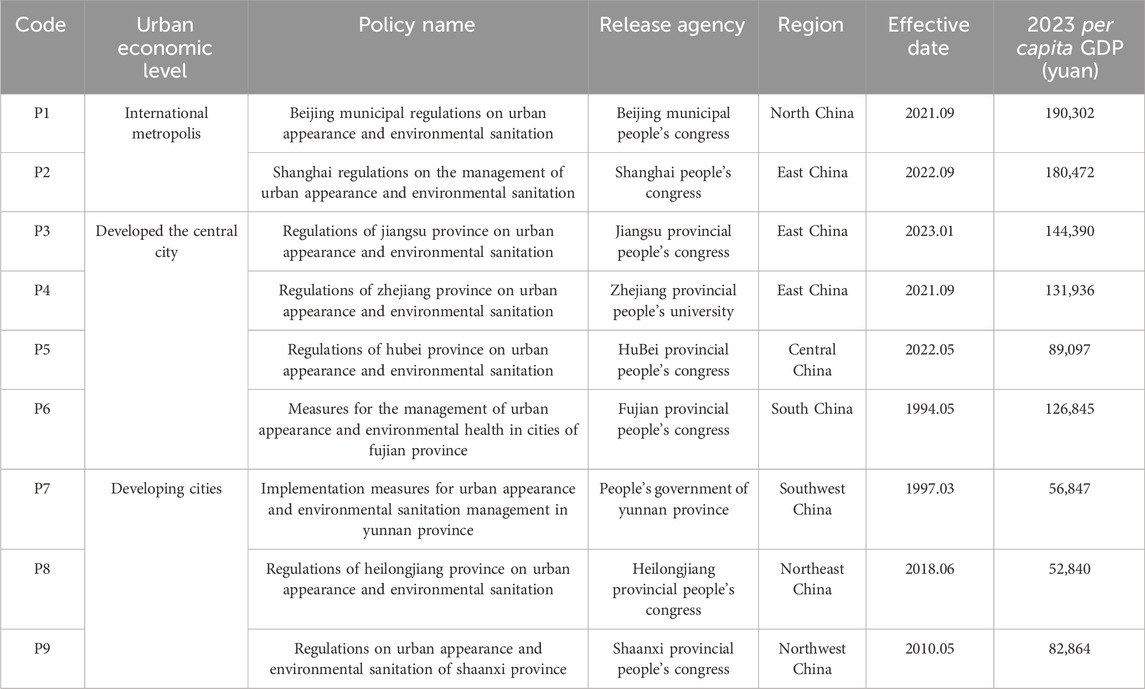
Table 4. Sample of policies to be evaluated.
3.3.3 Construction of multi-input-output table
A multi-input-output table is essentially a powerful data analysis framework that can store massive amounts of data and allows for multi-dimensional measurement of individual variables (Sun et al., 2024). By using a multi-input-output table, we can gain a more comprehensive understanding of policy effects and provide support for informed decision-making. Within this framework, primary indicators are mutually independent with no correlation between them, and the weights of secondary indicators are equal. Table 5 is organized according to the study’s needs.
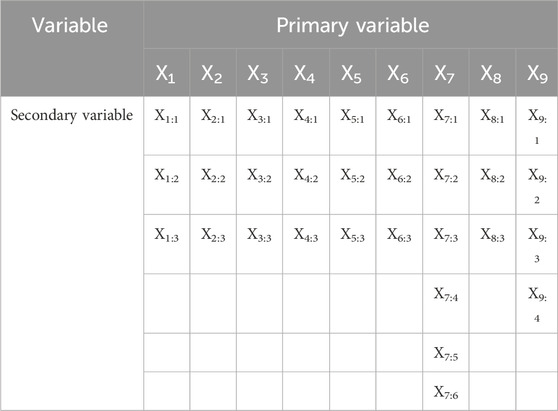
Table 5. Multiple input-output table.
3.3.4 Calculation of PMC index for each policy
The steps for calculating the PMC index of each policy in this study are as follows: First, combined with the binary method, formulas 1 and 1 are used to calculate the score of each secondary indicator, where 0 represents that the indicator is not involved and 1 represents that it is engaged, and the calculation results are placed in the multi-input-output table. Second, formula 3 is applied to calculate the primary indicators. Third, the score results of the selected policies are sorted out according to formula 4. It is essential to note that during the calculation process, the steps must be executed in strict order, and attention must be paid to the connections and dependencies between each step to avoid calculation errors and inconsistencies.
Based on the number of primary variables and with reference to the evaluation criteria in previous studies (Xu et al., 2025), the PMC index scores are specifically divided into the following five levels: a PMC index score of 9 indicates a perfect policy; a score ranging from 7 to 8.99 indicates an excellent policy; a score from 5 to 6.99 indicates a good policy; a score between 3 and 4.99 indicates a poor policy; and a score from 0 to 2.99 indicates a severely poor policy.
(i is the primary variable, j is the sub variable, t is the number of sub variables, the same below)
After performing the above calculations, the overall score results for each policy can be obtained, as shown in Table 6. The detailed score information for each indicator, by policy, is presented in Table 7.
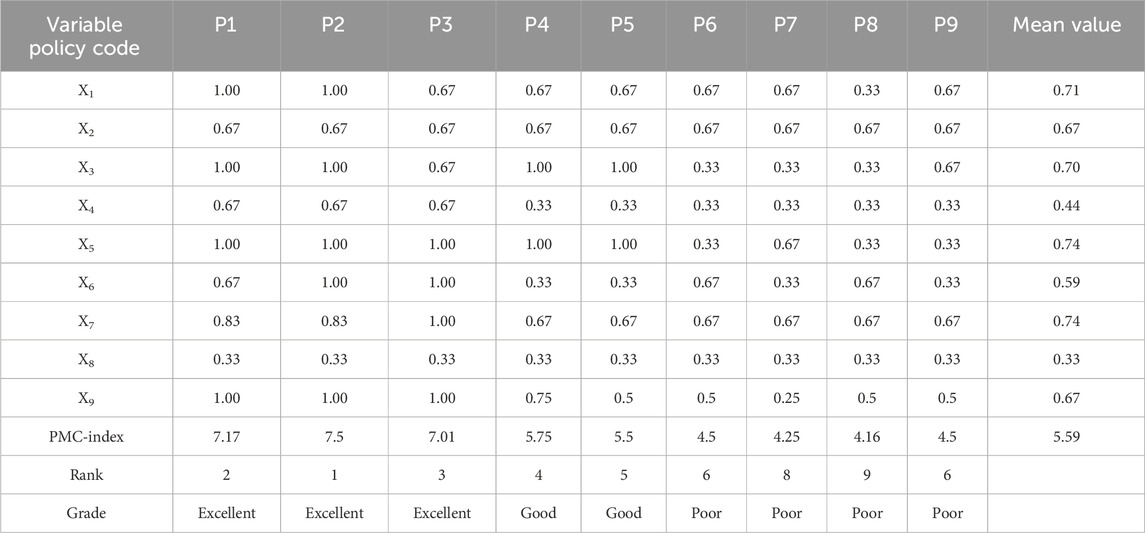
Table 6. Overall scores of each policy.
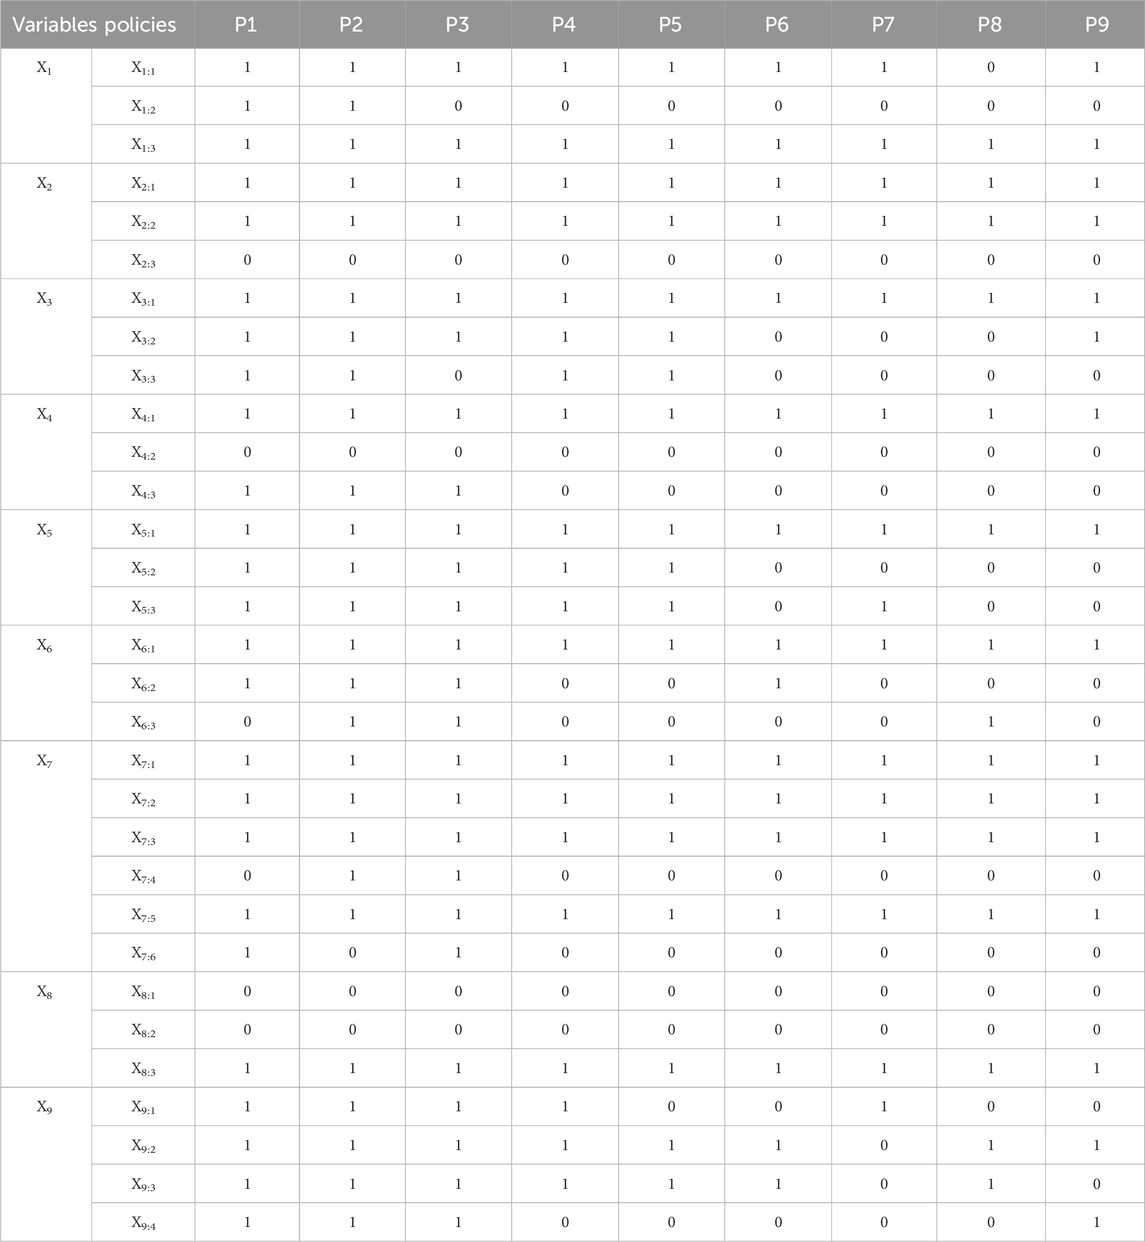
Table 7. Shows the score of each policy variable.
3.3.5 Drawing of PMC surface plots for each policy
To enhance the overall visualization effect of the PMC matrix, this study generates surface plots of the sample policies using formula 5. Through surface plots, we can intuitively present data attributes or variables from different dimensions, thereby providing a more comprehensive view of the characteristics of the objects represented by the data. A convex surface indicates that the overall content of the policy is relatively complete, while an obvious concave surface suggests that the policy has deficiencies in specific aspects. The PMC surface plots of each policy are shown in Figures 5–13, respectively. In the figures, (1, 2, 3) serves as the horizontal axis, and (Series 1, Series 2, Series 3) as the vertical axis. Therefore, (1, Series 1) represents Z1, (2, Series 1) represents Z2, (3, Series 1) represents Z3, and so on. Different shades of color scales distinguish different rating levels, and various degrees of convexity and concavity indicate different score magnitudes (convex parts represent high scores, while concave parts represent low scores).
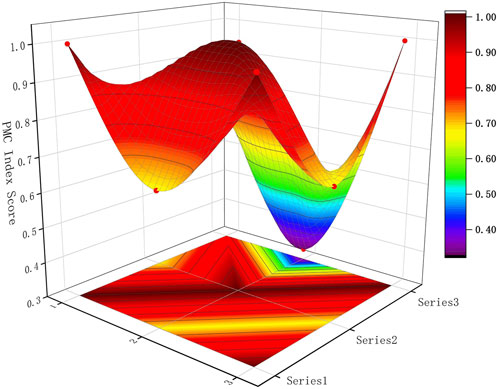
Figure 5. PMC surface of P1.
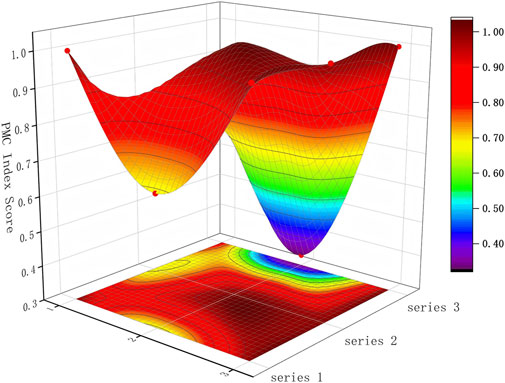
Figure 6. PMC surface of P2.
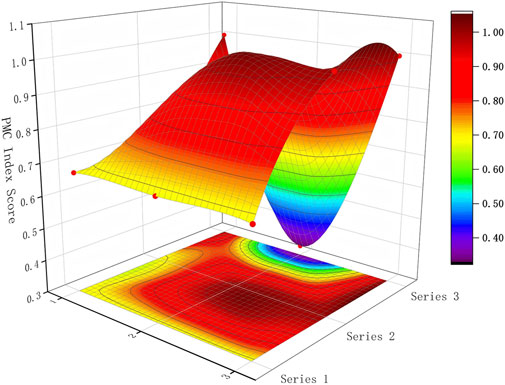
Figure 7. PMC surface of P3.
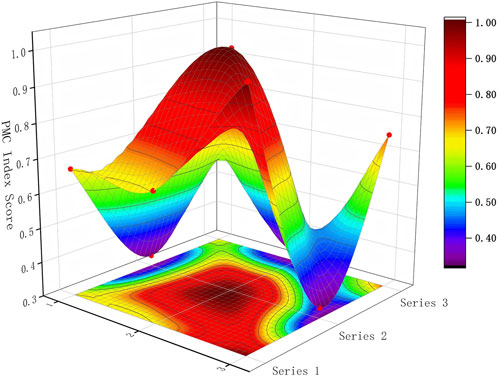
Figure 8. PMC surface of P4.
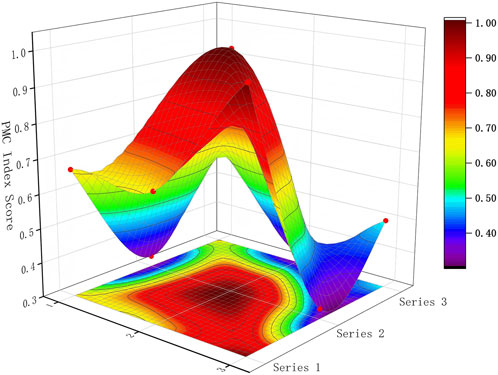
Figure 9. PMC surface of P5.
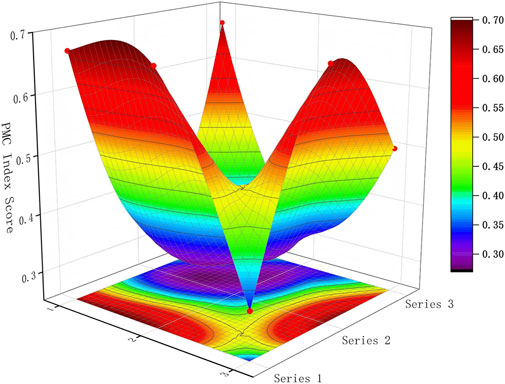
Figure 10. PMC surface of P6.
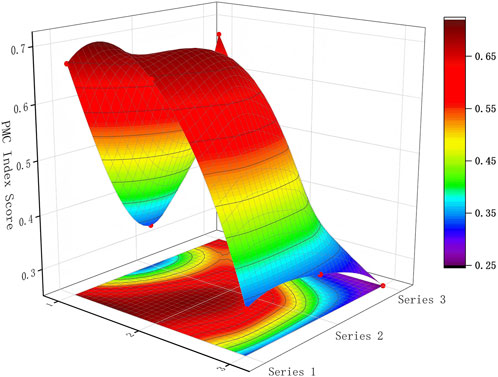
Figure 11. PMC surface of P7.
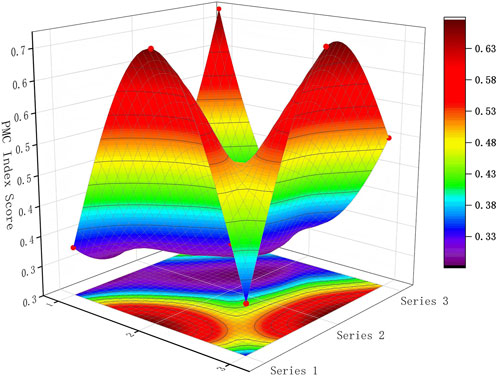
Figure 12. PMC surface of P8.
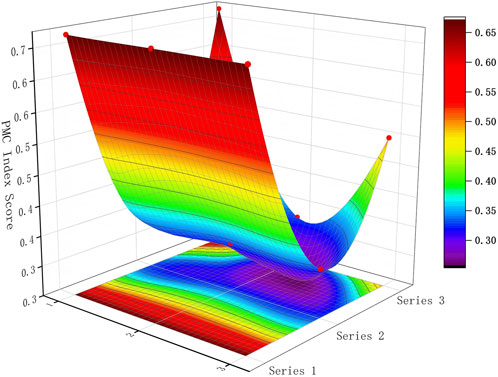
Figure 13. PMC surface of P9.
3.4 Analysis of LDA-PMC results
3.4.1 Analysis of the overall effect of policies
Based on the overall PMC scores, the quality of policies regarding urban appearance and environmental sanitation in Chinese cities exhibits the characteristic of “ladder differentiation based on urban economic development level”. The average PMC index of the 9 policy samples is 5.59, falling into the “good” range. Still, there are significant internal differences: Beijing (P1, 7.17 points) and Shanghai (P2, 7.50 points), two ultra-large international cities with massive economic aggregates, rank as excellent, forming the first echelon; economically active regions including Jiangsu (P3, 7.01 points), Zhejiang (P4, 5.75 points), Hubei (P5, 5.5 points), and Fujian (P6, 4.50 points) form the second echelon; economically underdeveloped regions such as Yunnan (P7, 4.25 points), Heilongjiang (P8, 4.16 points), and Shaanxi (P9, 4.50 points) form the third echelon. It can be concluded that there is a highly significant positive correlation between policy scores and urban economic development levels (r = 0.82, p < 0.01), indicating that the higher the economic development level of a region, the higher the overall quality of urban appearance and environmental sanitation policies.
It should be explained that Fujian (P6) has a per capita GDP of 126,800 yuan (close to that of Zhejiang), but its policy score is only 4.50 points. This may be related to the lag in revising its policy text (formulated in 1994, which did not fully incorporate the management of new business forms), indicating that the economic level is not the only determining factor, and policy timeliness can also affect the score. Shaanxi (P9) has a per capita GDP of 82,900 yuan and a policy score of 4.50 points, which is higher than that of Yunnan and Heilongjiang in the same echelon. This may be related to its policy inclination towards protecting historical and cultural heritage as a central city in northwest China, reflecting the regulatory role of regional functional positioning.
Combining the average PMC index of each policy in Table 6 and the detailed scores of each indicator of each policy in Table 7, the average PMC surface graph is further drawn, as shown in Figure 14. It can be seen that each policy presents the structural characteristic of “four emphases and four neglects”.
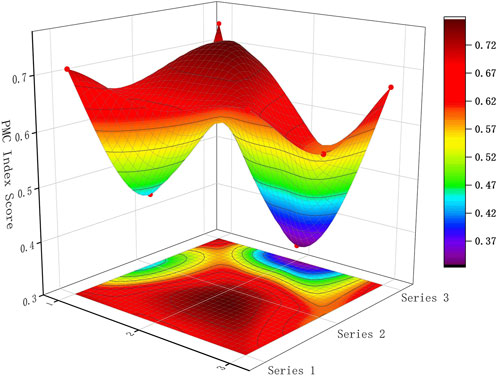
Figure 14. Average surface of PMC.
First, emphasizing institutional frameworks while neglecting implementation details. The average score of “guarantee measures (X3)” is 0.70 points, among which “institutional guarantee (X3:1)” has the highest score, with all 9 policy texts achieving full marks, while the score of “implementation guarantee (X3:3)” is far behind, with 5 cities (more than half) scoring 0. Most cities only mention contents such as “frequency of supervision and inspection” and “process of violation punishment” in their policies in a perfunctory manner with phrases like “strengthen supervision and management”, without specifying specific responsible departments and operation standards, leading to “institutional idling” when policies are implemented, and the normalization of supervision mechanisms becomes a mere formality.
Second, emphasizes hardware construction while neglecting ideological guidance. In “policy functions (X7),” “improving sanitation facilities (X7:3)” in all 9 policy texts has achieved full marks, while the scores of “popularizing environmental protection education (X7:4)” and “stimulating social responsibility awareness (X7:6)” are very unsatisfactory. 77.78% of the cities scored 0 in both indicators. Even in the policies that mentioned these two indicators, less than 2% of the full text involves contents such as “environmental protection publicity” and “social responsibility”, and most of them are principled statements like “improving citizens’ environmental protection awareness”, lacking specific publicity channels and educational program designs. This suggests that most cities have not fully recognized the positive impact of ideological education on urban appearance and public health environments.
Third, emphasizing long-term development while neglecting the design of policy implementation, connection, and transition in the short and medium term. In “implementation cycle (X8),” all policies have obtained full marks in “long-term (X8:3),” indicating that local policies generally attach importance to carrying out “long-term rectification actions”, such as Beijing’s “autumn and winter dust control” and Chengdu’s “city appearance and environment thorough cleaning”. However, in “short-term (X8:1)” and “medium-term (X8:2),” all policies have “failed”, with no content describing short-term and medium-term action plans. This means that in the process of implementing long-term policies, there is a lack of necessary transition and connection, which may easily lead to the failure of policy goals.
Fourth, emphasizing administrative management while neglecting citizens’ participation in governance. The policies of various cities attach great importance to the application of mandatory public management means. All policies have obtained full marks in “mandatory (X4:1)” and “regulating urban activities (X7:5).” The average score of “citizen behavior control (X5)” is as high as 0.74, indicating that China’s urban appearance and environmental sanitation policies attach more importance to public management. In addition, the policies of various cities reflect the neglect of citizens’ participation in governance to varying degrees, which can be confirmed by the poor score of “participants (X2:3).”
3.4.2 Policy-by-policy analysis
3.4.2.1 Excellent policy analysis
Beijing (P1, 7.17 points): Beijing’s policies perform in a balanced and outstanding manner among the nine level 1 indicators, with its strengths concentrated in the three dimensions of policy perspective (X1, 1.00 points), safeguard measures (X3, 1.00 points), and text quality (X9, 1.00 points). From the policy perspective, Beijing’s policies cover macro (e.g., Beijing-Tianjin-Hebei collaborative governance), meso (division of urban functional zones), and micro (community waste classification pilots) levels at the same time, forming a three-dimensional governance framework of “global-local-individual”, which is consistent with the fact that as the capital city, Beijing is a complex city with highly functional needs and a high degree of autonomy. This is highly compatible with the complex urban functions of Beijing, the capital city. In terms of safeguards, Beijing’s policy scores full marks for institutional safeguards (X3:1), normative safeguards (X3:2), and implementation safeguards (X3:3), and is particularly impressive in terms of the convergence of laws and regulations and the monitoring mechanism: the policy explicitly references the higher-level law, and at the same time refines the principle of “street inspections - district-level supervision - municipal notification”. At the same time, the three-level supervision process, which involves “street inspection - district supervision - municipal notification,” has been refined to ensure that the system is implemented effectively. The high score for text quality (X9) stems from the precise quantification of objectives, specific operational steps, and a sufficient legal basis. However, Beijing’s policy has shortcomings in terms of public management tools (X4, 0.67 points) and targets (X6, 0.67 points). The blank score for non-coercive means (X4:2) reflects the policy’s over-reliance on administrative penalties (e.g., high fines for illegal garbage disposal) and the inadequate design of incentive mechanisms (e.g., redemption of garbage classification points). The low score of resource utilization objects (X6:3) indicates that the policy’s coverage of the recycling industry chain is still weak, and there is a gap between it and the goal of building a “waste-free city” and the goal of building a “waste-free city”. There is a gap between this and the goal of building a “waste-free city”.
From the PMC surface diagram, the surface of Beijing’s policy is whole, with only slight depressions in the X4 and X6 dimensions, confirming its characteristic of “strong protection and weak incentives”. This structure is related to the governance pressure of Beijing as a mega-city, relying on administrative means to achieve quick results in the short term, while optimizing the mechanism of multiple governance in the long term.
Shanghai (P2, 7.50 points): Shanghai’s policy is ranked first with 7.50 points, and its strength lies in the comprehensiveness of the role object (X6, 1.00 points) and the governance of citizens’ behavior (X5, 1.00 points). In the object dimension, Shanghai not only covers the traditional material entities (e.g., facilities along the “One River, One River”) and activity behaviors (e.g., cityscape control during the Expo), but also innovatively incorporates resource utilization objects (X6:3) into the policy system, such as regulating courier packaging recycling through the Extended Producer Responsibility System (EPRS), which is the first policy to be adopted in Shanghai. For example, through the “extended producer responsibility system” to regulate express packaging recycling, which is highly compatible with the positioning of Shanghai as an “international consumption center city”. In terms of citizen behavioral governance, Shanghai’s policy of guiding (X5:1), restraining (X5:2) and safeguarding (X5:3) measures work in tandem: guiding citizens to participate in rule-making (guiding) through the “Community Council”, and restricting the use of shared bicycles through the “electronic fence” technology (X5:4). The “community council” guides citizens to participate in rule-making (guidance), the “electronic fence” technology restricts indiscriminate parking of shared bicycles (constraint), and the “caring post” provides operational protection for sanitation workers (protection), forming a closed loop of governance that combines “dredging and blocking”.
However, Shanghai’s policy has obvious deficiencies in its implementation cycle (X8, 0.33 points), which only involves long-term planning (e.g., the layout of sanitation facilities in the 14th Five-Year Plan), and lacks short- and medium-term programs (e.g., the breakdown of the annual garbage disposal rate). This shortcoming is reflected as a significant depression in the X8 dimension of the surface diagram, suggesting that the policy needs to strengthen the transmission mechanism of “long-term goals - stage tasks”.
Jiangsu (P3, 7.01 points): Jiangsu’s policy performance is characterized by its function (X7, 1.00 points) and target (X6, 1.00 points), and it is particularly ahead of the other samples in terms of popularizing environmental education (X7:4) and regulating business activities (X6:2). As an economically active province, Jiangsu has embedded “environmental education” into its CSR evaluation system, requiring industrial parks to conduct environmental training several times a year, which has resulted in a score of 1.00 on X7:4, much higher than the sample mean (0.11). In terms of safeguards (X3, 0.67 points), Jiangsu’s policy on implementation safeguards (X3:3) scores low, reflecting its tendency to “emphasize standard-setting and neglect supervision on the ground. For example, although the policy clearly states that “grid-based management, joint enforcement and regularized inspection mechanisms are to be established”, no assessment and accountability mechanism has been put in place, which has led to the phenomenon of “standards hanging in the air” in some prefectural-level cities. The slight depression of the X3 dimension in the surface map confirms this.
3.4.2.2 Analysis of good policies
Zhejiang (P4, 5.75 points): Zhejiang’s policy performs excellently in citizen behavior governance (X5, 1.00 point), with particularly notable innovations in guiding measures (X5:1). For instance, it integrates urban appearance management into the grassroots governance grid through the “Fengqiao Experience,” achieving the goal of “small matters not leaving the village, major matters not leaving the town.” However, there are shortcomings in public management means (X4, 0.33 points) and target objects (X6, 0.33 points): the scores for non-mandatory means (X4:2) and mixed means (X4:3) are blank, indicating an over-reliance on administrative penalties; the resource utilization objects (X6:3) only involve waste recycling and do not cover emerging fields such as the promotion of new energy sanitation vehicles, which is inconsistent with Zhejiang’s positioning as a “demonstration zone for common prosperity” in green development. The surface graph indicates that Zhejiang’s policy creates a “double depression” in the X4 and X6 dimensions, suggesting the need to optimize the diversified allocation of governance tools, particularly to enhance the synergy between economic incentives and administrative means.
Hubei (P5, 5.50 points): Hubei’s policy maintains advantages in guarantee measures (X3, 1.00 point) and citizen behavior governance (X5, 1.00 point), but its text quality (X9, 0.50 point) has obvious flaws: policy goals are vague (e.g., “improving environmental sanitation” is not quantified), and operational steps are missing (e.g., the site selection process for NIMBY facilities is not detailed). This problem is related to the lag in policy formulation and capacity building in Hubei, a central province. In terms of target objects (X6, 0.33 points), Hubei’s policy has insufficient coverage of activity behavior (X6:2) and resource utilization (X6:3), reflecting that its governance focus remains on traditional sanitation fields (such as public toilet construction). The regulation of new business forms (such as temporary road occupation by live-streaming e-commerce operations) is lagging. The depressions in the X6 and X9 dimensions in the surface graph suggest that the policy needs to strengthen the logical closed-loop of “goal-measure-supervision.”
3.4.2.3 Analysis of poor policies
Fujian (P6, 4.50 points): The primary reason for Fujian’s low score is the double lack of safeguards (X3, 0.33 points) and governance of citizens’ behavior (X5, 0.33 points). As a sample formulated in 1994 and used until now, its institutional safeguard (X3:1) still follows the old version of the Law on Prevention and Control of Environmental Pollution by Solid Wastes, which conflicts with the current law; the scores of constraint-based measures (X5:2) and safeguard-based measures (X5:3) are blank, which leads to a lack of effective control over illegal behaviors such as vehicles. The curved graph indicates that Fujian’s policy is “flat” in many dimensions, reflecting its outdated content and lack of adaptability, and underscoring the need for systematic revision in light of the construction of the “Economic Zone on the West Coast of the Taiwan Strait”.
Yunnan (P7, 4.25 points): The shortcomings of Yunnan’s policy are centered on safeguards (X3, 0.33 points) and text quality (X9, 0.25 points): the latest environmental regulations are not cited in the institutional safeguards (X3:1), the technical standards are missing in the normative safeguards (X3:2) (e.g., requirements for the impermeability of landfill sites in highland areas), and the text lacks a clear target (e.g., the sanitation rate of tourist attractions is not set).). These problems are related to Yunnan’s limited policy resources as a frontier province. However, Yunnan retains certain advantages in governing citizen behavior (X5, 0.67 points), and its “Ethnic Village Environmental Sanitation Convention” reflects regional cultural characteristics, providing a valuable reference for managing cityscapes in multi-ethnic areas. The depth of the depressions in X3 and X9 in the surface map suggests the need to strengthen the interface between policy and law, as well as the localization of technical standards.
Heilongjiang (P8, 4.16 points): The Heilongjiang policy performs poorly in terms of public management tools (X4, 0.33 points) and objects of action (X6, 0.67 points): there is a gap in the non-coercive type of tools (X4:2), and the resource utilization type of objects (X6:3) only deals with snow recycling in winter, and fails to cover the sanitation needs of the other seasons. In addition, the quality of the text (X9, 0.50 points) has the problem of “ambiguous objectives”, such as “building a famous city for ice and snow tourism”, which is not accompanied by specific indicators for improving the cityscape. The significant depression in the X4 dimension in the surface map reflects the single tool of governance. In contrast, the imbalance in the X6 dimension suggests the need to develop a comprehensive cityscape management system that considers the characteristics of cities in cold regions.
Shaanxi (P9, 4.50 points): Shaanxi’s policies are deficient in safeguards (X3, 0.67 points) and objects of action (X6, 0.33 points): normative safeguards (X3:2) lack standards for the protection of historical and cultural districts, and the resource utilization category of objects (X6:3) does not address the treatment of waste in the renovation of ancient buildings. However, as a central city in Northwest China, its policy perspective (X1, 0.67 points) takes into account both macro (ecological protection of the Yellow River Basin) and micro (sanitation renovation of urban villages), reflecting the characteristics of regional governance.
The depressions of X3 and X6 in the surface map suggest that the policy needs to strengthen the synergistic mechanism of “cultural heritage protection and cityscape management,” to avoid conflicts between traditional and modern governance goals.
3.4.3 Implications of policy analysis
By analyzing the overall effect and item-by-item analysis of China’s urban amenities and environmental sanitation policies, the following implications can be summarized to provide directional guidance for optimizing and improving policies and future development.
First, promote the synergistic improvement of policy quality and economic development level, and narrow the regional gap. The analysis of the overall effect of the policy reveals that the quality of the policy is highly positively correlated with the level of urban economic development; however, the economy is not the only determining factor. This reveals that for economically developed regions, based on maintaining the existing advantages, we should further break through the bottleneck of policy homogenization and focus on refined governance, for example, Beijing can strengthen the design of non-coercive management tools, Shanghai can improve the short- and medium-term policy implementation mechanism, and Jiangsu can make up for the shortcomings of the assessment and accountability of the implementation of safeguards to create exemplary “benchmark policies”. “The design of coercive management means can be improved in Shanghai. For economically less developed regions, it is necessary to increase the input of policy resources and promote policy upgrading through the “central guidance + local adaptation” approach. On the one hand, we can learn from the institutional framework of developed regions (such as Beijing’s three-tier supervision process); on the other hand, we should combine the regional characteristics (such as Yunnan’s ethnic villages convention, Heilongjiang’s cold land sanitation needs) to develop differentiated measures, to avoid unthinkingly copying.
Second, optimize the policy structure by resolving the “four heavy and four light” structural contradictions. Specifically should be done in four areas: (1) balance the institutional framework and implementation details, in the improvement of institutional safeguards (such as regulatory revisions) at the same time, the need to strengthening the implementation of operational safeguards. For example, clear supervision and inspection frequency, violation of the penalty process, and avoiding “system idle” are key considerations. (2) Balancing hardware construction and ideological guidance: Based on continuous investment in the construction of sanitation facilities, it is necessary to expand the coverage of environmental education and the cultivation of social responsibility awareness. Jiangsu can learn from the experience of environmental protection training in assessing enterprises, designing specific publicity programs, and stimulating public participation through the exchange of points, honorary recognition, and other means to change the current status quo from “heavy facilities, light awareness.” (3) Bridging long-term planning and short- and medium-term actions: Long-term policy goals (such as the construction of a “waste-free city”) should be broken down into short- and medium-term tasks that can be implemented, and be accompanied by a corresponding assessment mechanism. (4) Coordination between administrative management and citizen participation: While maintaining the effectiveness of administrative management, it is necessary to broaden the channels for citizen participation. Reference can be made to the grassroots governance model of Zhejiang’s “Fengqiao Experience” to establish platforms, such as “community council chambers” and “policy hearings,” that allow citizens to participate in rule-making.
Third, focus on policy innovation and respond to emerging areas and governance needs. With the deepening of urbanization, new forms of business (such as bike-sharing and live e-commerce) and new challenges (such as population mobility and climate change) have put forward higher requirements for policy. Breakthroughs need to be made in the following areas: on the one hand, expanding the coverage of the target’s role. In view of the insufficient coverage of “resource utilization” and “activity behavior” objects, the policy needs to incorporate emerging areas. For example, the new energy sanitation equipment, such as takeaway lunch box recycling, falls under the resource utilization class management; live electric temporary occupation, night economy cityscape maintenance, and other emerging activities are also being developed. This development aims to establish special behavioral norms, thereby avoiding policy lag behind practice. On the other hand, innovate the combination of governance tools. Reduce the over-reliance on coercive tools, and promote the hybrid tool of “coercion + incentive + guidance” to enhance the flexibility and effectiveness of policies.
4 Discussion and conclusion
4.1 Discussion
This study analyzed the texts of urban appearance and environmental sanitation policies from 159 Chinese cities using the LDA-PMC analytical method, focusing on the strengths and weaknesses of nine representative policies to reveal their thematic structure, quality differences, and structural characteristics. The research findings not only echo the viewpoints of existing literature but also achieve breakthroughs, while exposing deep-seated problems in policy practice.
In terms of integrating research methods, the extraction of policy themes by the LDA model is highly compatible with the evaluation system constructed by the PMC index model, which verifies the scientific validity of the linkage framework of “theme mining-quantitative evaluation”. This approach overcomes the limitations of a single policy analysis tool: the theme identification of LDA provides a textual basis for the setting of PMC indicators, avoiding the subjectivity of indicator selection, while the quantitative scoring of PMC converts the semantic analysis of LDA into comparable policy quality data, realizing the leap from qualitative to quantitative analysis. This integrated approach offers a new paradigm for policy text research in the field of urban management, particularly suitable for large-sample and multidimensional policy evaluation scenarios. This is consistent with the view emphasized by Gong et al. (2025) when applying the PMC model in the evaluation of two-way referral policies, namely, that “indicator setting must be based on textual empirical evidence.” Gong et al. pointed out that indicator design divorced from text mining is prone to a disconnect between evaluation results and the actual content of policies. By first extracting themes through LDA and then converting them into PMC indicators, this study addresses this defect, further confirming the rationality of method integration.
From the perspective of structural contradictions in policy practice, the “four emphases and four neglects” characteristics (emphasizing system over implementation, hardware over ideology, long-term over connection, and management over participation) discovered in this study deepen the understanding of policy effectiveness. Existing studies such as Li and Xu (2025) have pointed out that China’s urban environmental sanitation policies have problems such as “insufficient coordination” and “weak public participation”, but this study further quantifies the specific manifestations of these problems: for example, the average score of implementation guarantees (X3:3) is only 0.22, the coverage rate of environmental education (X7:4) is less than 23%, short-to-medium-term planning (X8:1, X8:2) is completely missing, and the score of citizen participation (X2:3) is 0. These data reveal the core obstacles to policy implementation—the disconnection between institutional design and implementation capacity, the alignment of hardware investment and awareness cultivation, and the alignment of long-term goals and phased tasks. This conclusion is also supported by the research of Vardoulakis et al. (2016). When analyzing urban environmental governance, Vardoulakis proposed that the deviation between “policy text integrity” and “practical implementability” stems from a “lack of details” and an “absence of subjects.” The problems found in this study, such as “vague implementation details” and “insufficient public participation channels”, are precisely the empirical response to this view.
In terms of the specificity of exceptional cases, the score deviations of Fujian (P6) and Shaanxi (P9) confirm the view that “economic level is not the only determinant of policy quality”. Fujian’s low score is due to the long-term lack of revision of its policy text (formulated in 1994), reflecting the impact of policy timeliness on quality; Shaanxi’s relatively high score is attributed to its regional positioning of “ecological protection of the Yellow River Basin”, which shows the shaping effect of functional positioning on policy perspective. This finding is consistent with the research conclusion of Klaus et al. (2024). When analyzing environmental policies, Klaus pointed out that the frequency of policy updates and regional functional orientation will significantly moderate the impact of economic level on policy quality. Economically developed regions may have “high economic level but low policy quality” if they ignore the dynamic revision of policies. In contrast, areas with a medium economic level can achieve quality breakthroughs by designing policies that take into account regional characteristics. The cases of Fujian (per capita GDP of 126,800 yuan but policy score of 4.5) and Shaanxi (per capita GDP of 82,900 yuan but score of 4.5) in this study are strong evidence for Klaus’ view, further indicating that policy optimization needs to take into account economic foundation, update mechanism, and regional characteristics.
In addition, this study also found the problem of adaptability between policy text quality and actual governance needs: less developed regions such as Yunnan and Heilongjiang have insufficient localization of technical standards due to resource constraints (e.g., Yunnan did not specify the anti-seepage requirements for waste landfills in plateau areas), which is consistent with the view of “policies must match regional resource endowments” proposed by Zhou and Ding (2023). When studying corporate environmental protection behaviors, Zhou noted that if local policies overlook local resource constraints (such as funding and technology), even a comprehensive framework is challenging to implement. The cases of Yunnan and Heilongjiang verify this point. Although the policies of these two regions cover the institutional framework, the implementation effect is limited because the technical standards are not combined with local reality.
4.2 Conclusion
This study systematically analyzes China’s urban appearance and public environmental sanitation policies using an integrated Latent Dirichlet Allocation-Policy Modeling Consistency (LDA-PMC) methodology. By processing policy texts from 159 cities and conducting in-depth validation with policies from 9 representative provinces, the research draws the following key conclusions with both theoretical and practical implications:
First, the quality of China’s urban appearance and public environmental sanitation policies exhibits a distinct “economic gradient differentiation” feature, forming a structured hierarchy aligned with regional development disparities. Policies in international metropolises, such as Beijing and Shanghai (with PMC indices ranging from 7.17 to 7.50), achieve an “excellent” quality, supported by balanced, multidimensional development. Their core strengths include a three-dimensional policy perspective that integrates macro-level strategies, meso-level planning, and micro-level initiatives; a closed-loop institutional safeguard system that links legal and regulatory alignment with multi-tier supervision processes; and high text quality characterized by quantifiable targets and clear operational procedures.
Policies in economically dynamic regions, such as Jiangsu and Zhejiang (with PMC indices ranging from 5.50 to 7.01), fall into the “good” category but exhibit structural shortcomings. These include over-reliance on a single type of governance tool and insufficient implementation safeguards, which limit their effectiveness in practice. In contrast, policies in less developed regions, such as Yunnan and Heilongjiang (with PMC indices ranging from 4.16 to 4.50), are classified as “poor,” primarily due to institutional lag and resource constraints. Issues here include outdated policy texts, inadequate localization of technical standards, and insufficient fiscal investment to support infrastructure and supervision systems.
Correlation analysis reveals a strong positive correlation between policy quality and regional economic development, with a Pearson correlation coefficient of 0.82 (p < 0.01). However, this relationship is not absolute. Some regions with high economic levels exhibit a mismatch between low policy quality and outdated policies, while others with moderate economic development achieve relatively competitive policy perspectives by leveraging their regional functional positioning. These cases suggest that policy update frequency and regional functional positioning serve as important moderating variables, mitigating the absolute constraints of economic level on policy quality.
Second, China’s urban appearance and public environmental sanitation policies universally suffer from a structural contradiction of “four emphases and four neglects,” which has become a core barrier to bridging the gap between policy texts and practical implementation. In terms of safeguard measures, institutional safeguards achieve high average scores, while implementation safeguards score much lower. Many cities only use principle-based statements for implementation safeguards without clarifying responsible entities or operational standards, leading to “paper-based idling” of institutional designs.
In terms of policy functions, hardware construction achieves full coverage, but environmental education and social responsibility cultivation have low coverage rates, with related content accounting for a small proportion of policy texts. This reflects a biased governance orientation of prioritizing facility investment over awareness cultivation. In terms of implementation cycles, all policies fully address long-term planning and achieve full marks; however, they lack short-to-medium-term connection plans, which makes it difficult to advance long-term goals due to the absence of phased implementation pathways.
In terms of governance subjects, government-led tools are widely applied, while public participation channels score poorly, resulting in a governance model dominated by government rather than multi-stakeholder co-governance. The superposition of these contradictions means that, although policy texts provide a comprehensive framework, they fail to effectively address complex governance issues in practice due to insufficient implementation details, a lack of public collaboration, and a poor phased connection.
Third, the integrated LDA-PMC methodology provides an innovative paradigm for urban policy evaluation, combining “in-depth semantic mining” and “precision quantitative analysis” to address the limitations of traditional research methods. The LDA model accurately identifies five core policy themes—“public management tools,” “citizen behavior governance,” “safeguard measures,” “participating subjects,” and “policy targets”—through thematic mining of 159 policy texts. This not only provides an empirical textual basis for constructing the PMC indicator system (directly converting LDA-identified themes into primary indicators of the PMC model) but also avoids subjectivity in traditional indicator design.
The limitations of this study primarily include three aspects: first, the text mining objects only cover policy texts from 159 cities, with no inclusion of policies at the county and township levels, and only 9 representative provincial policy samples are analyzed in detail, resulting in insufficient sample coverage and potential inability to fully reflect the overall status of China’s urban appearance and public environmental sanitation policies; second, the equal-weight method is used to set the weights of PMC indicators, failing to consider the actual differences in the importance of different indicators in policy practice, which may lead to deviations between quantitative evaluation results and actual policy effectiveness; third, the research only analyzes policy texts and lacks linkage verification with actual governance effects (such as residents’ satisfaction, waste treatment efficiency) using field research data, limiting the application value of the conclusions.
Corresponding future research directions involve: expanding the sample hierarchy to include county and township-level policies, increasing samples of underdeveloped regions and special-type cities to refine regional analysis; optimizing indicator weights through methods like AHP and Delphi, and introducing dynamic variables to improve the PMC model; combining field surveys, official statistics, etc., to verify the correlation between policy text quality and actual governance effects, and conducting case tracking studies; and integrating machine learning technologies (e.g., BERT model) to enhance text mining depth and adopting a comparative perspective to compare policies with other countries for international optimization references.
Data availability statement
The original contributions presented in the study are included in the article/Supplementary Material, further inquiries can be directed to the corresponding author.
Author contributions
YH: Conceptualization, Writing – original draft. YX: Data curation, Investigation, Methodology, Project administration, Software, Supervision, Visualization, Writing – review and editing.
Funding
The author(s) declare that financial support was received for the research and/or publication of this article. This research was supported by the Major Program of the National Social Science Foundation of China (Grant No. 22VMZ006); the Fundamental Research Funds for the Central Universities, HUST: No. YCJJ20252202; the Fundamental Research Funds for the Central Universities, HUST: No. 2025JYCXJJ012.
Conflict of interest
The authors declare that the research was conducted in the absence of any commercial or financial relationships that could be construed as a potential conflict of interest.
Generative AI statement
The author(s) declare that no Generative AI was used in the creation of this manuscript.
Any alternative text (alt text) provided alongside figures in this article has been generated by Frontiers with the support of artificial intelligence and reasonable efforts have been made to ensure accuracy, including review by the authors wherever possible. If you identify any issues, please contact us.
Publisher’s note
All claims expressed in this article are solely those of the authors and do not necessarily represent those of their affiliated organizations, or those of the publisher, the editors and the reviewers. Any product that may be evaluated in this article, or claim that may be made by its manufacturer, is not guaranteed or endorsed by the publisher.
Supplementary material
The Supplementary Material for this article can be found online at: https://www.frontiersin.org/articles/10.3389/fenvs.2025.1666299/full#supplementary-material
References
Blei, D. M., Ng, A. Y., and Jordan, M. I. (2003). Latent dirichlet allocation. J. Mach. Learn. Res. 3, 993–1022. doi:10.5555/944919.944937
Chu, Z., Cheng, M., and Yu, N. N. (2021). A smart city is a less polluted city. Technol. Forecast Soc. Chang. 172, 121037. doi:10.1016/j.techfore.2021.121037
Das, D. K. (2024). Exploring the symbiotic relationship between digital transformation, infrastructure, service delivery, and governance for smart sustainable cities. Smart Cities 7, 806–835. doi:10.3390/smartcities7020034
Gong, J., Shi, L., Deng, J., Xie, W., Liao, S., Xia, O., et al. (2025). Quantitative evaluation of two-way referral policies based on PMC index model. Int. J. Equity Health 24, 8. doi:10.1186/s12939-024-02373-3
Jelodar, H., Wang, Y., Yuan, C., Feng, X., Jiang, X. H., Li, Y., et al. (2019). Latent dirichlet allocation (LDA) and topic modeling: models, applications, a survey. Multimed. Tools Appl. 78, 15169–15211. doi:10.1007/s11042-018-6894-4
Jiaming, W., Ling, J., Yiyi, W., Peng, W., and Lei, H. (2024). Diffusion of “dual carbon” policies among Chinese cities: a network evolution analysis. Energy 300, 131514. doi:10.1016/j.energy.2024.131514
Katherine, G. C., Patrick, M. S., and Sherri, M. C. (2022). Sanitation criteria: a comprehensive review of existing sustainability and resilience evaluation criteria for sanitation systems. Environ. Sci. Technol. Lett. 9, 583–591. doi:10.1021/acs.estlett.2c00267
Kenneth, B., and Peter, N. (2018). Environmental policy assessment and the usefulness of meta-analysis. Socio-Economic Plan. Sci. 31, 231–240. doi:10.1016/S0038-0121(96)00034-1
Klaus, G., Florian, S., and Thomas, W. (2024). Environmental policies and directed technological change. J. Environ. Econ. Manag. 124, 102916. doi:10.1016/j.jeem.2023.102916
Li, J., and Xu, L. (2025). City brand and urban environmental sanitation: evidence from the national civilized city in China. Front. Environ. Sci. 13, 1575303. doi:10.3389/fenvs.2025.1575303
Liao, H. (2024). Design and implementation of address text completion system based on text similarity technology. Inf. Rec. Mater. 25, 73–75. doi:10.16009/j.cnki.cn13-1295/tq.2024.10.021
Ma, Y., Su, N., and Tu, T. (2023). Urban public space quality evaluation methods and practices in China. SAGE Open 2:2 (1), 275412312311660. doi:10.1177/21582440231166095
Ming, Z., Ying, Y., Panpan, D., Jiancheng, W., Yaoyao, W., Qin, J., et al. (2024). The effect of public environmental participation on pollution governance in China: the mediating role of local governments' environmental attention. Environ. Impact Assess. Rev. 104, 107345. doi:10.1016/j.eiar.2023.107345
Smith, H. J., Pettigrew, T. F., Pippin, G. M., and Bialosiewicz, S. (2012). Relative deprivation: a theoretical and meta-analytic review. Personal. Soc. Psychol. Rev. 16, 203–232. doi:10.1177/1088868311430825
Sruthi, K. V., and Mohammed, F. C. (2020). Regional urban environmental quality assessment and spatial analysis. J. Urban Manag. 9 (9), 191–204. doi:10.1016/j.jum.2020.03.001
Sun, Y., Cai, Y., and Xie, J. (2024). Quantitative evaluation of cultivated land protection compensation policy based on PMC index model. Resour. Environ. arid areas 38, 1–12. doi:10.13448/j.cnki.jalre.2024.239
Taedong, L., and Martin, P. (2015). Comprehensive local climate policy: the role of urban governance. Urban Clim. 14, 566–577. doi:10.1177/10780874251293785
Vardoulakis, S., Dear, K., and Wilkinson, P. (2016). Challenges and opportunities for urban environmental health and sustainability: the HEALTHY-POLIS initiative. Environ. Health 15, S30. doi:10.1186/s12940-016-0096-1
Wenting, M., Martin, D. J., Mark, D. B., and Rui, M. (2021). Mix and match: configuring different types of policy instruments to develop successful low carbon cities in China. J. Clean. Prod. 282, 125399. doi:10.1016/j.jclepro.2020.125399
Xu, H., Wang, S. Q., and Lei, L. (2025). Does institutional innovation improve environmental performance? A quasi-natural experiment based on China’s service trade innovative development pilot policy. Front. Environ. Sci. 13, 1522197–17. doi:10.3389/fenvs.2025.1522197
Yang, Z., Kun, Z., Cong, L., Li, F., and Xu, B. (2023). Influence of the perceived neighborhood environment on paying for domestic waste management services in rural China: evidence from the Xiangtan prefecture. Util. Policy 85, 101658. doi:10.1016/J.JUP.2023.101658
Yi, M., Liu, Y., Sheng, M. S., and Wen, L. (2022). Effects of digital economy on carbon emission reduction: new evidence from China. Energy Policy 171, 113271. doi:10.1016/j.enpol.2022.113271
Zhao, X. (2025). Peking university treasure. Available online at: https://www.pkulaw.com (Accessed June 6, 2025).
Zhou, B., and Ding, H. (2023). How public attention drives corporate environmental protection: effects and channels. Technol. Forecast. Soc. 191, 122486. doi:10.1016/j.techfore.2023.122486
Keywords: urban appearance, public environmental sanitation policies, quantitative evaluation, thematic analysis, consistency index model
Citation: Hu Y and Xu Y (2025) Quantitative evaluation of urban appearance and public environmental sanitation policies in China: based on LDA-PMC model. Front. Environ. Sci. 13:1666299. doi: 10.3389/fenvs.2025.1666299
Received: 18 July 2025; Accepted: 13 October 2025;
Published: 24 October 2025.
Edited by:
Khululekani Ntakana, University of Johannesburg, South AfricaReviewed by:
Watcharin Joemsittiprasert, New York Institution for Continuing Education, United StatesQuansheng Wang, Shandong University, China
Copyright © 2025 Hu and Xu. This is an open-access article distributed under the terms of the Creative Commons Attribution License (CC BY). The use, distribution or reproduction in other forums is permitted, provided the original author(s) and the copyright owner(s) are credited and that the original publication in this journal is cited, in accordance with accepted academic practice. No use, distribution or reproduction is permitted which does not comply with these terms.
*Correspondence: Yingda Xu, ZDIwMjQ4MTgwNUBodXN0LmVkdS5jbg==