 Victor Hugo Ramirez-Builes1*
 Andres Mauricio Villegas2
 Miguel Angel Agudelo2Juan Camilo Sotelo2Kelly Moriano2
 Petra Junklewitz1
- 1Center for Plant Nutrition and Environmental Research Hanninghof, Yara International, Dülmen, Germany
- 2Local Partners Foundation-Cafeexport, Manizales, Colombia
Introduction: Global coffee production is increasingly vulnerable to climate change and variability, particularly nitrogen (N) losses via ammonia volatilization (NH3) and nitrate (NO3−) leaching. Improved N management could mitigate these losses, yet field-level evidence under ENSO-driven climate variability remains limited. We aimed to quantify N losses via leaching and volatilization under two contrasting fertilization programs in a Colombian coffee plantation and assess their sensitivity to El Niño/La Niña-Southern Oscillation (ENSO) phases.
Methods: A field experiment was conducted from 2022 to 2024 in the Central West coffee region of Colombia. N leaching was monitored using drainage lysimeters, and NH3 volatilization was measured with semi-open static collectors. This study spanned two ENSO phases La Niña (2022–mid-2023) and El Niño (mid-2023–2024). Two fertilization programs were evaluated: a urea-based NPK blend (UB-NPK), an ammonium-nitrate-based NPK (ANB-NPK), and a no-N control.
Results: Nitrogen losses were significantly influenced by both fertilizer type and climate phase. During La Niña (negative ENSO phase), leaching was dominant loss pathway, with no significant differences between treatments. During El Niño (positive ENSO phase), NH3 volatilization became the dominant loss mechanism, with significantly higher losses in the UB-NPK treatment. Cumulatively, after 2 years and six fertilizations, mean N losses were 36.7% for UB-NPK and 13.1% for ANB-NPK of the total N applied.
Discussion: ENSO-driven climate variability alters nitrogen loss dynamics in coffee systems. Urea-based fertilizers resulted in greater losses under El Niño conditions, while ammonium-nitrate-based blends showed improved N retention. These findings highlight the potential of fertilizer type selection as a mitigation strategy under variable climate conditions.
1 Introduction
Coffee has 103 species (Davis et al., 2006); however, two are the most planted, Coffea arabica L (Arabica coffee) and Coffea canephora Pierre (Robusta coffee). Currently 60% of the global market share is Arabica coffee, and 40% Robusta coffee (Shister, 2024). Coffee is highly susceptible to climate change and variability, which is projected to reduce suitable cultivation areas by 40%–75% across Asia, Africa, and the Americas over the next 30 years (Camargo, 2010; Bunn et al., 2015; Ovalle et al., 2015; Grüter et al., 2022). The Climate Change has the potential to slash Arabica coffee production by a staggering 45.2%, while global Robusta production could suffer a 23.5% decline (Dzebo and Adams, 2022). These reductions are mainly due to increasing climate variability, particularly associated with the El Niño/La Niña-southern Oscillation (ENSO) (Goddard and Gershunov, 2020; Trenberth, 2020; Yang et al., 2018), which causes strong changes in annual temperatures, prolonged dry seasons, and erratic rainfall (Grüter et al., 2022).
The reduction in suitable areas for coffee production warrants the implementation of mitigation strategies to support existing production zones and reduce greenhouse gas (GHG) emissions from the sector. GHG emissions arise from fertilizer production and use, contributing between 2% and 5% of the total emissions (IPCC, 2014; Gao and Serrenho, 2023). The most prevalent GHG emissions are in the form of nitrous oxide-N2O, methane- CH4 and carbon dioxide-CO2, accompanied by high emissions of ammonia-NH3 (Walling and Veneeckhaute, 2020), At field level, N2O being directly produced through nitrification and denitrification of the mineral fertilizers in the field (Pesek et al., 1971). Additionally, N2O is indirectly emitted from nitrate leaching and ammonia volatilization, as both forms of nitrogen loss can be partially converted to N2O by soil microorganisms (Gao and Serrenho, 2023). It is estimated that agriculture is responsible for more than 80% of the anthropogenic emissions of N2O and 70% of anthropogenic NH3 emissions (Waling and Vaneeckhaute, 2020).
Nitrogen is a critical macronutrient for the growth and development of coffee plants (Coffea spp.), and it’s the most demanded followed by potassium and calcium, influencing both vegetative and reproductive phases (Carr et al., 2020; Bruno et al., 2020; Favarin et al., 2021; Sadeghian, 2022). It also plays a key role in enhancing abiotic stress tolerance (Ramirez et al., 2024). Nitrogen from mineral or organic fertilizers, as well as from biological fixation and atmospheric deposition, is not fully absorbed by plants. A large proportion is either incorporated into soil organic matter, adsorbed onto clay particles, volatilized as NH3, emitted as N2O during nitrification and denitrification, or lost through leaching and surface runoff (Di and Cameron, 2002; Harman et al., 2007; Jaramillo, 2003). Low fertilizers-N recovery efficiency (FNRE) values of 6%–29% in coffee have been reported (Salamanca et al., 2017a), Therefore efficient nitrogen use remains a major challenge in sustainable coffee crop production (Salamanca et al., 2017b; DaMatta et al., 2018; Busato et al., 2022; Ramirez et al., 2023).
From the soil perspective, the dominant N form in the soil is NO3− (Tisdale et al., 1985; Harman et al., 2007; Sadeghian, 2022), while all the mineral N applied in ureic and/or NH4 form need to be transformed trough amonification and nitrification to NO3−. From the physiological and agronomical perspective, coffee plants growth better when a balance between NH4-N:NO3-N exist in the soil with optimun proportion between 50% NH4-N:50% NO3-N to 15% NH4-N:85% NO3-N (Carr et al., 2020; Ramirez et al., 2024). Excesive NH4 in the soil solution induce excesive protons production by the roots increasing rhizosphere accidification (Tisdale et al., 1985; Marschner, 2012), while under mixed N nutrition, the protons generated by NH4+ assimilation can be used for NO3− reduction; therefore, it is easier for plants to regulate their intracelullar pH when both form of N are suplied (Hawkesford et al., 2012; Ramirez et al., 2024).
Ammonia (NH3) volatilization and NO3− leaching are the most important N losses in coffee production systems (Leal et al., 2007; Cannavo et al., 2013; Gonzalez et al., 2015; Chagas et al., 2019; Sarkis et al., 2023). Among nitrogen sources, urea is the most widely used in coffee cultivation due to its low cost per unit of N and high N concentration (Salamanca et al., 2017a; Chagas et al., 2019). It is the preferred N source in major coffee-growing regions (Ferrão et al., 2012; Matiello et al., 2010; Sadeghian and González, 2012; Sadeghian and Duque, 2019; Wilson, 1999). However, urea is associated with significantly higher ammonia volatilization compared to other N sources such as ammonium sulfate, ammonium nitrate, or nitrate-based fertilizers (Chagas et al., 2019; de Souza et al., 2023; Fenilli et al., 2008; Freitas et al., 2022; Gonzalez et al., 2015; Leal et al., 2007; Tiemann et al., 2018).
Nitrate leaching is the second most significant N loss, regardless of the mineral N source. Leaching is influenced by soil type, production system (e.g., monoculture or agroforestry), soil moisture, and climatic conditions (Bortolotto et al., 2012; Harman et al., 2007; Pivotto et al., 2012; Sarkis et al., 2023; Tully et al., 2012). Improving nitrogen use efficiency (NUE) by reducing nitrogen loss is essential to optimize fertilizer application and mitigate environmental impacts (Barłóg, 2023) including direct and indirect GHG (Gao and Serrenho, 2023).
Fluctuations in rainfall, temperature, and soil moisture influence nitrogen dynamics in the soil, altering the rates of mineralization, nitrification, and denitrification (Tisdale et al., 1985; Rawat et al., 2022). In the Central-west Colombian coffee region has been reported changes on the rainfall patterns, solar radiation and soil moistures under El Niño/La Niña-southern Oscillation -ENSO (Guzman and Baldión, 1997; 1999; Peña et al., 2012; Ramirez and Jaramillo, 2009; Garcia et al., 2023), but do not exist scientific evidence of the influence of ENSO fluctuations over nitrogen losses by volatilization and leaching comparing different N sources. We aimed to measure the influence of climatic variability on N losses through leaching and volatilization under two different mineral fertilization programs in coffee under climate variability El Niño/La Niña-southern Oscillation (ENSO) conditions.
2 Materials and methods
2.1 Study site
Between 2022 and 2024, a field trial was conducted on a commercial coffee farm in the central-west coffee region of Chinchiná, Caldas, Colombia (04°56′N, 75°36′W; 1,400 m elevation). The site has a mean air temperature of 20.4 °C, average relative humidity of 79.3%, and annual rainfall of 2,350 mm (Table 1). According to the USDA Soil Taxonomy, the dominant soil type at the study site is an Andisol, specifically classified as a Typic Melanudand (González, 2013). This soil is characterized by low natural fertility, with a pH of 4.67, 10.56% organic matter, and 8.44 mg kg-1 of available P. Exchangeable cation levels were 0.24, 0.93, and 0.24 cmolc kg-1 of K, Ca, and Mg, respectively. The soil texture consisted of 54% sand, 29% silt, and 17% clay.
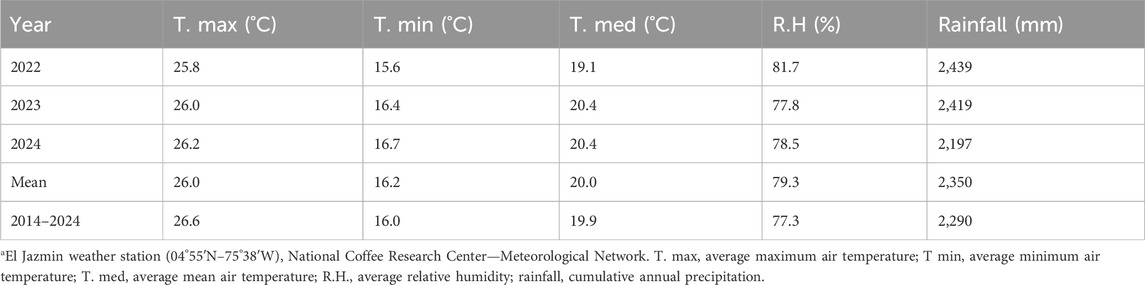
Table 1. Climate conditions obtained from the weather station El Jazmina.
Soil pH was measured in water (1:1), organic matter via the Walkley–Black method, P using Bray-II extraction, and exchangeable K, Mg, and Ca by 1 N ammonium acetate (pH 7.0). Cation concentrations were determined by ICP (Perkin Elmer, Optima 8000, Shelton, CT, USA), and particle size distribution was assessed using the Bouyoucos hydrometer method.
The study area was planted with Coffea arabica L. Var Castillo®, established in 2012 under full sun at a planting density of 6,666 plants ha-1, with 1.0 m between plants and 1.5 m between rows. Prior to the trial, the plantation was stem-pruned to 30 cm in height in January 2021 to rejuvenate the stand and initiate a new production cycle.
2.2 Experimental design
To evaluate the impact of different mineral fertilizer forms on nitrogen losses via leaching and ammonia volatilization, two fertilization programs were evaluated: a) a physical NPK fertilizer blend based on urea—the most used nitrogen source among coffee farmers (UB-NPK), and b) a chemical compound NPK blend based on ammonium nitrate (ANB-NPK), formulated with 20% less N. Mineral fertilization was broadcasting applied, over the canopy projection into the each of the lysimeters.
Additionally, a control treatment without N was included, but phosphorus, potassium, magnesium, and sulfur were applied using single nutrient sources: muriate of potash (60% K2O), calcium phosphate (40 P2O5, 26% CaO), and magnesium sulfate (27% MgO, 22% S).
This trial was embedded within a long-term experiment established in 2018 to test the hypothesis that ANB-NPK, with 20% less N and enriched with soluble calcium and micronutrients, would improve NUE and reduce the carbon footprint of coffee production without compromising yield, compared to the urea-based NPK fertilizer commonly used by farmers. Results from the ongoing study (publication in progress) indicate that the AN-NPK program-maintained coffee yields over 6 years, did not alter soil N stocks, significantly improved NUE, and reduced the CFP.
We aimed to quantify N losses from both fertilization strategies over 2 years with contrasting climate conditions influenced by ENSO variability.
From August 2022 to August 2024, 12 drainage lysimeters were installed in the field to monitor water percolation and N leaching across the two fertilization treatments and the control without N, which received only PK fertilization (Table 2).
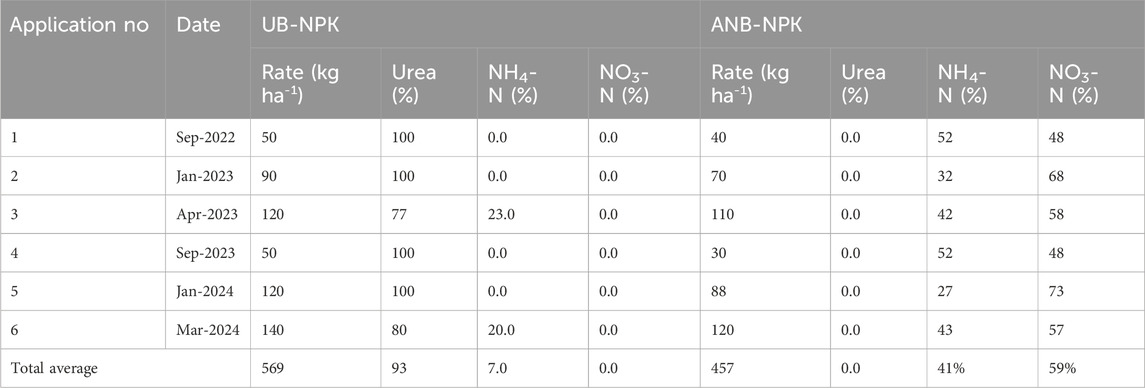
Table 2. Nitrogen rates and forms for two mineral fertilization programs for 2 years.
2.3 Leaching evaluation
Water percolation and nitrogen leaching were measured using drainage-type lysimeters (Ramirez et al., 2011; Howell, 2005), consisting of round polyethylene containers with a depth of 1.0 m and an exposed soil surface area of 0.22 m2. Each lysimeter was equipped with a bottom stopcock to collect percolated water. The drainage system consisted of a 0.2 m layer of coarse gravel at the bottom, followed by a 0.2 m layer of medium gravel, then a 0.2 m layer of fine gravel, all covered with a geotextile drainage mesh. A 0.2 m layer of stockpiled soil was placed above the drainage layers, in reverse order of excavation. In the remaining 0.2 m at the top, a coffee plant was transplanted along with its undisturbed root zone, carefully extracted to preserve root integrity. C. Arabica var. Castillo® has 86% of its root system distributed within the top 25 cm of soil and 25 cm around the stem (Rendon and Giraldo, 2019).
Twelve lysimeters (four replicates per treatment across tree treatments) were installed in the middle of the coffee plantation to maintain natural microclimatic conditions. Four lysimeters were equipped with rain gauges placed beneath the coffee canopy to measure net rainfall—precipitation that reaches the fertilized soil surface. An additional lysimeter without a coffee plant was installed to measure external (open-field) rainfall and corresponding percolation.
At installation, soil samples were collected at 0–20 and 20–40 cm depths to estimate baseline nitrogen stocks, with a total N of 641,7 mg.100 g-1, 1.85% NO3-N and 0.15% NH4-N in the 0–20 cm and 350 mg.100 g-1, 0.68% NO3-N and 0.18% NH4-N in the 20–40 cm (Supplementary Material S1) 3) and assess soil physical parameters with a mean bulk density 0.79 g.cm-3; porosity 69.5%; volumetric soil moisture at field capacity 0.39 m3. m-3; and volumetric moisture content at wilting point 0.19 m3. m-3 (Suplemental Material 2). Rainfall was recorded daily, and water percolation through the first 40 cm of soil was measured weekly. The collected leachate samples were analyzed for N concentration in the forms of ammonium (NH4-N) and nitrate (NO3-N) using photometry based on colorimetric methods specific to each nitrogen species.
Ammonium was quantified using a mid-range photometer (HI 97715, Hanna Instruments, Italy) using the Nessler method, which forms a yellow-colored complex in the presence of free ammonia (via K2HgI4 in alkaline solution). The device was calibrated for a detection range of 0.00–10.00 mg/L of ammoniacal nitrogen. Nitrate was measured using the HI 97728 photometer (Hanna Instruments, Italy) and the cadmium reduction method. This procedure involves the reduction of nitrate (NO3−) to nitrite (NO2−) using a cadmium-based reagent, followed by a diazo-coupled reaction in an acidic medium. In the second stage, the resulting nitrite reacts with sulfanilic acid to form a diazonium salt, which is subsequently coupled with an aromatic compound—usually N-(1-naphthyl) ethylenediamine—to form a pink-colored azo complex. The color intensity is proportional to the nitrate concentration in the sample, with a detection range of 0.0–30.0 mg L-1 of NO3-N. For both ammonium and nitrate analyses, 1 mL aliquots of each field-collected sample were diluted to a final volume of 10 mL with deionized water in 24.6 mm diameter round cuvettes, ensuring optimal conditions for accurate photometric measurement.
For each lysimeter, the cumulative leaching (CLi) of NH4-N and NO3-N was calculated as the sum of nitrogen losses over time using Equation 1:
where V is the volume of drainage water collected from the lysimeter base for each weekly interval and CN is the N concentration in the solution from the leachate (Wang et al., 2012).
2.4 Ammonia volatilization
Ammonia volatilization (NH3) was measured starting from the second fertilizer application using a semi-open static PVC collector with a diameter of 0.150 m and a height of 0.385 m (Marshall and Debell, 1980; Lara et al., 1999; Freitas et al., 2022). The NH3 absorber consisted of polyethylene-laminated foam discs (15.5 cm diameter, 2 cm thickness, and 0.02 g cm-3 density). Two foam discs were used per collector—one positioned 15 cm and the other 30 cm above the soil surface—to reduce environmental contamination. Collectors were mounted on three metal rods and covered by a semi-open cap positioned 10 cm above the PVC tube to facilitate gas movement. Before deployment, foam discs were soaked in approximately 70 mL of 0.5 N sulfuric acid with 3% glycerol (v/v), packed in plastic bags, and stored in a freezer to prevent ambient NH3 contamination.
Collectors were installed over lysimeters, directly beneath the coffee canopy, coinciding with fertilizer application zones. A total of 12 collectors were used—four replicates per treatment across three treatments.
The amount of fertilizer applied per hectare was divided by the plant density to calculate the N rate per plant. This rate was then adjusted to the lysimeter area and corrected for the surface area of the NH3 collector base. Foam samples were collected at the following intervals after each fertilization: 1, 2, 3, 5, 9, 14, 20, and 28 days. Sampling was conducted over 2 years, covering five fertilization events.
The foam discs were extracted by rinsing them with approximately 800 mL of deionized water. From the extracts, 10 mL aliquots were analyzed immediately to minimize potential physicochemical alterations that could affect ammonia stability in solution. Ammonia nitrogen concentrations (NH+3) were determined using a mid-range photometer (HI 97715, Hanna Instruments) based on the Nessler method.
The values obtained for each collector were normalized to the area of the collector base and then extrapolated to represent NH3 losses per m2. Cumulative losses were calculated by summing the measured losses at each sampling point over the 28-d period following each fertilizer application.
A daily water balance was estimated using the methodology described by Ramírez et al. (2010) for coffee.
2.5 Statistical analysis
Cumulative leaching and volatilization data between application intervals were analyzed using a completely randomized design with four replicates. All data were subjected to analysis of variance (ANOVA) based on the experimental design. Statistical analyses were conducted using Statgraphics Centurion Version XV (Statgraphics Technologies, Inc., Plains, VA, USA) and InfoStat version 2012 software packages (Di Rienzo et al., 2012). To ensure the validity of the results, data were tested for normality and homogeneity of variance. Mean comparisons were performed using Fisher’s LSD test at a 5% significance level.
2.6 Climate variability events
The climate variability events considered in this study were associated with sea surface temperature changes in region 3.4 of the Pacific Ocean, as defined by ENSO, described by Trenberth (1997). These events are monitored by the Climate Prediction Center of the US National Oceanic and Atmospheric Administration through the Oceanic Niño Index (ONI). El Niño conditions are indicated when the ONI is +0.5 °C or higher, reflecting warmer-than-average sea surface temperatures. La Niña conditions are indicated when the ONI is −0.5 °C or lower, reflecting cooler-than-average temperatures. During the study period, both phases were observed: a cooler period (La Niña) occurred from December 2021 to January 2023, and a warmer period (El Niño) occurred between May 2023 and April 2024 (Table 3).
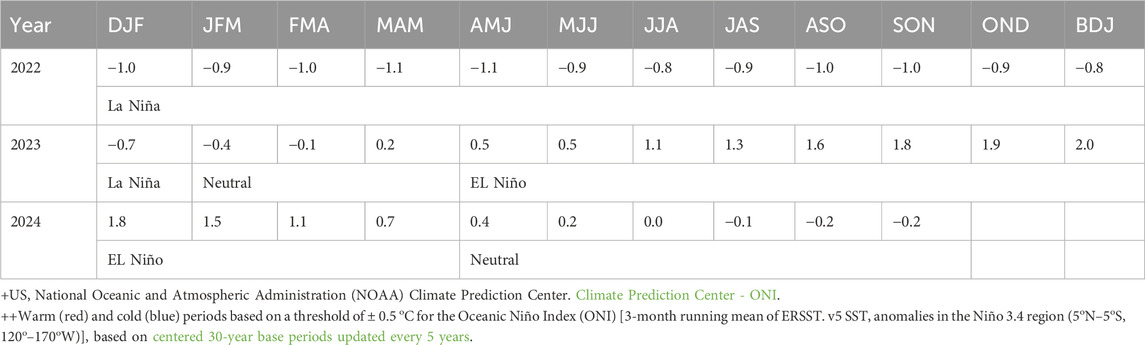
Table 3. Ocean Niño Index during 2022–2024 indicates the climate variability conditions.
3 Results
3.1 Influence of the climate variability on the rainfall distribution and soil moisture in coffee plantations
To analyze the effect of climate variability generated by oceanic-atmospheric El Niño/La Niña-ENSO events during comparable periods, the rainfall, net rainfall, and percolation data obtained from the lysimeters were grouped by quarters. The greatest differences between climate variability events were observed in the January–March quarters. In 2023, under La Niña conditions, rainfall reached 863 mm–2.7 times higher than in 2024 under El Niño conditions (322 mm). This disparity resulted in significant differences in percolation: 171 mm in 2023 versus 0 mm in 2024 (Table 4).
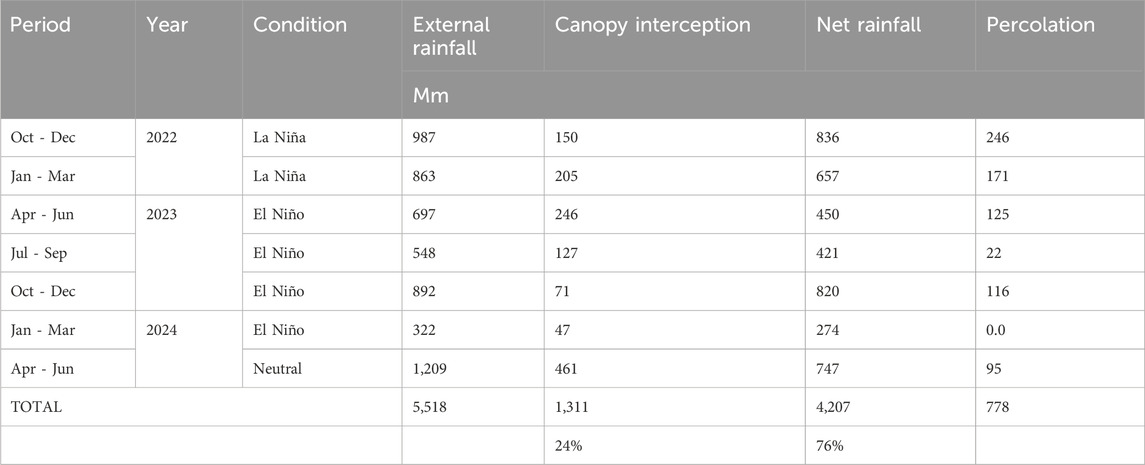
Table 4. Rainfall distribution during the 2-year trial period under La Niña and El Niño (ENSO) conditions.
Similarly, during the October–December quarters of 2022 (La Niña) and 2023 (El Niño), although rainfall decreased by 10%, the impact on percolation was more pronounced. Percolation was 2.1 times lower under El Niño, decreasing from 246.3 mm to 116.4 mm.
After each rainfall event, a redistribution of water was observed within the coffee canopy. Of the total 5,518 mm of rainfall recorded over the 2-year study period, 24% was intercepted by the plant canopy, while 76% reached the soil surface beneath the coffee trees as net rainfall (Table 4). A linear relationship was observed between external and net rainfall (Figure 1). Of the 4,207 mm recorded as net rainfall, 778 mm percolated to a soil depth of 40 cm, representing 18.5% of the net rainfall (Table 4).
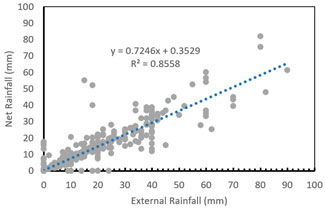
Figure 1. Relationship between external rainfall and net rainfall.
Changes in Pacific Ocean surface temperature in region 3.4, which determine ENSO phases, directly influenced rainfall quantity and distribution, as well as soil moisture levels in the study area (Figure 2A). Generally, reductions in rainfall and soil moisture were recorded from January to March and from July to August. These reductions were more severe during El Niño conditions than during La Niña or neutral periods.
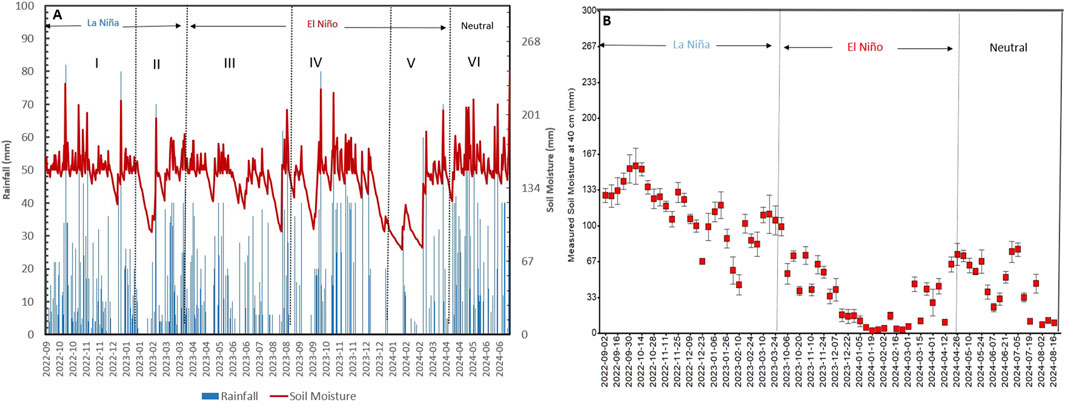
Figure 2. Influence of climate variability on: (A) daily rainfall and calculated soil moisture by the water balance method. Numbers indicate mineral fertilization events. (B) measured soil moisture in lysimeters under two different mineral fertilization programs: ammonium-nitrate-based compound NPK (ANB-NPK) and urea-based NPK blend (UB-NPK).
From September 2022 to March 2023, under La Niña conditions, total water content measured at a 40 cm soil depth average over 90 mm, with only brief reductions during December and March—months historically associated with dry conditions due to the movement of the Intertropical Convergence Zone (ITCZ), which governs the region’s wet and dry seasons (Figure 2B). In contrast, from October 2023 to April 2024, under El Niño conditions, volumetric soil moisture at 40 cm depth dropped nearly to zero (Figure 2B). The most severe reductions occurred between December 2023 to March 2024, historically dry months further exacerbated by El Niño conditions.
3.2 Influence of climate variability and two mineral fertilization programs on nitrogen leaching
The nitrogen leaching results during the six fertilization events were influenced by climate variability associated with ENSO. The greatest nitrogen leaching occurred after the first and second fertilizations (Figure 3) under La Niña conditions. After May 2023, from the third fertilization onwards, nitrogen leaching declined, reaching zero in the period from January to April 2024, when El Niño most strongly influenced hydrometeorological conditions, with reduced rainfall, soil moisture, percolated water, and leached nitrogen.
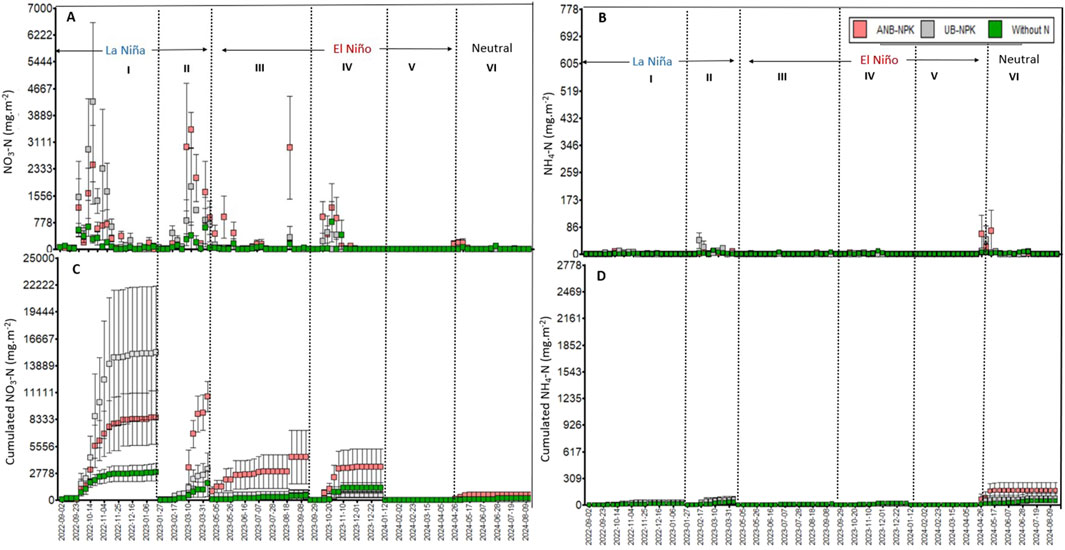
Figure 3. Nitrogen losses by leaching in coffee plantations under two climate variability conditions (La Niña/El Niño-ENSO) from September 2022 to August 2024, interacting with two different mineral fertilization programs: ANB-NPK and UB-NPK. Numbers indicate mineral fertilizer application periods. (A,B) Weekly leaching of NO3-N and NH4-N after mineral fertilizer application. (C,D) Cumulative nitrogen leaching of NO3-N and NH4-N during each mineral fertilization period.
Significant differences in N leaching between ANB-NPK and UB-NPK were found only during the second fertilizer application period; no differences were observed in later applications (Figure 3). In all samples, fertilized treatments lost significantly more N than the control (Figures 3A,C). Regardless of fertilizer type, 99% of leached N was in the form of nitrate-N (Figures 3A,C), and only 1% as ammonium-N (Figures 3B,D).
After the first fertilization under La Niña, the urea-based NPK fertilizer (UB-NPK) treatment leached 15,273 mg.m-2 of NO3-N, compared to 8570 mg.m-2 from the ammonium-nitrate-based NPK (ANB-NPK) between September 2022 and January 2023. Following the second fertilization (January–April 2023), ANB-NPK showed greater leaching than UB-NPK, with 10,730 and 3,258 mg.m-2, respectively, these being significantly different.
After the third and fourth fertilizations (April–September 2023 and September 2023–January 2024), N leaching remained low due to El Niño conditions beginning in June 2023. No significant differences were observed between fertilizer programs, with mean leaching of 4,441 and 3,414 mg N.m-2 for ANB-NPK, and 751 and 763 mg N.m-2 for UB-NPK in the fertilizer periods, respectively (Figure 3C).
No leaching occurred after the fifth fertilization (January–March 2024). During the sixth (March–August 2024), N losses were minimal: 730, 162, and 215 mg.m2 for ANB-NPK, UB-NPK, and the control without N, respectively.
A direct relationship was observed between weekly percolation and N leaching under both fertilizer programs (Figure 4). For every 10 mm of percolation in the top 40 cm of soil, 10% of applied N was lost through leaching (Figure 4B).
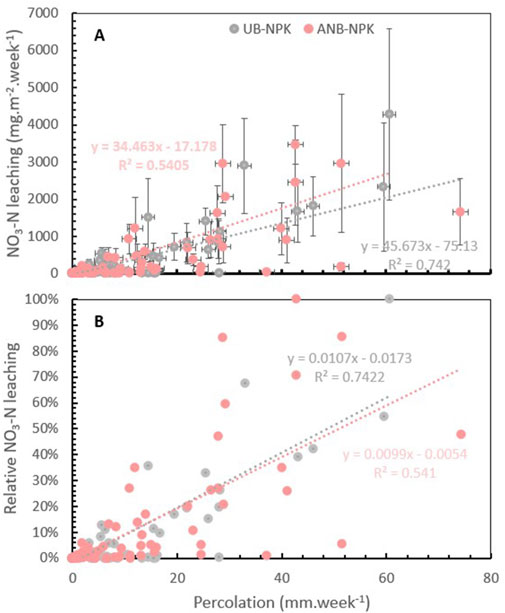
Figure 4. Relationship between water percolation and: (A) nitrogen (NO3-N) leaching, and (B) relative NO3-N leaching, comparing the ANB-NPK and UB-NPK.
3.3 Influence of climate variability and two mineral fertilization programs on nitrogen volatilization
Nitrogen volatilization was also affected by variable climatic conditions, but in the opposite pattern to that observed for leaching. The lowest N losses due to volatilization occurred during La Niña after the second and third mineral fertilization applications, corresponding to January–February and April–May 2023. Subsequently, N losses by volatilization increased dramatically, especially under El Niño after the fifth application in March 2024, as well as during the transition from El Niño to neutral conditions after the sixth fertilization in August 2024 (Figure 5). In all five fertilization periods, NH3-N volatilization was significantly higher in the UB-NPK treatments than in the AN-NPK treatment, which in all cases showed no significant differences in volatilization losses compared to the unfertilized control (Figure 5; Table 5).
Figure 5. Nitrogen losses by NH3-N volatilization in coffee plantations during two ENSO phases (El Niño/La Niña) from September 2022 to August 2024, under the two fertilization programs: ANB-NPK and UB-NPK. Numbers indicate mineral fertilizer application periods. (A) Nitrogen volatilization during the 28-d following fertilization. (B) Cumulative nitrogen volatilization over a 28-d period after each fertilization event.
Table 5. Nitrogen losses in coffee plantations comparing two mineral fertilizer programs influenced by El Niño/La Niña (ENSO) climate variability conditions.
Cumulative nitrogen volatilization losses under La Niña conditions for the UB-NPK treatment ranged from 14,545 to 14,595 mg m-2 for the second and third applications, reaching a maximum value of 48,219 mg m-2 under El Niño after the fifth fertilization, followed by 32,344 mg m-2 during the transition from El Niño to neutral conditions after the sixth mineral fertilization (Figure 5).
3.4 Influence of two mineral fertilizer programs under climate variability conditions on total nitrogen losses
Cumulative nitrogen losses by leaching for both mineral nutrition programs after six applications over 2 years were not significantly different but were significantly higher compared to the control without N application. The UB-NPK program exhibited significantly lower N loss due to leaching than the ANB-NPK program during the second fertilization period (January to April 2023). Regarding ammonia volatilization, the UB-NPK treatment showed, during all five evaluation periods, significantly higher cumulative NH3-N losses compared to the ANB-NPK and control treatments without N (Table 5). Total N losses for the UB-NPK treatment, calculated as the sum of leaching and volatilization, were highest during La Niña after the first fertilizer application and during El Niño after the fifth application. In the first case, total losses were dominated by leaching, whereas in the second, they were dominated by volatilization. Only after the second fertilizer application during La Niña did the ANB-NPK treatment show higher total losses—primarily from leaching—compared to UB-NPK.
Integrating the cumulative nitrogen losses after six mineral fertilization events during ENSO conditions, the fertilization program based on the UB-NPK showed a 36.7% loss, whereas the program based on ANB-NPK showed a 13.1% total N loss (Table 5).
4 Discussion
4.1 Climate variability influenced the rainfall patterns in the study region and N leaching
The fluctuation between rainy and dry periods is the primary expression of climate seasonality in the tropics and is directly linked to the meridional migration of the ITCZ. In Colombia, additional sources of climate variability interact with the ITCZ to define the rainfall distribution patterns, including the Choco low-level jet, the Caribbean jet, atmospheric rivers, the Andes mountain range, advection from the Amazon and Orinoco basins, and ENSO (Urrea et al., 2019). Latin America (LA) is bordered by the Pacific and Atlantic Oceans, and the region’s climate is largely influenced by prevailing sea-surface temperatures (SSTs) and associated large-scale ocean-atmosphere interactions such as ENSO. SST conditions in the central and eastern tropical Pacific are crucial for identifying the onset of El Niño and La Niña and their influence on climate extremes. The tropical Pacific and Atlantic are also essential influencers of LA climate variability, particularly in northern Peru and Ecuador, Amazonia, northeastern Brazil, and southeastern South America, and, during the hurricane season, in the tropical North Atlantic, eastern Mexico, and the Caribbean (WMO, 2024).
In Colombia’s Andean region, ENSO phases strongly influence hydrometeorological conditions, particularly rainfall distribution. During El Niño (positive ENSO phase), annual rainfall decreases by 10%–35%, whereas during La Niña (negative phase), it increases by 30%–50% (García et al., 2023; Guzmán and Baldión, 1997; 1999; Peña et al., 2012; Poveda et al., 2001; Ramirez and Jaramillo, 2006). Ramirez and Jaramillo (2009) found correlations between ONI and rainfall during the dry seasons (December–February and June–September) in Colombia’s central-western coffee region, where this study took place. Typically, El Niño lengthens the dry season, while La Niña shortens it (García et al., 2023; Peña et al., 2012; Ramirez and Jaramillo, 2009).
The multi-year La Niña event began in mid-2020 and ended in early 2023 (Table 3). SSTs in the eastern tropical Pacific subsequently rose, crossing the El Niño threshold by June. However, atmospheric conditions lagged, and El Niño was not fully established until early September. By late 2023, a strong El Niño had developed, with the ONI reaching 2 °C for the November 2023–January 2024—the highest value since the 2015/16 EL Niño event (WMO, 2024). This transition from La Niña to El Niño directly influenced rainfall in the study region: January–March 2023 saw 863 mm of rainfall (2.7 times higher) under La Niña, compared to 322 mm in the same period of 2024 under El Niño. These changes affected percolation, with 171 mm of water percolating between January and March 2023, and 0.0 mm during the same period in 2024 (Table 4). These changes between negative and positive ENSO conditions in the short term were also observed in the soil moisture distribution, with higher volumetric moisture content during La Niña and lower volumetric moisture content during El Niño (Figure 2).
4.2 Climate variability influenced the rainfall patterns in the study region and N leaching
Regardless of N source, N losses by leaching were directly correlated with rainfall (Figure 4), which was, in turn, influenced by climate variability, including ITCZ migration and ENSO. Soil NH+4 concentrations in tropical, subtropical, and temperate soils are generally low due to rapid conversion to NO3− (Di and Cameron, 2002; Harman et al., 2007; Sadeghian, 2022; Ramirez, et al., 2024; Sarkis et al., 2023). Within a month, most soil N is in the soil is in the form of NO3−, especially in soils with adequate pH, moisture, and temperature (Cantarella, 2023). Because NO3− is negatively charged and not retained by most soils, it becomes the dominant leached form of N (Di and Cameron, 2002). This pattern was observed in this study’s volcanic ash-derived Andosol, where 99% of N leached was as NO3−, and only 1% as NH4+, independent of the treatments evaluated UB-NPK or ANB-NPK—similar to Harman et al. (2007), who found 96% of N leached as NO3−in a Costa Rican Acrisol.
In coffee agroecosystems, nitrogen mineralization varies seasonally, reflecting rainfall. It is lowest during dry months and highest during wet months, with NO−3-N as the dominant form, independent of shade level or location (Babbar and Zak, 1994; Harman et al., 2007; López et al., 2015). Nitrate leaching occurs when soil NO3− accumulation coincides with or is followed by significant water percolation (Di and Cameron, 2002). Sources include fertilizers, effluents, and organic N mineralization (Addiscott, 1996). In our study, N leaching, independent of the N source, was directly correlated with water percolation (Figure 4A) and occurred mainly during the rainy season, as determined by ITCZ positioning. Additionally, water percolation was directly influenced by La Niña conditions, where rainfall was higher than that during El Niño or neutral conditions. In general, downward water transport below the root zone requires soil moisture to exceed field capacity and rainfall to exceed evapotranspiration (Lehmann and Schroth, 2003). This was reflected in the water balance and soil moisture data during La Niña and El Niño (Figure 2A), which paralleled N leaching behavior (Figure 3A).
In coffee, a perennial crop, cover cropping is uncommon. Thus, N leaching is more influenced by fertilizer inputs and moisture changes between dry and wet seasons, rainfall distribution, irrigation intensity, and climate variability, as shown in this study. Despite the greater availability of N for plant uptake in both shaded and unshaded coffee plantations in Costa Rica, relatively low N losses through leaching have been reported. Babbar and Zak (1994) documented annual leaching losses of only 0.9 and 2.4 g N m-2 year-1 in shaded and unshaded systems, respectively. In a separate study, Harman et al. (2007) reported NO3− leaching losses of 26.9 and 15.6 kg ha-1 yr-1 in unshaded coffee and coffee intercropped with eucalyptus, respectively, representing 15% and 8.7% of the total mineral N applied in an Acrisol in Costa Rica. In contrast, Cannavo et al. (2013) observed substantially higher N leaching losses, accounting for 54.6% of the total applied N (136.5 kg N ha-1) in a coffee agroforestry system (Coffea arabica–Inga densiflora) during 1 year with 2,678 mm of rainfall, measured in the top 60 cm of the soil profile.
In our study, N leaching losses ranged from 7 to 34 kg ha-1 per fertilizer application for the UB-NPK treatment and from 24 to 34 kg ha-1 for the ANB-NPK treatment during La Niña conditions. In contrast, losses were nearly zero under El Niño conditions for both N sources. Over the 2-year study period, encompassing six fertilizer applications, cumulative nitrogen losses by leaching totaled 45 and 61 kg N ha-1 for UB-NPK and ANB-NPK, respectively, corresponding to 8% and 13% of the total N applied (Table 5).
In Brazil, Pivotto et al. (2012) investigated N leaching in coffee cultivation on Typic Hapludox soil (“Latossolo Vermelho-Amarello”) under rainfed and irrigated conditions. They compared two mineral N application rates—400 and 800 kg N ha-1 yr-1—and reported leaching losses of 12 kg N ha-1 and 88.4 kg N ha-1 under rainfed conditions, respectively. These losses represented 3.0% and 11.0% of the total N applied. Comparable losses—3.1 and 11.4%—were also observed in treatments that received irrigation during the dry season.
Similarly, under rainfed conditions, Fenilli et al. (2008) studied N leaching in coffee grown on Typic Rhodudalfs soils (“Nitossolo Vermelho Eutroférrico”) using ammonium sulfate as the N source. They found total leaching losses at 1 m soil depth equivalent to 2.3% of the applied N in the first year (6.5 kg of 280 kg N ha-1) and 1.7% in the second year (10.5 kg of 350 kg N ha-1). These relatively low losses were attributed to modest rainfall amounts during the study—1,342 mm and 1,118 mm in the first and second years, respectively.
More recently, Sarkis et al. (2023) evaluated N leaching under varying N rates and sources in Minas Gerais, Brazil, with an average precipitation of 1,493 mm. They reported increasing N leaching with higher application rates, reaching the greatest losses at the optimal rate of 400 kg N ha-1 yr-1. Leaching varied significantly by N source, with average losses of 1.2% for ammonium nitrate, 11.5% for urea, and 13.0% for urea with a urease inhibitor.
All published field-level studies cited here that measured N leaching losses in coffee agroecosystems used porous ceramic cups. Researchers calculated total NO3− leaching losses using a water balance approach and/or models simulating water movement in the vadose zone. Lysimeters provide an intermediate-scale method that bridges laboratory and field scales. Their main advantages include the ability to measure total leaching losses from a known sample volume, accommodate a larger soil volume than suction cups, represent the soil pore network more accurately, and expose samples to ambient climate conditions. Lysimeters typically contain undisturbed soil (Wang et al., 2012). In this study, lysimeters enabled the monitoring of leaching across the entire root zone of single coffee trees.
Rainfall interception by the canopy plays a critical role in water movement within coffee agroecosystems by determining the net rainfall reaching the soil. As a key factor in hydrological studies of forests and agroecosystems, interception has been widely studied across different regions (Gash, 1979; Dykes, 1997; Bruijnzeel, 1997; Gash et al., 1995; Jaramillo and Chaves, 1999; Leuning et al., 1994; Lloyd et al., 1998; Niu et al., 2023; Ramirez and Jaramillo, 2006; Rutter, 1975; Tully et al., 2012). In this study, 24% of the total rainfall over 2 years was retained by the coffee canopy, while 76% reached the soil surface. In Costa Rica, Harmand et al. (2007) reported 15% interception by the coffee canopy, and Tully et al. (2012) found 18% in agroforestry systems with C. arabica and Erythrinia poeppigiana. In Colombia, interception rates in different coffee production systems ranged from 10% to 58% (Jaramillo, 2003; Ramirez and Jaramillo, 2006; Velásquez and Jaramillo, 2009). Therefore, in many cases, calculating N leaching losses using vadose zone functions can lead to overestimation, as rainfall retained by the canopy is not accounted for.
4.3 Soil acidity and N leaching
Solutes move not only with soil water, but also within it, in response to concentration gradients (Hillel, 1998). At the same time react among themselves and interact with the solid matrix of the soil in a continuous cycling succession of interrelated physical and chemical process, these interactions involve and are strong influenced by such variable factors as acidity, temperature, oxidation-reduction potential, composition, and concentration of the soil solution (Hillel, 1998). The acid buffering capacity in soils with pH ranging from 4.5 to 7.5 is mostly influenced by CEC, which influence indirectly the nutrients availability and retention. Soils with higher CEC have more cation exchange sites to buffer protons in the soil solution, N deposition in soil reduce buffering capacity of the soil and increasing cation losses to the soil solution (Lieb et at. 2011). The surfaces charge number (SCN) determines the number of ions that can be adsorbed by soil, and the surface charge density plays a key role in the strength of absorption of these ions (Cao et al., 2024), both define the CEC of the soil (Tan, 2011).
The SCN of the permanently/variable charged soils and clay minerals decreases significantly with decreasing pH (Cao et al., 2024), increasing the risk of nutrient leaching. When NH4+ is applied to soil, it is adsorbed around soil particles through electrostatic attraction. The electric field surrounding soil particles determines the strength of the electrostatic attraction of NH4+, which in turn impacts the nitrification rate. The leaching of NO3− resulting from nitrification is also influenced by the strength of the electrostatic repulsion. The H+ produced during nitrification readily displaces base cations (e.g., Ca2+ and Mg2+) on clay particle surfaces. Consequently, the leaching of NO3− inevitably leads to the coupled migration of base ions due the principle of electrical neutrality, resulting in accumulation of H+ and decrease in base cations on soil particle surface (Cao et al., 2024), and finally increase on soil acidification, reducing the CEC and increasing the N leaching.
Jiang et al. (2011) working in a Pine forest Oxisol, at low pH (pH < 5.3) found high NH4+ activity and low ammonia-oxidizing bacterial (AOB) and archaeal (AOA) indicating nitrification inhibition at low soil pH, in our study the main N leaching was in a NO3− form, indicating that an a pH of 4.67 the nitrification process in this Andosol was not affected, even though it is considered variable charged soil (Figure 3). Xiong et al. (2010), in a permanent changed soil (pH = 6.7) after ammonium sulfate [(NH4)2SO4] application always caused higher NO3− concentration in terms of both total NO3− and fertilizers derived NO3−, in contrasting variable changed (pH = 5.5) soil showed distinctly different, with NH4+ dominating the total N leaching.
4.4 Climate variability and nitrogen volatilization
Important N gases emitted by human activities include nitrogen oxides (NOx), nitrous oxide (N2O), and ammonia (NH3). Of these gases, NH3 is emitted from many sources such as volatilization from animal waste and synthetic fertilizers, biomass burning (including forest fires), losses from soils under native vegetation, crops, emissions from human excreta, and fossil fuel combustion (Behera et al., 2013). Approximately 10%–40% of the N (in ammoniacal form as urea or ammonium sulfate) applied to soils (pH 4.1–7.7) is volatilized during the growing season. NH3 volatilization increases production costs and causes environmental concerns (He et al., 1999). The estimated global NH3 emission is between 70 and 92 Tg. a−1 (Luo et al., 2022). According to the European Environment Agency (Ammonia (NH3) emissions—European Environment Agency), NH3 contributes to acid deposition and eutrophication, which can lead to potential changes in soil and water quality. The subsequent impacts of acid deposition can be significant, including adverse effects on aquatic ecosystems in rivers and lakes, and damage to forests, crops, and other vegetation. Between 11% and 17% of the total estimated global NH3 emissions are related to the production and use of ammoniacal fertilizers (Behera et al., 2013). Based on the estimation from Luo et al. (2022) and taking an average from Behera et al. (2013) of 14%, these emissions from mineral fertilizers account for 9.8 to 12.6 million tons of NH3 emitted per year.
Ammonia volatilization depends on the balance between NH4+ ions and NH3 gas molecules on the soil surface. The predominance of either chemical form in the soil is a function of pH. In acidic soils (pH < 7), NH4+ prevails and is not transferred to the atmosphere. Thus, in acid soils, fertilizers containing NO3− or NH4+ are not prone to relevant losses by NH3 (Cantarella, 2023). However, during urea hydrolysis, H+ are consumed, alkalinizing the soil around the fertilizer and pushing the reaction equilibrium toward NH3 production. Soil pH increases around urea fertilizer granules, and NH3 formation occurs even in acidic soils (Cantarella, 2023; Freney et al., 1983). Ammonia volatilization from surface-applied fertilizers consists of a fast reaction that lasts approximately 2–14 days after fertilizer application, followed by a slow emission process during the rest of the incubation period. This fast reaction and peak of NH3 volatilization have been reported for different soil types and various agroecological conditions (Cantarella et al., 2003; Fenilli et al., 2007; He et al., 1999; Jantalia et al., 2012; Lara et al., 1997; Leal et al., 2007; Sadeghian and González, 2012; Stafanato et al., 2013; Rajkovich et al., 2017; de Souza et al., 2023), similar to the observations in this study during the second, third, and fourth mineral N applications (Figure 5) during the prevailing La Niña conditions with sufficient soil moisture and rain.
A different tendency was observed after the fifth mineral N application, where NH3 volatilization maintained a linear tendency during the 28 days of evaluation, resulting in NH3 losses of 65% of total N applied in UB-NPK compared to 6.1% in ANB-NPK (Table 5). This tendency can be explained by the low rainfall and soil moisture levels (Figure 2; Table 2) influenced by the positive phase of El Niño, which was also followed by an increase in the mean air temperature (Table 1). Cantarella et al. (2003) found higher NH3 volatilization rates in citrus orchards after urea application, followed by a period of 18 days without rainfall. Ammonia emissions were practically stopped by a rainfall event with 41 mm of precipitation. Similar effects are reported by Jantalia et al. (2012) in corn, where irrigation 1 day after N fertilization reduced NH3 losses from urea-based fertilizers to less than 4% of the applied N. Rochette et al. (2013) also observed a temporary reduction in volatilization rates following each water addition, resulting in lower NH3 losses in barley. In coffee, Freitas et al. (2022) reported NH3 losses from 40% to 90% due to low rainfall after urea application.
During El Niño conditions, rainfall intensity and frequency reduces, as well as mean air temperature and solar radiation increase (Guzmán and Baldión, 1997; Ramirez and Jaramillo, 2012; Ramirez et al., 2014), with this climatic conditions changes also the micro-climatic conditions into the coffee plantation changes, reducing volumetric soil moisture and increasing soil water deficit (Jaramillo, 2018; Ramirez and Kusters, 2021), with direct effect on the urea transformation. Urea hydrolysis is carried out by enzymes from the urease group, which are ubiquitous in soils, occur at higher concentrations in the presence of straw or crop residues (Cantarella, 2023; Mariano et al., 2012; Sarkis et al., 2023), and show higher activity at elevated temperatures (Cantarella, 2023). Urea dissolution and urea hydrolysis are, apart from soil characteristics as urease concentration and water retention, strongly governed by soil water content and soil temperature (Ni and Pacholski, 2022). When rainfall is low and/or soil moisture is sufficient to dissolve urea granules and activate urease, NH3 volatilization is high because moisture and rainfall are not sufficient to incorporate the fertilizer into the soil (Cantarella, 2023; de Souza et al., 2023). Independent of the soil moisture, urease activity significantly increases with air temperature increases (Ni and Pacholski, 2022), kinetic volatilization rate coefficient increases with temperature and decrease with soil moisture (Bolado et al., 2005). During El Niño conditions soil moisture reduction reduce the urea dissolution and incorporation and increase the urease activity increasing the NH3 volatilization.
In Colombia (Leal et al., 2007) measured NH3 emissions from urea in two contrasting coffee zones and found total losses of 30.4% and 34.8% of total N applied. The differences between the two locations were attributed to environmental conditions such as high organic matter and CEC, higher rainfall, and lower temperature in the zone with reduced volatilization.
Higher rainfall volume and intensity are usually associated with better fertilizer incorporation into the soil, and consequently, lower losses by volatilization. An additional factor in coffee that reduces fertilizer incorporation into the soil is rainfall interception by the canopy, as discussed previously, as well as the fallen leaves in the soil that act as a barrier, creating a favorable environment for NH3 volatilization from urea due to the high concentration of urease (Mariano et al., 2012; Sarkis et al., 2023). Low soil moisture conditions, rainfall interception by the canopy, and crop residues such as fallen leaves did not increase the risk of N losses by volatilization for ANB-NPK, where the losses were significantly lower (Table 5). This provides greater flexibility in application timing—even under low soil moisture or high temperatures—superficial application, reducing costs as litter removal from the application zone is not necessary.
All these factors contributed to improving NUE in coffee, as presented in this study. The total N losses for ANB-NPK averaged 13.1% over 2 years and two climate variability scenarios (El Niña-La Niña/ENSO), whereas for UB-NPK, losses under similar conditions were 36.7% (Table 5).
In coffee, Freitas et al. (2022) found that conventional urea caused NH3 losses of 24% of applied N, whereas other N sources, including ammonium nitrate and ammonium sulfate, showed negligible losses, demonstrating their potential as alternatives to mitigate ammonia emissions. Fenilli et al. (2007) compared NH3 volatilization from urea and ammonium sulfate in coffee and found that losses were much lower for the unfertilized control and ammonium sulfate treatment (only 1.6% of total N applied), whereas urea losses averaged 28%. In Colombia, Sadeghian and González (2012) observed 28% NH3 losses for urea and less than 0.2% for ammonium sulfate after one fertilizer application at low N rate (18 kg N ha-1). Gonzalez et al. (2015) reduced NH3 losses from urea in a coffee plantation from 26% to 3% by changing from surface application to deep placement at 3–6 cm depth.
The amount of volatilized NH3 following urea application depends on soil properties such as texture, organic matter content, cation exchange capacity, pH, and water content (Rochette et al., 2013). In our study, in an acidic soil (pH = 4.67) with high organic matter content (10.56%), NH3 volatilization was directly influenced by soil moisture and temperature changes under La Niña and El Niño conditions. During La Niña, soil moisture fluctuated between field capacity and saturation, facilitating urea incorporation. During El Niño, rainfall was low and soil moisture remained below field capacity, reducing incorporation and increasing NH3 volatilization.
Mitigation strategies for NH3 volatilization from mineral N fertilizers in agricultural systems include the use of alternative N sources such as ammonium-nitrate-based mineral fertilizers, sub-surface banding or deep placement of urea, split-band applications, adjusted irrigation timing and amount, and the application of amendments such as natural minerals, industrial by-products, or chemicals with high ammonium-binding capacity. Additional strategies include urease inhibitors and slow-release fertilizers (Pan et al., 2016). This study showed that the interaction between N forms and climate variability scenarios—specifically a nutritional plan based on ANB-NPK with 59% of the total N as NO3− and 41% as NH4+—significantly reduced NH3 losses compared to UB-NPK, from 65% to 6% during El Niño (January 2024), and from 21% to 9% (January 2023) during La Niña phase.
5 Conclusion
In this study, the most significant N loss occurred through volatilization rather than leaching. In the UB-NPK treatment, 31% of the total N applied was lost via volatilization, compared to only 2.8% in the ANB-NPK treatment, with significantly higher losses observed during El Niño. No significant differences between fertilization programs were observed in leaching, with 5.2% and 10% of the total N applied lost through leaching in the UB-NPK and ANB-NPK, respectively; however, leaching losses were significantly higher during La Niña. Regardless of the N source, the risk of NO3-N leaching increased during La Niña conditions, highlighting the importance of incorporating climate variability forecasts into the planning of N application time and frequency. Overall, ANB-NPK resulted in lower N losses (13.1%) compared to UB-NPK (36.7%), making it a more sustainable N source for coffee production, particularly under dry and warm conditions that are expected to dominate future climate scenarios.
Data availability statement
The original contributions presented in the study are included in the article/Supplementary material.
Author contributions
VR-B: Conceptualization, Data curation, Formal Analysis, Funding acquisition, Investigation, Methodology, Software, Validation, Writing – original draft, Writing – review and editing. AV: Data curation, Investigation, Project administration, Supervision, Writing – review and editing. MA: Project administration, Writing – review and editing. JS: Project administration, Writing – review and editing. KM: Project administration, Writing – review and editing. PJ: Funding acquisition, Resources, Supervision, Validation, Writing – review and editing.
Funding
The author(s) declare that financial support was received for the research and/or publication of this article. This study was supported by Yara International.
Conflict of interest
The authors declare that the research was conducted in the absence of any commercial or financial relationships that could be construed as a potential conflict of interest.
The authors declare that this study received funding from Yara International. The funder was not involved in the study design, collection, analysis, interpretation of data, the writing of this article, or the decision to submit it for publication.
Generative AI statement
The author(s) declare that no Generative AI was used in the creation of this manuscript.
Any alternative text (alt text) provided alongside figures in this article has been generated by Frontiers with the support of artificial intelligence and reasonable efforts have been made to ensure accuracy, including review by the authors wherever possible. If you identify any issues, please contact us.
Publisher’s note
All claims expressed in this article are solely those of the authors and do not necessarily represent those of their affiliated organizations, or those of the publisher, the editors and the reviewers. Any product that may be evaluated in this article, or claim that may be made by its manufacturer, is not guaranteed or endorsed by the publisher.
Supplementary material
The Supplementary Material for this article can be found online at: https://www.frontiersin.org/articles/10.3389/fenvs.2025.1666778/full#supplementary-material
References
Addiscott, T. M. (1996). “Fertilizers and nitrate leaching,” in Agricultural chemical and the environment. Editors R. E. Hester, and R. M. Harrison (Cambridge: Royal Society of Chemistry), 1–26. doi:10.1039/9781847550088-00001
Arias, J. F., Sadeghian, S., Mejia, B., and Morales, C. S. (2009). Nitrogen leaching of the Colombian coffee zone and its relationship with soil texture (in Spanish). Cenicafé 60, 239–252.
Babbar, I. L., and Zak, R. D. (1994). Nitrogen cycling in coffee agroecosystems: net N mineralization and nitrification in the presence and absence of shade trees. Agric. Ecosyst. Environ. 48, 107–113. doi:10.1016/0167-8809(94)90081-7
Barłóg, P. (2023). Improving fertilizer use efficiency—Methods and strategies for the future. Plants 12, 3658. doi:10.3390/plants12203658
Behera, N. S., Sharma, M., Aneja, P. V., and Balasubramanian, R. (2013). Ammonia in the atmosphere: a review on emission sources, atmospheric chemistry and deposition on terrestrial bodies. Environ. Sci. Pollut. Res. 20, 8092–8131. doi:10.1007/s11356-013-2051-9
Bolado, R. S., Alonso, G. A., and Alvarez, B. J. (2005). Characterization of nitrogen transformations, sorption and volatilization processes in urea fertilized soils. Vadose Zone J. 4, 329–336. doi:10.2136/vzj2004.0102
Bortolotto, R. P., Bruno, I. P., Reichardt, K., Timm, L. C., Amado, T. J. C., and Ferreira, A. de O. (2012). Nitrogen fertilizer (15N) leaching in a central pivot fertigated coffee crop. Rev. Ceres 59, 466–475. doi:10.1590/S0034-737X2012000400006
Bowles, T. M., Atallah, S. S., Campbell, E. E., Gaudin, A. C. M., Wieder, W. R., and Grandy, A. S. (2018). Addressing agricultural nitrogen losses in a changing climate. Nat. Sustain. 1, 399–408. doi:10.1038/s41893-018-0106-0
Bruijnzeel, L. A. (1997). “Predicting the hydrological impacts of the land cover transformation in the humid tropics: the need for integrated research,” in Amazonian deforestation and climate (Wiley), 15–55.
Bruno, I. P., Unkovich, M. J., Bortolotto, R. P., Bacchi, O. O. S., Dourado-Neto, D., and Reichardt, K. (2011). Fertilizer nitrogen in fertigated coffee crop: absorption changes in plant compartments over time. Field Crops Res. 124, 369–377. doi:10.1016/j.fcr.2011.07.004
Bruno, P. I., Meriguetti, P. V., and Reichardt, K. (2020). Coffee production in the Brazilian savannah: considerations about nitrogen nutrition. Braz. Agric. - Rev. Agric. 95 (2), 156. doi:10.37856/bja.v95i2.4243
Bunn, C., Läderach, P., Ovalle, R. O., and Kirschke, D. (2015). A bitter cup: climate change profile of global production of arabica and robusta coffee. Clim. Change 129, 89–101. doi:10.1007/s10584-014-1306-x
Busato, C., dos Reis, E. F., Oliveira, M. G., Garcia, G. de O., Busato, C. C. M., and Partelli, F. L. (2022). Different nitrogen levels on vegetative growth and yield of conilon coffee (coffea canephora). Ciência Rural. 52, e20200770. doi:10.1590/0103-8478cr20200770
Camargo, A. P. (2010). The impacto f climatic variability and climate change on Arabic coffee crop in Brazil. 69. Bragntía 239–247. doi:10.1590/s0006-87052010000100030
Cannavo, P., Harmand, J.-M., Zeller, B., Vaast, P., Ramírez, J. E., and Dambrine, E. (2013). Low nitrogen uses efficiency and high nitrate leaching in a highly fertilized Coffea arabica–inga densiflora agroforestry system: a 15N labeled fertilizer study. Nutr. Cycl. Agroecosyst. 95, 377–394. doi:10.1007/s10705-013-9571-z
Cantarella, H. (2023). Options of sources of nitrogen for Brazilian agriculture. Campinas, Braz. Inst. Agron. Do Campinas, 30p.
Cantarella, H., Mattos, D., Quaggio, J. A., and Rigolin, A. T. (2003). Fruit yield of Valencia sweet orange fertilized with different N sources and the loss of applied N. Nutr. Cycl. Agroecosyst. 67, 215–223. doi:10.1023/B:FRES.0000003600.20499.76
Cao, H., Liu, X., Feng, B., M Sun, J., Ma, D., Chen, X., et al. (2024). Effect of pH on the surface charges of permanently/variably charged soils and clay minerals. Sci. Rep. 14, 23169. doi:10.1038/s41598-024-74563-6
Carr, F. N., Boaretto, M. R., and Mattos, D. (2020). Coffee seedlings growth under varied NO3−:NH4+ ratio: consequences for nitrogen metabolism, amino acids profile, and regulation of plasma membrane H+-ATPase. Plant Physiol. Biochem. 154, 11–20. doi:10.1016/j.plaphy.2020.04.042
Chagas, W. F. T., Silva, D. R. G., Lacerda, J. R., Pinto, L. C., Andrade, A. B., and Faquin, V. (2019). Nitrogen fertilizers technologies for coffee plants. Coffee Sci. Lavras 14 (1), 55–66. doi:10.25186/cs.v14i1
DaMatta, F. M., Avila, R. T., Cardoso, A. A., Martins, S. C. V., and Ramalho, J. C. (2018). Physiological and agronomic performance of the coffee crop in the context of climate change and global warming: a review. J. Agri. Food Chem. 66, 5264–5274. doi:10.1021/acs.jafc.7b04537
Davis, A. P., Govaerts, R., Bridson, D. M., and Stoffelen, P. (2006). An annotated taxonomic conspectus of the genus coffea (rubiaceae). Bot. J. Linn. Soc. 152, 465–512. doi:10.1111/j.1095-8339.2006.00584.x
de Souza, L. T., de Oliveira, P. D., Ferreira, S. C., Pereira, R. T. H., Campos, C. J. P., da Silva, R. E. R., et al. (2023). Nitrogen fertilizer technologies: opportunities to improve nutrient use efficiency towards sustainable coffee production systems. Agric. Ecosyst. Environ. 345, 108317. doi:10.1016/j.agee.2022.108317
Di, H. J., and Cameron, K. C. (2002). Nitrate leaching in temperate agroecosystems: sources, factors, and mitigating strategies. Nutr. Cycl. Agroecosyst. 46, 237–256. doi:10.1023/A:1021471531188
Di Rienzo, J. A., Casanoves, F., Balzarini, M. G., Gonzalez, L., Tablada, M., and Robledo, C. W. (2012). InfoStat software estadístico versión 2012. Grupo InfoStat, FCA. Argentina: Universidad Nacional de Córdoba.
Dykes, A. P. (1997). Rainfall interception from a lowland tropical rain forest in Brunei. J. Hydrol. 200, 260–279. doi:10.1016/S0022-1694(97)00023-1
Dzebo, A., and Adams, K. M. (2022). The coffee supply chain illustrates transboundary climate risks: insights on governance pathways. Stockholm: Stockholm Environment Institute. doi:10.51414/sei2022.002
Favarin, J. L., de Souza, L. T., Mazzafera, P., and Dimenstein, L. (2021). “Soil correction and fertilization of irrigated coffee plants in production (in Portuguese),” in Cafeicultura do Cerrado/Editores Técnicos Gladyston Rodrigues/Carvalho et al-Belo Horizonte, EPAMIG (Brazil: Belo Horizonte), 564p.
Fenilli, T. A. B., Reichardt, K., Trivelin, O. P. C., and Favarin, J. L. (2007). Volatilization of ammonia derived from fertilizer and its reabsorption by coffee plants. Commun. Soil Sci. Plant Anal. 38, 1741–1751. doi:10.1080/00103620701435514
Fenilli, T. A. B., Reichardt, K., Favarin, J. L., Santos, B. O. O., Silva, A. L., and Timm, L. C. (2008). Fertilizer 15N balance in a coffee cropping system: a case study in Brazil. R. Bras. Ci. Solo 32, 1459–1469. doi:10.1590/S0100-06832008000400010
Ferrao, G. R., da Fonseca, A. F., Ferrao, M. A., Filho, V. A. C., Volpi, S. P., De Muner, L. H., et al. (2012). Café conilon: techniques for production with improved varieties. Vitoria, ES, Brazil 4th edn 74.
Freitas, T., Bartelega, L., Santos, C., Dutra, M. P., Sarkis, L. F., Guimarães, R. J., et al. (2022). Technologies for fertilizers and management strategies of N-fertilization in coffee cropping systems to reduce ammonia losses by volatilization. Plants 11, 3323. doi:10.3390/plants11233323
Freney, J. R., Simpson, J. R., and Denmead, O. T. (1983). “Volatilization of ammonia,” in Gaseous loss of nitrogen from plant-soil systems. Dev. Editors J. R. Freney, and J. R. Simpson (Dordrecht: Springer), 9, 1–32. doi:10.1007/978-94-017-1662-8_1
Gao, Y., and Serrenho, C. A. (2023). Greenhouse gas emissions from nitrogen fertilizers could be reduced by up to one-fifth of the current levels by 2050 with combined interventions. Nat. Food 4, 170–178. doi:10.1038/s43016-023-00698-w
García, L. J. C., Ramirez, C. C., and Sarmiento, H. N. G. (2023). Climate response to ENSO La Niña events between 1998 and 2022 in the Coffee Region. Av. Tec. Cenicafé 550, 1–12. doi:10.38141/10779/0550
Gash, H. C. (1979). An analytical model of rainfall interception by forests. Q. J. R. Meteorol. Soc. 105, 43–55. doi:10.1002/qj.49710544304
Gash, H. C., Lloyd, C. R., and Lachaud, G. (1995). Estimating sparse forest rainfall interception with an analytical model. J. Hydrol. 170, 79–86. doi:10.1016/0022-1694(95)02697-N
Goddard, L., and Gershunov, A. (2020). “Impact of El niño on weather and climate extremes,” in El niño southern oscillation in a changing climate. Editors J. M. McPhaden, A. Santoso, and W. Cai (Washington, DC: American Geophysical Union), 361–375. doi:10.1002/9781119548164.ch16
González, O. H. (2013). Identification of the main soil units in the coffee area. In Manual del Cafetero Colombiano: Investigación y Tecnología Para la Sostenibilidad de la Caficultura, Cenicafé, Federación Nacional de Cafeteros de Colombia: bogotá, Colombia, 1, 269–283.
Gonzalez, O. H., and Sadeghian, K. S. (2012). Leaching of nitrogen in soils of the coffee zone from different fertilizer sources. Cenicafé 63, 132–143.
Gonzalez, O. H., Sadeghian, K. S., Medina, R. R. D., and Castro, Q. A. F. (2015). Alternatives to reduce nitrogen volatilization produced by urea fertilization. Cenicafé 66 (1), 7–16.
Grüter, R., Trachsel, T., Laube, P., and Jaisli, L. (2022). Expected global suitability of coffee, cashew and avocado due to climate change. PLoS ONE 17, e0261976. doi:10.1371/journal.pone.0261976
Guzmán, M. O., and Baldión, R. J. V. (1997). The warm-pacific event in the Colombian coffee zone. Cenicafé 48 (3), 141–155.
Guzmán, M. O., and Baldión, R. J. V. (1999). Influence of the cold-pacific event in the Colombian coffee zone. Cenicafé 50, 222–237.
Harmam, J. M., Avila, H., Dambrine, E., Skiba, U., de Miguel, S., Renderos, R. V., et al. (2007). Nitrogen dynamics and soil nitrate retention in a coffea arabica-Eucalypus deglupta agroforestry system in southern Costa Rica. Biogeochemistry 85, 125–139. doi:10.1007/s10533-007-9120-4
Hawkesford, M., Horst, W., Kickey, T., Lambers, H., Schjoerring, J., Skrumsager, M. I., et al. (2012). Functions of macronutrients in: marschner´s mineral nutrition of higher plants, 135-189. London, UK Elsiver Ltd. doi:10.1016/B978-0-12-384905-2.00006-6
He, Z. L., Alva, K. A., Calvert, V. D., and Banks, J. D. (1999). Ammonia volatilization from different fertilizer sources and effects of temperature and soil pH. Soil Sci. 164, 750–758. doi:10.1097/00010694-199910000-00006
Howell, T. A. (2005). “Lysimetry,” in Soil in the environment. Editor D. Hillel (Amsterdam: Elsevier), 379–386.
IPCC (2014). Climate change 2014: mitigation of climate change. Contribution of working group III to the fifth assessment report of the intergovernmental panel on climate change 1454.
Jantalia, P. C., Halvorson, D. A., Follet, F. R., Alves, R. B. J., Polidoro, C. J., and Urquiaga, S. (2012). Nitrogen source effects on ammonia volatilization as measured with semi-static chambers. Agron. J. 104, 1595–1603. doi:10.2134/agronj2012.0210
Jaramillo, R. A. (2003). Rainfall and nutrients transport into forest and coffee ecosystems. Cenicafé 54, 134–144.
Jaramillo, R. A. (2018). The climate of coffee growing in Colombia. Colombia: FNC- Cenicafé. 207p. doi:10.38141/cenbook-0031
Jaramillo, R. A., and Cháves, C. B. (1999). Hydrological aspects in a forest and in coffee plantations (coffea Arabica L.) in full sunshine and with shade conditions. Cenicafé 50, 97–105.
Jiang, X., Ma, Y., Yuan, J., Wright, A. L., and Li, H. (2011). Soil particle surface electrochemical property effects on abundance of ammonia-oxidizing bacteria and ammonia-oxidizing archea, NH4+ activity, and net nitrification in an acid soil. Soil Biol. Bioch 43, 2215–2221. doi:10.1016/j.soilbio.2011.07.014
Lara, C. A. R., Korndorfer, G. H., and Motta, S. A. (1997). Volatilization of N-NH3 in corn crop: II. Evaluation of solid and fluid sources in no-tillage and conventional tillage system. Rev. Bras. Cienc. Do Solo 21, 489–496.
Lara, C. A. R., Trivelin, P. C. O., Bensasolli, J. A., de Santana, D. G., and Gascho, G. J. (1999). Calibration of a semi-open static collector for determination of ammonia volatilization from nitrogen fertilizers. Commun. Soil Sci. Plant Anal. 30, 389–406. doi:10.1080/00103629909370211
Leal, V. L. A., Salamanca, J. A., and Sadeghian, K. S. (2007). Losses of nitrogen by volatilization in productive coffee plantations. Cenicafé 58, 216–226.
Lehmann, J., and Schroth, G. (2003). “Nutrient leaching,” in Trees, crops and soil fertility: concepts and research methods. Editors G. Schroth, and F. L. Sinclair, 151–166. doi:10.1079/9780851995939.0151
Leuning, R., Condon, A. G., Dunnin, F. X., Zegelin, S., and Denmead, O. T. (1994). Rainfall interception and evaporation from the soil below a wheat canopy. Agric. For. Meteorol. 67, 221–238. doi:10.1016/0168-1923(94)90004-3
Lieb, M. A., Darrouzet, N. A., and Bowman, D. W. (2011). Nitrogen deposition decreases acid buffering capacity of alpine soils in the southern rocky Mountains. Geoderma 164, 220–224. doi:10.1016/j.geoderma.2011.06.013
Lloyd, C. R., Gash, J. H. C., Shuttleworth, W. J., and de O. Marques F, A. (1998). The measurement and modelling of rainfall interception by Amazonian rain forest. Agric. For. Meteorol. 43, 277–294. doi:10.1016/0168-1923(88)90055-X
López, R. G., Sotomayor, R. D., José, A. A., and Schröder, C. E. (2015). Contribution of nitrogen from litter and soil mineralization to shade and sun coffee (coffea arabica L) agroecosystems. Trop. Ecol. 56, 21–33.
Luo, Z., Zhang, Y., Chen, W., Van Damme, M., Coheur, P. F., and Clarisse, L. (2022). Estimating global ammonia (NH3) emissions based on IASI observations from 2008 to 2018. Atmos. Chem. Phys. 22, 10375–10388. doi:10.5194/acp-22-10375-2022
Mariano, E., Trivelin, O. P. C., Vieira, X. M., Leite, J. M., Franco, J. H. C., and Franco, H. C. J. (2012). Ammonia losses estimated by an open collector from urea applied to sugarcane straw. R. Bras. Ci. So-lo 36, 411–419. doi:10.1590/S0100-06832012000200010
Marschner, P. (2012). in Marschner´s mineral nutrition of higher plants. Third Edition (Academic Press/Elsevier).
Marshall, G. V., and Debell, S. D. (1980). Comparison of four methods of measuring volatilization losses of nitrogen following urea fertilization of forest soils. Can. J. Soil Sci. 60, 549–563. doi:10.4141/CJSS80-060
Matiello, J. B., Santinato, R., Garcia, A. W. R., Almeida, S. R., and Fernandes, D. R. (2010). “Coffee crop production in Brazil,” in Manual of recommendations. Brazil: MAPA/PROCAFE, 542p.
Ni, K., and Pacholski, A. S. (2022). Soil moisture and temperature effects on granule dissolution and urease activity of urea with and without inhibitors- an incubation study. Agriculture 12, 2037. doi:10.3390/agriculture12122037
Niu, X., Fan, J., Du, M., Dai, Z., Luo, R., Yuan, H., et al. (2023). Changes of rainfall partitioning and canopy interception modeling after progressive thinning in two shrub plantations on the Chinese loess Plateau. J. Hydrol. 619, 129299. doi:10.1016/j.jhydrol.2023.129299
Ovalle, R. O., Läderech, P., Bunn, D., Oberteiner, M., and Schrith, G. (2015). Projected shift in coffea Arabica sustainability among major global production regions due to climate change. PLoS ONE 10, e0124155. doi:10.1371/journal.pone.0124155
Pan, B., Lam, S. K., Mosier, A., Luo, Y., and Chen, D. (2016). Ammonia volatilization from synthetic fertilizers and its mitigation strategies: a global synthesis. Agric. Ecosyst. Environ. 232, 283–289. doi:10.1016/j.agee.2016.08.019
Peña, Q. A. J., Ramirez, B. V. H., Valencia, A. J., and Jaramillo, R. A. (2012). The rainfall as a threat factor for the coffee crop in Colombia. Av. Tec. Cenicafé 415, 1–8.
Pesek, J., Standford, G., and Case, N. L. (1971). “Nitrogen production and use,” in Fertilizers technology and use (Madison, Wisconsin: Science Society of America), 217–269.
Poveda, J. G., Jaramillo, R. A., Gil, M. M., Quiceno, N., and Mantilla, R. I. (2001). Seasonally in ENSO-related precipitation, river discharges, soil moisture, and vegetation index in Colombia. Water Resour. Res. 37, 2169–2178. doi:10.1029/2000WR900395
Rajkovich, S., Osmod, D., Weisz, R., Crozier, C., Israel, D., and Austin, R. (2017). Evaluation of nitrogen-loss prevention amendments in maize and wheat in North Carolina. Agron. J. 109, 1811–1824. doi:10.2134/agronj2016.03.0153
Ramirez, B. V. H., and Jaramillo, R. A. (2006). Rainfall distribution in four vegetative covers of the Colombian andean zone. Inves. Unisarc. Bol. 5, 19–33.
Ramirez, B. V. H., and Jaramillo, R. A. (2009). Relationship between the ocean niño index and the rainfall in the Colombia central coffee zone. Cenicafé 60, 161–172.
Ramírez, B. V. H., Jaramillo, R. A., Arcila, P. J., and Montoya, E. C. (2010). Soil moisture estimation for a sunshine coffee production systems. Cenicafé 61, 251–259.
Ramirez, B. V. H., Porch, T. G., and Harmsen, E. W. (2011). Genotypic differences in water uses efficiency of common bean under drought stress. Agron. J. 103, 1206–1215. doi:10.2134/agronj2010.0370
Ramirez, B. V. H., Jaramillo, R. A., Peña, Q. A., and Valencia, A. J. (2012). The sunshine in the Colombian coffee zone, during the El Niño and La Niña events. Av. Tec. Cenicafé 421, 12p.
Ramirez, B. V. H., Gaitan, B. A. L., Benavides, M., Constantino, C. L. M., Gil, P. Z. N., and Sadeghian, K. S. (2014). Recommendations for risk reduction in coffee farming in Colombia in the face of an El niño climate event. Av. Técnicos Cenicafé 445 (12p).
Ramirez, B. V. H., and Küsters, J. (2021). Calcium and potassium nutrition increases the water use efficiency in coffee: a promising strategy to adapt to climate change. Hydrology 8, 75. doi:10.3390/hydrology8020075
Ramirez, B. V. H., Küsters, J., Thiele, E., Leal-Varon, L. A., and Arteta-Vizcaino, J. (2023). Influence of variable chloride/sulfur doses as part of potassium fertilization on nitrogen use efficiency by coffee. Plants 12, 2033. doi:10.3390/plants12102033
Ramirez, B. V. H., Küsters, J., Thiele, E., and Lopez-Ruiz, J. C. (2024). Physiological and agronomical response of coffee to different nitrogen forms with and without water stress. Plants 13, 1387. doi:10.3390/plants13101387
Rawat, D., Mukhopadhyay, D., Mishra, G., and Bijalwan, A. (2022). “Soil nitrogen dynamics and management in agroforestry systems for ecological sustainability,” in Land degradation neutrality: achieving SDG 15 by forest management. Editors P. Panwar, G. Shukla, J. A. Bhat, and S. Chakravarty (Singapore: Springer Nature), 381–403. doi:10.1007/978-981-19-5478-8_20
Rendon, S. J. R., and Giraldo, H. A. (2019). Distribution of roots in the castillo® coffee variety under two spatial arrangements. Cenicafé 70, 7–17.
Rochette, P., Angers, A. D., Chantigny, H. M., Gasser, M. O., MacDonald, D. J., Pelster, E. D., et al. (2013). NH3 volatilization, soil concentration and soil pH following subsurface banding of urea at increasing rates. Can. J. Soil Sci. 93, 261–268. doi:10.4141/CJSS2012-095
Rutter, A. J. (1975). “The hydrological cycle in vegetation,” in Vegetation and the atmosphere. Editor J. L. Monteith (London: Academic Press), 1, 278.
Sadeghian, K. S. (2022). Coffee nutrition. In considerations for the soil fertility management. Natl. Coffee Res. Center-Cenicafé Caldas, Colombia, 230.
Sadeghian, K. S., and Duque, U. H. (2019). Mineral fertilizers for coffee in Colombia, technical considerations (in Spanish). Av. Tec. Cenicafé 503, 8.
Sadeghian, K. S., and Gonzalez, O. H. (2012). General fertilization alternatives for productive coffee plantations (in Spanish). Av. Tec. Cenicafé 424, 8.
Sadeghian, K. S., Acuña, Z. J. R., Salazar, G. L. F., and Rey, S. J. C. (2022). Determinants of nitrogen use efficiency in coffee crops: a review. Rev. Ciencias Agric. 39, 198–219. doi:10.22267/rcia.223902.183
Salamanca, J. A., Doane, T. A., and Horwath, W. R. (2017a). Coffee response to nitrogen and soil water content during the early growth stage. J. Plant Nutr. Soil Sci. 180, 614–623. doi:10.1002/jpln.201600601
Salamanca, J. A., Doane, T. A., and Horwath, W. R. (2017b). Nitrogen use efficiency of coffee at the vegetative stage as influenced by fertilizer application method. Front. Plant Sci. 8, 223. doi:10.3389/fpls.2017.00223
Sarkis, F. L., Dutra, P. M., dos Santos, A. C., Alves, R. B. J., Urguiaga, S., and Guelfi, D. (2023). Nitrogen fertilizers technologies as a smart strategy to mitigate nitrous oxide emissions and preserve carbon and nitrogen soil stocks in a coffee crop system. Atmos. Environ. 20, 100224. doi:10.1016/j.aeaoa.2023.100224
Shister, G. A. (2024). Is robusta on the rise? Treds in coffee species trade. U.S. international trade commission/executive briefing on tradiing. 2p. Is robusta on the rise? Trends in coffee species trade.
Stafanato, J. B., Goulart, R. de S., Zonta, E., Lima, E., Mazur, N., Pereira, C. G., et al. (2013). Volatilização de amônia oriunda de ureia pastilhada com micronutrientes em ambiente controlado. Rev. Bras. Ciência Do Solo 37, 726–732. doi:10.1590/S0100-06832013000300019
Tan, H. K. (2011). Principles of soil chemistry. Fourth Editin. New York,USA: CRC Press Tylor and Francis Group, 362p.
Tiemann, T., Aye, T. M., Dung, D. T., Tien, M. T., Fisher, M., de Paulo, M., et al. (2018). Crop nutrition for Vietnamese robusta coffee. Better Crops 102, 20–23. doi:10.24047/bc102320
Tisdale, L. S., Nelson, L. W., and Beaton, D. J. (1985). Soil fertility and fertilizers (4th edtion). New York, USA: Macmillan Publishing Company, 754p.
Trenberth, K. E. (1997). The definition of El niño. Bull. Am. Meteorol. Soc. 78. 2771–2777. doi:10.1175/1520-0477(1997)078<2771:tdoeno>2.0.co;2
Trenberth, K. E. (2020). “ENSO in the global climate system,” in El niño southern oscillation in a changing climate. Editors J. M. McPhaden, A. Santoso, and W. Cai (Washington, DC: American Geophysical Union), 21–37. doi:10.1002/9781119548164.ch2
Tully, L. K., Lawrence, D., and Scanlon, M. T. (2012). More trees less loss: nitrogen leaching losses decrease with increasing biomass in coffee agroforests. Agric. Ecosyst. Environ. 161, 137–144. doi:10.1016/j.agee.2012.08.002
Urrea, V., Ochoa, A., and Mesa, O. (2019). Seasonality of rainfall in Colombia. Water Resour. Res. 55, 4149–4162. doi:10.1029/2018WR023316
Velásquez, F. S., and Jaramillo, R. A. (2009). Rainfall redistribution in different vegetative covers of the Colombia coffee zone. Cenicafé 60, 148–160.
Waling, E., and Vaneeckhaute, C. (2020). Greenhouse gas emissions from inorganic and organic fertilizers production and use: a review of emission factors and their variability. J. Environ. Manag. 276, 111211. doi:10.1016/j.jenvman.2020.111211
Wang, Q., Cameron, K., Buchan, G., Zhao, L., Zhang, E. H., Smith, N., et al. (2012). Comparison of lysimeters and porous ceramic cups for measuring nitrate leaching in different soil types. J. Agric. Res. 55, 333–345. doi:10.1080/00288233.2012.706224
World Meteorological Organization (2024). State of the climate in Latin America and the Caribbean 2023. Geneva: WMO.
Xiong, Z. Q., Huang, T. Q., Ma, C., Xing, G. X., and Zhu, L. Z. (2010). Nitrate and ammonium leaching in Variable- and permanent-charge paddy soils. Pedosphere 20 (2), 209–216. doi:10.1016/S1002-0160(10)60008-2
Keywords: leaching, nitrates, ammonium, ammonia, volatilization, climate variability
Citation: Ramirez-Builes VH, Villegas AM, Agudelo MA, Sotelo JC, Moriano K and Junklewitz P (2025) Influence of the climate variability and two mineral fertilization programs on nitrogen losses in coffee (Coffea arabica L.). Front. Environ. Sci. 13:1666778. doi: 10.3389/fenvs.2025.1666778
Received: 15 July 2025; Accepted: 16 October 2025;
Published: 31 October 2025.
Edited by:
Sangeeta Lenka, Indian Institute of Soil Science (ICAR), IndiaReviewed by:
Xin Li, Chinese Academy of Agricultural Sciences, ChinaBenoit, Georges Bertrand, ASIC, Portugal
Copyright © 2025 Ramirez-Builes, Villegas, Agudelo, Sotelo, Moriano and Junklewitz. This is an open-access article distributed under the terms of the Creative Commons Attribution License (CC BY). The use, distribution or reproduction in other forums is permitted, provided the original author(s) and the copyright owner(s) are credited and that the original publication in this journal is cited, in accordance with accepted academic practice. No use, distribution or reproduction is permitted which does not comply with these terms.
*Correspondence: Victor Hugo Ramirez-Builes, dmljdG9yLnJhbWlyZXpAeWFyYS5jb20=