 Elena von Benzon1,2
 Elizabeth A. Bagshaw
 Simon Browning
 Thomas N. D. Tibbits
- 1School of Earth and Environmental Sciences, Cardiff University, Cardiff, United Kingdom
- 2School of Geographical Sciences, University of Bristol, University Road, Bristol, United Kingdom
- 3The Rivers Trust, Callington, United Kingdom
- 4Friends of the River Wye, Hay-on-Wye, United Kingdom
Water quality in United Kingdom rivers is an issue of increasing public and political concern, yet statutory water quality monitoring programmes are resource limited. Whilst citizen scientists can gather large quantities of data, the quality of these data is not well understood, particularly the accuracy and bias of data reported by volunteers using low-cost colorimetric nutrient tests. In this study, the performance of popular, low-cost field tests used to assess phosphate and nitrate concentrations in freshwater were compared to accredited laboratory methods by paired sample analysis. During three mass sampling events in the River Wye catchment, some tests demonstrated a good degree of accuracy when performed by volunteers: 62% of Hanna Phosphate Checker results and 66% of Hach nitrate test strip results were in agreement with paired laboratory results. In comparison, La Motte Insta-test strips for phosphate, widely used by citizen scientists across the United Kingdom, demonstrated poor performance in this study: only 17% of phosphate results reported by volunteers were in agreement with laboratory analysis of paired samples, although we note their utility for identifying high concentration events. We conclude that a comprehensive assessment of any low-cost test kit being considered for use by volunteer monitoring programmes is a critical first step to producing relevant, high-quality and trustworthy citizen science water quality datasets that can reliably help fill monitoring data gaps. Nevertheless, our results demonstrate that, with appropriate low-cost test kits and the correct training, volunteers can produce high-quality datasets that enhance understanding of water quality issues across river catchments and could reliably support statutory monitoring.
1 Introduction
The latest United Kingdom Environment Agency freshwater chemical classification exercise (September 2020) concluded that no river waterbody in England passed chemical water quality standards set under the Water Framework Directive (WFD) (Defra, 2020). This assessment was based on water quality data from statutory monitoring undertaken between 2016 and 2019; the next classification results in England are due to be published in 2025 (Defra, 2023). Data gathered by statutory bodies that are used to perform these assessments are currently limited, both spatially and temporally, due to resource availability (Warner et al., 2024; Capdevila et al., 2020). As a result, assessing exactly where, when and why a particular catchment is failing water quality standards is not easily achieved. Increased monitoring capacity is required to address these questions, which could be achieved through the work of dedicated volunteer networks already operating in many river catchments (Ramírez et al., 2023; Catlin-Groves, 2012). Thus, citizen science water quality monitoring holds great potential in helping to fill the ‘data gap’ and improve scientific understanding of patterns in water quality at a catchment scale (Carlson and Cohen, 2018; Capdevila et al., 2020).
Citizen science (also known as “community science” (Ellwood et al., 2023; Lin Hunter et al., 2023)) water quality monitoring has become increasingly popular over the past two decades (Starkey et al., 2024; Catlin-Groves, 2012; Kosmala et al., 2016; Paul et al., 2018; Njue et al., 2019; Walker et al., 2021), reflecting a growing public awareness and concern regarding the health of inland waterbodies (Downing, 2024). A wide range of local, national, and international citizen science water quality projects, programmes and initiatives now exist, including well-established, high-profile examples: FreshWater Watch (Farnham et al., 2017; Thornhill et al., 2016; Hegarty et al., 2021), a global citizen science project; and the Chesapeake Bay Monitoring Cooperative (Webster and Dennison, 2022; Wyeth et al., 2019). In the United Kingdom there are hundreds of citizen science groups monitoring water quality, operating either independently or as part of larger organised efforts, such as local Rivers Trusts (under the wider umbrella of The Rivers Trust) (Collins et al., 2023) or the Angling Trust’s Water Quality Monitoring Network.
Both nitrate and phosphate, alongside a range of other physiochemical water quality parameters, are extensively monitored by citizen scientists using readily available, low-cost field tests kits (Ramírez et al., 2023). However, despite growing popularity, there are still barriers which limit the wider uptake of citizen science water quality monitoring activities by communities, including: cost of tests; complexity of methods; and lack of guidance on the most effective monitoring programme design (Wehn and Almomani, 2019). Furthermore, although there are examples of citizen science data being used to answer scientific research questions and inform policy or accountability, its widespread application by scientists and decision makers is currently limited compared to its potential (Burgess et al., 2017; Jollymore et al., 2017; Warner et al., 2024; Njue et al., 2019). Questions about repeatability, accuracy and suitability of low cost tests to match laboratory methods can precipitate a lack of trust in the quality of data produced by citizen scientists (Catlin-Groves, 2012; Kosmala et al., 2016; Quinlivan et al., 2020; Thornhill et al., 2016). Data quality can be measured by many different metrics, depending on the context of the monitoring (its purpose and what is required of the data), but generally accuracy, precision and bias can be used (Kosmala et al., 2016; Quinlivan et al., 2020). What might be considered poor quality data in the context of one monitoring programme could be sufficient or ‘good enough’ in the context of another (Aceves-Bueno et al., 2017). For example, infrequent snapshot sampling can be valuable for community engagement and river health evaluation, but regular sampling is preferred for a more robust understanding of processes (Collins et al., 2023). It is therefore critical to understand quantitively both the quality of data produced by each low-cost test kit of interest and the quality of data required by data users in the specific monitoring context, before a citizen science monitoring programme is established.
There are studies comparingdatasets gathered by citizen scientists with those gathered by professional scientists using the same tools and approaches (Albus et al., 2019), and the majority conclude that data is of ‘comparable quality’ when volunteers are provided with sufficient training (Kosmala et al., 2016; Quinlivan et al., 2020). Fewer studies have attempted to quantify the accuracy and bias of low-cost test kits by comparing their performance to professional methods of analysis (Loperfido et al., 2010; Kosmala et al., 2016) and many of those that have are still limited by, for example, comparing samples taken from different geographical locations or samples taken from the same location but at different times (Dickson et al., 2024) or both (Dyer et al., 2014; Scott and Frost, 2017). Thus, any differences (or similarities) in water quality observed in these studies could be attributed to environmental conditions such as temperature, discharge or turbidity conditions, rather than actual differences in the performance of those analytical tests assessed. Some studies that directly compare low-cost citizen science field methods with professional standard laboratory analysis of samples gathered at exactly the same time and location, with a focus on the accuracy and bias of data produced, do exist (Quinlivan et al., 2020; Loperfido et al., 2010; Muenich et al., 2016; Lévesque et al., 2017; Chaabane et al., 2024), however these are limited in geographical or temporal scope.
To confidently evaluate the reliability of citizen science assessments of phosphate and nitrate concentrations, we compared data collected by volunteers across a United Kingdom river catchment (the River Wye) with accredited laboratory analyses of simultaneously collected (paired) water samples. Specifically, we evaluated the performance of three low-cost, in situ colorimetric nutrient test methods by comparing their results to those obtained from accredited (UKAS ISO/IEC 17025) laboratory methods for the same analytes. We explored the precision, accuracy and bias of two low-cost phosphate tests widely used by citizen science groups across the United Kingdom that to our knowledge have not yet been assessed against professional methods. We define precision as the ‘refinement’ of the measurement, i.e., number of decimal places reported; accuracy as a measure of how close to the ‘real’ concentration, defined by the accredited laboratory data; and bias as an assessment of any systematic skewing of the data. We also review one popular nitrate test kit which has been assessed in a similar way by others (Loperfido et al., 2010; Muenich et al., 2016) but under different environmental conditions. Following feedback from citizen scientists, a series of controlled laboratory tests were also undertaken to understand how temperature and the time between test kit initiation and analysis could introduce bias in the phosphate test protocol, to understand whether longer reaction times were required in cold weather.
2 Methods
2.1 Study sites
The River Wye catchment covers an area of approximately 4130 km2 (Bussi et al., 2018), spanning both England and Wales. The catchment has an active and growing community of engaged citizen scientists who regularly monitor water quality using low-cost colorimetric test kits and handheld digital sensors. In the year-long period between March 2021 and February 2022, volunteers across the Wye catchment analysed a total of 7,439 water samples at 339 volunteer river monitoring sites. Thirty-four of these volunteer monitoring sites were selected for comparative laboratory analysis, based on where citizen scientist volunteers were available to collect samples and carry out field tests on specific dates (Figure 1). Monitoring sites that contributed towards a good representation of the geographical range across the catchment and of different volunteer monitoring groups were also prioritised.
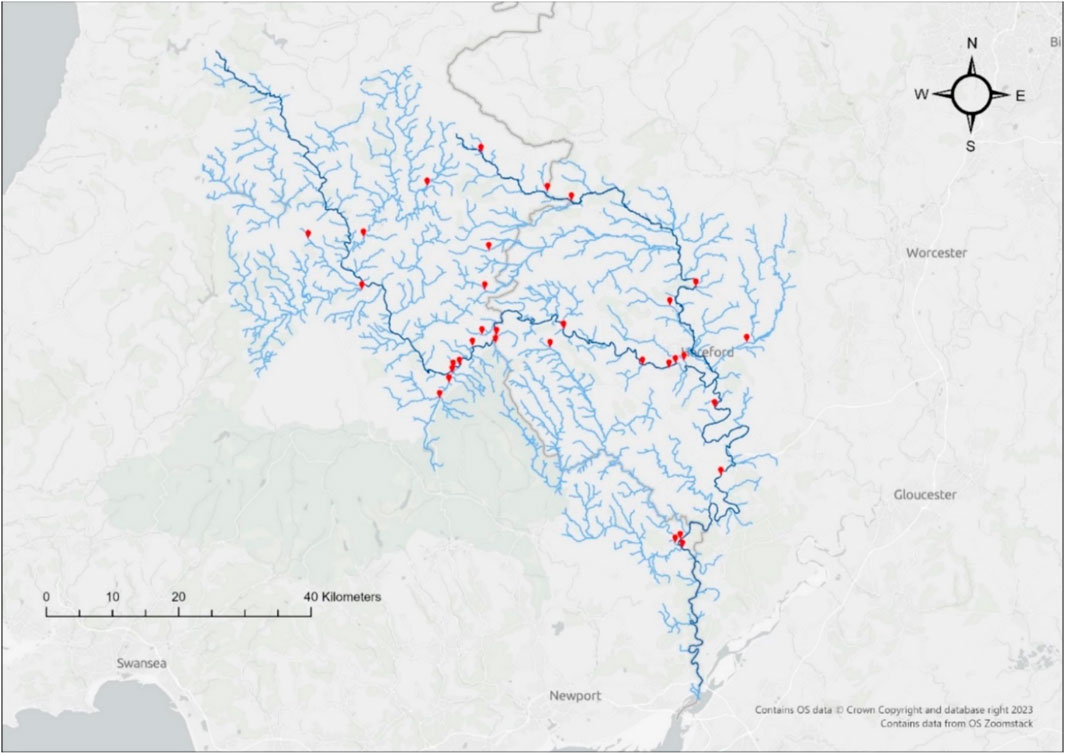
Figure 1. Sites across the River Wye in south Wales catchment where volunteers sampled for paired field and comparative lab analysis during one or more mass sampling events in Autumn 2021, shown in red. Dark blue denotes the main course of the River Wye and its largest tributary, the River Lugg; light blue denotes lesser tributaries of the River Wye and River Lugg.
2.2 Volunteer recruitment, training and methods of analysis
Volunteers from the Wye Salmon Association (WSA), Friends of the Upper Wye (FOUW), Friends of the Lugg (FOL) and Campaign to Protect Rural England (Herefordshire) (CPRE), participated in data collection for this study. These groups agreed a set of monitoring tools and co-developed shared protocols outlining how citizen science water quality sampling and analysis should be conducted across the River Wye catchment (known as the Wye Alliance). This approach aims to ensure that the citizen science datasets produced are comparable. Groups train and equip their own volunteers with the tools required to safely and effectively carry out water quality testing at agreed fixed sites across the catchment either twice weekly, weekly or fortnightly. Samples were collected in plastic or glass containers, provided by volunteers, that were triple-rinsed on site with river water before use. Volunteers followed detailed step-by-step guidance on how to perform each test in-situ.
Nutrient concentrations were analysed by citizen scientists using two phosphate and one nitrate method: Hach Water Quality Test Strips for Nitrate and Nitrite (‘Hach Nitrate test strips’, Hach Lange, Berlin, Germany), and La Motte Insta Test low-range test strips for phosphate (‘La Motte Phosphate test strips’, La Motte Company, Maryland, United States) and the Hanna Phosphate Low Range Handheld Digital Colorimeter (‘Hanna Phosphate Checker’ or ‘Hanna Checker’, Hanna Instruments, Rhode Island, United States) (Table 1). Users followed the protocols for reaction times given by the manufacturers, and recorded supporting observations of environmental conditions and physiochemical water quality indicators including temperature and electrical conductivity (measured using a HM Digital EC-3 handheld probe (HM Digital Inc., California, United States)), turbidity (using a standard Secchi tube, also known as a transparency tube or turbidity tube (Dahlgren et al., 2004)) and estimated water level.
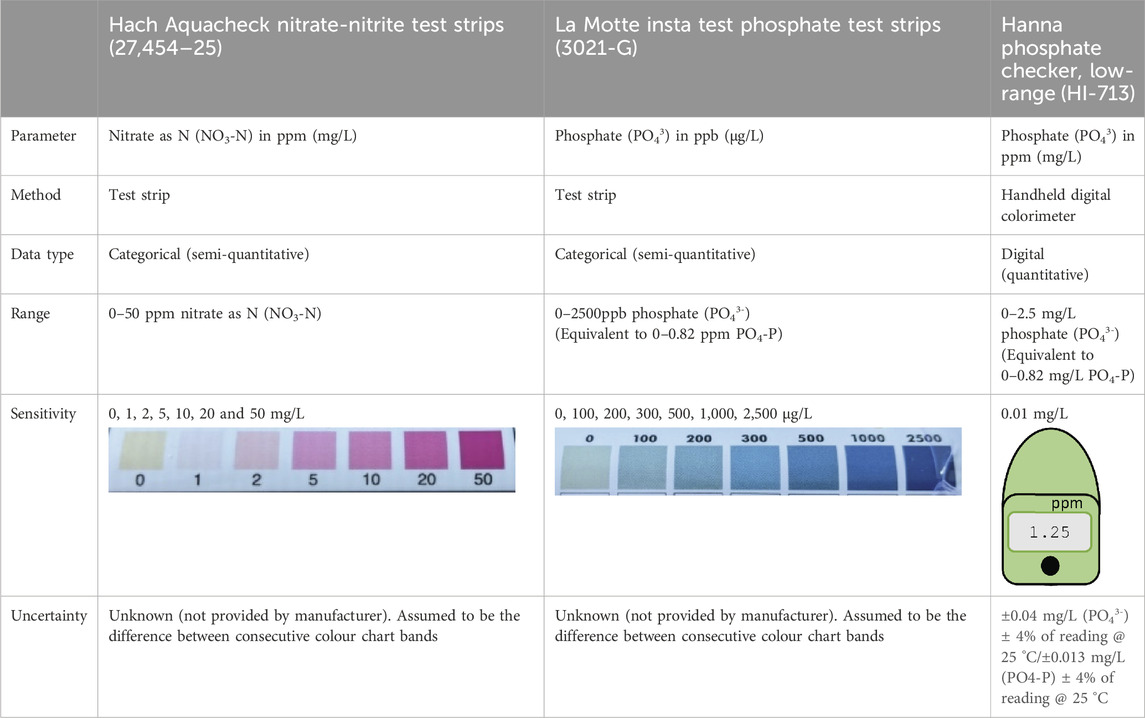
Table 1. Citizen science nutrient test kits assessed in this study.
2.3 River water sampling and professional lab analysis of paired samples
Samples were collected during three separate ‘mass sampling events’, where volunteers collected measurements and water samples from different sites on the same day, similar to other citizen science studies (Muenich et al., 2016; Stankiewicz et al., 2023). This resulted in a ‘snapshot in time’ of water quality status across the catchment on 21st September (A), 19th October (B) and 16th November (C) 2021. In total, 491 samples were collected (141, 155 and 185 on each event, respectively), and tested by volunteer citizen scientists from their regular WSA, FOUW, FOL or CPRE monitoring sites. Statutory bodies (the Environment Agency in England and Natural Resources Wales in Wales) also aligned their routine sampling across the catchment to take place on the same days. A subset of volunteers were asked to collect a second sample (or ‘paired sample’) at the same time and from the same location for comparative analysis using laboratory methods. In total, 70 samples were collected by citizen scientists for paired laboratory analysis at the same time they collected samples for immediate in situ analysis using the low-cost test kits. Of these, 56 compared laboratory analysis with the Hanna Phosphate Checker; 51 with the La Motte Phosphate Test Strips; and 50 with Hach Nitrate test strips.
Samples for accredited laboratory analysis were collected by volunteers in a pre-prepared 500 mL PET bottle (inorganic nutrients: nitrate, nitrite, phosphate), provided by the United Kingdom Accreditation Service (UKAS) accredited Dŵr Cymru Welsh Water laboratory. Bottles were triple-rinsed with river water prior to sample collection and stored in cool bags for transit to the laboratory within 8 hours. Samples were filtered on arrival at the laboratory, prior to analysis within 24 h. Inorganic orthophosphate as P (PO4-P), total oxidised nitrogen as N (TOxN-N) and nitrite as N (NO2-N) were analysed using a discrete analyser (Aquakem 600). Nitrate as N was calculated from nitrite and TOxN-N concentrations measured (TOxN-N–NO2-N). The laboratory measured phosphate as P in the range of 0.03–1.2 mg/L with a precision of 0.001 mg/L, while nitrate as N ranged from 0.48–60 mg/L with a precision of 0.01 mg/L. Uncertainty of measurement (UoM) for analysis of these nutrients was 7.5% for phosphate and 8.7% for nitrate.
2.4 Controlled laboratory analysis of phosphate standards
To understand the performance of low-cost methods under varying temperature and reaction time, phosphate standards were prepared and analysed using both the La Motte Phosphate test strips and the Hanna Phosphate Checker under controlled laboratory conditions, and by a Thermo Scientific Gallery Plus Discrete Photometric Analyser at the University of Bristol’s School of Geographical Sciences laboratory. The Gallery Plus discrete analyser reports phosphate as P from 0.002 to 2.5 mg/L (if both the low and high range assays are used) with a resolution of 0.00001 mg/L. Tests were carried out in triplicate to ascertain the Standard Error of the Mean (SEM), which was calculated as 1.1% and used as an estimate of the UoM for phosphate analysis using the Gallery Plus discrete analyser. Eleven phosphate standards were made up from 5 mg/L phosphate stock solution, ranging in concentration from approximately 0.1–2.5 mg/L PO43-. Standards were tested using the low-cost methods at three different controlled temperature ranges set by water baths: 5 °C ± 1 °C, 11 °C ± 1 °C and 21 °C ± 1 °C, to reflect the typical range of average temperatures observed in United Kingdom rivers annually (Johnson et al., 2009; Jonkers and Sharkey, 2016). After samples were brought to the correct experimental temperature, tests were conducted at room temperature for the 11 °C and 21 °C samples, and for the 5 °C samples, tests were carried out in a cold room set at 5 °C to mimic winter conditions.
For La Motte Phosphate test strips, the procedure involved: (i) filling a plastic test tube with 10 mL of water sample (to the indicated mark); (ii) inserting a strip containing the regent into the test tube cap; (iii) placing the cap on the test tube; and, (iv) inverting the sample five times. The manufacturer’s stated method (followed by volunteers in this study) indicates that the colour of the reacted sample should be compared to the colour chart and a concentration determined immediately after the test procedure has been carried out. However, to examine the hypothesis that this method does not allow the reagent sufficient time to combine with the phosphate in colder weather, we compared the manufacturer’s method with an amended timescale. In a supplementary set of tests at 11 °C ± 1 °C, we tested samples immediately after the test procedure had been carried out (time = 0 min) and then left each sample for an additional 3 and 10 min before determining the closest colour chart match. For the Hanna Checker, we increased the reaction time of the 5 °C ± 1 °C samples by re-evaluating the apparent concentration of the original sample on the handheld colorimeter after a time interval of between 10 and 30 min after the first test result was recorded.
2.5 Volunteer data recording, sorting and cleaning
All citizen science groups involved in this study used Epicollect, a free online data gathering platform, to record and store their water quality data. For each dataset downloaded from Epicollect the following steps were taken: (1) redundant metadata were removed; (2) headings were standardised; and, (3) site names were replaced with sites unique identifying code and fixed site location (coordinates) from each group’s master site log. Erroneous data points were removed against the following criteria: for test strips, any data points that did not match a value defined by the corresponding test strip colour chart were excluded; for Hanna Phosphate Checkers, any data that was reported either outside the instrument range or beyond its limit of sensitivity were discarded. Lastly, all phosphate data collected by volunteers (using the Hanna Phosphate Checker or the La Motte test strips) were converted to phosphate as P (PO4-P) in mg/L to match data reported by the accredited laboratory and commonly used by statutory bodies. Hach Nitrate test strips were reported as NO3-N in mg/L.
2.6 Data analysis and error quantification
The data provided by test strips is categorical (approximate, banded measurements, also described as semi-quantitative, as displayed in Table 1), making a direct comparison with digital data (numerical measurements, also described as quantitative) - produced by professional methods of analysis - challenging. To address this, we categorised or ‘binned’ digital data from laboratory methods of analysis to enable a direct comparison with the test strip data, as has been done in other similar studies (e.g., Muenich et al., 2016). The binned ranges used for nitrate and phosphate are shown in Table 2. For digital data provided by the Hanna Checkers, we were able to perform regression analysis in R (R Core Team, 2024) to directly compare the volunteer’s measurements with accredited laboratory data.
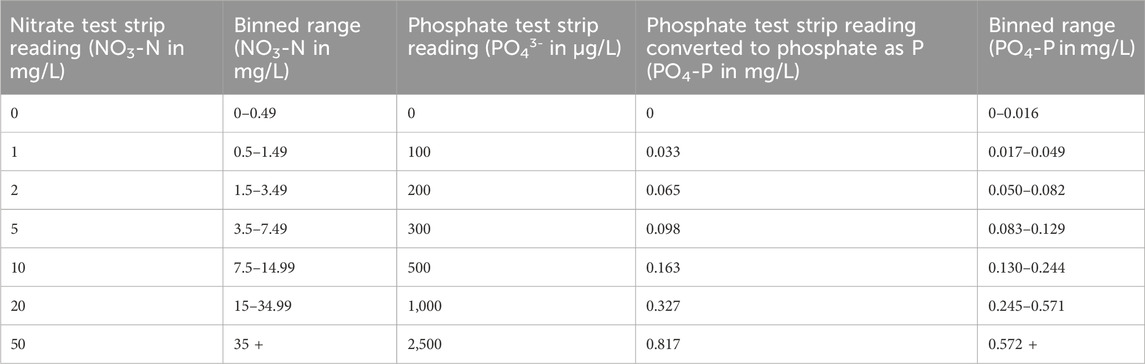
Table 2. Test strip readings and corresponding binned ranges of values they represent.
To quantify the probable error of the test kits investigated, we first assumed the ‘true value’ to be the concentration of phosphate or nitrate determined in the laboratory (whilst acknowledging that these reported values are subject to stated uncertainty of 7.5% for phosphate and 8.7% for nitrate). Absolute error, as shown in Equation 1, was calculated each of the low-cost field tests using the field test result obtained by volunteers as the ‘measured value’ and the paired laboratory result as the ‘expected value’. However, due to the semi-quantitative nature of phosphate and nitrate test strips, a modified method (shown in Figure 2 and summarised in Equation 2) was used for those tests to account for the range of values each test strip result represents (shown in Table 2). This method produced values indicating absolute error outside the expected range for test strip readings. Mean absolute error outside the expected range was then calculated by summing all the values calculated and dividing by total number of measurements, including those assigned an error of zero.
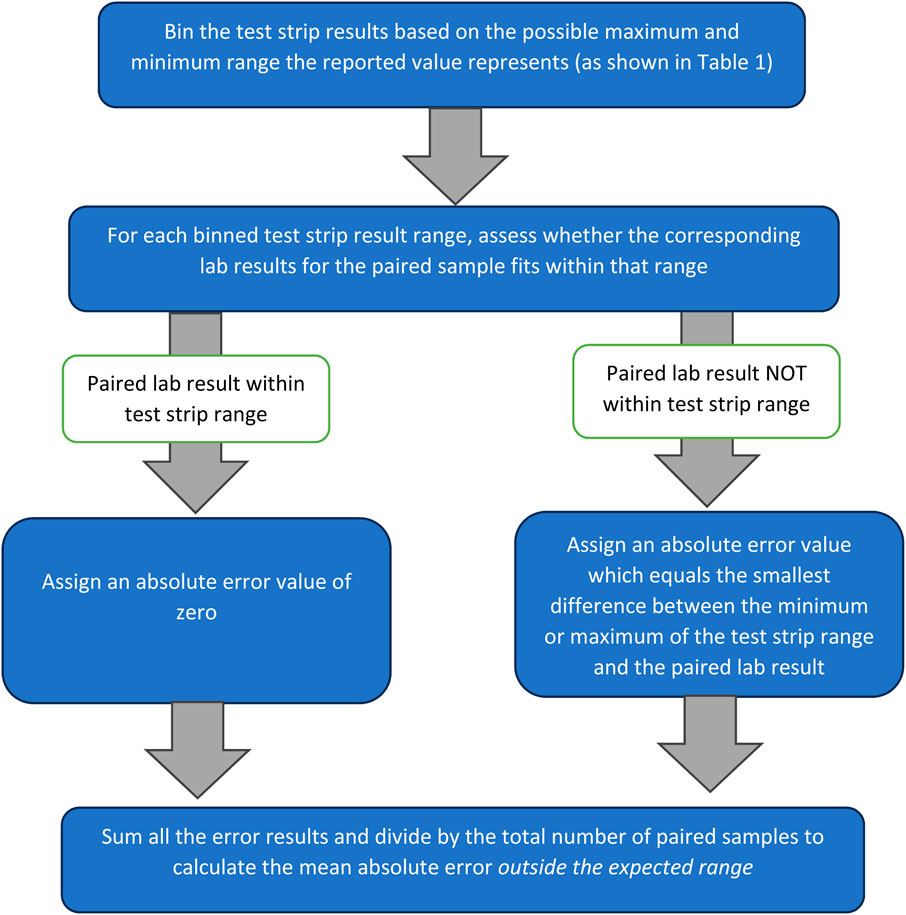
Figure 2. The modified method used to obtain absolute error and mean absolute error values for test strip results, based on Equation 2.
The bias of each test was assessed by quantifying whether the results that did not match the expected value or range underestimated or overestimated the ‘true value’, as defined by lab analysis of paired samples.
3 Results
3.1 Test strips vs. laboratory data
The total number of samples analysed by each of the low-cost test kits and paired professional laboratory techniques during the mass sampling events are summarised in Table 3. Test strip performance was variable (Figure 3), though nitrate tests generally showed better agreement with laboratory data than phosphate tests, particularly when considering higher concentrations of nitrate (above 1.5 mg/L NO3-N). Fifty-four percent of the nitrate test strip results from mass sampling events were in agreement with comparative laboratory analysis, which improved to 66% including laboratory uncertainty (UoM). Furthermore, no nitrate test strip results fell more than one binned category outside the expected range based on laboratory analysis (Figure 4a). In contrast, just 14% of phosphate test strip results from the mass sampling events were in agreement with the binned range determined by paired laboratory analysis of river water samples, improving to only 17% when the UoM in the laboratory results was account for. Correspondingly, over 50% of the phosphate test strip data deviated from laboratory results by two or more binned categories (Figure 4a). Nitrate test strip results identified as not being in agreement with the binned range determined by laboratory analysis of paired samples showed a bias towards overestimation of nitrate whilst, conversely, the phosphate test strip results which were not in agreement with the binned range determined by paired laboratory analysis showed a strong bias towards underestimation of phosphate (Figure 4b).
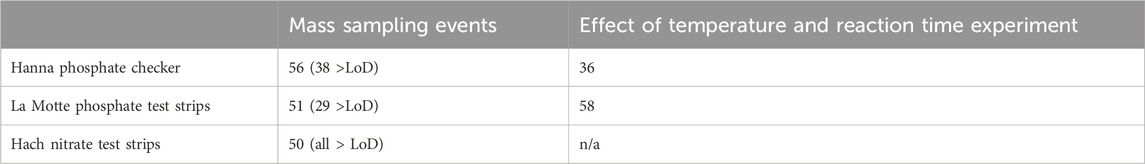
Table 3. The total number of paired samples analysed for each low-cost nutrient test kit for each experiment.
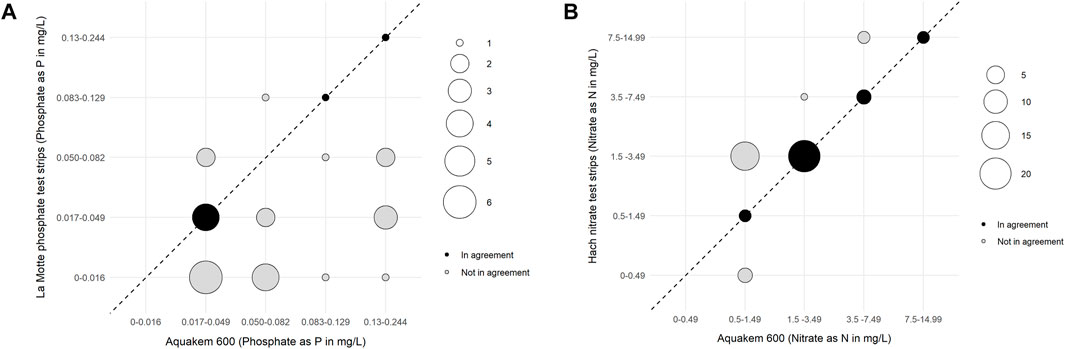
Figure 3. (A) Bubble plot showing the degree of agreement between Phosphate as P (PO4-P) results in mg/L reported by the laboratory (using an Aquakem 600 online analyser) and by citizen scientists (using La Motte phosphate test strips) for the 29 paired samples above the laboratory’s LoD. The size of the bubble indicates the number of observations in each concentration range, as indicated in the legend. Samples where results from the Aquakem 600 and test strips are in agreement (i.e., fall within the same binned range) are shown in black, while those not in agreement are shown in grey. The dashed line represents the line of equality. (B) Bubble plot showing the degree of agreement between Nitrate as N (NO3-N) results in mg/L reported by the laboratory (using an Aquakem 600 online analyser) and by citizen scientists (using Hach nitrate test strips) comparing 50 paired samples. The size of the bubble indicates the number of observations in each concentration range, as indicated in the legend. Samples where results from the Aquakem 600 and test strips are in agreement (i.e., fall within the same binned range) are shown in black, while those not in agreement are shown in grey. The dashed line represents the line of equality.
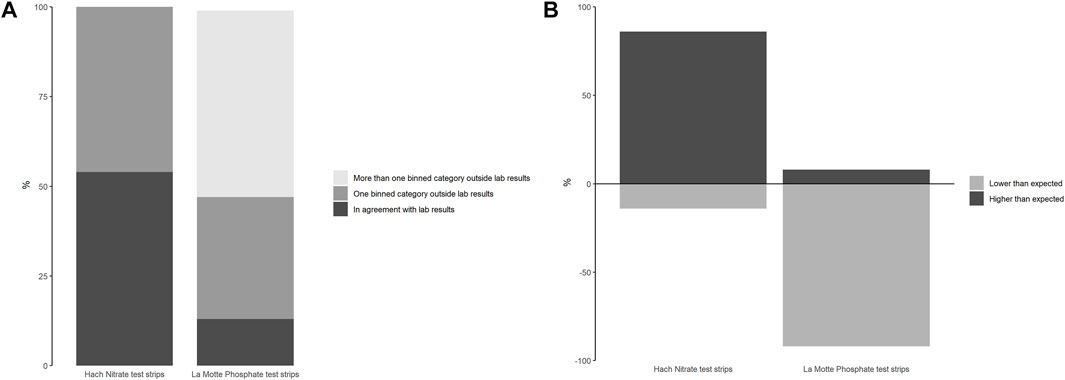
Figure 4. (A) Proportion of nitrate and phosphate test strip results that were (i) in agreement with (i.e., fell within the same binned category), (ii) one binned category outside, or, (iii) more than one binned category outside the laboratory results (before accounting for uncertainty of measurement in lab analysis). (B) Phosphate and nitrate test strip results that were not in agreement with lab analysis of paired samples, categorised proportionally by whether they were either higher or lower than the expected binned range.
Although over 50 paired samples were analysed for the phosphate test strips across all three sampling events (Table 3), a large proportion (22/51) of samples produced laboratory test results below the lower limit of detection (LoD) for phosphate as P on the Aquakem 600 (<0.03 mg/L). As it is not possible to determine which of the two lowest binned ranges (0–0.016 or 0.017–0.049 mg/L PO4-P) laboratory data below the LoD should be classified as, and thus correctly identify a binned range match or mismatch with the corresponding phosphate test strip data, those paired samples were excluded from further analysis in this study. Similarly, for the Hanna Checker, a large proportion (18/56) of the paired samples analysed fell below the LoD for phosphate as P on the Aquakem 600, as shown in Table 3. These data were also removed from further analysis in this study as they would skew the relationship between Hanna Checker and laboratory determined P concentrations at the lower range. The 50 nitrate samples analysed during mass sampling events all fell above the laboratory limit of detection for nitrate as N (0.48 mg/L) so all were included in further analysis.
3.2 Effect of reaction time and temperature on phosphate test strips
The results from comparative analysis of prepared phosphate standards under controlled laboratory conditions are displayed in Figure 5. Testing the performance of La Motte phosphate strips in this way demonstrated that lower concentration solutions (<0.4 mg/L PO4-P) tended to give test strip results closer to the true concentration of phosphate in most cases, but false zeros were also more common in these samples. Conversely, higher concentrations (>0.4 mg/L PO4-P) gave more consistent readings above zero, but failed to accurately indicate the difference in concentration of samples in this range and consistently underreported phosphate concentrations.
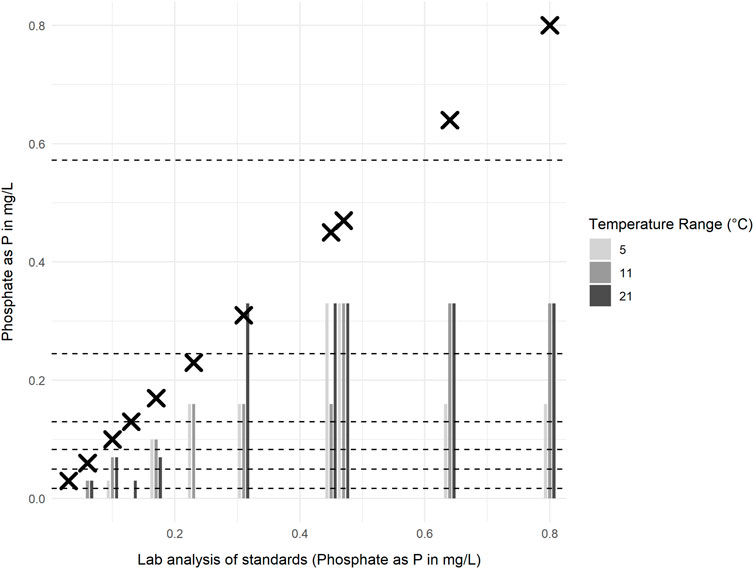
Figure 5. Concentration of phosphate as P (PO4-P) in standards measured using the Thermo Scientific Gallery analyser (crosses) and La Motte phosphate test strips (bars), for samples analysed at three different controlled temperatures (5 °C, 11 °C, and 21 °C ± 1 °C). Dashed lines indicate the minimum and maximum concentrations for each test strip colour chart range.
An increase in the reported concentration of PO4-P with increasing temperature of the sample is observed when the mean differences and t-values are calculated for the same standards measured at different temperatures (Table 4). However, increasing the temperature of samples from 5 °C to 11 °C or from 11 °C to 21 °C did not yield a statistically significant effect on the outcome of the test strip results (p-values greater than 0.05 and confidence intervals that included zero). Only in comparing samples at 5 °C and 21 °C, did the paired t-test indicate a statistically significant (95%) probability of a slight increase in PO4-P concentration with temperature (Table 4).
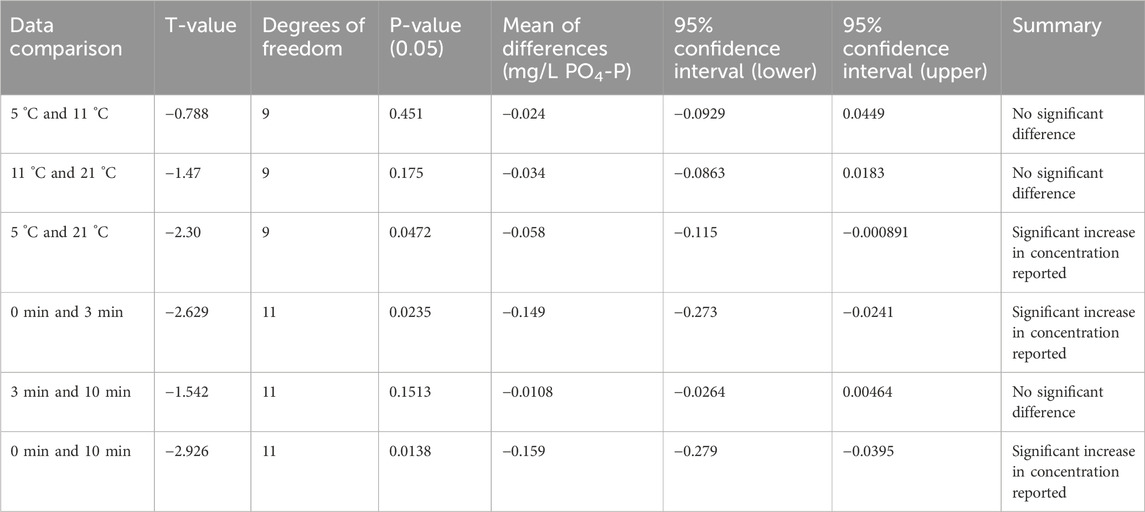
Table 4. Statistical summary comparing the effect of (a) temperature increase and (b) time left to react on phosphate test results obtained using La Motte phosphate test strips.
When the strips were left to develop for longer time periods (3 or 10 min), the reported phosphate concentration generally increased, often by at least one colour chart category after 3 min or 10 min (Figure 6). Paired t-test results indicate a statistically significant increase in phosphate concentration reported between 0 and 3 min, and between 0 and 10 min (p < 0.05). However, no significant difference was observed between 3 and 10 min (Table 4).
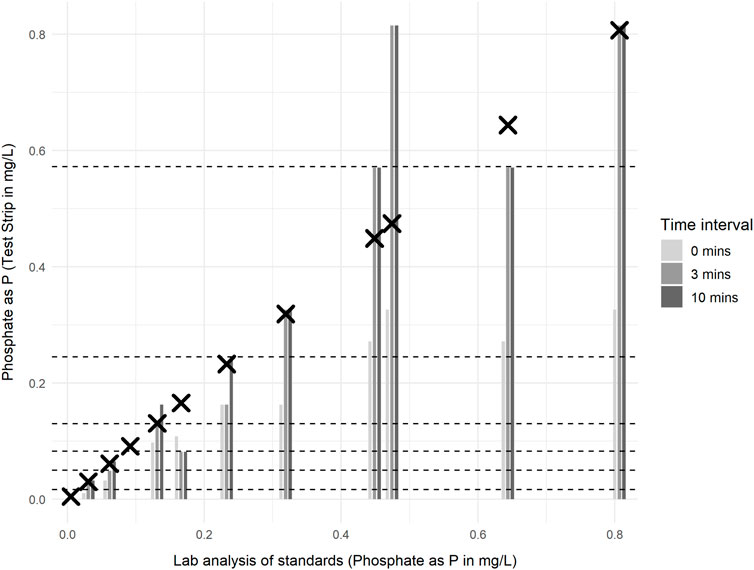
Figure 6. Concentration of phosphate as P (PO4-P) in standards measured using the Thermo Scientific Gallery analyser (crosses) and La Motte phosphate test strips (bars) for samples at 11°C ± 1 °C. Test strip colour chart comparisons were recorded at 0, 3 and 10 min after the manufacture stated reaction time required. Bars represent average test strip concentrations reported from two (3 and 10 min) or three replicates (0 min). Dashed lines indicate the minimum and maximum concentrations for each test strip colour chart range.
3.3 Pocket colorimeter vs. laboratory data
The relationship between phosphate results obtained from the Hanna Phosphate Checker and from professional laboratory analysis of paired samples taken across all three mass sampling events is displayed in Figure 7. The line of best fit shown is a simple linear regression (y = 0.9362x - 0.0034, r2 = 0.65, p < 0.0001, T = 7.67). Further analysis of the data (Table 6) shows that 62% of the 38 comparable results reported by citizen scientists using the Hanna Phosphate Checker were in agreement with laboratory results when the total known error was accounted for. Results in agreement are displayed in black in Figure 7.
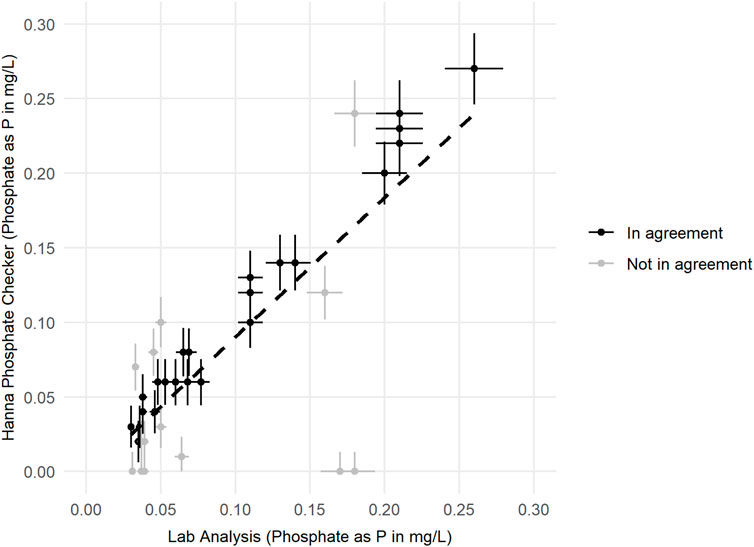
Figure 7. Relationship between Phosphate as P (PO4-P) results reported by accredited laboratory analysis (using an Aquakem 600 discrete analyser), with associated error of 7.5% of reading results, and results reported by volunteers (using Hanna Phosphate Checker), with associated error specified by the instrument manufacture (±0.013 mg/L PO4-P ± 4% of reading). Paired samples where results from both instruments are in agreement after accounting for error are shown in blue; paired samples with discrepancies after accounting for error are shown in red. A simple regression line is displayed to show the relationship between the two measurement methods.
Although the Hanna Checker has a detection limit of zero, manufacturers guidance indicates an accuracy equivalent to ±0.013 mg/L + 4% PO4-P (at 25 °C), hence the working detection limit on these devices is likely to be 0.013 mg/L PO4-P. A substantial number 18/56 (∼32%) of samples analysed for phosphate using the Hanna Phosphate Checker were determined to be below the lower limit of detection for the laboratory (0.03 mg/L PO4-P). Although not included in the analysis presented in this section, it is important to consider that a high proportion (over 80%) of those paired samples recorded as below the lower detection limit by laboratory analysis were also reported as values of 0.03 mg/L or less PO4-P by Hanna Phosphate Checker users. Hence, there is still a good general agreement at the lower range but the assessment becomes semi-quantitative, as with the test strips, and it is not possible to state the specific accuracy, precision, bias or error on these results.
3.4 Effect of reaction time and temperature on pocket colorimeter
Comparison of the Hanna Phosphate Checker against accredited laboratory methods under controlled environmental conditions showed very good agreement at all temperature ranges (Figure 8; Table 5 (R2 = 0.98, p < 0.0001)). At lower temperatures the Hanna Checker slightly underestimated phosphate concentrations: the mean difference between the value measured by the Hanna Checker and the value measured by the Gallery Plus analyser at 5 °C was −0.046 mg/L PO4-P, improving to −0.0076 mg/L PO4-P at 11 °C. However, the absolute difference between values was much greater for higher concentration P solutions.
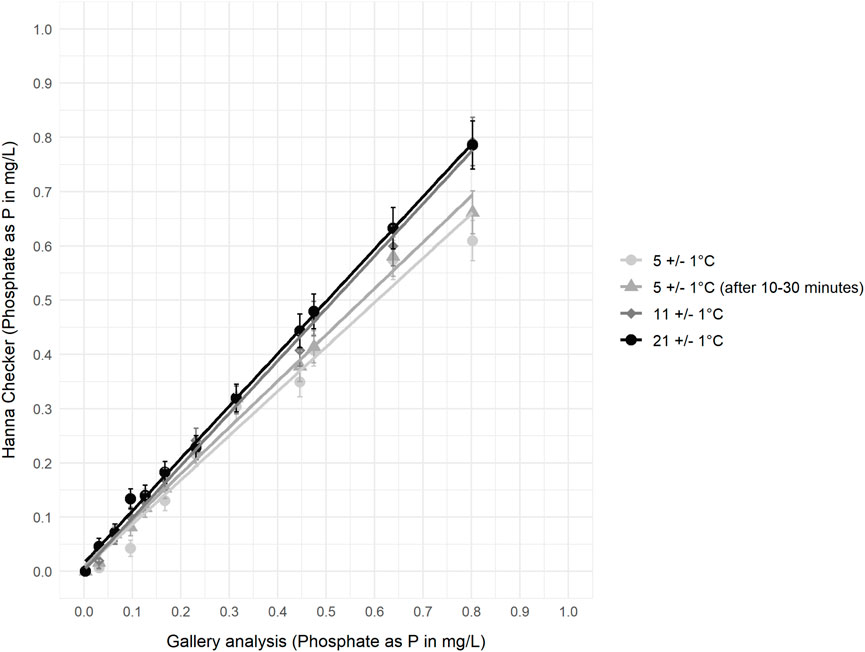
Figure 8. Gallery analyser results compared to Hanna Phosphate Checker results (including error bars as error stated by the manufacturer at 25 °C) for phosphate standard samples at different controlled temperatures following the standard procedures for all (except the second reading of the 5 °C sample).
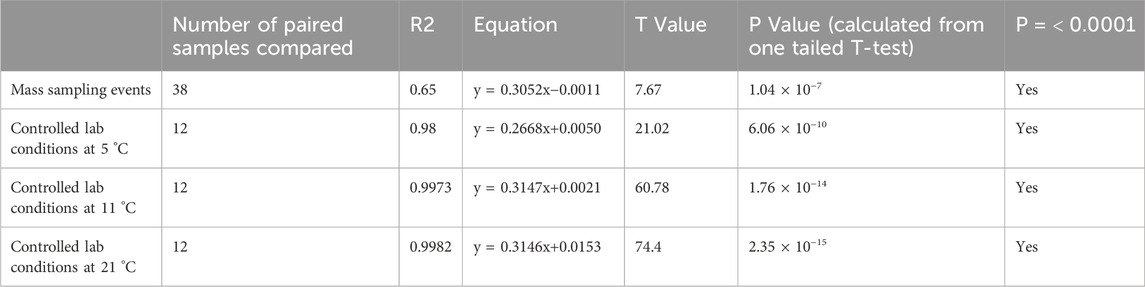
Table 5. Summary of regression analysis (R2) and statistical analysis (T-test, P value) for in-situ (mass sampling event) and controlled lab analysis of samples by the Hanna Phosphate Checker compared to professional lab techniques.
The agreement between PO4-P concentration measured by the Hanna Checker and the Gallery analyser improved as temperature increased (Figure 8): the biggest improvement in relationship was between 5 °C and 11 °C as mean absolute error improved from ±0.048 mg/L at 5 °C to ±0.011 mg/L at 11 °C, and remained ±0.011 mg/L at 21 °C (Table 6). For 11 °C and 21 °C samples, 100% and 92% of results respectively were in agreement with laboratory analysis when the manufacture stated equipment error on the Hanna Checkers and the error on laboratory analysis is accounted for, whereas this is limited to 42% of paired values at 5 °C (Table 6). At the lowest controlled temperature range (5 °C), a subset of samples were left for a longer reaction time (10–30 min before re-assessing the concentration using the colorimeter), which resulted in an increase in measured concentration and better agreement with the laboratory analyses (Figure 8).
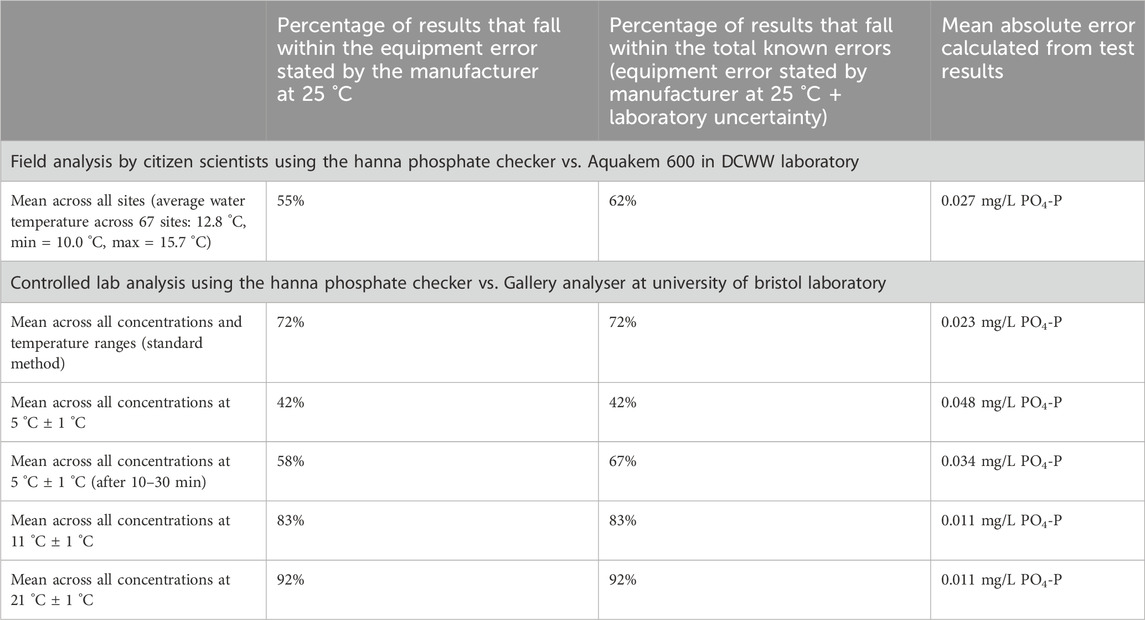
Table 6. Summary of mean errors calculated for the Hanna Phosphate Checker under different test conditions.
3.4.1 Error quantification
From data gathered during the mass sampling events, the average absolute error (Equation 1) calculated for the Hanna Phosphate Checkers was ±0.027 mg/L PO4-P (Table 6), using the results from paired sample laboratory as the expected value. In comparison, the expected mean error, based on the laboratory uncertainty for the Aquakem 600 (7.5%) and the manufacturer reported error on the Hanna Checker (±0.013 mg/L PO4-P ± 4% of reading), was ±0.018 mg/L PO4-P. This expected error was determined using the Root-Sum-Square (RSS) method for paired samples. The observed mean error exceeded the expected mean error by 0.009 mg/L, suggesting unidentified sources of error.
Controlled laboratory analysis of phosphate standards gave a slightly lower average absolute error for the Hanna Checker of ±0.023 mg/L PO4-P. However, this value varied considerably with temperature: at 11 °C and 21 °C the mean absolute error of samples was ±0.011 mg/L; at 5 °C the mean absolute error of samples was ±0.048 mg/L. For these controlled tests, the expected mean error, again calculated using the RSS method to combine the laboratory uncertainty for the Gallery analyser (1.1%) and the manufactures reported error for the Hanna Checker (±0.013 mg/L PO4-P ± 4% of reading) for paired samples was approximately ±0.024 mg/L PO4-P across all samples measured using the standard method. The observed mean error was therefore lower than the expected mean error by 0.001 mg/L, indicating under the range of conditions tested there were no further unidentified sources of error.
For the test strips, the absolute error outside the expected range (Table 7) was calculated using a modified approach (Equation 2; Figure 2) for data gathered during the mass sampling events. The mean absolute error of ±0.3 mg/L NO3-N calculated for the nitrate test strips equates to less than one-third of the smallest increment between test strip colour chart categories. A mean absolute error of ±0.06 mg/L PO4-P was calculated for the phosphate test strips from the mass sampling events. In contrast, this error is substantial as it equates to approximately 200 ug/L PO43- or double the smallest increment between test strip colour chart categories.
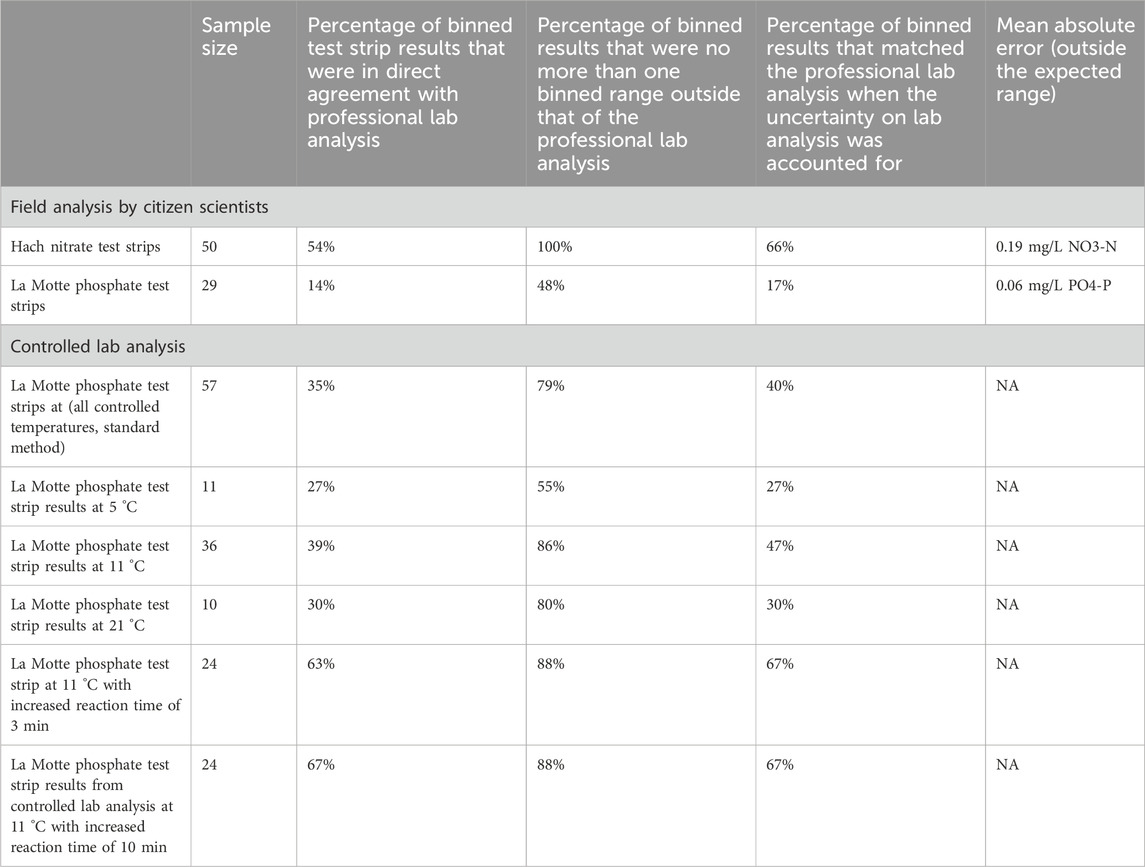
Table 7. Summary of error calculated for nitrate and phosphate test strips.
4 Discussion
Understanding the current state of low-cost test kits available to citizen science groups monitoring water quality is essential to understanding how and when the vast quantities of data already being gathered can be used by data analysts and decision makers. It can also help in planning future citizen science monitoring programmes by enabling groups to understand which tools might best meet the needs of data users in particular situations. As with all monitoring programmes, it is necessary that the purpose and aims of the monitoring are established before details of the programme (including the methods used) are decided. This study attempts better understanding of the tools currently available to citizen scientists to determine whether they are suitable and will meet the requirements of such monitoring programmes.
4.1 The reliability of test strips for nitrate and phosphate analysis
Data from the mass sampling events demonstrated that the Hach nitrate test strips performed well in the field, with good accuracy when compared to professional laboratory analysis of NO3-N: 54% of results were in direct agreement with laboratory analysis when data was binned, and 66% of results were in agreement once the uncertainty on laboratory analysis was also accounted for. Furthermore, no results were more than one test strip category (binned range) outside the expected result. These findings are in agreement with a study carried out as part of the Wabash River Sampling Blitz (Muenich et al., 2016) where the same Hach nitrate test strips were assessed. Similarly, Muenich et al. found that 55% of nitrate + nitrite results reported by volunteers matched the range determined by laboratory analysis, and that 84% of test strip results were no more than one binned category outside the expected results based on laboratory analysis of paired samples.
In contrast, the La Motte phosphate test strips did not perform well in the field: only 17% of comparable test strip readings reported were in agreement with the expected binned results based on laboratory analysis, after the uncertainty on laboratory results was accounted for, and 52% of test strip results were more than one bin outside the expected range determined by laboratory analysis of paired samples. Although we have not found any other studies which carry out a similar comparative analysis on the La Motte Insta test strips for phosphate, the reliability of alternative commercially-available, low-cost test kits for phosphate analysis of freshwater samples have been reviewed by others: Muenich et al. (2016) found that the Hach Aquachek test strips (Cat. 27,571–50) (0–50 ppm PO4) produced results which matched the binned range determined by laboratory analysis in just 33% of samples but which fell within one bin of the laboratory result in 99% of samples on paired analysis undertaken during the Wabash River Sampling Blitz. However, the Hach test strips are designed to detect a much wider range of P concentrations compared to the La Motte test strips and typical concentrations of phosphate found in rivers (Meybeck, 1982). Correspondingly, they have low sensitivities, reflected in the large colour chart increments (0, 5, 15, 30, 50 mg/L PO43-). Thus, as most of the samples measured in the study by Muenich et al. (2016) were below 5 mg/L PO43-, they were categorised into either of the two lowest binned ranges (0–2.5 mg/L or 2.6–10 mg/L), demonstrating the limited practical application of the Hach test strips for monitoring phosphate in river water.
Quinlivan et al. (2020) assessed the performance of an alternative low-cost phosphate test, the Kyoritsu PACKTEST (Kyoritsu Chemical-Check Lab, Corp., Tokyo, Japan) (0–2 ppm PO4), and found that 53% and 36% of results produced were in agreement with binned ranges determined by laboratory analysis at each of two different river sites in South-West Ireland. These tests have a similar range (0–2 mg/L PO43-) and sensitivity (colour chart increments: 0.05, 0.1, 0.5, 1, 2 mg/L PO43) to the La Motte phosphate test strips, but the results of the study by Quinlivan et al. (2020) suggest the Kyoritsu PACKTEST produce more accurate results. However, while 60 tests were undertaken at each site, only two sites were analysed. Lévesque et al., 2017 also assessed the Kyoritsu PACKTEST and found a strong agreement with professional laboratory analysis: 81% of the 111 paired samples assessed using the kits in the same binned range as laboratory results. However, all samples in their study were determined by laboratory analysis to be in the same (lowest) binned range of <0.02 mg/L, which again limits our knowledge of the low-cost test kit’s performance across a range of environmental conditions and concentrations. Ultimately, the results from our study and others (Quinlivan et al., 2020; Muenich et al., 2016; Lévesque et al., 2017) indicate that there is a substantial challenge in finding low-cost phosphate tests that provide both the sensitivity of test required to define meaningful differences in concentration in freshwater and a good level of accuracy within these ranges.
Further analysis of the phosphate test strips under controlled laboratory conditions using phosphate standards, rather than river water samples tested in the field by volunteers, demonstrated a marked improvement in their performance. Overall 35% of test strip results from the controlled laboratory tests were in direct agreement with professional analysis of samples (compared to 17% of field results) and 79% were no more than one binned category outside the expected range (compared to 48% of field results). These improvements in performance could be due to a range of factors, including: the use of phosphate standard solutions instead of river water samples that remove interferences; controlled light conditions that reduce perceived differences in the colour change produced by the reaction; consistency in technique as a result of one person rather than multiple individuals performing tests; and consistency in interpretation due to differences in individual’s unique perception of colour. Temperature was unlikely to be a substantial influence in this test since samples assessed in controlled laboratory conditions were tested at a similar temperature to the river water samples (average 11 °C compared to 12 °C). However, temperature did have a significant influence on La Motte test strip results when samples were increased from 5 °C to 21 °C. Although further analysis with a larger sample size is required to confirm this, it is likely that with colder river water samples (<10 °C) warming them (to >10 °C) could lead to small improvements in the accuracy of results reported by volunteers.
The La Motte phosphate test strips appear to under-report concentrations of phosphate in both field and under controlled laboratory conditions, which volunteers suggested with either because the reaction time allowed by the test strip method may be insufficient for the reagent to fully react with the phosphate in the sample, resulting in limited colour development, or because the colour charts used for comparison may be difficult to interpret. Our controlled laboratory analysis of the phosphate tests showed that waiting longer time intervals (3 or 10 min) after carrying out the test procedure and before assessing the test result from the colour chart improved the accuracy of the results. Only in a very limited number of cases did an increase in reaction time result in an overestimation of PO4-P compared to professional standard laboratory analysis of paired samples. These findings support those of Jayawardane et al. (2012) who explored the effect of reaction time on colour intensity using similar low-cost colormetric phosphate tests. They observed a colour intensity increase up to 40 min following the initial reaction and after that colour intensity would begin to reduce (as the products degraded), and suggested that assessing colour intensity of the reaction after 10 min balanced allowing sufficient colour development to permit an accurate reading, without making the time taken to assess samples in the field onerously long. Our study suggests that as the change in concentration between 3 and 10 min is not statistically significant, a shorter time period still–somewhere between 3 and 10 min - might obtain optimum results for the La Motte phosphate tests.
4.2 The reliability of a handheld digital colorimeter for phosphate analysis
Handheld digital colorimeters, such as the Hanna Phosphate Checker, are higher cost and more complicated to use than the test strips but can report concentrations with better precision and, critically, remove colour perception subjectivity in the reporting of results. The Hanna Phosphate Checker performed well in this study, producing results that generally provided good agreement with paired professional laboratory analysis, both when samples were analysed by citizen scientists in the field (62%) and very good agreement with paired laboratory analysis when phosphate standards were analysed under controlled laboratory conditions (up to 100%). The lower degree of accuracy demonstrated in field tests than under controlled laboratory conditions using the Hanna Checker could be due to a range of factors, including: human error, field conditions, sample interferences, reporting errors, storing and transporting samples etc. It should also be noted that our mass sampling events were in autumn, when river temperatures ranged from 10.0 °C to 15.7 °C, which is below the manufacturer’s recommended operating temperature (25 °C).
Our results clearly demonstrate the effect of temperature on results produced by the Hanna Checker; the improved performance between 5 °C and 11 °C is substantial but any further improved performance between 11 °C and 21 °C is minimal. Under controlled laboratory conditions, Hanna Checker results also indicate that if increased reaction times between the sample and the reagent are allowed at lower temperatures, the accuracy of results improves. This suggests that at lower temperatures (<10 °C), the accuracy of results could be improved by either (i) leaving the sample to react for longer than stated by the manufacture before assessing concentration of PO4-P, or, (ii) bringing samples to room temperature before analysis. Nevertheless, the Hanna Checker performs well in “real-world” conditions, assessed down to 0.03 mg/L PO4-P in this study, and can make a valuable contribution to in situ monitoring of phosphate.
Whilst quantification of the performance of the Hanna Phosphate Checker at lower concentrations of river water samples (<0.03 mg/L PO4-P) would be advantageous for a full understanding of biogeochemical processes, analysis was carried out down to 0.005 mg/L on controlled laboratory analysis of phosphate standards. Furthermore, if concentrations of P are below the detectable threshold used for comparative analysis in this study (<0.03 mg/L) then they are generally within regulatory limits that classify the ecological status of a river as ‘good’, as defined by United Kingdom Technical Advisory Group (TAG) under the WFD (Fones et al., 2020). Arguably, higher concentrations (or nutrient ‘hotspots’) are of most interest in assessing river water quality and identifying samples as <0.03 mg/L PO4-P, even if the accuracy of tests below this limit are poor, would allow the Hanna Checkers to act a useful screening tool to detect low concentration samples.
4.3 Recommendations for the use of test kits for citizen science nitrate and phosphate analysis
Whilst citizen science data are unlikely to perform to the same standards (sensitivities, limit of detection) as data acquired by professionals using more expensive field or laboratory methods of analysis, this study has shown improved understanding of the limitations and characteristics of low-cost methods of analysis means that reliable data of a consistent and known quality (accuracy, bias, precision) can be gathered by citizen scientists. It is, however, critical that the aims and objectives of a citizen science monitoring programme are set out with test kit performance in mind in order to gather meaningful data.
Colorimetric test strips, such as those assessed in this study, are designed primarily as education tools (Kosmala et al., 2016) or for specific non-environmental monitoring purposes, such as for home aquariums, hot tubs or swimming pools, so their applicability to a wider range of freshwater environments is not necessarily intended. First, the temperatures of these recreational water systems are typically distinctly warmer than United Kingdom rivers, which is likely to affect reaction times and test results (in this study, average water temperature across all 67 sites assessed: 12.8 °C, min = 10.0 °C, max = 15.7 °C). Second, low ionic strength freshwaters often challenge field analytical methods (Bagshaw et al., 2016) and performance may be affected by interference from other chemical species present in high concentrations in natural water bodies, such as silicate (Jayawardane et al., 2012). Third, degradation of reactants on the test strips may also occur when they are exposed to water or UV for example, (Jayawardane et al., 2012), so correct storage and adhering to expiry dates is very important and could easily be overlooked. Finally, the overall expected ranges of phosphate in freshwater are very low compared to nitrate, usually approximately an order of magnitude less (Meybeck, 1982), so methods suitable for some analytes of interest may not be applicable to all. Producing low-cost colorimetric tests that are sensitive enough to detect subtle step changes at such low concentrations whilst making these changes clearly visible to the naked eye is a substantial challenge facing reliable citizen science phosphate monitoring using these tools.
Low-cost test kits that do not rely on subjective interpretation by the user and produce results comparable to professional laboratory analysis are highly desirable. Whilst they may be more difficult to use than test strips, and therefore require more comprehensive training or leave more room for human error in test procedure, the Hanna Checker demonstrated its ability to produce results very close to professional laboratory analysis. Those designing citizen science monitoring programmes need to consider whether tests that are more expensive and more involved for volunteers to use (such as the Hanna Checker) are required to meet the objectives or the monitoring programmes or whether simpler, lower cost alternatives (such as colorimetric test strips) are sufficient: is the improved data quality (in terms of the degree of accuracy and precision provided) required to reliably answer the scientific research questions posed, or, is a lesser but known quality of data sufficient?
Our assessment shows that lower cost test strips for nitrate perform well within the sensitivity ranges provided by the manufacturer (±0.06 mg/L on average). Conversely, phosphate test strips appear to be better suited to indicating the relative (low, medium or high) concentrations of phosphate rather than the more refined categories presented in the color chart provided by the manufacturer. The ongoing use of test strips across the concentration range of interest needs to be carefully considered. Our data demonstrate that when water temperatures are <20 °C, increasing the reaction time of the La Motte strips from the manufacturer’s recommended 15 s up to 3 min can improve the accuracy of data reported, and when water temperatures are <10 °C, warming to >11 °C could also deliver improvement in both La Motte test strip and Hanna Checker colorimeter assessments.
There are other low-cost methods available for these parameters, although we note that the range covered by the Hach test strip for phosphate is generally too wide for most river water quality monitoring applications (Muenich et al., 2016). Novel low-cost colorimetric tests, similar to test strips, are under development (Richardson et al., 2021; Cinti et al., 2016; Jayawardane et al., 2012), which may have utility in river water monitoring. However, we emphasise that data gathered using low-cost tests have the potential to indicate contamination hotspots or detect critical changes in nutrient concentrations in freshwater across large geographical areas, especially when the quality of data can be assessed. Their value lies in volunteers’ ability to use these low-cost tests to acquire large quantities of high spatial and temporal resolution data compared to professional grab sampling approaches. It is essential that volunteer training in best practice is ongoing and that methods are amended if new evidence emerges to suggest improvements can be achieved in a range of real world conditions. This approach will ensure the quality of data that can be achieved with low-cost test kits is optimised and that data gathered by groups using the same tools remains both reliable (within the known limits of test sensitivity and accuracy) and comparable across different volunteer monitoring groups.
5 Conclusion
Low-cost nutrient test kits designed for easy use and suitable for non-professional scientists can provide valuable water quality data in river catchments that are typically vastly under-surveyed by professional monitoring programmes. Understanding the reliability of the data gathered by citizen scientists is essential for assessing how these data can and should be used. Our assessment demonstrated that the Hanna Phosphate Checker and Hach Nitrate test strips can obtain data of comparable accuracy to laboratory analysis of samples, if monitoring protocols are followed correctly and the sensitivity of the tests is accounted for. These findings are of paramount importance for improving both the quality and perceived value of–and encouraging widespread use of–the vast quantity of water quality datasets now being gathered by volunteers across river catchments in the United Kingdom and beyond.
Data availability statement
The datasets presented in this study can be found in online repositories. The names of the repository/repositories and accession number(s) can be found below: Wye Alliance Citizen Science project page on Epicollect5, accessible at: https://five.epicollect.net/project/wye-alliance-citizen-science and can be viewed interactively at https://public.tableau.com/app/profile/mcarpenter/viz/WyeVizWyeAllianceCitizenSciencedashboard/START.
Author contributions
EvB: Investigation, Conceptualization, Methodology, Formal Analysis, Project administration, Writing – original draft, Writing – review and editing, Data curation. EAB: Funding acquisition, Supervision, Conceptualization, Methodology, Project administration, Writing – review and editing. RP: Funding acquisition, Conceptualization, Methodology, Writing – review and editing, Supervision. SB: Conceptualization, Writing – review and editing, Data curation, Methodology. TT: Resources, Writing – review and editing, Validation, Data curation, Methodology, Project administration, Investigation.
Funding
The authors declare that financial support was received for the research and/or publication of this article. We gratefully acknowledge the financial support provided by Cardiff University’s Engineering and Physical Sciences Research Council (EPSRC) First Grant scholarship to Elena von Benzon and Elizabeth Bagshaw and from the Natural Environment Research Council’s (NERC) Engagement for Wales funding to Elizabeth Bagshaw, RP and Elena von Benzon, which has made this research possible.
Acknowledgements
The authors wish to thank Monica Huerta-Lopez and Dŵr Cymru Welsh Water (DCWW) for their invaluable laboratory assistance. Special thanks go to volunteer monitoring groups across the Wye Alliance, including Wye Salmon Association (WSA), Friends of the River Wye, the merger of the former Friends of the Upper Wye, the Lower Wye, and the Welsh Lugg in 2023, and Campaign to Protect Rural England (Herefordshire), and to their volunteers for providing essential data collection. We are also grateful for the contributions of Andrew Osbaldiston and others from the Environment Agency, representatives from Natural Resources Wales, and others working across the Wye catchment, whose efforts have been pivotal in supporting and promoting credible citizen science water quality data gathering. We extend thanks to two reviewers who provided constructive feedback on the manuscript.
Conflict of interest
The authors declare that the research was conducted in the absence of any commercial or financial relationships that could be construed as a potential conflict of interest.
Generative AI statement
The authors declare that no Generative AI was used in the creation of this manuscript.
Any alternative text (alt text) provided alongside figures in this article has been generated by Frontiers with the support of artificial intelligence and reasonable efforts have been made to ensure accuracy, including review by the authors wherever possible. If you identify any issues, please contact us.
Publisher’s note
All claims expressed in this article are solely those of the authors and do not necessarily represent those of their affiliated organizations, or those of the publisher, the editors and the reviewers. Any product that may be evaluated in this article, or claim that may be made by its manufacturer, is not guaranteed or endorsed by the publisher.
References
Aceves-Bueno, E., Adeleye, A. S., Feraud, M., Huang, Y., Tao, M., Yang, Y., et al. (2017). The accuracy of citizen science data: a quantitative review. Bull. Ecol. Soc. Am. 98, 278–290. doi:10.1002/bes2.1336
Albus, K., Thompson, R., and Mitchell, F. (2019). Usability of existing volunteer water monitoring data: what can the literature tell us? Citizen Sci Theory Prac 4, 28. doi:10.5334/cstp.222
Bagshaw, E. A., Beaton, A., Wadham, J. L., Mowlem, M., Hawkings, J. R., and Tranter, M. (2016). Chemical sensors for in situ data collection in the cryosphere. Trends Anal. Chem. 82, 348–357. doi:10.1016/j.trac.2016.06.016
Burgess, H. K., Debey, L., Froehlich, H., Schmidt, N., Theobald, E. J., Ettinger, A. K., et al. (2017). The science of citizen science: exploring barriers to use as a primary research tool. Biol. Conserv. 208, 113–120. doi:10.1016/j.biocon.2016.05.014
Bussi, G., Whitehead, P. G., Gutiérrez-Cánovas, C., Ledesma, J. L., Ormerod, S. J., and Couture, R.-M. (2018). Modelling the effects of climate and land-use change on the hydrochemistry and ecology of the River Wye (Wales). Sci. Total Environ. 627, 733–743. doi:10.1016/j.scitotenv.2018.01.295
Capdevila, A. S. L., Kokimova, A., Ray, S. S., Avellán, T., Kim, J., and Kirschke, S. (2020). Success factors for citizen science projects in water quality monitoring. Sci. Total Environ. 728, 137843. doi:10.1016/j.scitotenv.2020.137843
Carlson, T., and Cohen, A. (2018). Linking community-based monitoring to water policy: perceptions of citizen scientists. J. Environ. Manag. 219, 168–177. doi:10.1016/j.jenvman.2018.04.077
Catlin-Groves, C. L. (2012). The citizen science landscape: from volunteers to citizen sensors and beyond. Int. J. Zoology 2012, 1–14. doi:10.1155/2012/349630
Chaabane, S., Riahi, K., Khlifi, S., Slama, E., and Vanclooster, M. (2024). Assessing the performance of a citizen science based water quality monitoring program for nitrates using test strips implemented in the medjerda hydrosystem in Northern Tunisia. Hydrology 11, 6. doi:10.3390/hydrology11010006
Cinti, S., Talarico, D., Palleschi, G., Moscone, D., and Arduini, F. (2016). Novel reagentless paper-based screen-printed electrochemical sensor to detect phosphate. Anal. Chim. Acta 919, 78–84. doi:10.1016/j.aca.2016.03.011
Collins, R., France, A., Walker, M., and Browning, S. (2023). The potential for freshwater citizen science to engage and empower: a case study of the Rivers Trusts, United Kingdom. Front. Environ. Sci. 11, 1218055. doi:10.3389/fenvs.2023.1218055
Dahlgren, R., van Nieuwenhuyse, E., and Litton, G. (2004). Transparency tube provides reliable water-quality measurements. Calif. Agric. 58, 149–153. doi:10.3733/ca.v058n03p149
DEFRA (2020). Latest water classifications results published. Smith Square: London: DEFRA. Available online at: https://deframedia.blog.gov.uk/2020/09/18/latest-water-classifications-results-published/ (Accessed September 18, 2020).
DEFRA (2023). Inaccurate coverage on monitoring water quality in England. Smith Square: London: DEFRA. Available online at: https://deframedia.blog.gov.uk/2023/11/01/inaccurate-coverage-on-monitoring-water-quality-in-england/ (Accessed November 1, 2023).
Dickson, A., Belmer, N., Denshire, A., Garland, I., Lennox, S., Ruming, S., et al. (2024). Can citizen science inform science? Evaluating the results of the bellingen Riverwatch citizen science program and a complimentary government monitoring program. Front. Environ. Sci. 11, 1237580. doi:10.3389/fenvs.2023.1237580
Downing, J. A. (2024). What's hot and what's not in the aquatic sciences—Understanding and improving news coverage. Limnol. Oceanogr. Lett. 9, 674–682. doi:10.1002/lol2.10425
Dyer, F., Harrison, E., Gruber, B., Nichols, S., Tschierschke, A., and O’Reilly, W. (2014). Waterwatch data quality: an opportunity to augment professionally collected data sets. In: Proceedings of the 7th Australian stream management conference; 2014 July 27–30; Townsville, Queensland. p. 27–30.
Ellwood, E. R., Pauly, G. B., Ahn, J., Golembiewski, K., Higgins, L. M., Ordeñana, M. A., et al. (2023). Citizen science needs a name change. Trends Ecol. and Evol. 38, 485–489. doi:10.1016/j.tree.2023.03.003
Farnham, D. J., Gibson, R. A., Hsueh, D. Y., Mcgillis, W. R., Culligan, P. J., Zain, N., et al. (2017). Citizen science-based water quality monitoring: constructing a large database to characterize the impacts of combined sewer overflow in New York City. Sci. Total Environ. 580, 168–177. doi:10.1016/j.scitotenv.2016.11.116
Fones, G. R., Bakir, A., Gray, J., Mattingley, L., Measham, N., Knight, P., et al. (2020). Using high-frequency phosphorus monitoring for water quality management: a case study of the upper River Itchen, UK. Environ. Monit. Assess. 192, 184. doi:10.1007/s10661-020-8138-0
Hegarty, S., Hayes, A., Regan, F., Bishop, I., and Clinton, R. (2021). Using citizen science to understand river water quality while filling data gaps to meet United Nations Sustainable Development Goal 6 objectives. Sci. Total Environ. 783, 146953. doi:10.1016/j.scitotenv.2021.146953
Jayawardane, B. M., Mckelvie, I. D., and Kolev, S. D. (2012). A paper-based device for measurement of reactive phosphate in water. Talanta 100, 454–460. doi:10.1016/j.talanta.2012.08.021
Johnson, A. C., Acreman, M. C., Dunbar, M. J., Feist, S. W., Giacomello, A. M., Gozlan, R. E., et al. (2009). The British river of the future: how climate change and human activity might affect two contrasting river ecosystems in England. Sci. Total Environ. 407, 4787–4798. doi:10.1016/j.scitotenv.2009.05.018
Jollymore, A., Haines, M. J., Satterfield, T., and Johnson, M. S. (2017). Citizen science for water quality monitoring: data implications of citizen perspectives. J. Environ. Manage 200, 456–467. doi:10.1016/j.jenvman.2017.05.083
Jonkers, A. R., and Sharkey, K. J. (2016). The differential warming response of Britain’s rivers (1982–2011). PLoS One 11, e0166247. doi:10.1371/journal.pone.0166247
Kosmala, M., Wiggins, A., Swanson, A., and Simmons, B. (2016). Assessing data quality in citizen science. Front. Ecol. Environ. 14, 551–560. doi:10.1002/fee.1436
Lévesque, D., Cattaneo, A., Deschamps, G., and Hudon, C. (2017). In the eye of the beholder: assessing the water quality of shoreline parks around the Island of Montreal through citizen science. Sci. Total Environ. 579, 978–988. doi:10.1016/j.scitotenv.2016.10.175
Lin Hunter, D. E., Newman, G. J., and Balgopal, M. M. (2023). What's in a name? The paradox of citizen science and community science. Front. Ecol. Environ. 21, 244–250. doi:10.1002/fee.2635
Loperfido, J., Beyer, P., Just, C. L., and Schnoor, J. L. (2010). Uses and biases of volunteer water quality data. Environ. Sci. and Technol. 44, 7193–7199. doi:10.1021/es100164c
Meybeck, M. (1982). Carbon, nitrogen, and phosphorus transport by world rivers. Am. J. Sci. 282, 401–450. doi:10.2475/ajs.282.4.401
Muenich, R. L., Peel, S., Bowling, L. C., Haas, M. H., Turco, R. F., Frankenberger, J. R., et al. (2016). The Wabash sampling blitz: a study on the effectiveness of citizen science. Citiz. Sci. Theory Pract. 1, 3. doi:10.5334/cstp.1
Njue, N., Stenfert Kroese, J., Gräf, J., Jacobs, S. R., Weeser, B., Breuer, L., et al. (2019). Citizen science in hydrological monitoring and ecosystem services management: state of the art and future prospects. Sci. Total Environ. 693, 133531. doi:10.1016/j.scitotenv.2019.07.337
Paul, J. D., Buytaert, W., Allen, S., Ballesteros-Cánovas, J. A., Bhusal, J., Cieslik, K., et al. (2018). Citizen science for hydrological risk reduction and resilience building. Wiley Interdiscip. Rev. Water 5, e1262. doi:10.1002/wat2.1262
Quinlivan, L., Chapman, D. V., and Sullivan, T. (2020). Validating citizen science monitoring of ambient water quality for the United Nations sustainable development goals. Sci. Total Environ. 699, 134255. doi:10.1016/j.scitotenv.2019.134255
R CORE TEAM (2024). R: a language and environment for statistical computing. Vienna, Austria: R Foundation for Statistical Computing.
Ramírez, S. B., van Meerveld, I., and Seibert, J. (2023). Citizen science approaches for water quality measurements. Sci. Total Environ. 897, 165436. doi:10.1016/j.scitotenv.2023.165436
Richardson, S., Iles, A., Rotchell, J. M., Charlson, T., Hanson, A., Lorch, M., et al. (2021). Citizen-led sampling to monitor phosphate levels in freshwater environments using a simple paper microfluidic device. Plos One 16, e0260102. doi:10.1371/journal.pone.0260102
Scott, A. B., and Frost, P. C. (2017). Monitoring water quality in Toronto's urban stormwater ponds: assessing participation rates and data quality of water sampling by citizen scientists in the FreshWater Watch. Sci. Total Environ. 592, 738–744. doi:10.1016/j.scitotenv.2017.01.201
Stankiewicz, J., König, A., Pickar, K. A., and Weiss, S. (2023). How certain is good enough? Managing data quality and uncertainty in ordinal citizen science data sets for evidence-based policies on fresh water. Citiz. Sci. Theory Pract. 8, 39. doi:10.5334/cstp.592
Starkey, E., Jones, A., Ochoa-Rodriguez, S., Mahajan, S., Wei, C.-L., Chen, P.-C., et al. (2024). Practicalities of community-led continuous water quality monitoring: lessons from Taiwan and UK pilots. Front. Environ. Sci. 12, 1371048. doi:10.3389/fenvs.2024.1371048
Thornhill, I., Loiselle, S., Lind, K., and Ophof, D. (2016). The citizen science opportunity for researchers and agencies. BioScience 66, 720–721. doi:10.1093/biosci/biw089
Walker, D. W., Smigaj, M., and Tani, M. (2021). The benefits and negative impacts of citizen science applications to water as experienced by participants and communities. Wiley Interdiscip. Rev. Water 8, e1488. doi:10.1002/wat2.1488
Warner, S., Blanco Ramírez, S., De Vries, S., Marangu, N., Ateba Bessa, H., Toranzo, C., et al. (2024). Empowering citizen scientists to improve water quality: from monitoring to action. Front. Water 6, 1367198. doi:10.3389/frwa.2024.1367198
Webster, S. E., and Dennison, W. C. (2022). Stakeholder perspectives on the roles of science and citizen science in chesapeake bay environmental management. Estuaries Coasts 45, 2310–2326. doi:10.1007/s12237-022-01106-5
Wehn, U., and Almomani, A. (2019). Incentives and barriers for participation in community-based environmental monitoring and information systems: a critical analysis and integration of the literature. Environ. Sci. and Policy 101, 341–357. doi:10.1016/j.envsci.2019.09.002
Wyeth, G., Paddock, L. C., Parker, A., Glicksman, R. L., and Williams, J. (2019). The impact of citizen environmental science in the United States. Envtl. L. Rep. News Analysis 49, (3) 10237. Available online at: https://ssrn.com/abstract=3344638
Keywords: citizen science, water quality, data quality, mass sampling event, low-cost monitoring, nutrient analysis
Citation: von Benzon E, Bagshaw EA, Perkins R, Browning S and Tibbits TND (2025) Reliability of low-cost colorimetric phosphate and nitrate tests used by citizen scientists to assess river water quality. Front. Environ. Sci. 13:1667241. doi: 10.3389/fenvs.2025.1667241
Received: 16 July 2025; Accepted: 06 November 2025;
Published: 26 November 2025.
Edited by:
Dana F. Simon, IVADO, CanadaReviewed by:
Natalia Malina, Florida Atlantic University, United StatesRiccardo Cirrone, University of Palermo, Italy
Copyright © 2025 von Benzon, Bagshaw, Perkins, Browning and Tibbits. This is an open-access article distributed under the terms of the Creative Commons Attribution License (CC BY). The use, distribution or reproduction in other forums is permitted, provided the original author(s) and the copyright owner(s) are credited and that the original publication in this journal is cited, in accordance with accepted academic practice. No use, distribution or reproduction is permitted which does not comply with these terms.
*Correspondence: Rupert Perkins, cGVya2luc3JAY2FyZGlmZi5hYy51aw==
†ORCID: Rupert Perkins, orcid.org/0000-0002-0810-2656