 Yuqin Yin
 Jing Qian*
- School of architecture, Nanjing Tech University, Nanjing, China
Introduction: Pollinators are vital for rural ecosystems and agriculture, yet their diversity is declining, threatening biodiversity and ecosystem stability.
Method: This study evaluates pollinator habitats in Pukou District, Nanjing, using an optimized Maximum Entropy (Maxent) model and landscape pattern analysis to map spatial distribution and assess village-level habitat suitability. By combining field survey data with multi-source database data, we optimized Maxent parameters and applied entropy-based weighting with K-means clustering to evaluate 66 villages.
Results: Results reveal a three-tiered gradient pattern (mountainforest core, agricultural transition, urban fringe), with 19 high-, 28 moderate-, and 19 low-suitability villages. Natural–artificial edges form synergistic hotspots, while roads support 69%–71% of habitats, and settlements suppress 33%–47%. High-suitability villages benefit from low patch density and high heterogeneity, unlike low-suitability villages with intensive agriculture. We propose core protection, ecological corridors, and community-based conservation, offering a framework for rural biodiversity management in urbanizing regions.
1 Introduction
Pollinator diversity is significant for rural biodiversity and is an important resource for sustainable agriculture. Currently, more than 87.5% of the pollination of angiosperms, more than 70% of the pollination of crops, and more than 35% of the pollination of food crops rely on pollinating insects (Bartholomée and Lavorel, 2019). Rural areas are hotspots for biodiversity and home to a rich variety of pollinators. However, with the advance of modernization, changes in land use (Huang ChunWei et al., 2018; Simkin et al., 2022), intensification of agricultural activities (Shi et al., 2024), and shifts in the lifestyles of rural residents (Shwartz et al., 2013) have destroyed the habitats of pollinators. Studies in rural-urban gradients show that urbanization reduces functional diversity of different species of bees (Ayers and Rehan, 2025). Therefore, it is urgent to conduct research on the precise identification and graded protection of pollinator habitats at the village level in the background of rapid urbanization to coordinate ecological security and urban development.
The conservation and enhancement of pollinator habitats are increasingly becoming a focal point in international research. Regional-scale research emphasizes the identification of potential habitats (Liu et al., 2025) and assessment of existing habitat types (Louis-Lucas et al., 2025) in order to protect and restore pollinator habitats with higher landscape connectivity. Landscape-scale research concentrates on the spatial distribution patterns of habitats (Ren et al., 2023), enhancing landscape heterogeneity and connectivity (Parmentier et al., 2025), with an emphasis on the rational allocation of land use types, land cover (Ranalli et al., 2025), and plant species (Kovács-Hostyánszki et al., 2019). Patch-scale research aims to enhance the quality of the monotypic habitat (Levé et al., 2019) and constructing microhabitat networks (Raderschall et al., 2022).
Although considerable research has addressed habitat conservation for pollinating insects, several limitations persist. The identification of potential pollinator habitats currently relies primarily on remote sensing imagery and field investigations (Bergholz et al., 2022; Geppert et al., 2020), as the main methods of habitat assessment. While these methods provide data with reasonable accuracy, they are unable to effectively integrate the diverse habitat requirements of pollinators or support continuous assessment across multiple spatial scales, owing to constraints in image data resolution and the extensive expertise required for field surveys. Moreover, while existing studies suggest that landscape heterogeneity and connectivity determine the movement, genetic exchange, and resource accessibility of pollinator insects, and that patch-scale measures such as establishing wildflower strips (Mateos-Fierro et al., 2023) and hedgerows (Marshall and Moonen, 2002) can effectively enhance local pollinator abundance and diversity, most research focuses solely on the proportion of natural habitat without accurately quantifying the gradual impacts of human activities on pollinator habitats. Additionally, these studies fail to optimize the spatial allocation of conservation measures to maximize their efficacy.
To address these challenges, this study examines Hymenoptera (HYM), Lepidoptera (LEP), and Diptera (DIP) as the primary pollinator orders, distinguished by their high flower-visitation rates (Haris et al., 2024). Their scales or body hair facilitate pollen transfer during flower visits, delivering effective pollination services and enhancing fruit set rates (Lichtenberg et al., 2024; Goodwin et al., 2021). While Coleoptera (beetles) can contribute to pollination in some systems, they were excluded due to lower flower-visitation frequencies and pollination efficiency (Larsson, 2005) compared to HYM, LEP, and DIP in rural Chinese landscapes.
This study aims to: (1) map the spatial distribution of pollinator habitats in rural areas using an optimized MaxEnt model; (2) assess village-level habitat suitability through landscape pattern analysis and entropy-based weighting; and (3) propose targeted conservation strategies for biodiversity management in urbanizing regions. By integrating field surveys with multi-source data, we provide a framework for rural pollinator conservation, offering theoretical support for ecological planning in rapidly urbanizing areas like China.
2 Materials and methods
2.1 Selection of typical areas
The rural areas of Pukou District, Nanjing, are situated in the northwestern and western regions of the district, encompassing 178 natural village sites, covering a total area of 589.27 km2 (Figure 1). Within the study area, substantial areas of farmland, forest, and other habitat types remain, which are essential for pollinator habitat conservation. Moreover, the study area includes key ecological nodes, such as Laoshan, Guanyinshan, and Lvshuiwan, which are vital for conserving pollinator diversity in Pukou District’s rural areas. The Laoshan Nature Reserve hosts 2,081 species, representing 47.66% of Jiangsu Province’s total species, including 718 insect species. Among them, Lvshuiwan has complex terrain and topography, with a variety of wetland types, providing favorable conditions for the growth of numerous plants and animals.
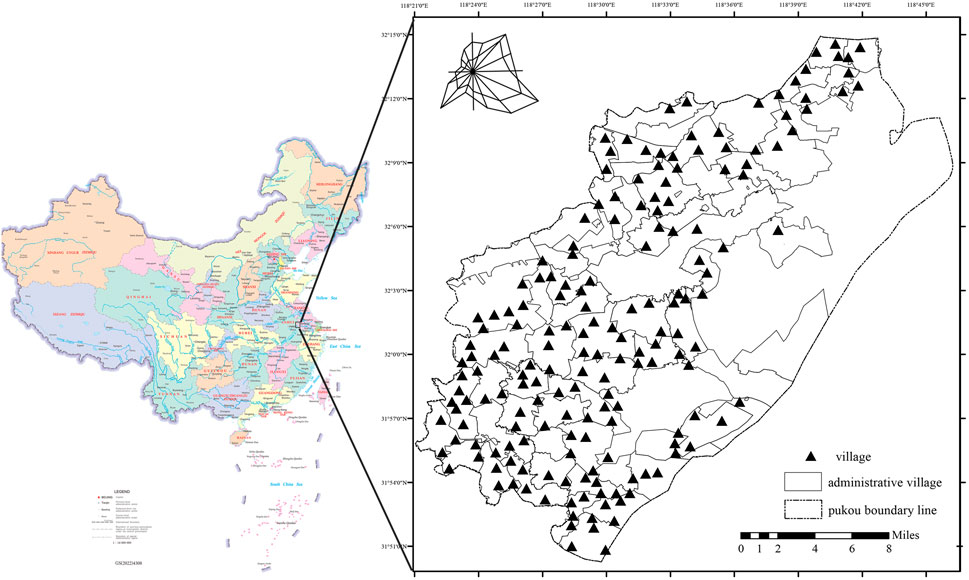
Figure 1. Map of Pukou district study area with village locations.
Pukou District, a core component of Nanjing Jiangbei New Area, faces a conflict between rapid urbanization and ecological conservation. According to the Nanjing Pukou District Territorial Spatial Plan (2021–2035) and related policies, major industrial projects in Jiangbei New Area have driven the expansion of construction land, with 61.9% occupying arable land, encroaching on pollinator habitats. Concurrently, modern urban development has intensified regional pollution and disturbances, exacerbating pollinator habitat fragmentation, thereby heightening the vulnerability of ecosystems.
Thus, selecting Pukou District as the study area not only captures the characteristic features of rural pollinator habitats but also serves as a critical case study for biodiversity conservation under intense urbanization.
Pollinator data were sourced from field surveys conducted in spring 2025 in Pukou District’s rural areas using the cross-sectional counting method (Natuhara et al., 1998), supplemented by the Global Biodiversity Information Facility (GBIF, https://www.gbif.org/, accessed February 2025), the Integrated Insect Specimen Database (https://insectaintegration.com/, accessed February 2025), and literature reviews, resulting in 300 records with precise geographic coordinates.
Habitat information was compiled from the Chinese Animal Theme Database (http://www.zoology. csdb.cn, accessed February 2025) and Fauna Sinica Insecta, summarizing the habitat characteristics of pollinators in Pukou District’s rural areas. Ultimately, habitat features for 37 families and 313 pollinator species were compiled, with key attributes extracted, including host plants, suitable temperature ranges, and altitude (Table 1).
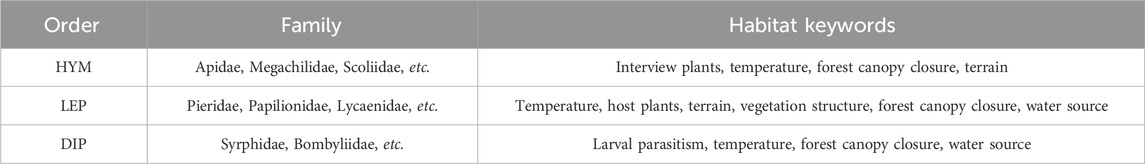
Table 1. Habitat characteristics of pollinator species in Pukou district.
Most crops serve as targets for pollinators. Syrphidae larvae prey on aphids, thrips, and other agricultural pests. Most LEP insects congregate in rice paddies and wetlands near small streams to access water. LEP host plants exhibit varied environmental requirements, necessitating consideration of factors such as forest canopy closure and terrain. Given the varied flight abilities of pollinators, habitat proximity is a key factor influencing their distribution. Concurrently, human activities significantly impact pollinators. Although all three insect orders are influenced by temperature, climate change was deemed insignificant due to the study area’s limited spatial extent, and thus excluded as an environmental factor. In summary, 13 environmental factors were selected (Table 2).
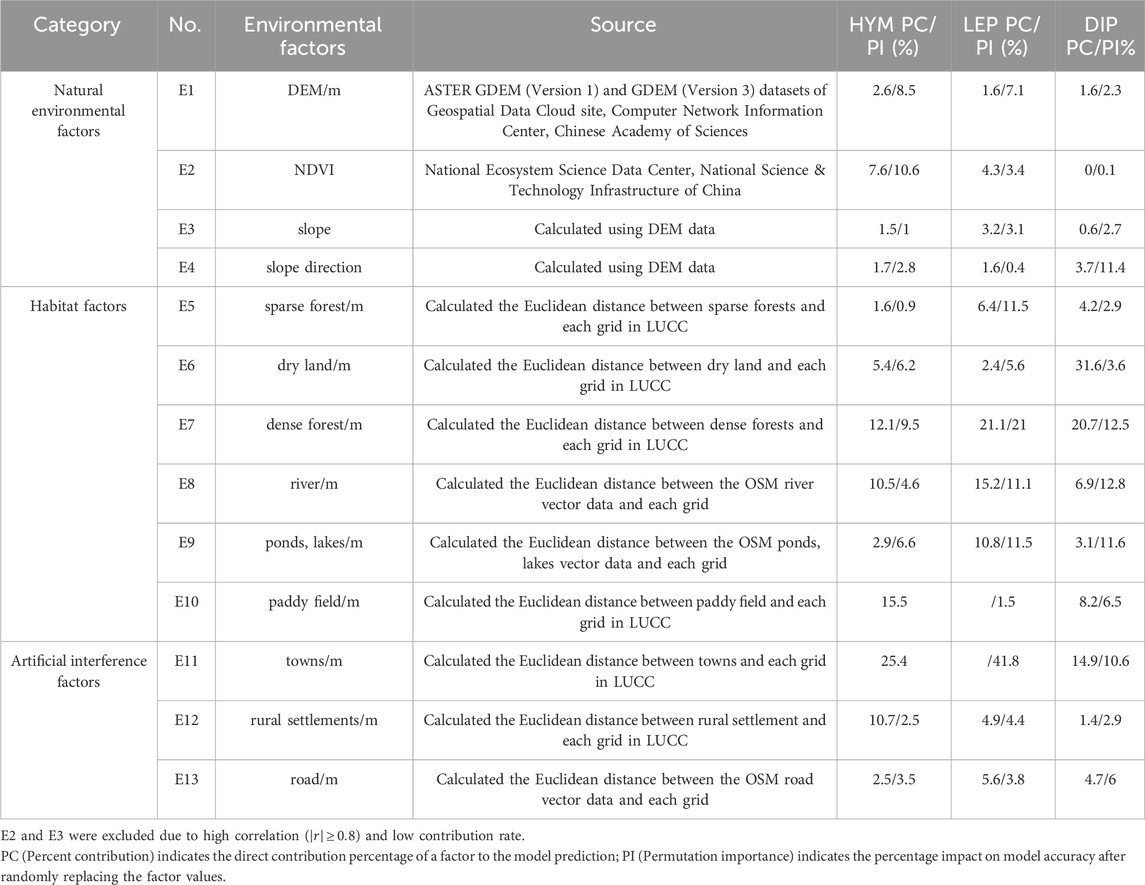
Table 2. Environmental factors and their contributions to Maxent modeling in Pukou district.
Terrain data were sourced from the Geospatial Data Cloud, Computer Network Information Center, Chinese Academy of Sciences (http://www.gscloud.cn). The Normalized Difference Vegetation Index (NDVI) was obtained from the National Ecosystem Science Data Center, National Science & Technology Infrastructure of China (http://www.nesdc.org.cn). Land cover data (LUCC) were sourced from the Resource and Environment Science Data Platform (https://www.resdc.cn/Default.aspx). Road network and river data were sourced from OpenStreetMap (https://www.openstreetmap.org/). All data were collected for 2020, with distance factors calculated using Euclidean distances to land use types. Data processing and analysis were conducted using ArcGIS 10.8, with all raster files standardized to a 30 m
2.2 Research methods
2.2.1 Data and model Parameter optimization
1. Sample distribution and data cleaning: Approximately 45% of records from online databases were concentrated in the Laoshan forest area, with fewer records from farmland and urban fringe areas. This is likely due to Laoshan’s high ecological integrity and the convenience of field surveys, resulting in sampling bias. This uneven distribution could cause the Maxent model to overfit the Laoshan habitat, thereby reducing prediction accuracy in other areas. To address this issue, the “Trim duplicate occurrences” function in ENMTools was applied to retain only one record per 30 m
2. Environmental factor screening: Percent Contribution (PC) and Permutation Importance (PI) were used in the Maxent model to evaluate the influence of ecological factors on species distribution (Bahn and McGill, 2013; Phillips et al., 2006). Initially, PC and PI values for 13 environmental factors were derived from a preliminary experiment. Subsequently, the ENMTools software package was employed to conduct correlation analysis on the 13 environmental factors. If the correlation coefficient
3. Model parameter optimization: Biological species exhibit diverse physiological mechanisms and ecological niche adaptations shaped by evolution. Using generic algorithms with preset parameters for modeling often limits applicability. Adjusting Feature Combination (FC) and Regularization Multiplier (RM) significantly enhances the Maxent model’s accuracy (Phillips and Dudík, 2008). This study optimized these parameters using the ENMeval package in R. The RM was set within the range [0.5, 4]. Literature and sample complexity suggest that a lower RM (0.5–1) is suitable for simple models to prevent overfitting, whereas a higher RM (3–4) is appropriate for complex landscapes to enhance generalization (Merow et al., 2013). Feature combinations comprised six types (L, LQ, LQP, H, LQH, LQHP), spanning simple to complex features, and were tailored to the ecological niche differences among insect orders (Elith et al., 2011).The ENMevaluate function was used to conduct a full permutation analysis of 48 parameter combinations, with optimal parameters selected based on the minimum delta AICc criterion.
2.2.2 Species habitat extraction
Filtered species data and environmental factors were imported into the model, optimal parameters were applied, and model simulation training was conducted. Pollinator distribution data were divided into a 3:1 ratio, with 75% allocated to a modeling subset and 25% to an independent validation set (Pramanik et al., 2021). Optimized RM and FC parameters were used to perform 10 independent simulations. The Area Under the Curve (AUC) and True Skill Statistic (TSS) were used to assess the accuracy of the model’s predictions (Khalaf et al., 2024). An AUC value
2.2.3 Suitable area classification and village suitability evaluation
In the model’s predictions, the distribution probability (p) of pollinators ranged from 0 to 1. Using ArcGIS 10.8, distribution maps of suitable habitats for the three insect orders were generated. The SDMtools toolbox was used to convert suitable habitats for the three pollinator orders into binary files, with areas having a distribution probability >0.3 designated as suitable habitats.
The shape index (Barahona-Segovia et al., 2023; Murakoshi et al., 2024), landscape fragmentation index (Buchori et al., 2019; Tommasi et al., 2023), and habitat advantage (Gillespie et al., 2024; Schoch et al., 2022) served as habitat patch evaluation indicators for each village. Furthermore, Maskell (Maskell et al., 2013) noted that changes in land use and landscape patterns can impact pollinator habitats, with landscape fragmentation, homogenization (Lajos et al., 2021; Marini et al., 2014), and single land use types (Begosh et al., 2022; Birkenbach et al., 2024) adversely affecting pollinator habitats. Consequently, patch density, CONTAG index, and Shannon diversity index were selected as evaluation indicators for village landscape patterns based on land use data (Table 3).
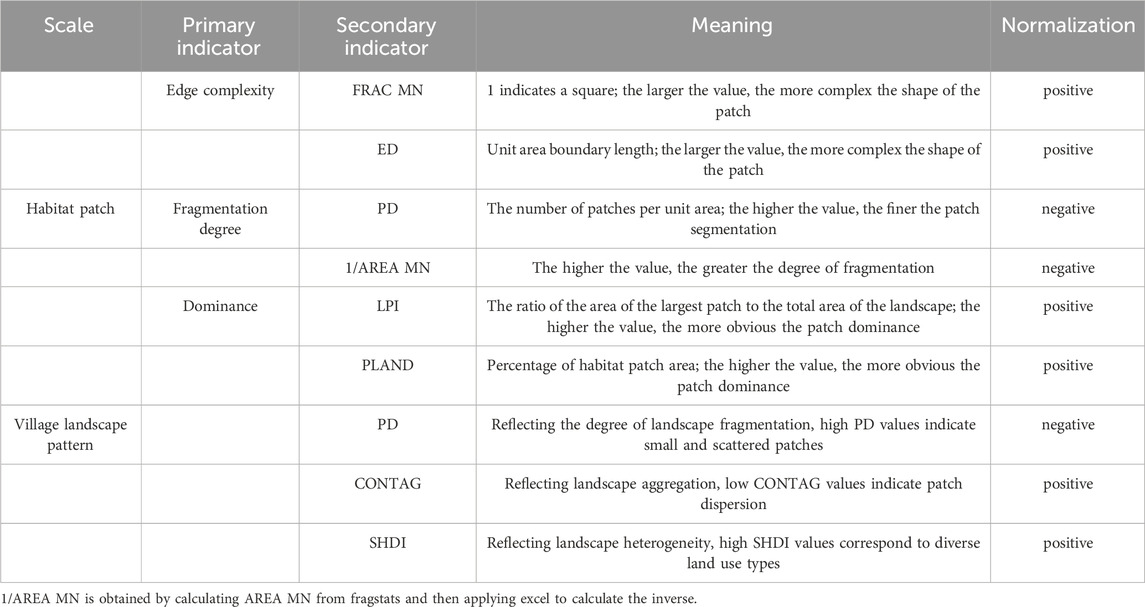
Table 3. Evaluation indicator system.
Indicator weights were calculated using the Entropy Weight Method, which assigns weights based on information entropy, minimizing human bias and enhancing the scientific rigor of the evaluation (Brown Jr and Freitas, 2000). Subsequently, both indicator types were normalized in Excel, and suitability values for the three pollinator orders were calculated using weighted summation. The arithmetic mean of the suitability values for the three pollinator orders was calculated to derive the comprehensive suitability index for the 66 villages. Finally, ArcGIS 10.8 was used to visualize the 66 administrative villages/communities, classified into three suitability categories—low, medium, and high—using the Jenks natural breaks method. The normalization formula is presented below:
In Formulas 2, 3, X1 is the normalized value of the pattern indicator, X2 is the inverse value of the pattern indicator, Xt is the actual value of the pattern indicator, Xmax is the maximum value of the pattern indicator, and Xmin is the minimum value of the pattern indicator.
The research methodology centered on optimizing the Maxent model, improving habitat distribution prediction accuracy through parameter optimization and multi-source data integration Landscape pattern analysis and entropy-based methods were integrated to thoroughly assess village suitability, ensuring result objectivity and comparability (Figure 2).
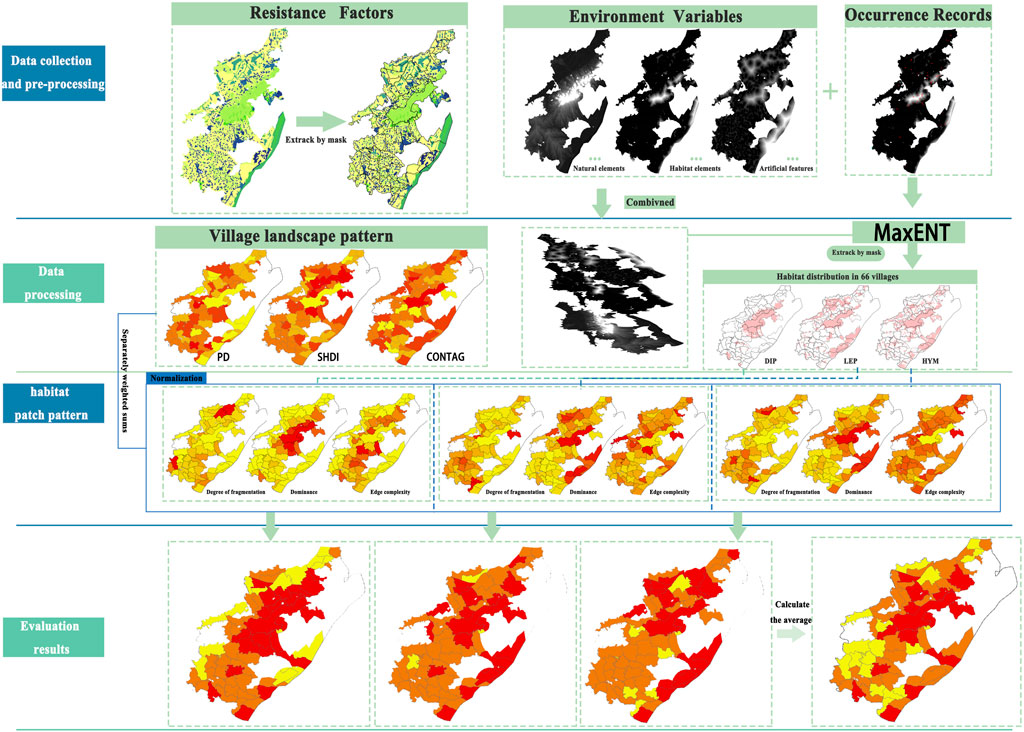
Figure 2. Study design.
3 Results
3.1 Data and model optimization results
Using ENMTools, Pearson correlation coefficients were calculated for 13 environmental factors. The results revealed that certain factors were highly correlated, with correlation coefficients of
Using the ENMeval package, optimal parameters were determined for the three pollinator orders. The results indicated that the optimal parameters were: RM = 3 and FC = LQ for HYM; RM = 3 and FC = LQHPT for LEP; and RM = 2.5 and FC = LQHP for DIP (Figure 3). Optimized parameters were applied to the Maxent model, yielding improved accuracy compared to default settings. The average AUC values were 0.793
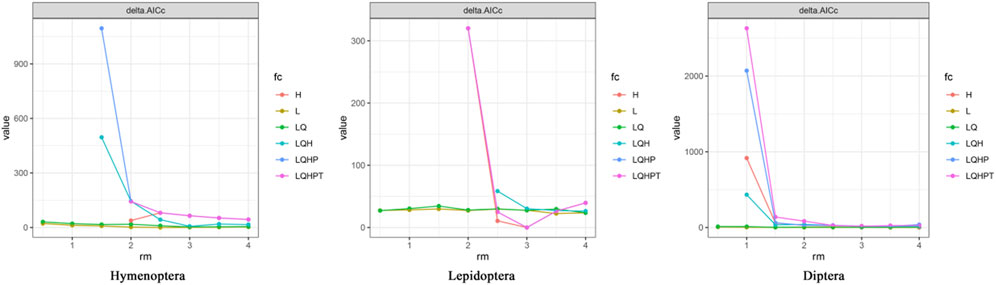
Figure 3. Optimized Maxent Model Parameters for Pollinator Orders in Pukou District,RM = Regularization Multiplier, FC = Feature Combination (L, LQ, LQHPT, etc.). Parameters optimized using ENMeval package in R based on minimum delta AICc.
3.2 Spatial distribution of species habitats
Maxent model results (Figure 4) indicate that pollinator habitats are primarily distributed within the Laoshan Mountain forest area, extending gradually to surrounding farmland and river habitats. Habitat area varies by pollinator order, with DIP exhibiting the smallest and LEP the largest. (1) HYM habitats are centered on the Laoshan forest area, with dispersed patches across rural areas in the region. The northern region, dominated by high-standard farmland, exhibits reduced ecological carrying capacity for HYM due to habitat homogenization. Conversely, the southwestern economic forest area supports HYM habitats due to its diverse vertical vegetation structure. (2) LEP habitats are primarily concentrated in the Laoshan forest area, with secondary aggregation centers in the northern Yongning-Tangquan ecological zone and southwestern village clusters. This distribution reflects ecological niche differentiation among LEP families: Pieridae predominantly occupy open agricultural areas, Papilionidae favor forest ecosystems with complex terrain and dense vegetation, and Lycaenidae are concentrated in grasslands with robust herbaceous layers and marginal habitats. The study area’s multidimensional habitat gradients effectively sustain LEP community diversity. (3) DIP habitats are primarily located in Laoshan Mountain forests, with scattered patches in rural areas and communities to the north and west. This distribution is attributed to the saprophytic nature of DIP larvae, as forests provide optimal saprophytic substrates and microhabitats for their development.
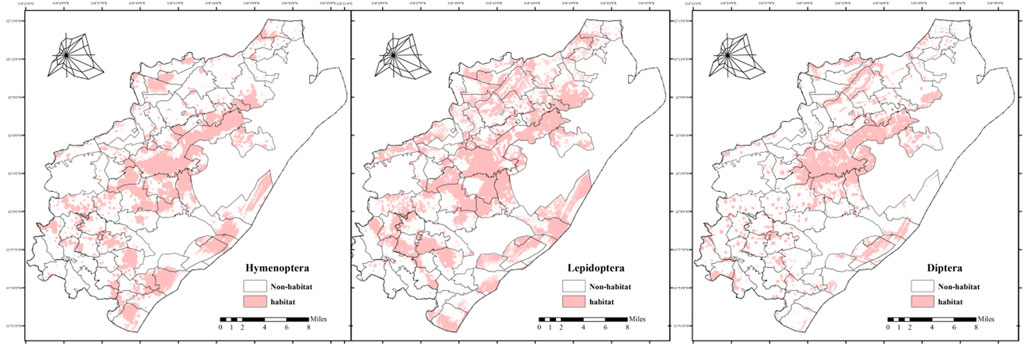
Figure 4. Spatial Distribution of Pollinator Habitats in Pukou District, Probability maps from Maxent model show habitats
3.3 Habitat patches and village landscape patterns
Landscape pattern characteristics of the 66 villages were quantitatively analyzed (Figure 5). The southwestern region displays high fragmentation, with the Shannon Diversity Index (SHDI) exhibiting a concentric pattern of low values in the central core and moderate values in the outer transition zone. The CONTAG index is inversely correlated with SHDI. In the northern region, fragmentation increases along the north–south axis, while SHDI decreases, with low CONTAG values indicating landscape dispersion in the paddy field–fish pond system. The central area shows low fragmentation and high CONTAG, but single land cover results in low SHDI. The southeastern region, however, exhibits both low fragmentation and high diversity.
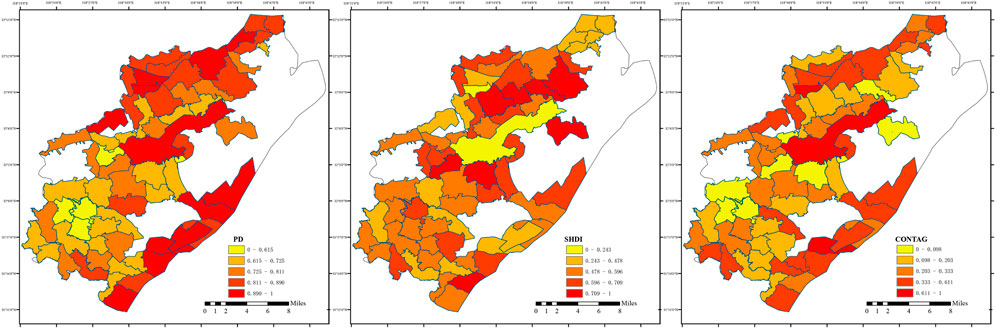
Figure 5. Landscape Patterns of Villages in Pukou District, Thematic map shows SHDI (Shannon Diversity Index), CONTAG (Contagion Index), and PD (Patch Density) for villages, calculated using Fragstats.
Six landscape indices for habitat patches of the three pollinator orders were calculated across the study area and normalized (Figure 6). LEP habitat patches exhibit greater habitat advantage than those of the other two orders, corresponding to their larger suitable habitat area. LEP habitats also demonstrate higher integrity, with elevated normalized PD and 1/AREA_MN values. HYM habitats show reduced edge complexity and greater patch fragmentation. DIP habitat patches exhibit the lowest dominance among the three orders, yet display low landscape fragmentation, with patches concentrated in the central mountainous areas and surrounding regions.
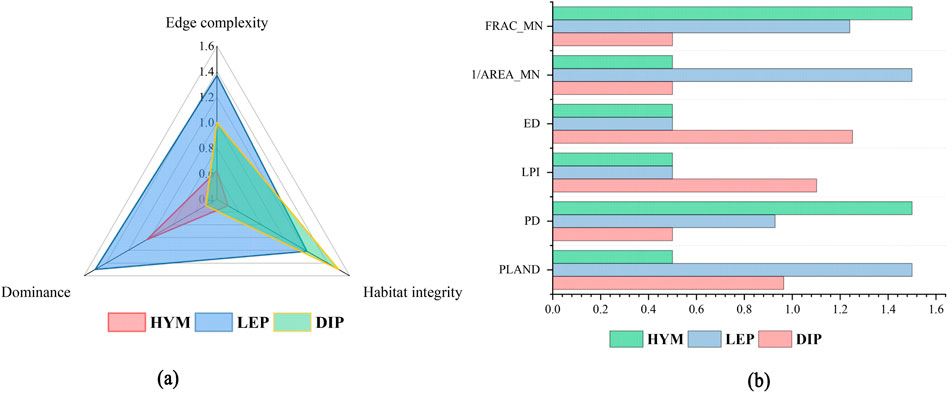
Figure 6. Habitat Patch Patterns of Pollinator Orders in Pukou District, Shows normalized indices (PLAND, PD, LPI, ED, 1/AREA_MN, FRAC_MN) for HYM, LEP, and DIP habitat patches, To make the chart presentation clearer, add 0.5 to all normalized values: (a) primary indicators; (b) secondary indicators. Calculated using Fragstats.
PLAND, PD, LPI, ED, 1/AREA_MN, and FRAC_MN were assigned weights of 0.111, 0.147, 0.150, 0.405, 0.100, and 0.087, respectively. Higher normalized PD and 1/AREA_MN values indicate greater habitat integrity. Edge complexity, habitat integrity, and habitat advantage for the three insect orders were derived through weighted calculations. The results are presented below:
1. HYM core habitats are concentrated in the central mountainous forest area, exhibiting significant ecological advantages and structural integrity (Figure 7). These habitats are characterized by high vegetation cover, well-developed vertical structure, and low edge complexity, forming a stable ecological unit. The southwestern sub-core area displays heterogeneous habitat quality with variable dominance and integrity. The northern area exhibits a fragmented habitat mosaic. Although small continuous habitats exist, the overall pattern limits stable population development.
2. LEP central core habitats demonstrate high ecological advantages, robust structural integrity, and minimal edge effects, serving as primary breeding and dispersal sources (Figure 8). Secondary core areas display a heterogeneous habitat quality gradient, with local patches exhibiting high dominance and integrity. However, at a broader scale, agricultural interface expansion results in habitat patches with fragmented to semi-continuous characteristics, with moderate dominance and integrity.
3. DIP habitats form a significant advantage center in the central region, reflecting continuous high-quality habitat units (Figure 9). Northeastern patches exhibited high edge complexity, whereas southwestern patches demonstrated relatively high integrity. Overall, DIP habitat patches display a “core aggregation–edge fragmentation” pattern.
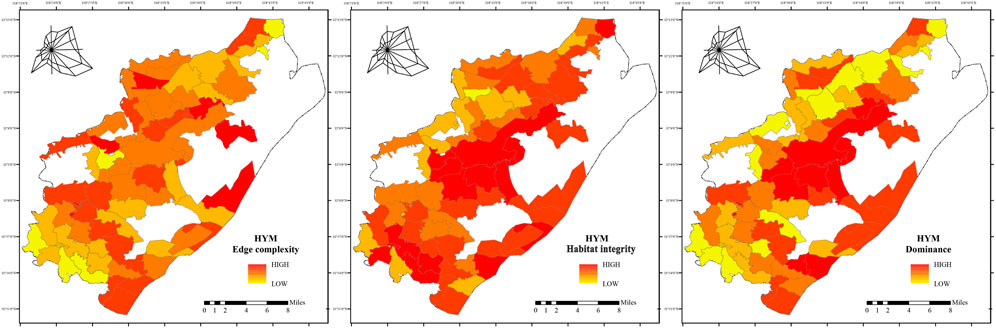
Figure 7. Habitat Patch Characteristics of HYM in Pukou District, Shows indices (PLAND, PD, LPI, ED, 1/AREA MN, FRAC MN) for HYM habitat patches, calculated using Fragstats.
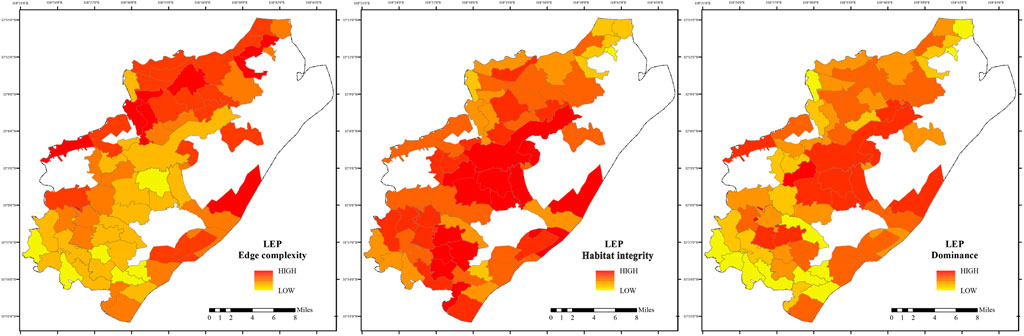
Figure 8. Habitat Patch Characteristics of LEP in Pukou District, Shows indices (PLAND, PD, LPI, ED, 1/AREA MN, FRAC MN) for LEP habitat patches, calculated using Fragstats.
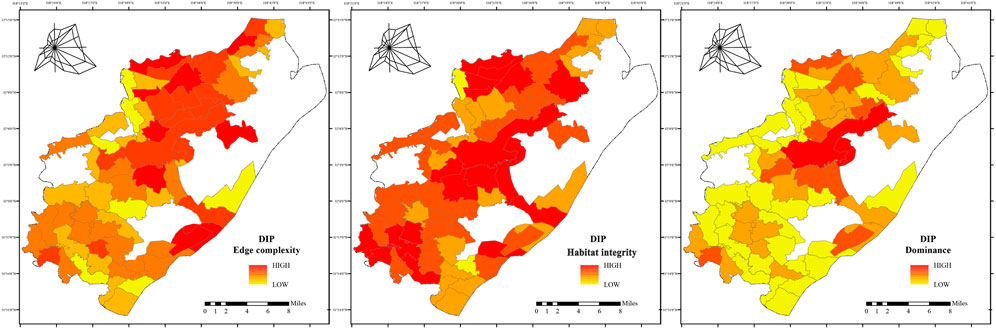
Figure 9. Habitat Patch Characteristics of DIP in Pukou District, Shows indices (PLAND, PD, LPI, ED, 1/AREA_MN, FRAC_MN) for DIP habitat patches, calculated using Fragstats.
3.4 Suitability evaluation
The weights for CONTAG, SHDI, and PD were 0.170, 0.214, and 0.616, respectively. The arithmetic mean of the suitability values for the three insect orders was calculated to generate the final suitability map (Figure 10).
1. High-suitability villages (0.612–0.713): 19 administrative units, including Chalukou and Huaguang. These villages are primarily located around mountains and forests or along the Lvshuiwan wetlands of the Yangtze River. Forest cover exceeds 20%, with undulating terrain and dispersed settlements. The water system comprises primarily scattered ponds and ditches. Landscape pattern analysis reveals low patch density and high SHDI, indicating high habitat heterogeneity and ecological integrity, which support abundant habitats and breeding resources for pollinators. Southeastern villages benefit from robust shoreline protection policies, further enhancing habitat stability.
2. Moderate-suitability villages (0.518–0.612): 28 administrative units, including Daqiao and Yongning. Using the factoextra package in R, K-means clustering was applied to moderate-suitability villages/communities, yielding optimal results with four categories and a silhouette coefficient of 0.42 (Figure 11). The first category, comprising eight administrative units, exhibits a complex landscape pattern with high heterogeneity and connectivity, but structural deficiencies in pollinator habitats limit insect dispersal. The second category, comprising seven administrative units, displays “dual degradation”, with both the landscape pattern and pollinator habitats in a low-functioning state. The third category, comprising six administrative units, demonstrates “landscape–habitat synergy optimization”. Its landscape pattern creates a synergistic effect with the pollinator habitat system, offering strong potential for improvement. The fourth category, comprising seven administrative units, has a moderately functional landscape pattern but exhibits robust habitat patch patterns, indicating functional enhancements through optimized local ecological processes.
3. Low-suitability villages (0.353–0.518): 19 administrative units, including Liugong and Wujiang. These villages are characterized by intensive agriculture and plantations, with high patch density, low SHDI, severe habitat homogenization, and low suitability for the three insect orders. Intensive agriculture has resulted in insufficient habitats, constraining pollinator survival and reproduction.
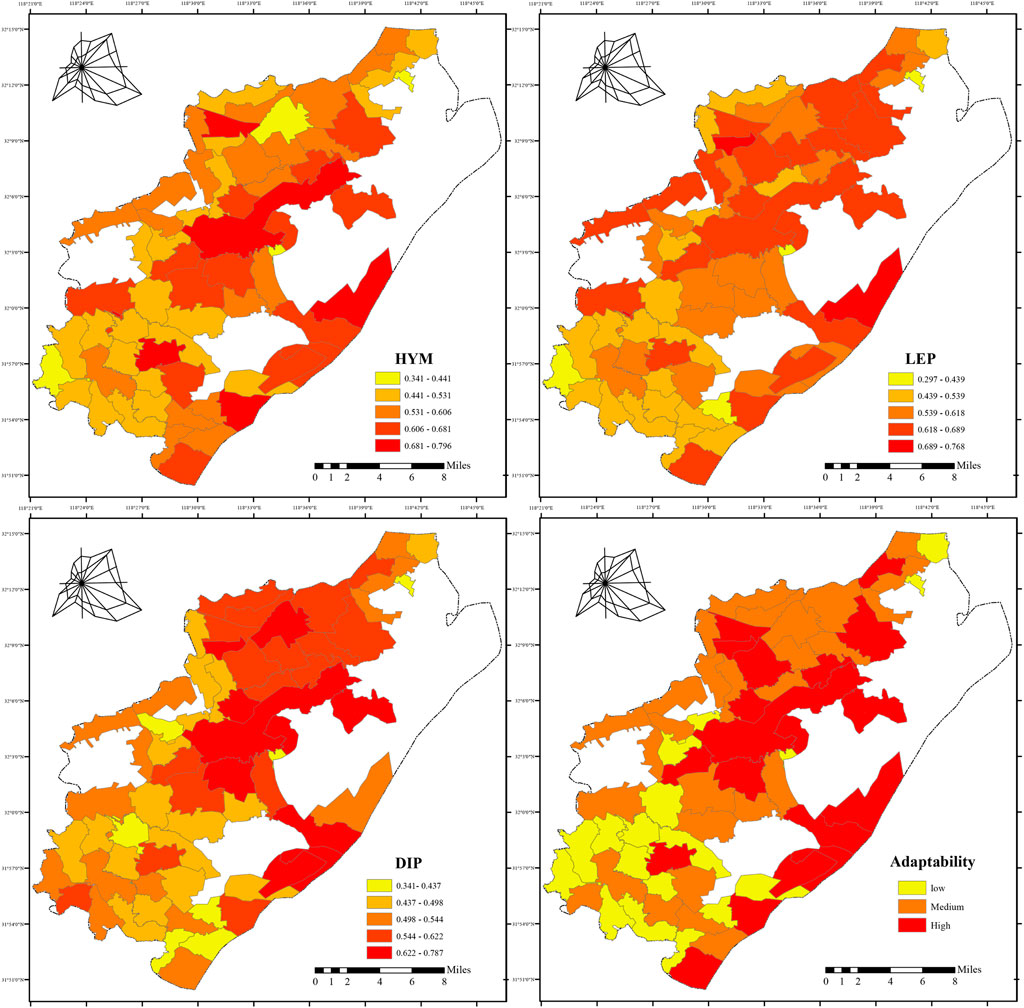
Figure 10. Suitability Map of Villages for Pollinators in Pukou District, Map (range: 0.353–0.713) shows suitability of villages for pollinators, classified using Jenks natural breaks method in ArcGIS 10.8.
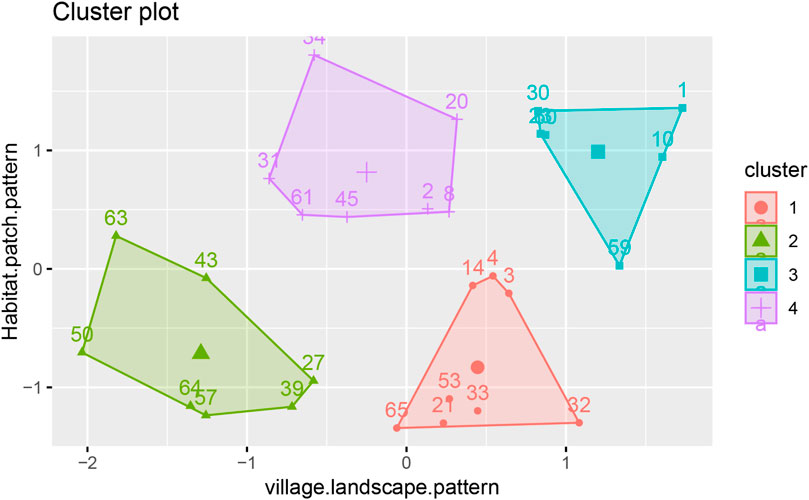
Figure 11. K-Means Clustering of Moderate-Suitability Villages in Pukou District, Shows K-means clustering (four categories, silhouette coefficient = 0.42) of 28 villages (codes linked to Table A1), performed using factoextra in R.
The findings revealed a “three-tiered gradient pattern” of pollinator habitats in Pukou District, synergistic hotspots at natural–artificial interfaces, and differential impacts of roads and settlements on habitat distribution. These findings demonstrate pollinators’ ecological adaptability to habitat heterogeneity and underscore the critical role of human activities in shaping habitat patterns. Future research will investigate the ecological mechanisms driving habitat distribution differentiation and synergy, examine the influence of landscape patterns on insect diversity, and develop targeted conservation and restoration strategies based on village suitability evaluations to enhance rural biodiversity conservation in Pukou District.
4 Discussion
4.1 Optimized modeling enhances habitat prediction accuracy
By optimizing the Maxent model’s parameters, this study markedly enhanced habitat prediction accuracy compared to studies using default settings. This study revealed that diverse RM and FC settings are required for different pollinator orders, reflecting their distinct ecological niches and environmental adaptations. The high AUC and TSS values obtained demonstrate that the optimized model is highly applicable to the study area and serves as a reliable tool for habitat assessment in regions with comparable ecological conditions. However, the limited DIP sample size may constrain prediction reliability, and future studies should include larger sample sizes to enhance model generalization.
4.2 Ecological adaptability reflected in habitat distribution patterns
The findings demonstrate that pollinator habitat distribution follows a “three-tiered gradient pattern” (mountain–forest core, agricultural transition zone, urban fringe), closely tied to the ecological adaptability of different pollinator orders. For instance, LEP’s extensive suitable habitat area reflects its robust adaptability to diverse habitats, particularly those with high vegetation diversity and complex terrain. This aligns with Gomez et al. (2014), who reported that LEP species exploit diverse ecological niches due to their varied host plant requirements. Conversely, DIP habitats are primarily concentrated in forest areas, reflecting the saprophytic larval requirements for specific microhabitats. The synergistic pattern at natural–artificial interfaces highlights pollinators’ ecological flexibility in exploiting resources at habitat edges. This finding aligns with Caitano et al. (2020), Cavigliasso et al. (2022), who noted that habitat edges frequently serve as ecological hotspots for pollinators due to resource concentration. However, the urban fringe exerts a pronounced inhibitory effect on habitat distribution due to fragmentation and pollution, particularly for HYM. Thus, future conservation efforts should prioritize enhancing habitat connectivity at the urban–rural interface to mitigate urbanization’s adverse impacts.
4.3 Habitat distribution synergy
Kernel density analysis (Figure 12) reveals that habitats of the three pollinator orders form synergistic hotspots at natural–artificial interfaces, including Xiangtang Village, the Laoshan–university campus transition zone, Hou Chong Wetland Park, and the Fenghuang Mountain area. The high SHDI index in the hot area suggests that habitat heterogeneity fosters interspecific coexistence. Moreover, Synergistic hotspots arise from resource sharing and interspecific interactions. The diverse landscapes of wetlands and transition zones offer varied food sources, supporting the foraging behavior of HYM and LEP. Water sources boost pollinator activity by sustaining humidity gradients and vegetation diversity. Conversely, DIP rely on saprophytic environments, restricting overlap with HYM and LEP, yet they exhibit Local synergies in ecological transition zones at forest edges.
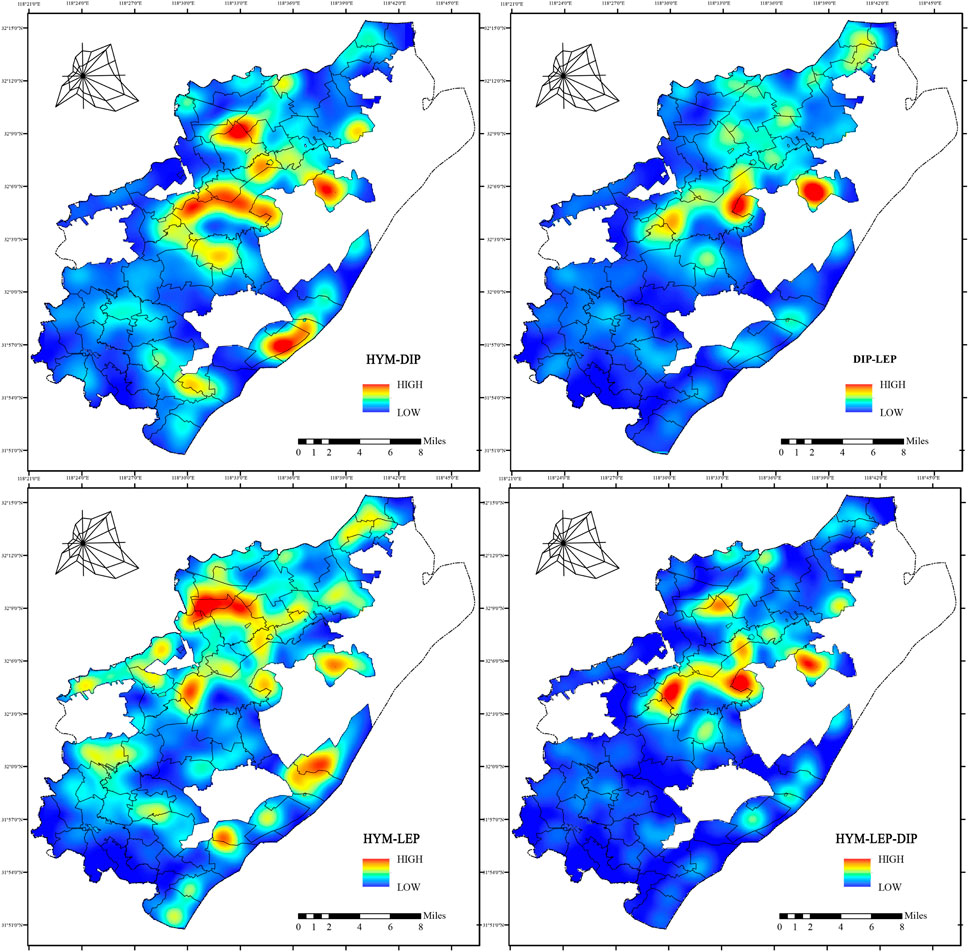
Figure 12. Kernel Density of Overlapping Pollinator Habitat Patches in Pukou District. Heatmap shows kernel density of overlapping HYM, LEP, and DIP habitat patches, calculated using center-of-mass extraction in ArcGIS 10.8.
Compared with European agricultural landscape studies (Kremen et al., 2007), Pukou District’s synergistic hotspots are predominantly located in areas of high ecological integrity, emphasizing the pivotal role of forests and wetlands over single agricultural areas. This synergy bolsters ecosystem stability and sustains pollination services for agriculture. However, urban expansion threatens connectivity in these hotspots, underscoring the need to prioritize protection of core habitats and ecological corridors.
4.4 Landscape patterns reveal habitat suitability heterogeneity
Landscape pattern analysis reveals pronounced spatial heterogeneity in habitat suitability across the 66 villages in Pukou District. High-suitability villages, primarily located in mountainous and forested areas, exhibit low patch density and high SHDI, indicating that complex landscape patterns support pollinator diversity. This aligns with Marini et al. (2014), who reported that highly heterogeneous landscapes sustain greater species richness. Conversely, low-suitability villages, characterized by intensive agriculture, exhibit high patch density and low SHDI, resulting in habitat homogenization and diminished pollinator suitability. Moderate-suitability villages display varied landscape patterns, with some demonstrating landscape–habitat synergy, while others are constrained by structural deficiencies. K-means clustering results underscore the potential for targeted improvements in these villages, particularly those with high landscape heterogeneity but limited habitat functionality. These findings highlight the critical role of landscape pattern optimization in enhancing habitat suitability and offer a scientific foundation for village-level conservation planning.
4.5 Effects of human disturbance gradients on habitat distribution
This study finds roads and settlements are primary human disturbance factors, given their pronounced spatial gradient effects in Pukou District’s rural landscape. Within a 0–300 m road buffer, habitat proportions for the three pollinator orders were 69%, 65%, and 71%, respectively, suggesting that roadside vegetation strips serve as foraging and migration corridors for HYM and LEP. Conversely, within a 0–300 m settlement buffer, habitats accounted for 47%, 40%, and 33%, reflecting the suppressive impact of intense human activity (Figure 13). Gradient analysis reveals that anthropogenic activities shape pollinator distribution by modifying habitat integrity and resource availability, and that road buffers can function as ecological corridors. These findings offer a scientific foundation for village suitability assessments and conservation strategies.
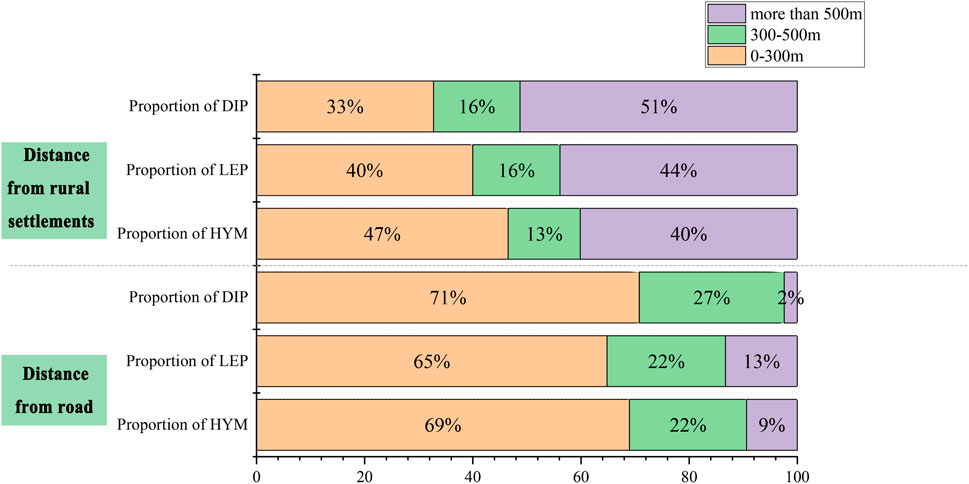
Figure 13. Pollinator Habitat Proportions Across Disturbance Gradients in Pukou District. Bar chart shows habitat proportions (%) for HYM, LEP, and DIP across road and settlement gradients (0–300 m, 300–500 m,
4.6 Protection and restoration recommendations
To realize mutual benefits for pollinator habitat conservation and rural development in Pukou District, we suggest a four-tier strategy of core protection, ecological corridor connection, agricultural optimization, and community participation.
1. Core Protection Areas. For high-suitability villages (e.g., Chalukou, Huaguang), conservation should: (a) designate forests and wetlands as permanent ecological zones, prohibiting road expansion or mining; (b) establish 50–100 m wide vegetation buffers at forest–town edges; and (c) adopt sustainable land-use policies aligned with Nanjing’s 2021–2035 Spatial Plan.
2. Ecological Corridor and Stepping-Stone Habitat Construction. For moderate-suitability villages (e.g., Daqiao, Yongning), restoration should: (a) plant native forbs in 10–20 m wide strips; (b) reduce patch density by merging fragments; (c) convert roads into green corridors with 10–20 m vegetation belts; (d) establish riverine corridors; and (e) spacing wildflower strips 0.five to two km to match pollinator dispersal.
3. Agricultural Optimization. For low-suitability villages (e.g., Liugong, Wujiang), restoration should: (a) reduce pesticide use; (b) plant diverse native species; (c) adopt crop rotation and intercropping; (d) create 20–50 m buffer zones; and (e) monitor non-point source pollution.
4. Community Participation and Policy Support. Community programs should: (a) promote conservation awareness; (b) develop eco-tourism routes, funding farmer-led wildflower maintenance; (c) establish monitoring networks with universities; and (d) integrate corridors into Nanjing’s green infrastructure plans. Landscape-scale planning should optimize road networks and encourage dispersed settlements to reduce fragmentation.
In summary, high-, moderate- and low-suitability areas were proposed as core protection, target areas for quality improvement and pilot areas for restoration, respectively. Based on policy incentives, technological support and public participation, this study offers a scientific basis for the effective protection of pollinators in Pukou District and a methodological guideline for the biodiversity conservation in the rapidly urbanized areas through optimized Maxent modeling and landscape-scale approaches.
5 Conclusion
This study employed an optimized Maxent model to map the habitat distribution of three pollinator orders (HYM, LEP, and DIP) in Pukou District’s rural areas, identifying a “three-tiered gradient pattern” and synergistic effects at natural–artificial interfaces. The findings demonstrate that landscape patterns profoundly influence habitat suitability, with high-suitability villages thriving due to complex landscape patterns, while low-suitability villages experience habitat homogenization from intensive agriculture. These findings offer a scientific foundation for developing targeted conservation strategies, including habitat preservation in high-suitability villages, restoration in moderate-suitability villages, and extensive habitat restoration in low-suitability villages. The findings theoretically validated the applicability of the optimized Maxent model for small-scale habitat prediction, methodologically integrated entropy-based methods and landscape pattern analysis to provide a versatile framework for multi-scale ecological assessments, and practically informed ecological conservation planning in Pukou District and biodiversity management in rapidly urbanizing regions.
However, the limited DIP sample size and the restricted study area scope may constrain the generalizability of the findings. Future research should integrate recent remote sensing data to monitor dynamic habitat changes, validate model predictions with small-scale field surveys, and investigate the integration of Maxent with other ecological models. Furthermore, examining microhabitat characteristics within patches will enhance understanding of pollinator ecological adaptations. This study offers methodological frameworks for rural ecological conservation, applicable to other rapidly urbanizing regions to support global biodiversity conservation goals.
Data availability statement
The raw data supporting the conclusions of this article will be made available by the authors, without undue reservation.
Author contributions
YY: Conceptualization, Data curation, Formal Analysis, Investigation, Methodology, Software, Writing – original draft. JQ: Conceptualization, Methodology, Writing – review and editing. XX: Data curation, Writing – review and editing.
Funding
The author(s) declare that no financial support was received for the research and/or publication of this article.
Conflict of interest
The authors declare that the research was conducted in the absence of any commercial or financial relationships that could be construed as a potential conflict of interest.
Generative AI statement
The author(s) declare that no Generative AI was used in the creation of this manuscript.
Any alternative text (alt text) provided alongside figures in this article has been generated by Frontiers with the support of artificial intelligence and reasonable efforts have been made to ensure accuracy, including review by the authors wherever possible. If you identify any issues, please contact us.
Publisher’s note
All claims expressed in this article are solely those of the authors and do not necessarily represent those of their affiliated organizations, or those of the publisher, the editors and the reviewers. Any product that may be evaluated in this article, or claim that may be made by its manufacturer, is not guaranteed or endorsed by the publisher.
References
Ayers, A. C., and Rehan, S. M. (2025). Determining bee community response to urbanization through multi-year monitoring. Urban Ecosyst. 28, 177. doi:10.1007/s11252-025-01797-1
Bahn, V., and McGill, B. J. (2013). Testing the predictive performance of distribution models. Oikos 122, 321–331. doi:10.1111/j.1600-0706.2012.00299.x
Barahona-Segovia, R. M., Gatica-Barrios, P., Durán-Sanzana, V., and Smith-Ramírez, C. (2023). No wild bees? don’t worry! non-bee flower visitors are still hard at work: the edge effect, landscape, and local characteristics determine taxonomic and functional diversity in apple orchards. Agric. Ecosyst. and Environ. 354, 108554. doi:10.1016/j.agee.2023.108554
Bartholomée, O., and Lavorel, S. (2019). Disentangling the diversity of definitions for the pollination ecosystem service and associated estimation methods. Ecol. Indic. 107, 105576. doi:10.1016/j.ecolind.2019.105576
Begosh, A., Smith, L. M., and McMurry, S. T. (2022). Major land use and vegetation influences on potential pollinator communities in the high plains of Texas. J. Insect Conservation 26, 231–241. doi:10.1007/s10841-022-00380-9
Bergholz, K., Sittel, L.-P., Ristow, M., Jeltsch, F., and Weiss, L. (2022). Pollinator guilds respond contrastingly at different scales to landscape parameters of land-use intensity. Ecol. Evol. 12, e8708. doi:10.1002/ece3.8708
Birkenbach, M., Straub, F., Kiesel, A., Ayasse, M., Wilfert, L., and Kuppler, J. (2024). Land-use affects pollinator-specific resource availability and pollinator foraging behaviour. Ecol. Evol. 14, e11061. doi:10.1002/ece3.11061
Brown, K. S., and Freitas, A. V. L. (2000). Atlantic forest butterflies: indicators for landscape conservation 1. Biotropica 32, 934–956. doi:10.1111/j.1744-7429.2000.tb00631.x
Buchori, D., Rizali, A., Larasati, A., Hidayat, P., Ngo, H., and Gemmil-Herren, B. (2019). Natural habitat fragments obscured the distance effect on maintaining the diversity of insect pollinators and crop productivity in tropical agricultural landscapes. Heliyon 5, e01425. doi:10.1016/j.heliyon.2019.e01425
Caitano, B., Chaves, T. P., Dodonov, P., and Delabie, J. H. C. (2020). Edge effects on insects depend on life history traits: a global meta-analysis. J. Insect Conservation 24, 233–240. doi:10.1007/s10841-020-00227-1
Cavigliasso, P., Phifer, C. C., Knowlton, J. L., Licata, J. A., Flaspohler, D. J., Webster, C. R., et al. (2022). Influence of landscape composition on wild bee communities: effects of functional landscape heterogeneity. Agric. Ecosyst. and Environ. 340, 108150. doi:10.1016/j.agee.2022.108150
Elith, J., Phillips, S. J., Hastie, T., Dudík, M., Chee, Y. E., and Yates, C. J. (2011). A statistical explanation of maxent for ecologists. Divers. distributions 17, 43–57. doi:10.1111/j.1472-4642.2010.00725.x
Geppert, C., Hass, A., Földesi, R., Donkó, B., Akter, A., Tscharntke, T., et al. (2020). Agri-environment schemes enhance pollinator richness and abundance but bumblebee reproduction depends on field size. J. Appl. Ecol. 57, 1818–1828. doi:10.1111/1365-2664.13682
Gillespie, M. A., Baude, M., Biesmeijer, J., Boatman, N., Budge, G. E., Crowe, A., et al. (2024). Flowering plant communities mediate the effects of habitat composition and configuration on wild pollinator communities. Funct. Ecol. 38, 2576–2594. doi:10.1111/1365-2435.14666
Gomez, J. M., Munoz-Pajares, A. J., Abdelaziz, M., Lorite, J., and Perfectti, F. (2014). Evolution of pollination niches and floral divergence in the generalist plant erysimum mediohispanicum. Ann. Bot. 113, 237–249. doi:10.1093/aob/mct186
Goodwin, E. K., Rader, R., Encinas-Viso, F., and Saunders, M. E. (2021). Weather conditions affect the visitation frequency, richness and detectability of insect flower visitors in the australian alpine zone. Environ. Entomol. 50, 348–358. doi:10.1093/ee/nvaa180
Haris, A., Józan, Z., Roller, L., Šima, P., and Tóth, S. (2024). Changes in population densities and species richness of pollinators in the carpathian basin during the last 50 years (hymenoptera, diptera, lepidoptera). Diversity 16, 328. doi:10.3390/d16060328
Huang ChunWei, H. C., McDonald, R., and Seto, K. (2018). The importance of land governance for biodiversity conservation in an era of global urban expansion. Landsc. Urban Plan. 173, 44–50. doi:10.1016/j.landurbplan.2018.01.011
Khalaf, S. M., Alqahtani, M. S., Ali, M. R., Abdelalim, I. T., and Hodhod, M. S. (2024). Using maxent modeling to analyze climate change impacts on pseudomonas syringae van hall, 1904 distribution on the global scale. Heliyon 10, e41017. doi:10.1016/j.heliyon.2024.e41017
Kovács-Hostyánszki, A., Földesi, R., Báldi, A., Endrédi, A., and Jordán, F. (2019). The vulnerability of plant-pollinator communities to honeybee decline: a comparative network analysis in different habitat types. Ecol. Indic. 97, 35–50. doi:10.1016/j.ecolind.2018.09.047
Kremen, C., Williams, N. M., Aizen, M. A., Gemmill-Herren, B., LeBuhn, G., Minckley, R., et al. (2007). Pollination and other ecosystem services produced by mobile organisms: a conceptual framework for the effects of land-use change. Ecol. Lett. 10, 299–314. doi:10.1111/j.1461-0248.2007.01018.x
Lajos, K., Samu, F., Bihaly, Á. D., Fülöp, D., and Sárospataki, M. (2021). Landscape structure affects the sunflower visiting frequency of insect pollinators. Sci. Rep. 11, 8147. doi:10.1038/s41598-021-87650-9
Larsson, M. (2005). Higher pollinator effectiveness by specialist than generalist flower-visitors of unspecialized knautia arvensis (dipsacaceae). Oecologia 146, 394–403. doi:10.1007/s00442-005-0217-y
Levé, M., Baudry, E., and Bessa-Gomes, C. (2019). Domestic gardens as favorable pollinator habitats in impervious landscapes. Sci. Total Environ. 647, 420–430. doi:10.1016/j.scitotenv.2018.07.310
Lichtenberg, E. M., Heiser, J., Baum, K. A., Neff, J. L., and Jha, S. (2024). Pollinators differentially respond to local and landscape grassland features. Insect Conservation Divers. 18, 417–428. doi:10.1111/icad.12816
Liu, M., Wang, X., and Yang, C. (2025). Exploring the potential distribution areas of changnienia amoena and its pollinators in China based on maxent and gtwr models. J. Nat. Conservation 86, 126946. doi:10.1016/j.jnc.2025.126946
Louis-Lucas, T., Clavel, J., Bortolamiol, S., Blanc, N., Grésillon, E., and Clauzel, C. (2025). Exploring the relationships between landscape connectivity and urban biodiversity: insights from citizen science on pollinators and birds in paris, France. Biol. Conserv. 309 (1), 111271. doi:10.1016/j.biocon.2025.111271
Marini, L., Öckinger, E., Bergman, K.-O., Jauker, B., Krauss, J., Kuussaari, M., et al. (2014). Contrasting effects of habitat area and connectivity on evenness of pollinator communities. Ecography 37, 544–551. doi:10.1111/j.1600-0587.2013.00369.x
Marshall, E. J., and Moonen, A. C. (2002). Field margins in northern europe: their functions and interactions with agriculture. Agric. Ecosyst. and Environ. 89, 5–21. doi:10.1016/s0167-8809(01)00315-2
Maskell, L. C., Crowe, A., Dunbar, M. J., Emmett, B., Henrys, P., Keith, A. M., et al. (2013). Exploring the ecological constraints to multiple ecosystem service delivery and biodiversity. J. Appl. Ecol. 50, 561–571. doi:10.1111/1365-2664.12085
Mateos-Fierro, Z., Garratt, M. P., Fountain, M. T., Ashbrook, K., and Westbury, D. B. (2023). The potential of wildflower strips to enhance pollination services in sweet cherry orchards grown under polytunnels. J. Appl. Ecol. 60, 1044–1055. doi:10.1111/1365-2664.14394
Merow, C., Smith, M. J., and Silander Jr, J. A. (2013). A practical guide to maxent for modeling species’ distributions: what it does, and why inputs and settings matter. Ecography 36, 1058–1069. doi:10.1111/j.1600-0587.2013.07872.x
Murakoshi, N., Itagaki, T., Oguro, M., and Sakai, S. (2024). Effects of floral display size, local open raceme density, patch size, and distance between patches on pollinator behaviour in salvia nipponica. Sci. Rep. 14, 967. doi:10.1038/s41598-024-51327-w
Natuhara, Y., Imai, C., and Takahashi, M. (1998). Evaluation of community indices in seasonal assemblages of butterflies (lepidoptera) at different frequency of transect count. Biodivers. and Conservation 7, 631–639. doi:10.1023/a:1008804418188
Parmentier, L., Van Kerckvoorde, A., Couckuyt, J., van Calster, H., Smagghe, G., and Haesaert, G. (2025). Sinus management: meandering mowing as a novel method to improve pollinator biodiversity and habitat heterogeneity in mesic grasslands. Agric. Ecosyst. and Environ. 382, 109478. doi:10.1016/j.agee.2025.109478
Phillips, S. J., and Dudík, M. (2008). Modeling of species distributions with maxent: new extensions and a comprehensive evaluation. Ecography 31, 161–175. doi:10.1111/j.0906-7590.2008.5203.x
Phillips, S. J., Anderson, R. P., and Schapire, R. E. (2006). Maximum entropy modeling of species geographic distributions. Ecol. Model. 190, 231–259. doi:10.1016/j.ecolmodel.2005.03.026
Pramanik, M., Diwakar, A. K., Dash, P., Szabo, S., and Pal, I. (2021). Conservation planning of cash crops species (garcinia gummi-gutta) under current and future climate in the western ghats, India. Environ. Dev. Sustain. 23, 5345–5370. doi:10.1007/s10668-020-00819-6
Raderschall, C. A., Lundin, O., Lindström, S. A., and Bommarco, R. (2022). Annual flower strips and honeybee hive supplementation differently affect arthropod guilds and ecosystem services in a mass-flowering crop. Agric. Ecosyst. and Environ. 326, 107754. doi:10.1016/j.agee.2021.107754
Ranalli, R., Galimberti, A., Labra, M., and Biella, P. (2025). Forest spatial configuration and local management influence bee pollinator biodiversity in urban and rural landscapes. J. Environ. Manag. 377, 124672. doi:10.1016/j.jenvman.2025.124672
Ren, P., Didham, R. K., Murphy, M. V., Zeng, D., Si, X., and Ding, P. (2023). Forest edges increase pollinator network robustness to extinction with declining area. Nat. Ecol. and Evol. 7, 393–404. doi:10.1038/s41559-022-01973-y
Schoch, K., Tschumi, M., Lutter, S., Ramseier, H., and Zingg, S. (2022). Competition and facilitation effects of semi-natural habitats drive total insect and pollinator abundance in flower strips. Front. Ecol. Evol. 10, 854058. doi:10.3389/fevo.2022.854058
Shi, X., Ma, C., de Kraker, J., Gong, S., Hodgson, J. A., Luo, S., et al. (2024). Influence of agricultural intensification on pollinator pesticide exposure, food acquisition and diversity. J. Appl. Ecol. 61, 1905–1917. doi:10.1111/1365-2664.14701
Shwartz, A., Muratet, A., Simon, L., and Julliard, R. (2013). Local and management variables outweigh landscape effects in enhancing the diversity of different taxa in a big metropolis. Biol. Conserv. 157, 285–292. doi:10.1016/j.biocon.2012.09.009
Simkin, R. D., Seto, K. C., McDonald, R. I., and Jetz, W. (2022). Biodiversity impacts and conservation implications of urban land expansion projected to 2050, Proc. Natl. Acad. Sci. U. S. A. 119, e2117297119, doi:10.1073/pnas.2117297119
Tommasi, N., Biella, P., Maggioni, D., Fallati, L., Agostinetto, G., Labra, M., et al. (2023). Dna metabarcoding unveils the effects of habitat fragmentation on pollinator diversity, plant-pollinator interactions, and pollination efficiency in maldive islands. Mol. Ecol. 32, 6394–6404. doi:10.1111/mec.16537
Appendix A
Appendix A is a supplemental explanation of Figure 11, as adding the names of all the villages in Figure 11 would have made the picture difficult to see, the choice was made to assign a number to each village.the information relating to the villages to which each number corresponds can be viewed in Table A1.
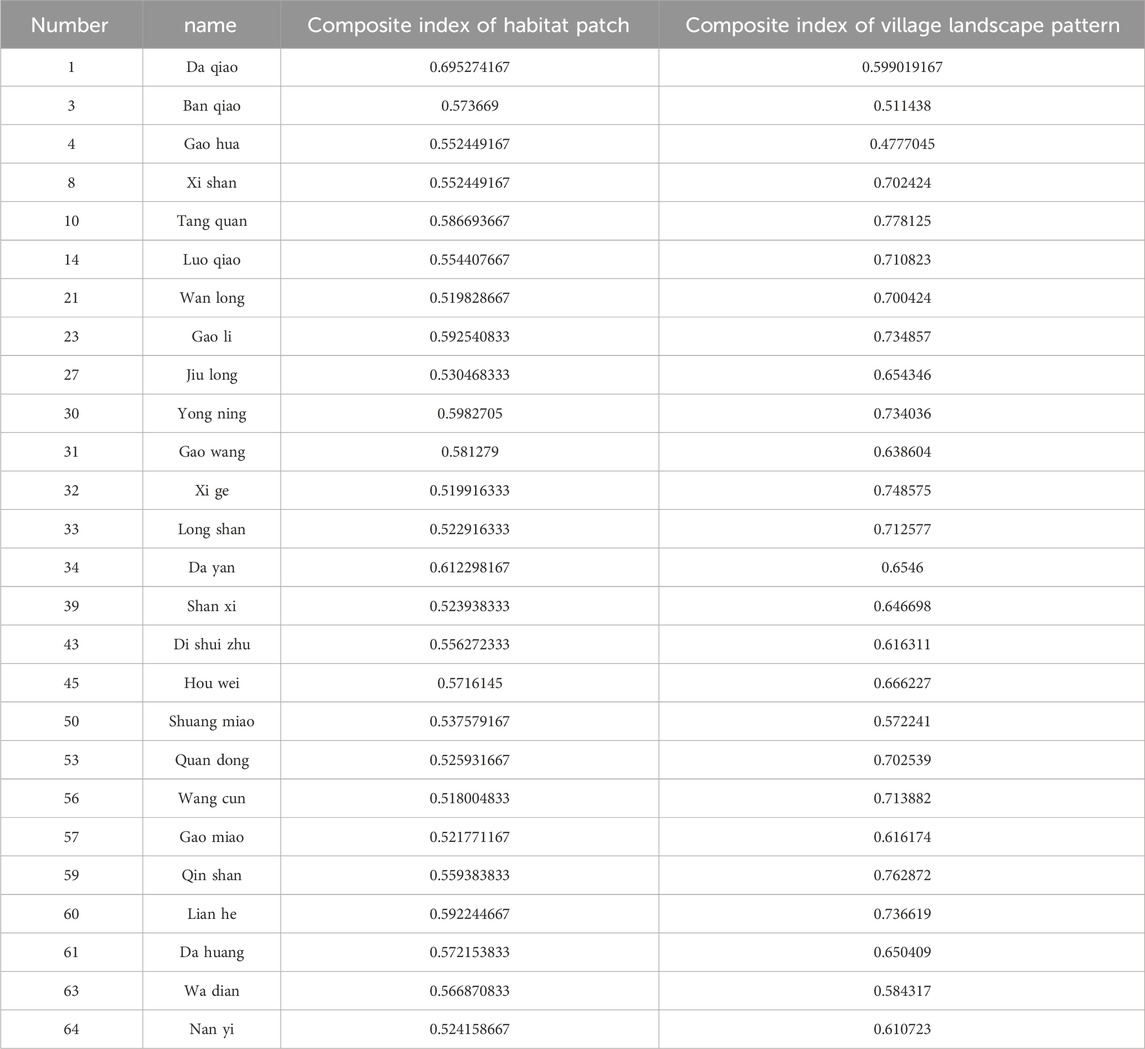
TABLE A1. Information of villages with moderate suitability.
Keywords: pollinators, Maxent model, landscape pattern, rural habitat, biodiversity
Citation: Yin Y, Qian J and Xu X (2025) Study on mapping and assessment of pollinator habitats in rural areas, using an optimized Maxent model. Front. Environ. Sci. 13:1668003. doi: 10.3389/fenvs.2025.1668003
Received: 17 July 2025; Accepted: 02 September 2025;
Published: 11 September 2025.
Edited by:
Juergen Pilz, University of Klagenfurt, AustriaReviewed by:
Claudia Bita-Nicolae, Institute of Biology Bucharest of the Romanian Academy, RomaniaThomas Tscheulin, University of the Aegean, Greece
Copyright © 2025 Yin, Qian and Xu. This is an open-access article distributed under the terms of the Creative Commons Attribution License (CC BY). The use, distribution or reproduction in other forums is permitted, provided the original author(s) and the copyright owner(s) are credited and that the original publication in this journal is cited, in accordance with accepted academic practice. No use, distribution or reproduction is permitted which does not comply with these terms.
*Correspondence: Jing Qian, SmlubjAyMjBAbmp0ZWNoLmVkdS5jbg==