 Zhijia Gu
 Sennan Zhai1
- 1School of Geographical Sciences, Xinyang Normal University, Xinyang, China
- 2Yunnan Key Laboratory of Soil Erosion Prevention and Green Development, Yunnan University, Kunming, China
- 3Yuanjiang Dry–Hot Valley Water and Soil Conservation Observation and Research Station of Yunnan Province, Yunnan University, Kunming, China
- 4School of Geographical Sciences, Henan University, Kaifeng, China
- 5Faculty of Geographical Science, Beijing Normal University, Beijing, China
Introduction: The Yuanjiang dry–hot valley area of China serves as a vital ecological functional zone and a typical ecologically fragile area, where drought constitutes a significant factor affecting both the ecological environment and agricultural production. Conducting an in–depth analysis of drought variation trends across spatiotemporal scales and exploring its primary driving factors in this region will provide a scientific reference for regional drought monitoring and warning, drought prevention and disaster reduction efforts.
Methods: By analyzing the Temperature Vegetation Dryness Index (TVDI) constructed from the Land Surface Temperature (LST) and Normalized Difference Vegetation Index (NDVI) from 2000 to 2020, combined with Theil–Sen trend analysis method, M–K trend test, stability analysis, Hurst index, and geographic detector, the characteristics, future evolution trends, and influencing factors of drought spatiotemporal changes in the Yuanjiang dry–hot valley area were analyzed from a spatiotemporal perspective.
Results: The results indicated that (1) the average TVDI in the Yuanjiang dry–hot valley area from 2000 to 2020 was 0.67, showing a moderately dry state as a whole, and it was slowly decreasing at a rate of 0.0011 per year, indicating that the drought situation has eased. (2) The TVDI showed a trend of a slow increase in the northwest and a slow decrease in the southeast area, with a relatively high stability. In the future, the TVDI in the northwest of the study area will weakly and continuously increase, while the TVDI in the southeast will weakly and continuously decrease. The future changes are also relatively stable. (3) In the Yuanjiang dry–hot valley area, potential evapotranspiration, precipitation, and temperature are key factors influencing TVDI. Among these, potential evapotranspiration is the most significant factor, with a q value of 0.3768. The interaction effects between factors exceed the influence of any single factor, particularly the interaction between potential evapotranspiration and GDP, which shows the strongest effect (q value is 0.490).
Discussion: The results in the study indicated that the future trend of drought changes was highly uncertain. The future changes in drought conditions still require continuous attention. Cultivated land and woodland exhibited the highest contribution rate to TVDI. Natural factors exert a strong influence on drought conditions, while the impact of human factors remains less pronounced.
1 Introduction
Drought is a meteorological disaster caused by the lack of continuous precipitation, which can lead to soil degradation, desertification, water shortage, vegetation mortality, sandstorms, wildfires and other disaster phenomena (Guo et al., 2017), and has attracted the attention of many scholars in the world. Compared with extreme meteorological disasters such as floods and hurricanes, droughts are characterized by long duration, wide affected area and diverse forms of harm. They pose a relatively serious threat to agricultural development, ecological environment protection and human living environment, especially in arid and semi–arid area with single ecological structure and weak restoration capacity. The Intergovernmental Panel on Climate Change (IPCC) states in its Sixth Assessment Report (AR6) that the global temperature rise will reach at least 1.5 C by mid–century (IPCC, 2021). Under the background of global warming, the possibility, severity and frequency of drought disasters will increase significantly. According to statistics, drought disasters account for more than 40% of natural disasters in China (Wang, 2007), and it is one of the most significant natural disasters in our country. The dry–hot valleys in southwest China are important ecological function area and typical ecologically fragile area in China. Due to the combined influence of special climate and complex geographical environment, soil erosion and ecosystem degradation in the dry–hot valleys are severe. It is a typical ecologically fragile area in China and has long restricted the sustainable development of the region. In recent years, the increased frequency and intensity of droughts in dry–hot valley area have led to issues such as water resource shortages, vegetation degradation, and a decline in biodiversity, threatening local agriculture, ecological environments, and the economy. Therefore, monitoring drought conditions and studying their spatial distribution patterns are of significant importance for understanding drought trend variations, rationally allocating water resources, restoring ecological environments, providing early warnings for disasters, and promoting sustainable regional development to drive effective economic growth.
Currently, drought monitoring is primarily divided into two categories: ground station–based monitoring and remote sensing monitoring. Ground station monitoring relies on key meteorological elements such as precipitation, evaporation, temperature, and humidity provided by weather stations to construct indices like the Standardized Precipitation Evapotranspiration Index (SPEI), Standardized Precipitation Index (SPI), and Palmer Drought Severity Index (PDSI). These indices, through standardized processing of long–term meteorological data, can reflect the occurrence, development, and intensity of regional droughts. However, conventional ground station–based monitoring data also face unavoidable challenges, such as uneven distribution of monitoring stations and the inability of single–point data to accurately represent conditions across large surrounding area (Li and Li, 2017). In recent years, with the rapid development of remote sensing technology, drought indices based on multi–source remote sensing imagery have been applied to studies on soil moisture conditions and drought characteristics. These methods effectively address the limitations of insufficient station coverage and have become a vital tool for large and medium scale, multi–temporal dynamic drought monitoring. Remote sensing data overcome the constraints of using single–method approaches for soil moisture monitoring and the spatial coverage and timeliness limitations of ground station data. The TVDI, constructed using the feature space of LST and the NDVI, can better reflect surface soil moisture conditions. It has been proven to be a highly effective drought monitoring method and is widely applied across different climate zones and ecosystems (Du et al., 2017; Chen A et al., 2023; Ding et al., 2024).
TVDI has high accuracy and is easy to implement, so it has been widely applied and verified in drought monitoring studies (Nugraha et al., 2023). TVDI has demonstrated remarkable effectiveness in drought monitoring applications both domestically and internationally, serving as an indispensable tool for global drought prevention and disaster mitigation efforts. It has been widely used for drought monitoring worldwide (Wang and Yu, 2021; Zhang et al., 2017; Lawal et al., 2021; Sharma et al., 2022; Tao et al., 2021; Rahimzadeh–Bajgiran et al., 2012). Research on drought in dry–hot valley area in China has been preliminarily carried out (Deng et al., 2024; Huo et al., 2025). Previous research investigated the spatiotemporal variations of drought in the dry–hot valley area of the lower Jinsha River using the TVDI, demonstrating its capability to accurately characterize drought conditions in this area (Chen et al., 2024). In addition, some scholars (Du et al., 2024) have made certain progress in assessing drought conditions in dry–hot valley area by inverting soil moisture using improved neural network models. Nevertheless, current research on drought variations and their causes in the unique dry–hot valley area remains relatively limited. This study takes the Yuanjiang dry–hot valley area in China as a case study. Utilizing multi–source data including remote sensing data, meteorological data, topographic data, vegetation coverage and evapotranspiration data, as well as population density and nighttime light data, we conducted an in–depth analysis of spatiotemporal drought variations from 2000 to 2020 using methodologies such as Theil–Sen trend analysis, Mann–Kendall trend test, stability analysis, and geographical detector. Furthermore, the research systematically explored potential drought–inducing factors. In this study, we pursued the following objectives: (1) to detect the temporal and spatial dynamic trends of drought in Yuanjiang dry–hot valley area of China from 2000 to 2020; (2) to determine the dominant factors affecting drought variation in in Yuanjiang dry–hot valley area of China. This study aims to provide a scientific basis for drought disaster prevention and risk control in typical dry–hot valley area under the context of global climate change.
2 Materials and methods
2.1 Study area
The Yuanjiang dry–hot valley area is located in south–central Yunnan Province, China, within the middle–upper reaches of the Red River. Characterized by a subtropical low–latitude plateau monsoon climate, this area predominantly features deeply incised valleys with steep terrain and significant elevation variations ranging from 174 to 2,735 m (Figure 1). It is the most concentrated and continuous typical dry–hot river valley area in China. The region exhibits an annual average temperature of 20 °C–24 °C, with precipitation ranging from 500 to 800 mm and evaporation reaching 2,892 mm. Over 80% of precipitation is concentrated between May and October, while the dry season (November to April) experiences pronounced drought conditions. Crucially, evaporation significantly exceeds precipitation (aridity index >3.0), characterizing the hyper–arid nature of this environment. The soil distribution exhibits characteristics of vertical zonation. Along the mountain slopes from lower to upper elevations, the soil types are sequentially distributed as follows: dry red soil, lateritic red soil, red soil, and yellow–brown soil (Jin and Ou, 2000). The distribution area also follows a vertical pattern. The most extensive soil type is dry red soil, predominantly located on erosion-susceptible valley slopes. This is followed by lateritic red soil, which is found within the valley, whilst red soil and other types are relatively scarce. The Yuanjiang dry–hot valley area, owing to its unique geographical location and climatic conditions, is recognized as a typical ecologically fragile zone in southwest China. The natural vegetation is primarily characterized by savanna shrub–grassland and succulent thorny shrub–grassland. The community is dominated by drought–tolerant herbs, interspersed with shrubs and scattered small trees, with dominant species including Phyllanthus emblica, Pistacia weinmannifolia, Woodfordia fruticosa, Lannea coromandelica, Euphorbia royleana, and Heteropogon contortus (Zhang, 1992; Jin and Ou, 2000).
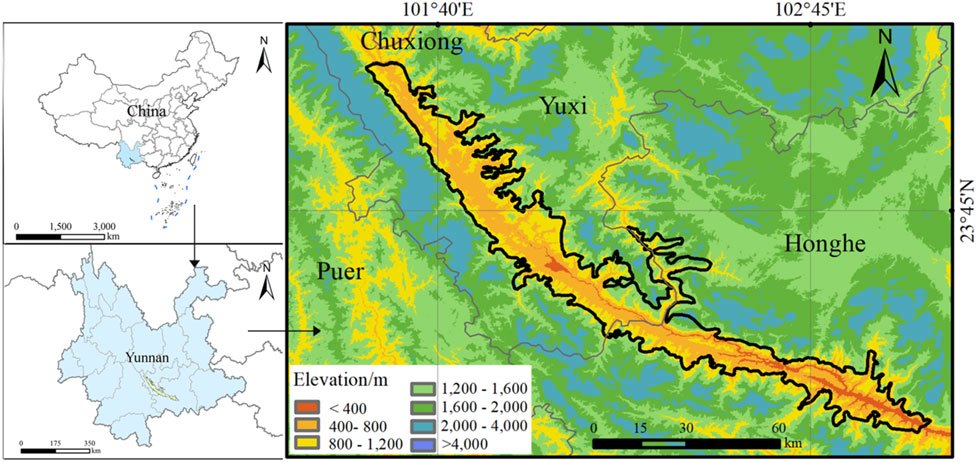
Figure 1. Location of the study area.
2.2 Data sources and preprocessing
The MOD11A2 and MOD13Q1 data used in this study were obtained from the LAADS DAAC (Level–1 and Atmosphere Archive and Distribution System Distributed Active Archive Center) via the NASA Earthdata Search portal (https://search.earthdata.nasa.gov/), covering the period from 2000 to 2020. The LST MOD11A2 data is 8–days composite product with a spatial resolution of 1 km. The MOD13Q1 NDVI data is 16–days composite products with a spatial resolution of 250 m. Images were decoded, reprojected and reformatted using the Modis Reprojection Tool (MRT). The projection was transformed from Sinusoidal projection to WGS84/Albers Equal Area Conic projection, and the original HDF reformatted as a GeoTIFF. The MOD13Q1 data (250 m) was resampled to 1 km to match LST MOD11A2 data through nearest neighbor assignment method. Through reprojection, resampling, and maximum value compositing (MVC) techniques, both NDVI and LST datasets were processed to achieve a unified temporal resolution of 16–days and a spatial resolution of 1 km.
The Digital Elevation Model (DEM) data for the study area was obtained from the Geospatial Data Cloud (https://www.gscloud.cn). The 1 km resolution annual mean temperature dataset, 1 km resolution annual precipitation dataset, 250 m resolution annual vegetation coverage dataset, and potential evapotranspiration data were sourced from the National Tibetan Plateau Data Center (https://data.tpdc.ac.cn/product). The 1 km resolution population spatial distribution data was derived from the LandScan dataset (https://landscan.ornl.gov). Nighttime light data and land LULC (Land Use and Land Cover) were acquired from the Data Center for Resources and Environmental Sciences, Chinese Academy of Sciences (https://www.resdc.cn).
2.3 Methods
2.3.1 TVDI model
This study applied the TVDI model to inversion processing of remote sensing data. Based on the triangular distribution pattern observed in the NDVI–LST scatter plot, Sandholt et al. (2002) revealed a significant negative correlation between LST and NDVI. As vegetation coverage increases, transpiration effects reduce surface temperatures, which led to the proposal of the TVDI. TVDI is calculated from vegetation indices and land surface temperature using the formula as follows:
where ts is surface temperature value (°C). tsminis the minimum surface temperature value of all grid values under the same vegetation cover condition. tsmax is the maximum surface temperature value of all grid values under the same vegetation cover condition. The vegetation indices are linearly fitted to obtain the dry edge (Eq. 2) and wet edge (Eq. 3) equations in the feature space:
where, a1 and b1 are the coefficients of the wet edge equation, while a2 and b2 are the coefficients of the dry edge equation. The TVDI has a value range of (−1, 1) and reflects the moisture status of surface soil. An increase in TVDI indicates reduced soil moisture and heightened drought conditions in the area, while a decrease signifies higher soil moisture and wetter conditions. Values closer to 1 denote more severe soil drought, whereas values approaching 0 indicate higher soil moisture levels. Based on previous studies and the current conditions of the study area (Huo et al., 2025; Li et al., 2025), the TVDI was classified into five grades, as shown in Table 1.
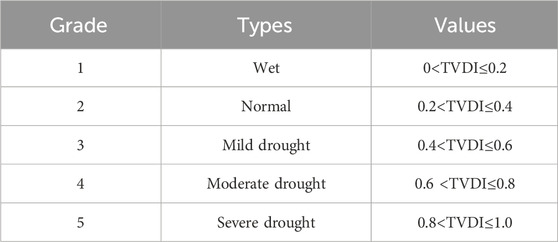
Table 1. TVDI drought grade division.
2.3.2 Trends analysis
In this study, the Theil–Sen trend analysis method was employed to analyze the TVDI change trend in the Yuanjiang dry–hot valley area from 2000 to 2020. The significance of the TVDI change trend was assessed using the Mann–Kendall (M–K) test. The application of these two methods can effectively reduce the impact of outliers on the TVDI trend analysis. Specific methodologies are as shown in the following equations.
where xi and xj are the values of NDVI at time i and j. The median is the median function. The negative values of slope indicate a negative trend of NDVI and a positive value indicates a positive trend of NDVI in the study period.
Mann–Kendall test was used to test the significance of the change trend (Mann, 1945; Kendall, 1975). The slope and M–K test results are combined for comprehensive analysis. To further analyze the trend of TVDI changes, the Mann–Kendall significance test was employed, utilizing the following equations to determine whether the temporal trend in the time series is statistically significant.
In the formula, n represents the length of the data, and TVDIi and TVDIj are the TVDI values in the TVDI time series corresponding to years i and j, respectively. In this study, a Z–value greater than 2.58 indicates a highly significant change trend, a Z–value between 1.96 and 2.58 is considered significant, a Z–value between 1.645 and 1.96 is classified as marginally significant, and a Z–value less than 1.645 suggests no statistically significant trend.
In this study, the TVDI changes in the Yuanjiang dry–hot valley area from 2000 to 2020 were classified into nine categories through the combined application of Theil–Sen trend analysis and the Mann–Kendall trend test: extremely significant increase (Slope>0, Z > 2.58, p < 0.01), significant increase (Slope>0, 1.96 < Z ≤ 2.58, 0.01 < p < 0.05), slightly significant increase (Slope>0, 1.645 < Z ≤ 1.96, 0.05 < p < 0.1), insignificant increase (Slope>0, Z ≤ 1.645, p > 0.1) no change (Slope = 0), insignificant decrease (Slope<0, Z ≤ 1.645, p > 0.1), slightly significant decrease (Slope<0, 1.645 < Z ≤ 1.96, 0.05 < p < 0.1), significant decrease (Slope<0, 1.96 < Z ≤ 2.58, 0.01 < p < 0.05), and extremely significant decrease (Slope>0, Z > 2.58, p < 0.01).
2.3.3 Stability analysis
The Coefficient of Variation (CV), defined as the ratio of the standard deviation to the mean of a dataset, was employed to assess the stability and volatility of time series data. In this study, we calculated the CV for the Yuanjiang dry–hot valley area from 2000 to 2020 using the following formula to evaluate its temporal stability:
where σ represents the standard deviation of TVDI, reflecting the dispersion degree of the data, while
Based on the Natural Breaks Classification method (Chen et al., 2013), TVDI variability is classified into six categories: extremely high stability when CV < 0.038, high stability for 0.038–0.064, relatively high stability for 0.064–0.114, medium stability for 0.114–0.193, and relatively low stability for 0.193–0.749. Values exceeding 0.749 are categorized as low stability.
2.3.4 Hurst exponent
The Hurst exponent method, proposed by British hydrologist Hurst (1951) (Hurst, 1951) and improved by Mandelbrot and Wallis (1969), is a method for detecting the sustainability of time series data. The Hurst exponent, a critical metric based on the Rescaled Range (R/S) analysis method, quantifies the long–term memory and persistence of time series data, enabling the prediction of future trends using long–term historical records. The basic principle is as follows.
Establish a time series of TVDI TVDI(τ), τ = 1, 2, … , n. Define the mean sequence of the time series:
Calculate the accumulated deviation:
Establish a range sequence:
Establish a standard deviation sequence:
If present R/S ∝ τH, this indicates the existence of the Hurst phenomenon in the TVDI time series. The Hurst exponent (denoted as H) is quantitatively determined through least squares fitting.
The Hurst exponent (H) ranges from 0 to 1, with three distinct scenarios. H > 0.5 indicates persistent behavior in the time series. The closer H is to 1, the stronger the persistence. H = 0.5 indicates a random (uncorrelated) time series. H < 0.5 demonstrates anti–persistent behavior. The closer H is to 0, the stronger the anti–persistence.
2.3.5 Geographic detector
The geographic detection can analyze the influence of different independent variables on the spatial distribution pattern of specific dependent variables. It contains the following four detectors: factor detection, interaction detection, risk detection, and ecological detection.
1. Factor detector
A factor detector could determine the effect of detecting the spatial heterogeneity of vegetation change. The spatial heterogeneity of X to Y could be expressed as q × 100%, and the greater the number, the greater the influence of the detection factors on vegetation change (Wang et al., 2016), which is as follows:
where h is the vegetation change or detection factor hierarchy; N is the number of class h or total region units; and Y is the change in class h or total region Y value. σ2h and σ2are the variances of NDVI in h and entire area, respectively. A large q indicates a better explanation of the spatial heterogeneity of X about NDVI and vice versa (Chen et al., 2020).
2. Interaction detector
Interaction detector was used to assess interaction between two factors. The q values of individual factors (q (X1) and q (X2)) were first calculated separately, and the value of two–factor interaction (q (X1 ∩ X2)) was calculated. The results are defined by comparing the q value of individual factor and two–factor interaction as shown in Table 2.
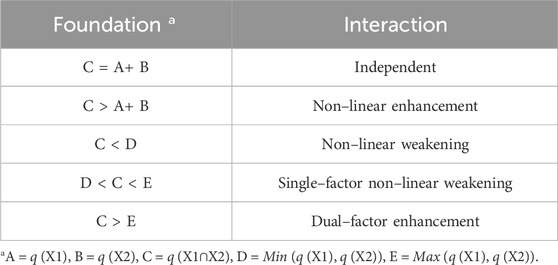
Table 2. Categories of factor interactions.
Vegetation coverage, vegetation evapotranspiration, precipitation, temperature, elevation, slope gradient, population density, and nighttime light were selected to investigate the determinants influencing TVDI variations and their explanatory power in the Yuanjiang dry–hot area.
3 Results
3.1 Spatiotemporal distribution characteristics of drought based on TVDI
3.1.1 Spatial distribution characteristics of drought
The average TVDI value in the Yuanjiang dry–hot valley area over the past 21 years was 0.66, indicating an overall moderate drought status. The spatial distribution of drought is shown in Figure 2, where moderately dry areas occupy the largest proportion at 75.66%, followed by mild drought areas at 21.11%. The central valley area experiences more severe drought conditions, while mild drought zones were predominantly distributed in the peripheral regions of the valley, particularly in the northwestern sector of the study area and along the edge of the valley. Severe drought was predominantly concentrated within the central dry–hot valley area, situated along the administrative boundary between Honghe Prefecture and Yuxi City.
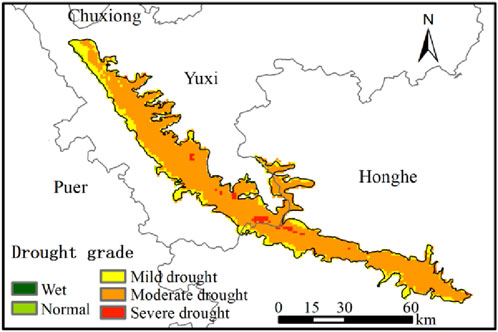
Figure 2. The spatial distribution of drought in the Yuanjiang dry–hot valley area from 2000 to 2020.
3.1.2 Temporal variation trend of drought
The TVDI in the Yuanjiang dry–hot valley area fluctuated between 0.49 and 0.81 from 2000 to 2020, with an average value of 0.67, indicating an overall moderate drought condition. The maximum TVDI of 0.81 occurred in 2004, while the minimum value of 0.49 was in 2011 (Figure 3a). Over the 21–years period, the drought severity in the study area showed a gradual weakening trend, with TVDI decreasing at a rate of 0.0011 per year. However, upward trends were observed during specific intervals: from 2000 to 2004, 2005 to 2010, 2011 to 2014, and 2017 to 2019, suggesting temporary intensification of drought conditions. The variations generally exhibited a cyclical pattern with approximately 5–year intervals.
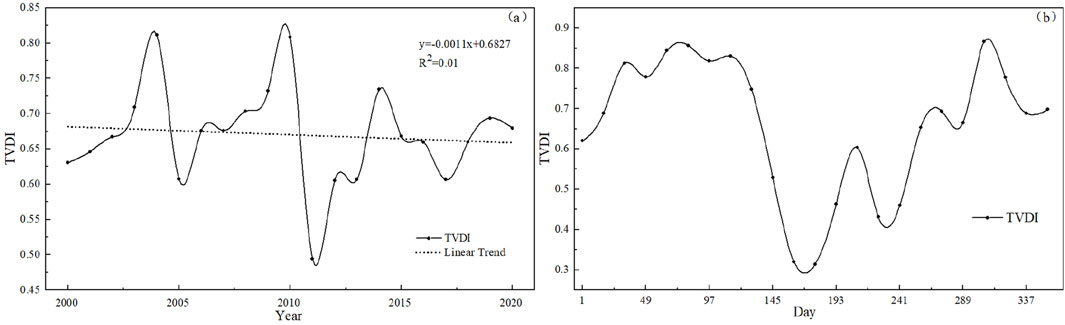
Figure 3. The annual (a) and intra-annual (b) variations of TVDI in the Yuanjiang dry–hot valley area from 2000 to 2020.
To explore the intra–annual variation of drought in the study area, based on remote sensing images, the TVDI within the year was divided into 23 periods with a time unit of 16 days. The average values of the 23 periods of data from 2000 to 2020 were calculated and analyzed respectively. The study area predominantly experienced drought conditions throughout the year, with June being the only month maintaining normal climatic status (Figure 3b). The region experienced persistent drought conditions at moderate and severe drought levels from September to May of the following year, with March to April exhibiting severe drought. Starting from late April, the TVDI decreased rapidly, reaching its lowest value in June, which indicated a relief in drought conditions. Subsequently, the TVDI began to fluctuate and gradually increase, peaking in early November and marking the most severe drought period.
3.1.3 Spatial distribution of drought variation trends from 2000 to 2020
The spatial distribution of TVDI trends from 2000 to 2020 in the Yuanjiang dry–hot valley area was calculated at a pixel scale through the Theil–Sen estimator and Mann–Kendall significance test. During the study period, TVDI values exhibited a slight decreasing trend overall, with an average slope of −0.001. 64.34% of the regions exhibited drought alleviation, while 35.66% showed drought intensification. In terms of spatial distribution, from 2000 to 2020, the northwestern part of the Yuanjiang dry–hot valley area exhibited an upward trend with intensified drought, while the southeastern part showed a downward trend, with drought conditions alleviated (Figure 4a). Although the TVDI in the northwestern region is relatively low, it is showing an upward trend, suggesting that the area has become increasingly arid and will continue to dry out. Based on the significance test, the changes in TVDI exhibit the following spatial patterns: most of the northwestern region showed a not significant increasing trend, with certain areas displaying significant and extremely significant increasing. Conversely, the southeastern part predominantly shows a not significant decreasing trend, while the central area in the southeastern valley exhibited a significant decreasing trend in some areas (Figure 4b). The proportion of “not significant decreasing” was the largest at 43.66%, followed by “not significant increasing” at 26.85%. 8.80% of the region showed a significant decreasing trend in TVDI, while 3.39% showed a significant increasing trend.
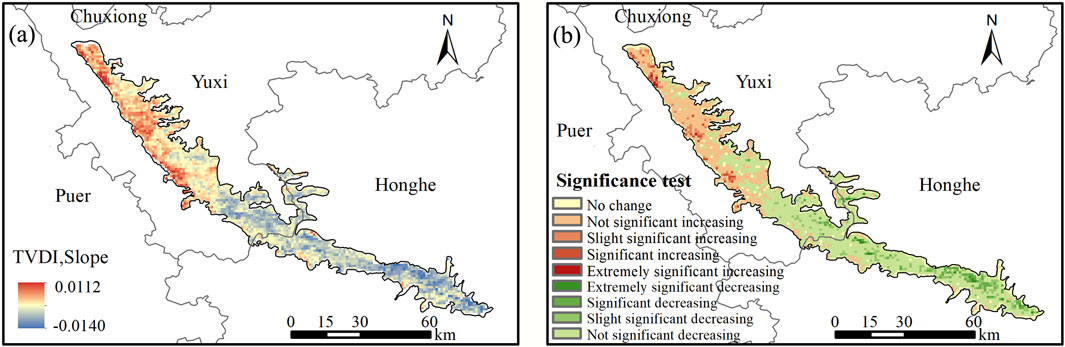
Figure 4. The variation trend (a) and significance test (b) of the TVDI in the Yuanjiang dry–hot valley area from 2000 to 2020.
Based on the Natural Breaks Classification method, TDVI variability in the study area is classified into six categories: extremely high stability, high stability, relatively high stability, medium stability, relatively low stability and low stability. Through the stability analysis (Figure 5), the stability of TVDI trends in the Yuanjiang dry–hot valley area is relatively high overall. The vast majority areas (65.92%) exhibit relatively high stability. Medium stability is observed in some central areas, while very small areas exhibit relatively low stability. High stability and extremely high stability are predominantly distributed in the peripheral areas of the study region. These higher–elevation zones exhibit superior hydrothermal conditions compared to the valley floor, resulting in highly stable TVDI values. Consequently, the drought status in these areas is unlikely to undergo significant changes.
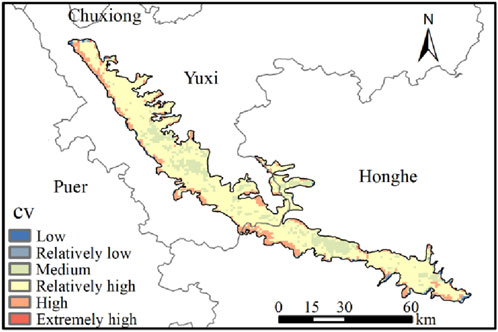
Figure 5. Stability analysis of the TVDI in the Yuanjiang dry–hot valley area from 2000 to 2020.
3.1.4 The future changing trend of drought in the Yuanjiang dry–hot valley area
From 2000 to 2020, the Hurst index in the Yuanjiang dry–hot valley area ranged from 0.22 to 0.73, with a mean of 0.44. The Hurst index results were categorized into four levels: strong anti–persistence (0 < H ≤ 0.25), weak anti–persistence (0.25 < H < 0.5), random (H = 0.5), and weak persistence (0.5 < H ≤ 0.75) (Figure 6a). Weak anti–persistence occupied the largest proportion at 79.16%, followed by weak persistence at 20.63%. The majority of the study exhibited weak anti–persistence behavior, while a small portion showed weak persistence. The extent of anti–persistence exceeds that of persistence, indicating a pronounced reverse trend in TVDI changes across the region. Areas exhibiting weak persistence were primarily distributed in the river valleys–concentrated zones of severe drought. These drought conditions are expected to persist and worsen in the future.
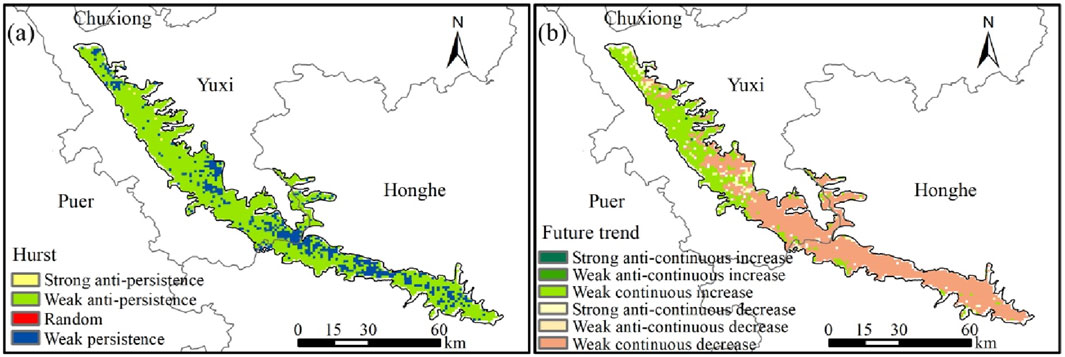
Figure 6. The Hurst index of TVDI (a) and the persistence of the changing trend of TVDI (b) in the Yuanjiang dry–hot valley area.
To investigate the persistence of drought trends in the study area, Theil–Sen trend analysis was integrated with Hurst index classification results, yielding six distinct scenarios (Figure 6b). The findings indicated that TVDI in most areas of the study exhibited weak persistence, with future trends expected to generally follow historical patterns. In the northwestern area, weak persistent increase predominates, indicating future TVDI will increase gradually and persistently, intensifying drought conditions. Conversely, most southeastern areas showed weak persistent decrease, suggesting sustained drought alleviation and gradual ecological improvement in the future.
3.2 Analysis of influencing factors of TVDI changes in the Yuanjiang dry–hot valley area
Based on existing research regarding drought factor selection, this study comprehensively considers meteorological, topographic, and anthropogenic influences on drought dynamics in the study area. For the Yuanjiang dry–hot valley area, we selected vegetation coverage, evapotranspiration, precipitation, temperature, elevation, slope gradient, population density, and nighttime lights as independent variables. This framework enables identification of primary driving forces behind regional drought patterns. Through spatial sampling extraction and geodetector analysis, we quantified the relative influence of each factor on spatiotemporal distribution of drought severity across the study area.
3.2.1 Factor detector
The q–value measures the explanatory power of a given factor on TVDI, ranging between 0 and 1. Higher values indicate stronger explanatory strength regarding TVDI variations, while lower values denote weaker influence. The p–value reflects factor significance, where values below 0.05 indicate statistically significant effects.
The influence hierarchy of selected factors on TVDI is as follows: Potential Evapotranspiration (PET) > Temperature (T) > Precipitation (PRE) > Elevation (DEM) > Fractional Vegetation Cover (FVC) > Nighttime Lights (Light) > Gross Domestic Product (GDP) > Population Density (POP) > Slope Gradient (S) (Table 3). Natural factors demonstrate substantially higher explanatory power over TVDI compared to anthropogenic factors. PET, T, and PRE exhibit q–values of 0.3768, 0.2791, and 0.2330 respectively, constituting the primary drivers of TVDI. DEM and FVC showed relatively lower explanatory power with q–values of 0.0765 and 0.0422. The remaining factors possess marginally explanatory influence (q–values <0.04). Furthermore, S, POP and Light displayed higher p–values, indicating statistically insignificant effects on TVDI in the study area.
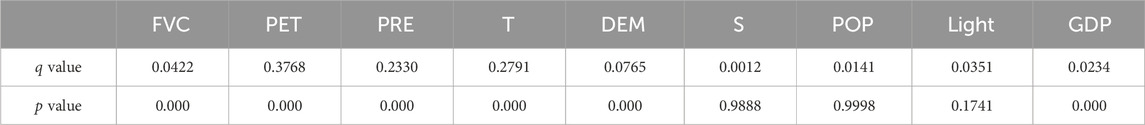
Table 3. Factor geographical detection results in the Yuanjiang dry–hot valley area.
3.2.2 Results of ecological detection
Ecological detection was employed to assess whether significant differences exist in the influence of selected factors on TVDI spatial distribution across the study area, serving to validate factor detection accuracy. The observed results of ecological detection in the study area showed spatial heterogeneity between the factors (Figure 7). Significant differences existed between FVC and PET, PRE and T. However, no significant differences were observed between FVC and other factors. Significant differences were also detected between precipitation and temperature. All remaining ecological interaction results showed non–significant differences. The result demonstrates that spatial and temporal variations in TVDI within the Yuanjiang dry-hot valley area are primarily influenced by natural climatic variables, namely, temperature, precipitation, and PET. Precipitation, temperature, and PET influence TVDI through their effects on vegetation cover dynamics, further confirming that PET, temperature, and precipitation exert the most substantial control over TVDI patterns.
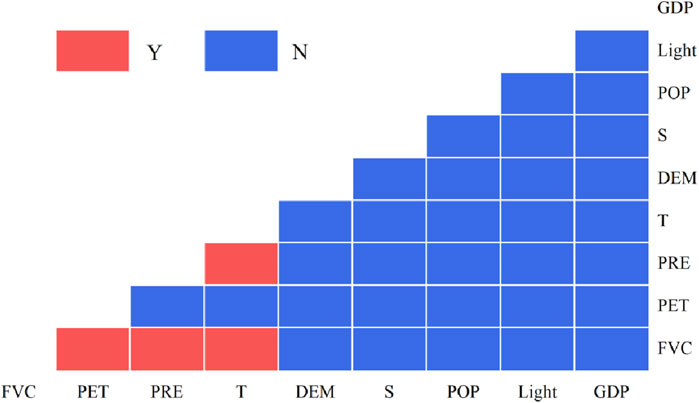
Figure 7. The results of ecological detection in the Yuanjiang dry–hot valley area. Note: “Y” denotes statistically significant differences between the horizontal axis and the vertical axis factors, whereas “N” indicates non–significant differences between them.
3.2.3 Interaction detector
Interaction effects among TVDI influencing factors in the study area were analyzed (Figure 8). Factor interactions exhibited two relationships: nonlinear enhancement and bivariate enhancement, with no individual factor operating in isolation. This indicates that the combined influence of paired factors exceeds the impact of single factors on TVDI. The six highest explanatory power combinations for TVDI variation were PET ∩ GDP (q = 0.4900), PET ∩ PRE (q = 0.4212), PET ∩ DEM (q = 0.4120), PET ∩ T (q = 0.4105), PET ∩ FVC (q = 0.4061) and PET ∩ Light (q = 0.4024). Among bivariate interactions, PET and GDP demonstrated the strongest interactive effect, followed by substantial interactions between PET and temperature, elevation, and precipitation. As a core economic indicator reflecting regional development levels, GDP represents anthropogenic activity. Interactive effects between GDP and PET, GDP and temperature, GDP and precipitation all exceeded corresponding single–factor influences on TVDI. These results further confirm the dominant influence of PET, temperature, and precipitation on TVDI, while revealing that anthropogenic factors exert influence by mediating natural factors. Collectively, this demonstrates that synergistic interactions between natural and anthropogenic factors exert more pronounced control over TVDI spatial distribution patterns.
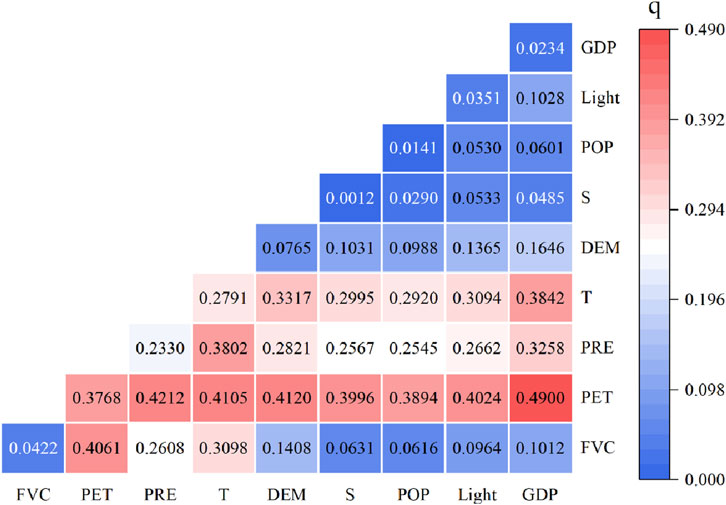
Figure 8. The results of interactive geographical detection in the Yuanjiang dry–hot valley area.
4 Discussion
This study analyzes the characteristics of drought variation in the Yuanjiang dry–hot valley area based on the TVDI. From 2000 to 2020, TVDI values exhibited a slight decreasing trend overall, with an average slope of −0.001, and this change was not statistically significant. The mean Hurst index (H = 0.44) suggests weak anti-persistence in the study area. It increases the instability of the future trend of drought changes. The future changes in drought conditions still require continuous attention. However, in terms of the spatial distribution pattern, the future trends of drought still show clear regularity. In the northwestern regions, TVDI is projected to increase gradually and persistently, indicating worsening drought conditions in the future. Conversely, most southeastern areas are expected to experience a continuous decrease in TVDI, suggesting sustained drought alleviation and gradual ecological improvement. The intensification of drought conditions in the northwestern of study area is likely due to the influence of the Ailao mountains to the west, with the pronounced foehn effect (Wang, 2021). In the enclosed valley sections, high temperatures and intense evapotranspiration occur, leading to excessive moisture depletion coupled with relatively low precipitation. The combined effects of topography and climate exacerbate the drought conditions in this area. Conversely, drought conditions showed a gradual alleviation in the southeastern part. This trend aligns with the overall declining trend of TVDI observed across China (Liu G. P. et al., 2023).
As with TVDI, the SPI, SPEI, and PDSI indices have been utilized in drought monitoring and assessment. SPEI evolved from the potential evapotranspiration based on the SPI and takes into account both precipitation and temperature. SPI-based drought analysis revealed a generally higher and intensifying drought frequency in Honghe Prefecture (the southern study area), consistent with this study’s findings (Chen Z. F et al., 2023). Some researchers have pointed out SPEI is a better indicator of drought than the SPI for warmer areas prone to drought due to abnormally high evapotranspiration (Kingston et al., 2015). Based on the SPEI, there was a clear trend of aridity in Yunnan Province in terms of both temporal and spatial changes from 1960 to 2020 (Lan and Yan, 2024). The calculation of SPI and SPEI relies on the number of meteorological stations. In regions with few meteorological stations, it is difficult to accurately reflect the spatial variations of drought. Grounded in the water balance principle, the PDSI model, however, is recognized to possess several limitations for practical application. The assumptions of PDSI model have been suggested to be modified in the region like Yunnan Plateau (Li and Guo, 2020).
Drought is influenced by various factors, including natural elements such as temperature, precipitation, and evapotranspiration, as well as human activities. Among the natural factors, temperature, precipitation, and evapotranspiration are the primary drivers of drought variation in Yuanjiang dry–hot valley area. As found by Zhao and Zhu (Zhao and Zhu, 2024), precipitation was not the main limiting factor for ecosystem development in dry–hot valleys. This study similarly identified evapotranspiration, rather than precipitation, as the most significant influencing factor. An increase in potential evapotranspiration elevates the TVDI–indicating intensified drought by enhancing soil moisture evaporation and raising land surface temperature. Meanwhile, higher PET increases vegetation transpiration, which reduces vegetation coverage due to water stress under insufficient precipitation, thereby further increasing TVDI and exacerbating drought. Beyond this, precipitation and temperature also substantially affect drought conditions, with temperature exerting a greater influence than precipitation. Similar conclusions were drawn by studies in their drought studies on Xinjiang and typical dry–hot valleys, respectively (Huo et al., 2025; Li et al., 2025).
While individual factors play roles, the combined effects of multiple factors significantly impact TVDI. The explanatory power of GDP alone is only 0.0234, but its interaction with PET, temperature, and precipitation has a more pronounced effect on the spatial distribution of TVDI than any single factor. Areas with higher GDP typically experience greater urbanization, which can alter local microclimates (e.g., through heat island effects), thereby changing temperature, precipitation, and evapotranspiration patterns and subsequently influencing TVDI. In this study, the interaction between PET and precipitation (q = 0.4212) exhibited higher explanatory power than that between PET and temperature (q = 0.4105), diverging from the single–factor hierarchy (PET > temperature > precipitation). This suggests that the synergistic effect of PET and temperature is more significant for TVDI. Both temperature and PET primarily affect regional drought status indirectly through their impact on surface energy balance (Yang et al., 2017). While individual human activity factors show limited impact on drought, their interactions with natural factors substantially affect TVDI. This demonstrates that the combined influence of natural and anthropogenic factors significantly drives TVDI changes, aligning with the findings of previous studies (Tao et al., 2020). This study used nighttime light data, population density, and GDP as proxies for human activities to analyze their impact on drought. Additionally, considering the characteristics of the study area, the land use patterns and their evolution, as well as the influence of altitude on drought, merit further investigation.
The mean TVDI values for each land use type from 2000 to 2020 were extracted. Statistical analysis was then conducted in conjunction with the land use types to determine the changing relationship between different land use types and TVDI (Figure 9). The mean TVDI values for grassland were consistently higher than those for other land use types. The increase in grassland area corresponded with intensified drought. The mean TVDI values for unused land were consistently lower than those for other land use types. The decrease in unused land area corresponded with intensified drought. The TVDI values for woodland and cultivated land were relatively close to each other and comparatively lower, indicating their relatively stronger water and soil conservation capacity. Between 2000 and 2020, the TVDI for cultivated land, woodland, unused land, and construction land showed an overall upward trend. In contrast, the TVDI for grassland and water bodies showed a downward trend, albeit a relatively gentle one.
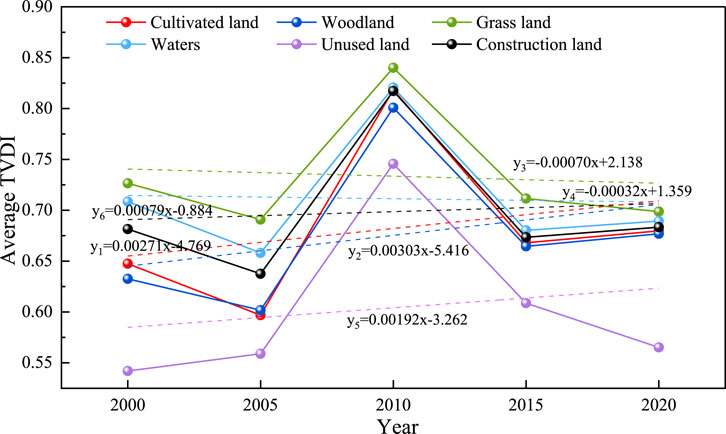
Figure 9. Average TVDI values for different land use types in the Yuanjiang dry–hot valley area.
The contribution rates of different land use types to TVDI are shown in Figure 10. Areas with high drought levels were primarily characterized by cultivated land and woodland. Although cultivated land and woodland maintain the highest contribution rates to TVDI, these rates exhibit a decreasing trend as drought severity increases. During the 5 years of 2000, 2005, 2010, 2015 and 2020, the maximum contribution rate of cultivated land to the TVDI of mild drought was 45%, the minimum was 36%, and the average was 39.4%. The maximum contribution rate of cultivated land to the TVDI of moderate drought was 38%, the minimum was 33%, and the average was 35%. The maximum contribution rate of cultivated land to TVDI in severe drought was 39%, the minimum was 31%, and the average was 34.2%. As drought severity increases, the contribution rate of cultivated land to TVDI initially increased but then decreased. Cultivated land was the second largest land use type in the study area (accounting for approximately 42.4% in 2020), and its area showed an increasing trend. Accordingly, its contribution to drought will further increase. The contribution rate of woodland to TVDI was 55% for mild drought, 51.2% for moderate drought, and 40.2% for severe drought. With the increase in the degree of drought, the contribution rate of woodland to TVDI gradually decreased by 14.8%. Woodland contributed most significantly to TVDI across all drought levels, which is largely attributable to its status as the largest land use type in the study area (accounting for 46.7% in 2020). However, the woodland area in the study area has been declining, which may further exacerbate drought conditions in the area. The TVDI of grass land to mild drought was 4.8%, the contribution rate to moderate drought was 12.2%, and the contribution rate to severe drought was 23.8%. With the increase in the degree of drought, the contribution rate of grass land to TVDI gradually increased by 19%. Based on the contribution of grass land to different levels of drought, and the continuous decrease in grass land area, it is beneficial for alleviating the drought in the study area.
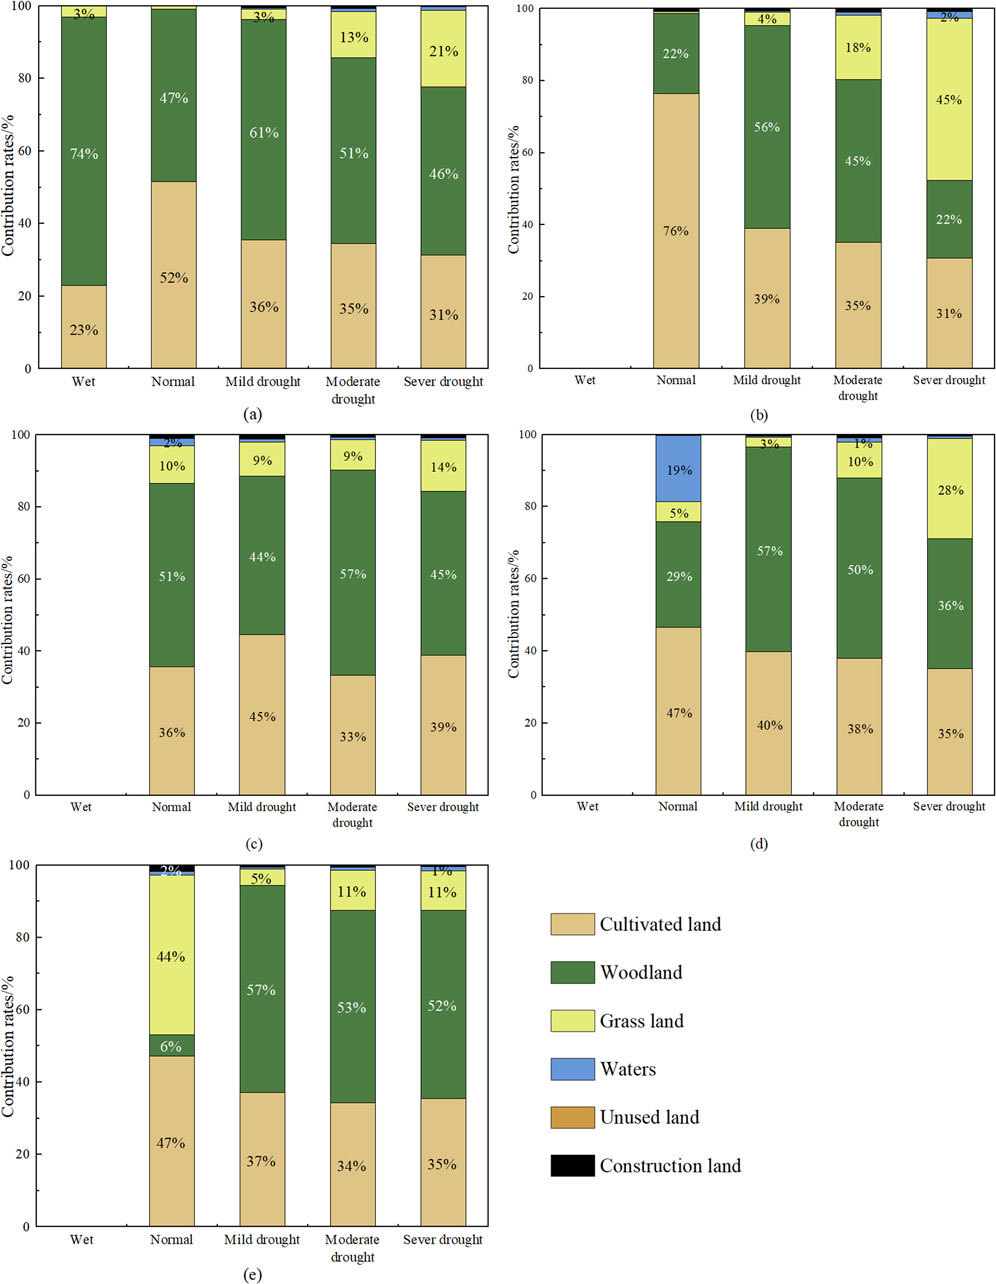
Figure 10. The contribution rate of different land use types to TVDI in the Yuanjiang dry–hot valley area. (a) 2000, (b) 2005, (c) 2010, (d) 2015, (e) 2020.
5 Conclusion
The spatiotemporal characteristics, future change trends, and influencing factors of drought in the Yuanjiang dry–hot valley area were analyzed through the TDVI constructed from land surface temperature and the NDVI during 2000–2020. Theil–Sen trend analysis, the Mann–Kendall test, stability analysis, the Hurst exponent, and geodetector were combined for this spatiotemporal assessment. The major conclusions are as follows:
1. The Yuanjiang dry–hot valley area experienced persistent drought conditions between 2000 and 2020, as indicated by TVDI values averaging 0.67 (moderate drought) and ranging annually from 0.49 to 0.81. While drought was a consistent feature, its severity exhibited a gradual weakening trend, decreasing by 0.0011 per year. The region experienced persistent drought conditions at moderate and severe drought levels from September to May of the following year, with March to April exhibiting severe drought;
2. In terms of spatial distribution, the central valley area experiences more severe drought conditions, while mild drought zones were predominantly distributed in the peripheral regions of the valley, particularly in the northwestern sector of the study area and along the edge of the valley. The northwestern part of the Yuanjiang dry–hot valley area exhibited an upward trend with intensified drought, while the southeastern part showed a downward trend, with drought conditions alleviated. The stability of TVDI trends in the Yuanjiang dry–hot valley area is relatively high overall;
3. The geodetector results indicated that within the study area, potential evapotranspiration, precipitation, and temperature were the primary factors influencing TVDI, with explanatory power exceeding 23%. Notably, potential evapotranspiration was the dominant factor, exhibiting an explanatory power of 37.68%. The interactive effects between factors consistently surpassed the influence of individual factors, with the interaction between potential evapotranspiration ∩ GDP being the most prominent;
4. Areas with high drought levels were primarily characterized by cultivated land and woodland, which exhibited the highest contribution rate to TVDI. Although their contribution rate remained the highest, it showed a decreasing trend as drought severity increases. Conversely, the contribution rate of grass land to TVDI gradually increases with increasing drought severity.
Data availability statement
The raw data supporting the conclusions of this article will be made available by the authors, without undue reservation.
Author contributions
ZG: Conceptualization, Project administration, Writing – original draft, Writing – review and editing. SZ: Methodology, Writing – review and editing. DF: Conceptualization, Resources, Writing – review and editing. GX: Formal Analysis, Methodology, Writing – review and editing. KJ: Investigation, Software, Writing – review and editing. RW: Software, Visualization, Writing – review and editing. AL: Data curation, Supervision, Validation, Writing – review and editing.
Funding
The author(s) declare that financial support was received for the research and/or publication of this article. This research was funded by Key Scientific and Technological Research Project of Henan Province, grant number 252102320245, Key Research Projects of Higher Education Institutions in Henan Province, grant number 25A170004 and Nanhu Scholars Program for Young Scholars of XYNU, grant number 2019046.
Conflict of interest
The authors declare that the research was conducted in the absence of any commercial or financial relationships that could be construed as a potential conflict of interest.
Generative AI statement
The author(s) declare that no Generative AI was used in the creation of this manuscript.
Any alternative text (alt text) provided alongside figures in this article has been generated by Frontiers with the support of artificial intelligence and reasonable efforts have been made to ensure accuracy, including review by the authors wherever possible. If you identify any issues, please contact us.
Publisher’s note
All claims expressed in this article are solely those of the authors and do not necessarily represent those of their affiliated organizations, or those of the publisher, the editors and the reviewers. Any product that may be evaluated in this article, or claim that may be made by its manufacturer, is not guaranteed or endorsed by the publisher.
References
Chen A, A., Jiang, J., Luo, Y., Zhang, G., Hu, B., Wang, X., et al. (2023). Temperature vegetation dryness index (TVDI) for drought monitoring in the Guangdong province from 2000 to 2019. PeerJ 11, e16337. doi:10.7717/peerj.16337
Chen, J., Yang, S. T., Li, H. W., Zhang, B., and Lv, J. R. (2013). Research on geographical environment unit division based on the method of natural breaks (jenks). Int. Arch. Photogramm. Remote Sens. Spat. Inf. Sci. 40 (4W3), 47–50. doi:10.5194/isprsarchives–XL–4–W3–47–2013
Chen, T., Xia, J., Zou, L., and Hong, S. (2020). Quantifying the influences of natural factors and human activities on NDVI changes in the hanjiang river basin, China. Remote. Sens. 12, 3780. doi:10.3390/rs12223780
Chen, G. J., Fang, N., Li, J. F., Wu, X. H., and Dong, X. Y. (2024). Spatiotemporal variation and drivers of drought based on TVDI in the lower reaches of the jinsha river. J. Resour. Ecol. 15 (1), 44–54. doi:10.5814/j.issn.1674–764x.2024.01.004
Chen Z. F, Z. F., Li, J., Xiang, B., Duan, Q. S., Li, S. F., and Wang, S. F. (2023). Spatiotemporal variation of drought in Yunnan province calculated using the standardized precipitation index. J. Irrig. Drain. 42 (4), 92–99. doi:10.13522/j.cnki.ggps.2022250
Deng, J. S., Li, Z. M., Chen, S. S., Chen, Y., and Li, L. D. (2024). Temporal and spatial variation characteristics of drought in panxi region based on TVDI. Agric. Res. Arid. Areas 42 (01), 252–260+269. doi:10.7606/j.issn.1000–7601.2024.01.26
Ding, Y. J., Zhang, L. F., He, Y., Cao, S. P., Wei, X., Guo, Y., et al. (2024). Spatiotemporal evolution of agricultural drought and its attribution under different climate zones and vegetation types in the yellow river basin of China. Sci. Total Environ. 914, 169687. doi:10.1016/j.scitotenv.2023.169687
Du, L. T., Song, N. P., Liu, K., Hou, J., Hu, Y., Zhu, Y. G., et al. (2017). Comparison of two simulation methods of the temperature Vegetation Dryness index (TVDI) for drought monitoring in semi–arid regions of China. Remote Sens. 9, 177. doi:10.3390/rs9020177
Du, J. M., Luo, M. L., Bai, L. C., and Wu, Q. S. (2024). Inversion of soil moisture in the yuanmou hot–dry river valley area based on the PSO_GA–RBF neural network model. Acta Geod. Cartogr. Sinica 11, 1–6. doi:10.13474/j.cnki.11–2246.2024.1101
Guo, E. L., Liu, X. P., Zhang, J. Q., Wang, Y. F., Wang, C. L., Wang, R., et al. (2017). Assessing spatiotemporal variation of drought and its impact on maize yield in northeast China. J. Hydrol. 553, 231–247. doi:10.1016/j.jhydrol.2017.07.060
Huo, H., Zhao, X., Lei, W. W., and Sun, C. P. (2025). Characteristics and driving forces of spatial and temporal changes of droughtin typical dry–hot valley areas. J. Irrig. Drain, 1–12. doi:10.13522/j.cnki.ggps.2024322
Hurst, H. E. (1951). Long–term storage capacity of reservoirs. Trans. Amer. Soc. Civ. Eng. 116, 770–799. doi:10.1061/taceat.0006518
IPCC (2021). Climate change 2021: the physical science basis. Available online at: https://www.ipcc.ch/report/ar6/wg1/.
Jin, Z. Z., and Ou, X. K. (2000). Vegetations in the hot and dry valleys along the yuanjiang, nujiang, jinshajiang, and lancangjiang Rivers. Kunming, China: Yunnan University Press, 1–297.
Kingston, D. G., Stagge, J. H., Tallaksen, L. M., and Hannah, D. M. (2015). European-scale drought: understanding connections between atmospheric circulation and meteorological drought indices. J. Clim. 28, 505–516. doi:10.1175/JCLI-D-14-00001.1
Lan, T. Q., and Yan, X. D. (2024). Analysis of drought characteristics and causes in Yunnan province in the last 60 years (1961–2020). J. Hydrometeorol. 25 (1), 177–190. doi:10.1175/JHM-D-23-0092.1
Lawal, S., Hewitson, B., Egbebiyi, T. S., and Adesuyi, A. (2021). On the suitability of using vegetation indices to monitor the response of Africa’s terrestrial ecoregions to drought. Sci. Total Environ. 792, 148282. doi:10.1016/j.scitotenv.2021.148282
Li, Y., and Guo, H. P. (2020). Applicability analysis of palmer drought index in yunnan-guizhou Plateau in China. IOP Conf. Ser. Earth Environ. Sci. 569, 012095. doi:10.1088/1755-1315/569/1/012095
Li, Y. P., and Li, Y. H. (2017). Advances in adaptability of meteorological drought indices in China. J. Arid. Meteorol. 35 (5), 709. doi:10.1175/j.issn.1006–7639(2017)–05–0709
Li, X. P., Li, K., Lei, S., Jia, F. G., and Xu, J. (2025). Spatiotemporal variations in drought conditions in Xinjiang based on TVDI. Arid. Zone Res. 42 (4), 589–599. doi:10.13866/j.azr.2025.04.02
Liu, G. P., Fan, J. J., Zhao, Y. F., Liu, Y., and Tian, J. Q. (2023b). Analysis of the spatiotemporal variation characteristics and influencing factors of China's TVDI in the past 20 years. Agric. Technol. Equip. 3, 39–44. doi:10.3969/j.issn.1673–887X.2023.03.014
Mandelbrot, B. B., and Wallis, J. R. (1969). Robustness of the rescaled range R/S in the measurement of noncyclic long run statistical dependence. Water Resour. Res. 5 (5), 967–988. doi:10.1029/WR005i005p00967
Mann, H. B. (1945). Nonparametric tests against trend. Econometrica 13, 245–259. doi:10.2307/1907187
Nugraha, A. S. A., Kamal, M., Murti, S. H., and Widyatmanti, W. (2023). Development of the triangle method for drought studies based on remote sensing images: a review. Remote Sens. Appl. Soc. Environ. 29, 100920. doi:10.1016/j.rsase.2023.100920
Rahimzadeh–Bajgiran, P., Omasa, K., and Shimizu, Y. (2012). Comparative evaluation of the vegetation dryness index (VDI), the temperature vegetation dryness index (TVDI) and the improved TVDI (iTVDI) for water stress detection in semi–arid regions of Iran. Isprs J. Photogramm. Remote Sens. 68, 1–12. doi:10.1016/j.isprsjprs.2011.10.009
Sandholt, I., Rasmussen, K., and Andersen, J. (2002). A simple interpretation of the surface temperature/vegetation index space for assessment of surface moisture status. Remote Sens. Environ. 79, 213–224. doi:10.1016/S0034–4257(01)00274–7
Sharma, A. P. M., Jhajharia, D., Gupta, S., and Yurembam, G. S. (2022). Multiple indices based agricultural drought assessment in Tripura, northeast India. Arab. J. Geosci. 15 (7), 636. doi:10.1007/s12517–022–09855–0
Tao, S., Kuang, T. T., Peng, W. F., and Wang, G. J. (2020). Analyzing the spatio–temporal variation and drivers of NDVI in upper reaches of the yangtze river from 2000 to2015: a case study of yibin city. Acta Ecol. Sin. 40 (14), 5029–5043. doi:10.5846/stxb201904190790
Tao, L. L., Ryu, D., Western, A., and Boyd, D. (2021). A new drought index for soil moisture monitoring based on MPDI–NDVI trapezoid space using MODIS data. Remote Sens. 13 (1), 122. doi:10.3390/rs13010122
Wang, C. Y. (2007). Progress in research on major agrometeorological disasters. Beijing, China: China Meteorological Press.
Wang, J. G. (2021). “Characteristics of foehn and its influence on vegetation in yuanjiang dry–hot valley, Yunnan province,”. Kunming, China: Yunnan University. doi:10.27456/d.cnki.gyndu.2021.003226
Wang, J., and Yu, Y. (2021). Comprehensive drought monitoring in Yunnan province, China using multisource remote sensing data. J. Mt. Sci. 18 (6), 1537–1549. doi:10.1007/s11629–020–6333–7
Wang, J. F., Zhang, T. L., and Fu, B. J. (2016). A measure of spatial stratified heterogeneity. Ecol. Indic. 67, 250–256. doi:10.1016/j.ecolind.2016.02.052
Yang, R. W., Wang, H., Hu, J. M., Cao, J., and Yang, Y. (2017). An improved temperature vegetation dryness index (iTVDI) and its applicability to drought monitoring. J. Mt. Sci. 14 (11), 2284–2294. doi:10.1007/s11629–016–4262–2
Zhang, R. Z. (1992). The dry valleys of the hengduan Mountains region. Beijing, China: Science Press, 1–14.
Zhang, L. F., Jiao, W. Z., Zhang, H. M., Huang, C. P., and Tong, Q. X. (2017). Studying drought phenomena in the Continental United States in 2011 and 2012 using various drought indices. Remote Sens. Environ. 190, 96–106. doi:10.1016/j.rse.2016.12.010
Keywords: drought, TVDI, trend analysis, geographical detector, Yuanjiang dry–hot valley area
Citation: Gu Z, Zhai S, Feng D, Xu G, Ji K, Wang R and Li A (2025) Characteristics and driving forces of spatial and temporal changes of drought in Yuanjiang dry–hot valley area of China based on TVDI. Front. Environ. Sci. 13:1670105. doi: 10.3389/fenvs.2025.1670105
Received: 28 July 2025; Accepted: 08 September 2025;
Published: 03 October 2025.
Edited by:
Fucang Zhang, Northwest A&F University, ChinaCopyright © 2025 Gu, Zhai, Feng, Xu, Ji, Wang and Li. This is an open-access article distributed under the terms of the Creative Commons Attribution License (CC BY). The use, distribution or reproduction in other forums is permitted, provided the original author(s) and the copyright owner(s) are credited and that the original publication in this journal is cited, in accordance with accepted academic practice. No use, distribution or reproduction is permitted which does not comply with these terms.
*Correspondence: Detai Feng, ZmVuZ19kZXRhaUB5bnUuZWR1LmNu