 Zhen Song
 Ming Chen1,2
- 1Changsha General Survey of Natural Resources Center, China Geological Survey, Changsha, China
- 2Huangshan Observation and Research Station for Land-Water Resources, Huangshan, China
- 3Key Laboratory of Natural Resource Coupling Process and Effects, Beijing, China
The counties in the metropolitan hinterland, due to their unique locational advantages and pivotal functions, have emerged as crucial strategic pivots for economic development of cities. However, the rapid pace of urbanization has exerted considerable pressure on the ecosystems of these counties. Against this backdrop, assessing the ecosystem service value and its driving factors in these regions is of significant decision-making importance for promoting the coordinated development of urban economy and ecological conservation. Therefore, this study used the revised equivalent factor method to evaluate the spatial-temporal variation of regional ESV by the perspective of land use transformation in Ningxiang City during the years 2010, 2016 and 2022. The driving mechanism of ESV spatial differentiation was explored by combining geographic detector and geographically weighted regression (GWR) model. The results revealed that: (1) From 2010 to 2022, the area of construction land expanded the most, while the areas of ecological land such as forest land, water body and grassland decreased continuously. Accordingly, the total ESV declined consistently, dropping from 121.03 × 10⁸ yuan to 113.93 × 10⁸ yuan, with notable decreases of ESV in hydrological regulation services, forest land and water body. (2) At the grid unit and township (street) spatial scales, ESV demonstrated a northwest-high-northeast-low distribution pattern with significant spatial clustering effects, revealing persistent ecological degradation risks in the northeast. (3) Geographic detector revealed that synergistic effects of multiple natural and socio-economic driving factors shaped the spatial differentiation of the regional ESV. The main driving factors identified were the normalized vegetation index (NDVI), human impact index (HAI), and population density (POP). The influence of NDVI on ESV was generally higher in the west than east, while the negative influence intensity of HAI and POP on ESV gradually weakened from east to west. Based on the perspective of high-precision ESV assessment in small areas, this study provided scientific support for ecological policy formulation and sustainable land-use planning in Ningxiang City as well as similar counties.
1 Introduction
Ecosystem service value (ESV) refers to the value of life-supporting products and services directly or indirectly provided through the functions, processes, and structures of ecosystems, reflecting the contribution of ecosystems to human society and the quality of the ecological environment (Sannigrahi et al., 2019; Li C. et al., 2024). It includes the value of the supply services, regulation services, support services and cultural services provided by the ecosystems (Costanza et al., 2017). Land use serves as a crucial carrier of ESV (Sutton et al., 2016; Chen et al., 2021). However, with the growing demand for socio-economic development, human exploitation and misuse of natural resources resulted in alterations in land use pattern and a decline in the carrying capacity of natural ecosystems, posing ecological environmental issues as significant impediments to further regional development (Arowolo et al., 2018). Therefore, conducting quantitative assessments of ESV has become a crucial method for regional ecosystem management, holding significant importance for promoting environmental protection and coordinated socio-economic development in a region.
At present, two main monetary valuation methods have been employed to evaluate ESV: one is primary-data-based method (Hu et al., 2020), usually adopting a series of ecology-related models to evaluate key service functions, such as, market price method (Zhao et al., 2003), carbon tax method (Gashaw et al., 2018), travel cost method (Cetin et al., 2021), etc. The other is unit-value-based method (Costanza et al., 1998; Costanza et al., 2014), mainly including the equivalent factor method in which ESV is estimated based on the economic value per unit area of ecosystems with land use as the basis (Shi et al., 2012). This method was first proposed by Costanza et al. (1997). Domestic scholars such as Xie Gaodi adapted the Costanza’s ESV assessment method by revising the equivalence factor approach, establishing a set of ESV evaluation systems suitable for China (Xie et al., 2008). This method, due to its simplicity and reliability, has gained favor among numerous scholars and is widely applied in assessing the spatiotemporal distribution of ESV across various scales. However, existing studies primarily focus on large-scale regions such as provinces, watersheds, metropolises, and typical landscape areas (Qiang et al., 2017; He et al., 2021; He et al., 2022), while high-precision ESV assessment in smaller-scale regions, such as counties and lower administrative units (townships, streets), is relatively scarce. Especially, the counties in the metropolitan hinterland are playing an increasingly prominent role in the economic process adjacent to cities. Strengthening the high-precision ESV assessment of these small-scale counties not only meets the practical needs of ecological governance but also helps promote the coordinated development of regional economy and ecology (An et al., 2023).
To further grasp the root causes of ecological and environmental issues and obtain the ESV aligned with societal needs, it is crucial to identify the driving factors behind the variation in ESV. Existing research on the spatiotemporal variation and driving factors of ESV predominantly rely on conventional statistical methods, including correlation analysis, redundancy analysis, and regression analysis (Zhang and Gao, 2015; Zhang et al., 2020; Liao et al., 2023). However, in practice, ESV is typically influenced by a combination of natural and socio-economic factors, with the impacts of these drivers often being spatially heterogeneous. Moreover, there are usually strong interactions among these factors. Conventional methods only reveal the strength of the impact of each driving factor on ESV, but fail to the interactions between multiple factors and their respective spatial heterogeneity, leading to potentially biased interpretations of the relationship between ESV and its driving factors (Wang et al., 2022). The geographical detector model, as a novel spatial statistical approach, not only detects spatial stratification and identifies influencing factors but also quantifies the interactions between multiple factors. It has become a key tool for uncovering the underlying drivers of ESV (Qiang et al., 2017). Additionally, introducing the geographically weighted regression (GWR) model allows for the effective revelation of localized differences in ESV drivers from a spatial perspective (Chen et al., 2020), facilitating targeted governance measures for major underlying issues in specific regions.
Ningxiang City, located in Hunan Province, China, stands as a representative metropolitan hinterland county of the Chang-Zhu-Tan region and functions as an industrial hub in the western part of Changsha. Its unique location renders it not only a vital factor flow channel supporting the coordinated industrial development of the Chang-Zhu-Tan urban agglomeration, but also a green foundation ensuring regional ecological security. However, in recent years, due to economic growth and intensified human activities, negative ecological impacts such as forest land encroachment and shrinking water body have become increasingly apparent (Yang and Liu, 2022). These trends weakened the function of the ecosystems, posing a significant threat to the long-term economic viability of this region, but also potentially affecting the overall progress of promoting the rise of central China strategy.
Consequently, this study utilized land use data from 2010 to 2022 to evaluate the spatiotemporal variation of ESV in Ningxiang City, and elucidated the driving mechanism behind ESV spatial differentiation through a combination of geographic detector and GWR model. The main objectives of this study were: (1) analyzing the conversion of land use types in Ningxiang City from 2010 to 2022; (2) quantify ESV and reveal the spatiotemporal variation characteristics of ESV; (3) identifying the driving forces and their impacts that led to changes in the ESV. This study not only enriched the high-precision ESV assessment results at county-level, but also aimed to provide scientific support for land use planning and ecological construction in Ningxiang city as well as other counties in the metropolitan hinterland.
2 Materials and methods
2.1 Study area
The City of Ningxiang, Hunan Province (27°55′N∼28°29′N, 111°53′E∼112°46′E), located at the junction of the Chang-Zhu-Tan urban agglomeration and the ecological and economic circle around Dongting Lake, borders Changsha City to the east and Dongting Lake to the north (Figure 1). It serves as both a suburban county and a sub-center city of the provincial capital in Hunan. The region belongs to the subtropical continental monsoon humid area, characterized by distinct seasons, abundant rainfall, and moderate sunshine. The multi-year average temperature is 16.8 °C, with an annual precipitation of 1358.3 mm. Covering a total area of 2906 km2, Ningxiang administers 4 streets, 21 towns, and 4 townships, and the local economic level is a leading position within the county.
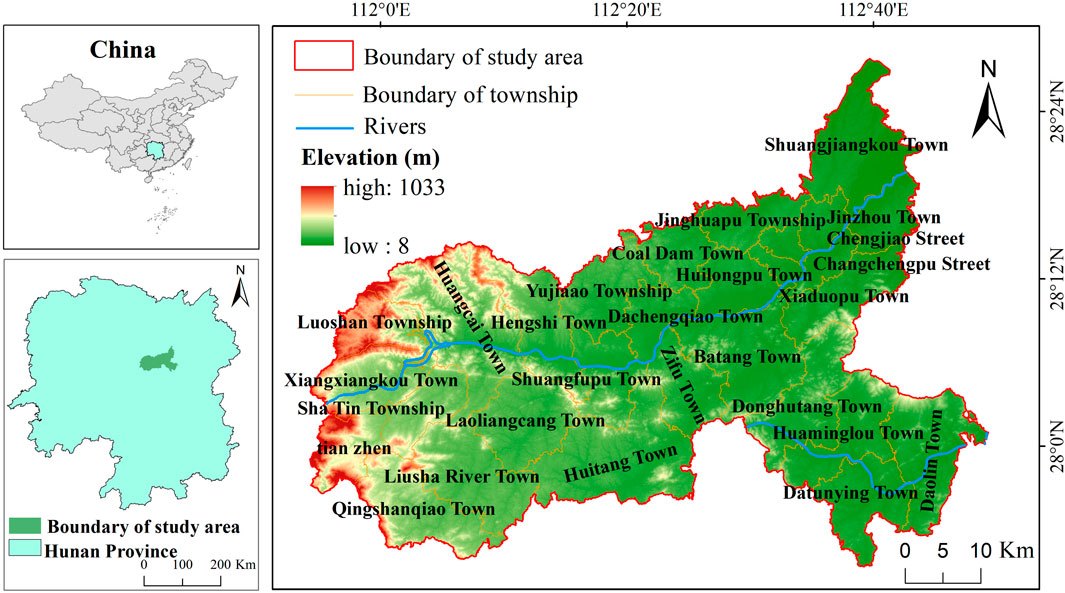
Figure 1. The geographical location of Ningxiang City.
Ningxiang City features a typical hilly landscape, with hills accounting for approximately 88% of its terrain. The area also includes mountains, terraces, and plains, presenting a topographic pattern that is higher in the west and lower in the east. The region boasts a well-developed river network, dominated by the Weijiang and Jinjiang river systems that traverse the entire area. The county possesses a dual advantage of natural resource reserves and economic development. With a forest coverage rate of 48.79%, the abundant forest resources in this area serve as an ecological barrier for the Chang-Zhu-Tan region. Economically, the region enjoys prominent locational and functional advantages, including the main urban area with active human construction activities, which is the core and supporting circle of county economic development. Consequently, this paper chose Ningxiang city as a representative county located in metropolitan hinterland to analyze the spatial-temporal variation of ESV and its driving factors.
2.2 Data sources and processing
The land use data of Ningxiang City in 2010, 2016 and 2022 were obtained from the Chinese Academy of Sciences’ Resource and Environmental Science and Data Center (https://www.resdc.cn), with a spatial resolution of 30 m. Based on the characteristics of land use within the study area, it was categorized into six major types: forest land, cultivated land, grassland, water body, construction land, and bare land. The grain price data used in this study were sourced from the official website of the National Development and Reform Commission (https://www.ndrc.gov.cn), while data on grain production and sowing area from 2010 to 2022 were extracted from the Changsha Statistical Yearbooks (https://data.stats.gov.cn/).
The driving factors of ESV are primarily divided into natural factors and socio-economic factors (Li et al., 2022). Considering data availability, representativeness and actual situation of the study area, combined with relevant research results (Wang et al., 2024; Hu et al., 2025), a driving force indicator system was constructed for both natural and socio-economic aspects. Natural factors included Digital Elevation Model (DEM), slope, annual precipitation (PRE), average annual temperature (TEM), Normalized Difference Vegetation Index (NDVI), soil bulk density (SBD), and soil organic matter (SOM). Socio-economic factors comprised per capita gross domestic product (GDP), population density (POP), distance to roads (DTR), and the Human Activity Index (HAI). Annual precipitation and average annual temperature data were obtained from the National Meteorological Science Data Center (https://data.cma.cn/). Road vector data from OpenStreetMap (https://www.openstreetmap.org/), and the HAI was calculated using methods referenced from previous studies. Other indicator data were all sourced from the Chinese Academy of Sciences’ Resource and Environmental Science and Data Center (https://www.resdc.cn).
The driving factors were rasterized and subsequently reclassified employing natural breaks classification method utilizing ArcGIS. Considering the size of the study area and the resolution of the data, we used Fishnet to build a 500 × 500 m grid covering the study area. Based on the fishnet grid, the total amount of ESV and each index in the grid unit were sampled, so as to obtain the type data set for geographical detector analysis.
2.3 Methods
2.3.1 ESV evaluation
Our study calculated ESV by referring to the China ESV equivalent factor table formulated by Xie et al. (2015). However, the ESV equivalence factor table established by Xie et al. is targeted at the national level, so it needs to be revised for regional application to adapt to actual situations. Referring to the revised method of equivalent factor table in the research area proposed by Gao et al. (2018), a more natural condition-compliant ecological value equivalent factor table for Ningxiang City was developed through comparative analysis of ecosystem service value ratios from relevant literature on Ningxiang City and surrounding areas (Peng et al., 2021; Wang and Tang, 2021; Zhao et al., 2023). The economic value of an ESV equivalent factor was set as 1/7 of the average grain per unit production market economic value in the study area (Equation 1) (Liu et al., 2023). The average grain yield in Ningxiang from 2010 to 2022 was used as the unit yield (6.715 t/hm2), and the average grain price was the national minimum average purchase price of mid-late indica rice from 2010 to 2022 (2683.84 yuan/t). The economic value of the ESV equivalent factor per unit area of was calculated to be 2574.57 yuan/hm2.
Where, Ea represents the economic value of the ESV equivalent factor per unit area (yuan/hm2). i is the crop species. Pi is the average grain price (yuan/t). qi is the average grain yield of i (t/hm2). Mi refers to the area of the i-th grain (hm2). M is the total area of grains (hm2).
Referring to the research of Xie et al. (2015), the ESV equivalent coefficient per unit area of each land ecosystem in Ningxiang City was obtained and displayed in Table 1, and the total ESV was ultimately determined by adding together the ESVs of each land ecosystem (Li et al., 2010). Following previous studies, construction land was excluded from ESV calculations with a assigned value of 0 (Shang et al., 2022). The calculation equations for ESV are as follows.
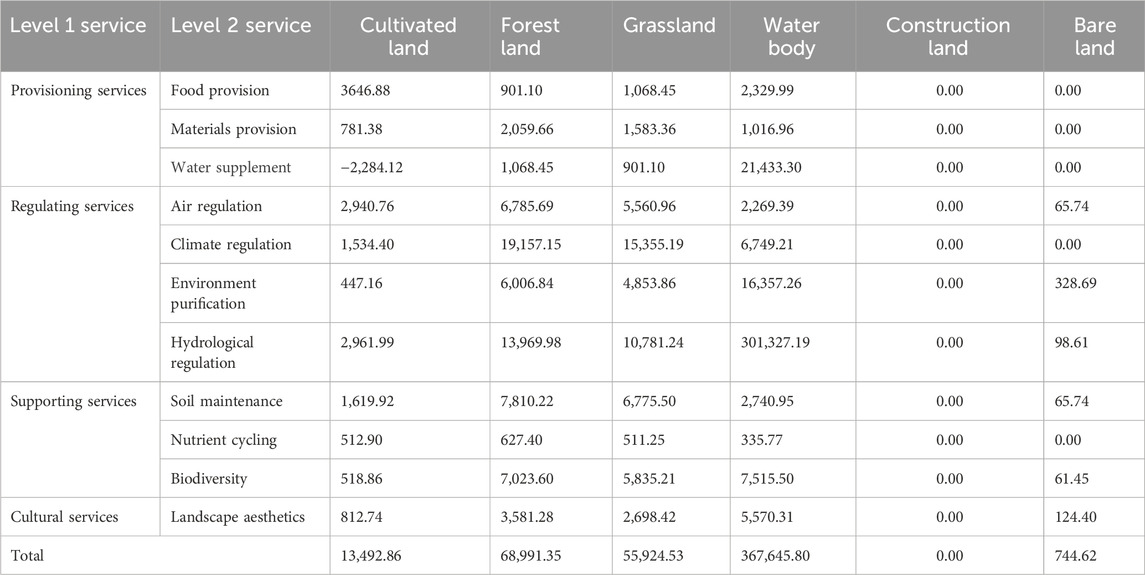
Table 1. Equivalent value per unit area of ecosystem services in Ningxiang City (yuan/hm2/year).
Where, VC represents the ESV equivalent coefficient per unit area (yuan/hm2/year). Q is the revised ESV equivalent coefficient per unit area for the study area. ESV is the total ecosystem service value of the study area (yuan). i is the ecosystem service function type. j is the number of land use type. Aj is the area of land use type j (hm2). VCij is the ESV per unit area of the land use type i.
2.3.2 Sensitivity test
The sensitivity coefficient was adopted to verify the reasonableness of the revised ESV coefficients. Adjust the unit area ESV value coefficient (VC) for each land use type by 50% to measure the degree of ESV response to changes in VC (Pan et al., 2021). The equation is as follows:
Where, CS is the sensitivity coefficient, VCik and VCjk are initial and adjusted VC for the land use type k, respectively. ESVi and ESVj represent initial and adjusted total estimated ESV, respectively. If CS < 1, it indicates the ESV is low in elasticity relative to VC and reflects that the revised ESV coefficients are reliable, while if CS > 1, it indicates the ESV is high in elasticity relative to VC and reflects that the revised ESV coefficients are unreliable.
2.3.3 Human activity index (HAI)
The HAI reflects the impact of human social activities on the changes of ecosystems. The equation of the HAI is as follows (Yan et al., 2014):
Where, Ai is the total area of the land use type i. Pi is the coefficient of human activity intensity reflected by the land use type i. TA is the total area of the study area. Using Delphi method (Liang and Liu, 2011) to determine the Pi of various land use types: cultivated land (0.61), forest land (0.12), grassland (0.09), water (0.12), construction land (0.94) and bare land (0.08).
2.3.4 Spatial autocorrelation analysis
The spatial autocorrelation method can identify whether a variable in a region has similar or dissimilar patterns, and identify the spatial dependence between adjacent positions. Moran’s index (Moran’s I) is used to measure whether there is correlation in the spatial distribution of ESV. Moran’s index is divided into global Moran’s index and local Moran’s index. The former is used to test whether there is spatial correlation between variables as a whole, and the latter reveals the aggregation and dispersion of variables in local areas (Zhang et al., 2023). The equations of the two are as follows:
Where, I and Ii represent the global and local Moran’s index. n is the observation region. xi and xj are the coupling coordination values of regions i and j, and Wij is the adjacency space weight matrix. If Ii is positive, it indicates that units with similar attribute values are clustered in space, which can be high clustering or low clustering. If Ii is negative, it indicates that units with different attribute values are clustered in space.
2.3.5 Geographic detector model
Geographic detector is a new spatial analysis method for accurately identifying and analyzing spatial heterogeneity and driving forces behind various geographical phenomena (Wang and Xu, 2017). The influence mechanism of each factor and its interaction on the spatial heterogeneity of ESV in the study area can be quantitatively analyzed by using the factor detection and interactive detection of geographical detector (Ding et al., 2019). The equation used is as follows:
Where, q is the explanatory power for a driving factor on the spatial differentiation characteristics of ESV, which takes the range [0, 1]. h = 1, … , L are the stratification of y or factor x, that is, classification or partition. Nh and N are the number of units in h and the whole region, respectively. σℎ 2and σ2 are the variances in layer h and the whole region, respectively.
2.3.6 Geographically weighted regression (GWR)
GWR model is a spatial analysis technique that extends the OLS model to estimate parameters. The model combines spatial correlation with linear regression, considers the local effect and spatial non-stationarity of spatial objects (Zhu et al., 2020). The evaluation results have the reliability of spatial scale, so it is widely adopted in geography and other spatial analysis research fields (Windle et al., 2010). In this study, GWR method is used to explore the spatial heterogeneity of the dominant factors of ESV. The equation is as follows:
Where, yi is the explanatory variable, (μi,υi) is the coordinate of the center position of sampling point I. β0 (μi,υi) is the intercept, βk (μi,υi) is the regression coefficient of I. xik is the numerical value of xk on I, and εi is a random disturbance term.
3 Results and analysis
3.1 Land use change of Ningxiang City
From 2010 to 2022, the land use types in Ningxiang City were mainly cultivated land and forest land, with a very low proportion of bare land (Figures 2, 3). Forest land showed a trend of decreasing first and then increasing, with a cumulative decrease of 80.19 km2, followed by cultivated land, which showed an increase first and then decrease, with a cumulative increase of 52.65 km2. The construction land continued to expand with the largest increase (78.84%), reflecting an active economic development trend. The grassland area continued to decrease, and the water area first increased and then decreased, with the rate of area decrease of 12.74% and 16.18% respectively.
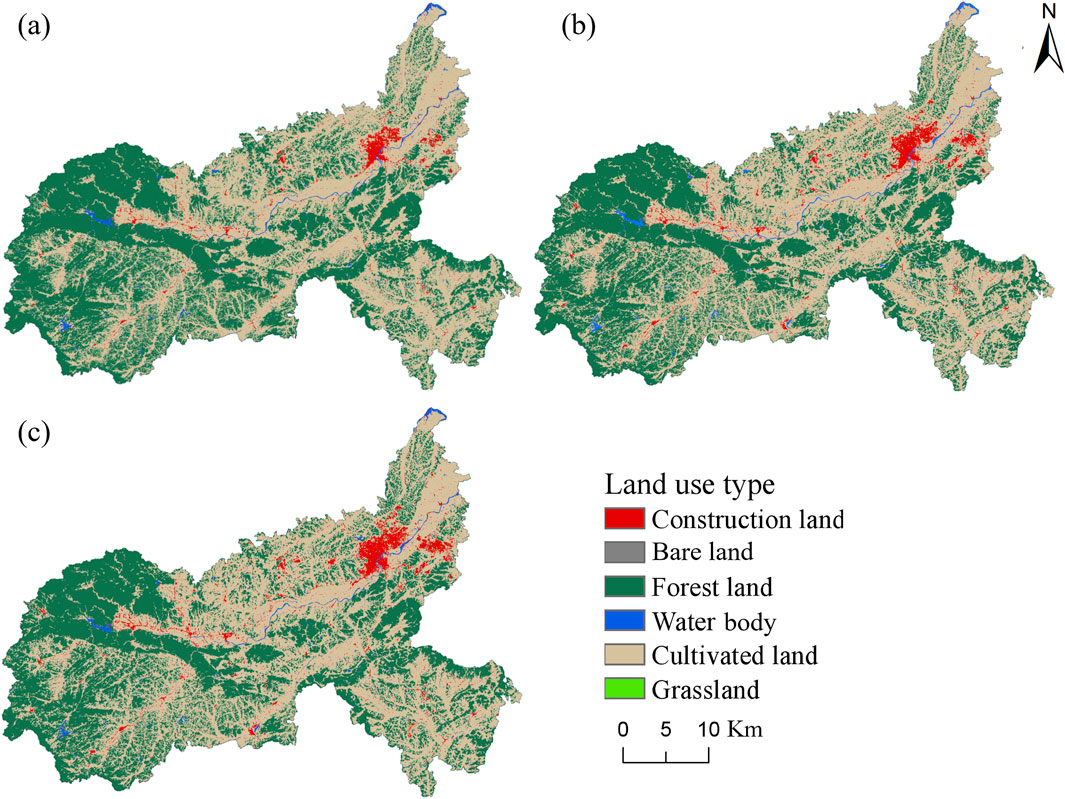
Figure 2. Land use types in Ningxiang City between 2010 (a), 2016 (b) and 2022 (c).
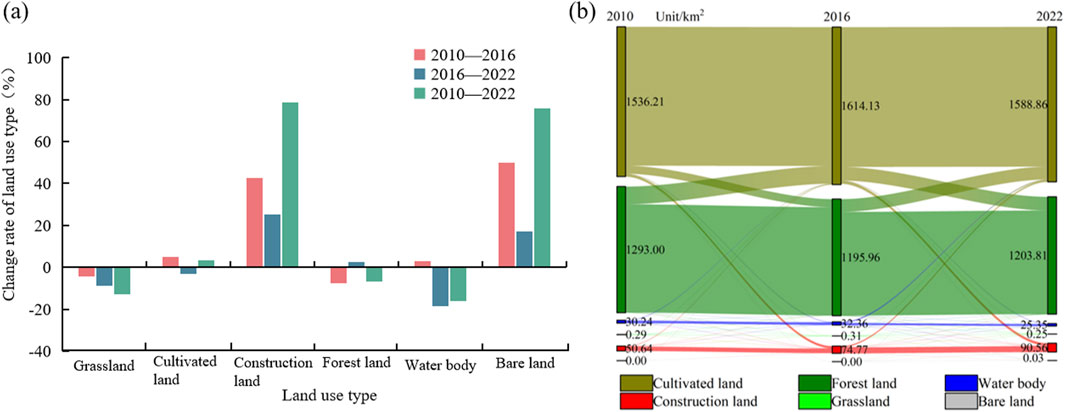
Figure 3. Changes of land use types in Ningxiang City from 2010 to 2022. (a) Land use change rate; (b) Transfer of land use types.
In the dynamic transformation of land use types, cultivated land mainly flowed to forest land and construction land. Forest land mainly flowed to cultivated land and construction land. Construction land was mainly transferred to cultivated land and water, and the transfer amount mainly came from cultivated land and forest land. The main outflow and inflow of water body were both cultivated land. Grassland mainly turned to construction land, and the transfer amount mainly came from cultivated land and forest land.
3.2 Temporal and spatial variation characteristics of ESV in Ningxiang City
3.2.1 Temporal variation of ESV
From 2010 to 2022, the total ESV of Ningxiang City demonstrated a persistent downward trend, decreasing from 121.03 × 10⁸ yuan in 2010 to 113.93 × 10⁸ yuan in 2022, with a decrease rate of 5.96% (Table 2). With regard to the four ecosystem service functions, the contribution of regulates services to ESV was predominant, followed by support services, supply services and cultural services. All four first level service functions generally declined over the study period. Hydrological regulation and climate regulation were always the core functions of ecosystem services in Ningxiang City. Except for a slight increase in the total ESV of food production, other functions generally showed sustained decreases. Notably, the ESV of hydrological regulation underwent the most significant change, reducing by 2.52 × 10⁸ yuan (7.94%), closely followed by climate regulation, reducing by 1.63 × 10⁸ yuan. Furthermore, the ESV of water supplement recorded the largest percentage decline at 21.64%, primarily attributed to persistent reductions in surface water area. Significantly, compared with the period from 2010 to 2016, the decline of ESV of various service functions in the study area showed an obvious slowdown trend from 2016 to 2022.
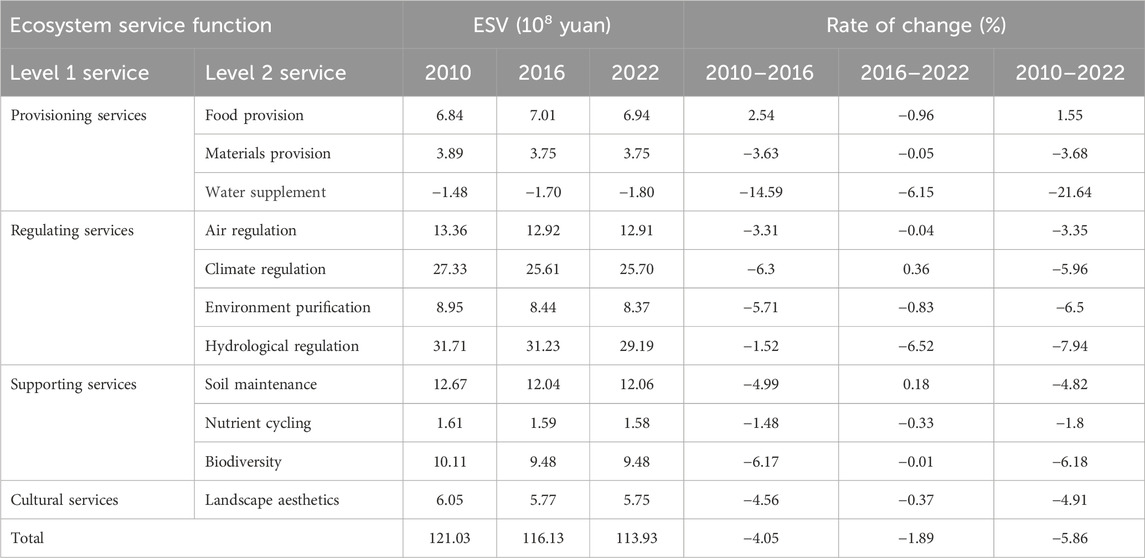
Table 2. ESV and its changes of different ecosystem services in Ningxiang City from 2010 to 2022.
As detailed in Table 3, forest land and cultivated land were the main contributors to the ESV of Ningxiang City throughout the study period. The ESV of cultivated land exhibited an initial increase followed by a subsequent decrease, resulting in a net gain of 3.51%. In contrast, the ESV of forest land first decreased and then increased, with the cumulative decrease accounting for 85.24% of the total ESV decrease. The ESV of grassland likewise followed an hump-shaped trajectory, ultimately declining by 12.74%. Water body suffered both substantial absolute losses (1.77 × 10⁸ yuan) and severe percentage declines (15.97%), underscoring the vital role of water body in fostering elevated ecological values. The bare land coverage remained minimal. Although fluctuations in its extent lead to significant variations in the ESV it provided, its overall contribution to the regional ESV remained negligible due to its low value. Overall, the continuous shrinkage of forests and water body is one of the important reasons for the loss of the regional ESV.
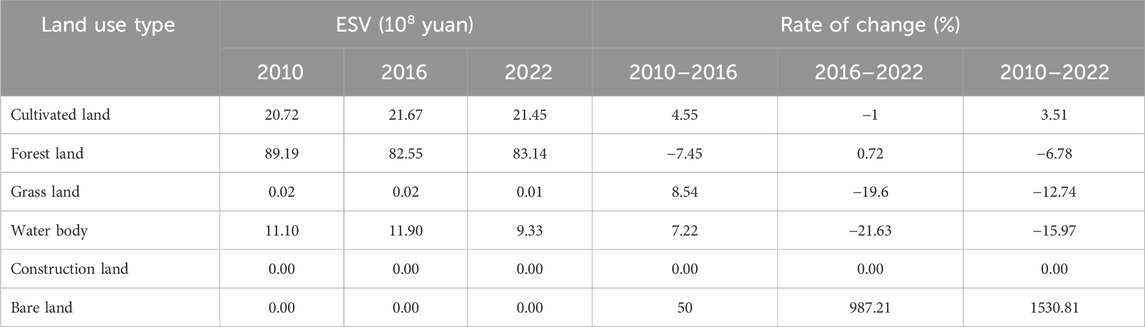
Table 3. ESV and its changes of different land use types in Ningxiang City from 2010 to 2022.
The CS values of different periods and different land use types were all less than 1, which indicated that ESV in the study area was inelastic to VC, that is, the adjusted equivalent factor could reasonably evaluate the fluctuation of ESV (Table 4). The CS values of forest land and water area were higher than those for other land use types, indicating that these two land types played a vital role in ecosystem services.
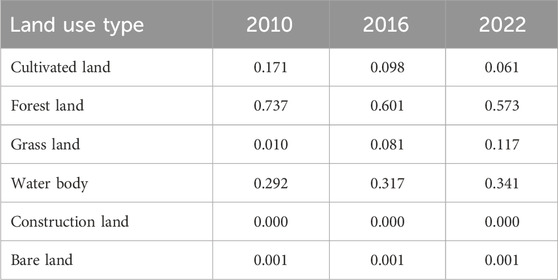
Table 4. Sensitivity test of the revised ESV coefficients in Ningxiang City from 2010 to 2022.
3.2.2 Spatial variation of ESV
Made spatial visualization of ESV based on grid unit and township (street) scale was beneficial to comprehensively and finely capturing more detailed information on spatial distribution characteristics of ESV. ESV was categorized using the natural breaks classification method. At the grid unit scale, the spatial distribution pattern of ESV in Ningxiang City exhibited high in the northwest and low in the northeast, and remained stable during the study period. The low ESV values formed contiguous clusters across the central and northeastern plains, as well as along river areas, primarily characterized by cultivated land and construction land. Conversely, the high ESV values was predominantly clustered in the northwest areas with higher vegetation coverage (Figure 4). 71.9% of the regions showed no obvious variation in ESV, while areas demonstrating a decrement in ESV (21.9%) were significantly higher than those with increased ESV (6.2%).
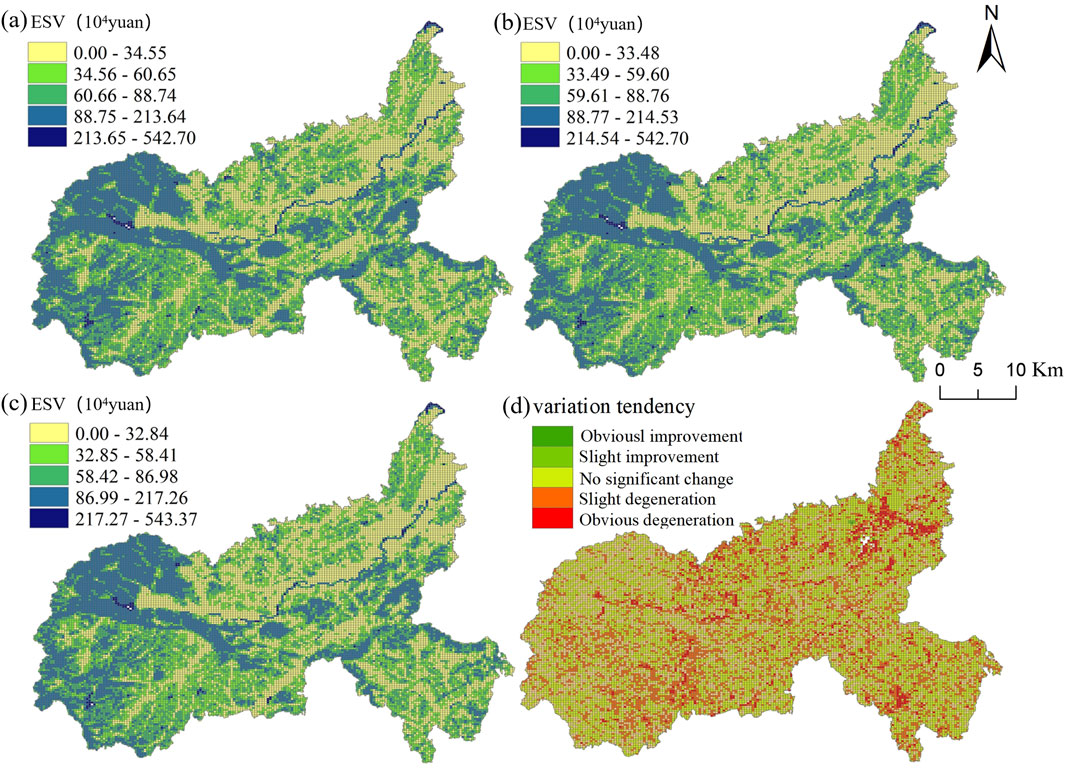
Figure 4. Spatial distribution and change of ESV at the grid unit scale. (a–c) represents ESV for 2010, 2016 and 2022 respectively. (d) The variation tendency of ESV from 2010 to 2022.
At the township (street) scale, Weishan Township possessed the largest unit area ESV in Ningxiang City, followed by Huangcai Town and Longtian Town. Conversely, Chengjiao street and Yutan Street possessed the smallest unit area ESV. Overall, areas with lower ESV were predominantly situated in the main urban area and surrounding townships in the northeast. These areas boast dense populations and more vibrant economies, leading to higher consumption of ESV. Conversely, areas with high ESV were clustered in townships (streets) with substantial forest vegetation cover in the northwest. These areas preserved stable land use pattern and vegetation structure, possessing notable natural environmental advantages (Figure 5). The areas evidencing a significant decline in ESV predominantly localized in areas where urban expansion (notably in Chengjiao streets and baimaqiao Street).
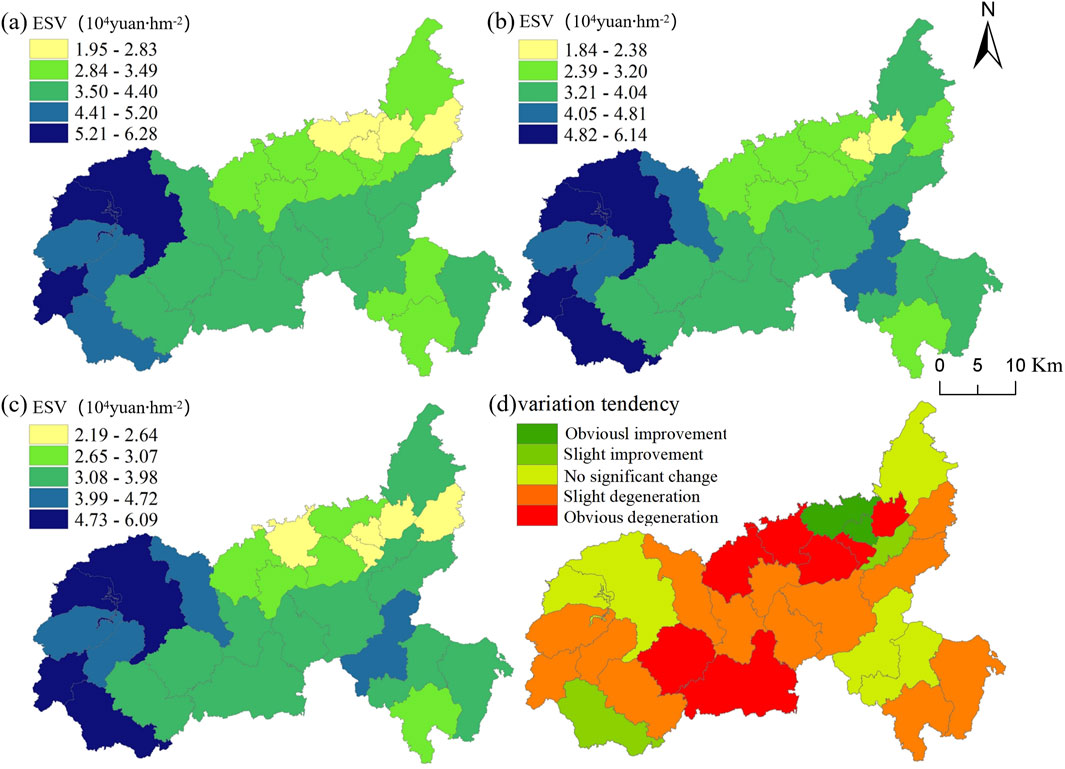
Figure 5. Spatial distribution and change of ESV at the township (street) scale. (a–c) The ESV for 2010, 2016 and 2022 respectively. (d) The variation tendency of ESV from 2010 to 2022.
3.3 ESV spatial autocorrelation analysis
From 2010 to 2022, the Moran’s I values of the ESV in Ningxiang City were 0.568, 0.554 and 0.562 on the grid unit, and 0.679, 0.667 and 0.636 on the township (street) unit, respectively, with all p values of 0, demonstrating that there was a significant spatial agglomeration effect in the spatial distribution of ESV during the research period. The high-high clustering areas of ESV were predominantly distributed in the western mountainous forests, encompassing areas such as Weishan Township, Huangcai Town and Shatian Township. Conversely, the low-low clustering areas of ESV were concentrated in the northeast plains and plain river networks, corresponding to the main urban area and surrounding townships, such as Chengjiao street and Yutan Street. The spatial agglomeration pattern was consistent with the spatial distribution pattern of high and low ESV values, indirectly reflecting the significant difference in the level of green ecological development in the study area (Figure 6). Generally speaking, there was no significant change in the spatial clustering pattern of ESV in the study area, and the uneven distribution of clusters was not improved during the research period. From 2010 to 2016, Xiangzikou Town and Longtian Town in the west shifted from high-high cluster to insignificant cluster, while Coal Mine Dam Town and Jinzhou Town in the east subsequently transformed their insignificant clusters into low-low cluster during 2016–2022. As a result, it showed that the northeast areas continues to face substantial ecological degradation risks.
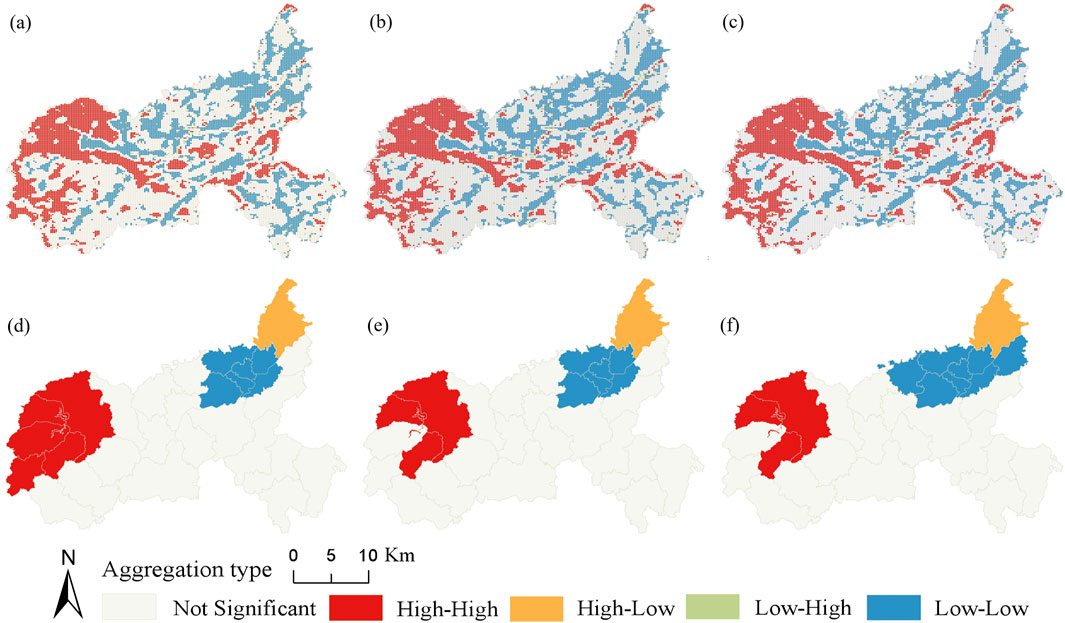
Figure 6. LISA agglomeration map of ESV. (a–c) The spatial clustering distribution of ESV at the grid unit scale for 2010, 2016, and 2022, respectively; (d–f) The spatial clustering distribution of ESV at the township (street) scale for 2010, 2016, and 2022, respectively.
3.4 Analysis of driving force in ESV
Given the relatively large number of factors initially selected, coupled with the varying degrees of influence each factor impose on ESV, this study preliminarily uncovered the influence intensity of these factors through geographic detector and identified the dominant ones. Subsequently, the GWR model was employed to separately analyze the spatial heterogeneity of factors with high explanatory power. Furthermore, considering that administrative divisions are convenient for the management and control of ecological environment protection in practice, combined with the actual situation and decision-making development needs of the research area, our analysis focused exclusively at township (street) scale to analyze the driving factors. Given the insignificant changes in the ESV distribution pattern in the study area over the years, the multi-year mean was adopted to reveal the strength of the driving factors.
3.4.1 Factor detection analysis based on geographic detector
The single factor detection results (Figure 7) showed that soil bulk density and annual average temperature failed the significance test at the p < 0.05 level, indicating a limited influence of these factors on the spatial differentiation of ESV, whereas other factors demonstrated a good explanatory power. The q statistic identified that NDVI as the most influential factor of ESV, with an explanatory power of 58.6%. The explanatory power of HAI, POP and DTR on ESV was 56%, 54.4% and 51.9% respectively, reflecting the significant interference of human activities on the ecological environment.
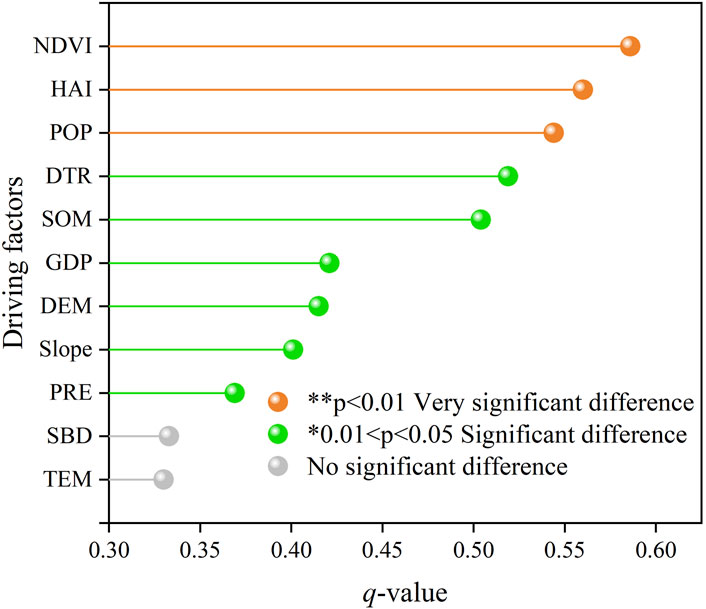
Figure 7. Importance ranking of driving factors of spatial differentiation of ESV in Ningxiang City.
3.4.2 Factor interaction detection analysis based on geographic detector
The interaction detection results of various driving factors showed (Figure 8) that the explanatory power of any pairwise factor superposition for ESV spatial differentiation was greater than that of a single factor, and all exhibited a dual factor enhancement effect, which revealed that the remarkable spatial differentiation of ESV in Ningxiang City was driven by the comprehensive effects of multiple factors. The interaction between HAI and SOM, POP and SOM ranked in the top two, with explanatory power of 95.1% and 94%, respectively. This reflected that the change of soil organic matter content may exacerbate the influence of human activities on the spatial differentiation of ESV by affecting vegetation growth and agricultural production. Furthermore, the explanatory power of NDVI ∩ elevation (82.7%), NDVI ∩ PRE (82.3%), NDVI ∩ SOM (90.8%), and NDVI∩HAI (86%) was significantly enhanced compared with single factor. Although the single factor effect of slope was not prominent, its explanatory power increased substantially when combined with factors such as DEM, PRE, SOM and DTR, implying that areas with steep slopes rely on favorable natural conditions and simple road structures, effectively buffering the interference of human activities on ecosystem service functions.
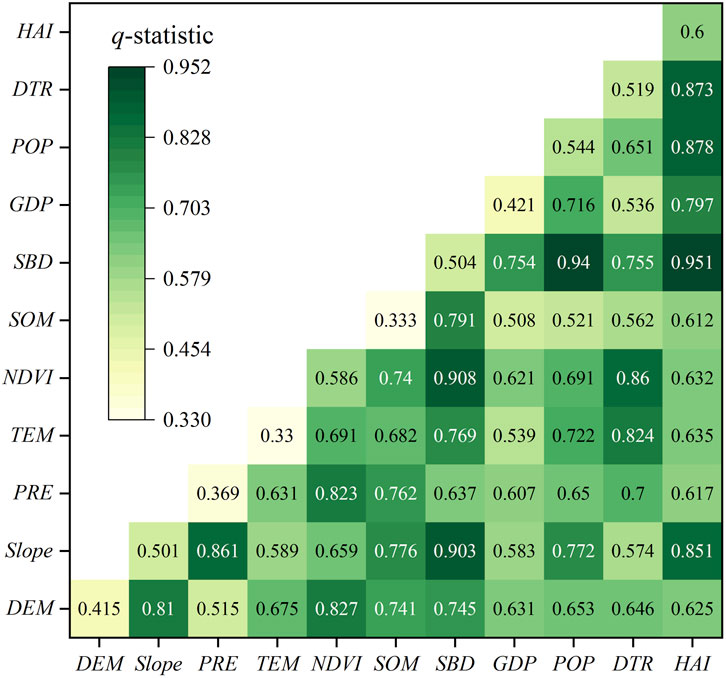
Figure 8. Factor interaction detection results of spatial differentiation of ESV in the study area.
3.4.3 Spatial difference analysis of main drivers of ESV based on GWR model
The geographic detector preliminarily detected the explanatory power of each driving factor, among which NDVI, HAI and POP passed the significance test of p < 0.01, indicating a strong explanatory effect on ESV. Consequently, these three factors were selected as the leading factors for further spatial analysis. To examine their effects, we calculated their regression coefficient and model parameters. As shown in Table 5, the AICc value of GWR model was lower than that of OLS model, and the difference was greater than 3. R2 of GWR model and adjusted R2 were higher than OLS model, with an adjusted R2 of 0.8576, indicating that the fitting effect of GWR was better. Combined with the previous verification, it was reasonable to use GWR model to reveal the spatial heterogeneity of the leading factors of ESV in Ningxiang City.
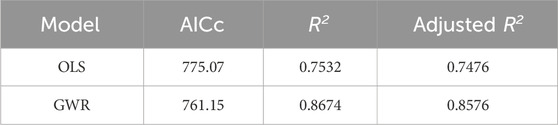
Table 5. Comparison between OLS model and GWR model.
The visualization results of GWR model revealed significant spatial variations in how the selected three driving factors influenced ESV across the study area (Figure 9). The impact of NDVI on ESV exhibited a global positive correlation, and the influence coefficient exhibited a trend of low in the east and high in the west, indicating that the regional ESV in the west of Ningxiang City was more influenced by NDVI. Conversely, HAI maintained a significant global negative correlation with ESV, implying that lower human activity levels correspond to higher ESV. In absolute value, the impact intensity of HAI on ESV gradually declined from east to west, suggesting that anthropogenic pressure near the densely populated eastern main urban area exerted a stronger indirect effect on ESV. Similarly, POP was negatively correlated with ESV globally, with its influence coefficient peaking in the east and diminishing towards the west. This reflected the profound impact of high population density in the eastern main urban area of Ningxiang City and its surrounding areas, where intense human pressure leads to greater ecosystem degradation compared to the west.
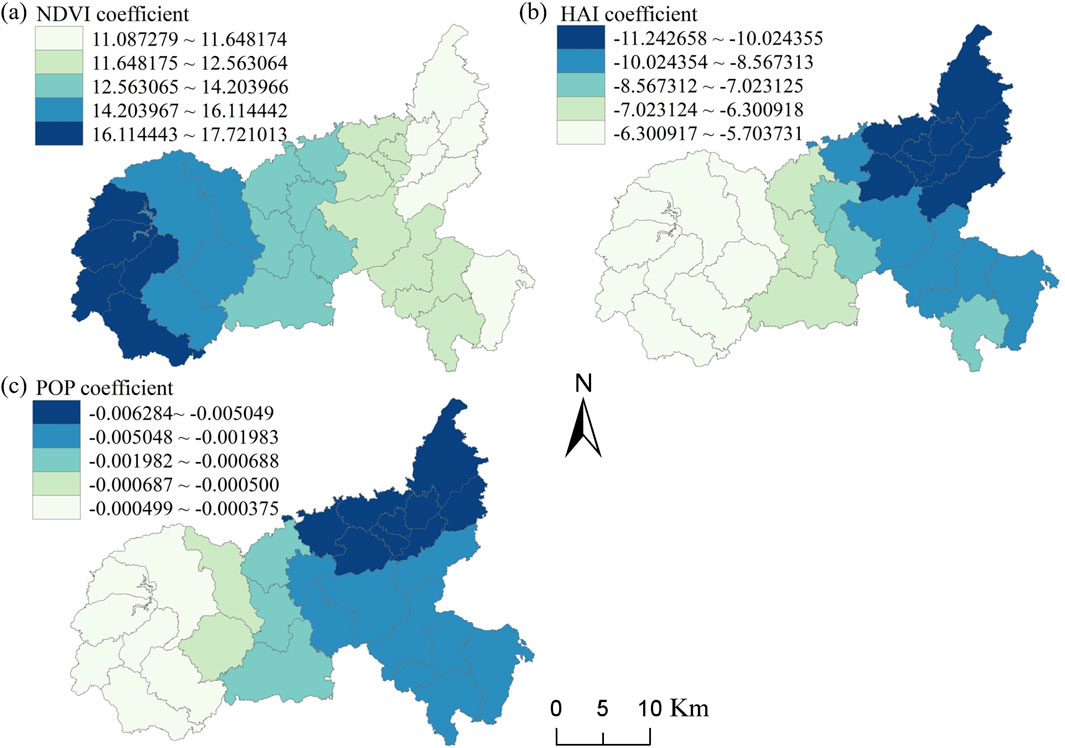
Figure 9. Spatial heterogeneity of ESV dominant factors in Ningxiang City. (a) NDVI; (b) HAI; (c) POP.
4 Discussion
4.1 Response of ESV variation and land use change
Land use change affects the main ecological processes of the ecosystems, such as energy exchange, the water cycle, soil erosion and accumulation, and the biogeochemical cycle (Ye et al., 2018; Liu et al., 2019), thus intervening ecosystem services. From 2010 to 2022, the total ESV of Ningxiang City exhibited a downward trend, aligning with the gradual decline in ESV observed in the Chang-Zhu-Tan urban agglomeration (Huang et al., 2024). Essentially, this reflects a profound reshaping of ecosystem functions through land use reconstruction amidst rapid urbanization. Driven by the economic momentum of the Chang-Zhu-Tan urban agglomeration, the land use pattern of Ningxiang City is undergoing a phase of growth oriented destruction. Specifically, over the past 12 years, accelerating urbanization and agricultural development had led to the transformation of large-scale ecological land into construction land and cultivated land, resulting in a continuous shrinkage of ecological land areas (such as forest land, water body and grassland). These conversions mainly took place in areas where human activities were concentrated. However, construction land, generating almost no contribution to ESV compared to other land types, undoubtedly acts as an important factor of ESV reduction regardless of its conversion source (Rao et al., 2018; Luo et al., 2020).
The regulation services contributed the most to ESV, which was generally consistent with the trends in ESV changes across the country (Liu Y. B. et al., 2020; Zheng et al., 2020). The regulating service function were chiefly supplied by water body and forest land. Although the water area in the study area was not prominent, its high ESV coefficient represented its powerful hydrological regulation function. Thus, the slight loss of water areas directly resulted in a significant degradation in ESV. Forest land provided the vastest contribution to the regional ESV due to its powerful functions of hydrological regulation and climate regulation, and the shrinkage of forest land resulted in 85.24% of the decrease in ESV. Other studies have also demonstrated the strategic value of forest ecosystems in maintaining ESV (Kindu et al., 2016; Liu Y. B. et al., 2020). Notably, the phase analysis showed a deceleration in ESV decline since 2016. It is found that in the later stage, the forest land area increased, the cultivated land area shrank, and the expansion rate of construction land area slowed down. This is attributed to the requirement of implementing the ecological protection redline in 2015, as well as the implementation of ecological protection projects such as returning farmland to forests and greenbelts construction.
The research results of Ningxiang City reflect the typical phenomenon faced by the counties in the metropolitan hinterland during the process of accelerated economic development, that is, the uncoordinated development between providing economic support and maintaining ecological stability. These counties have a dual advantage in developing traditional agriculture and modern industrial production, usually developing into important industrial and agricultural bases or modern service centres (Tian et al., 2021; An et al., 2023). However, some townships prioritize economic benefits and fail to fully coordinate ecological protection, resulting in significant damage to ecosystem services due to issues such as road expansion, abuse of land, and wastewater discharge. Therefore, it is urgent to promote the enhancement of ESV, and “Green development” and “protection priority” are the premise for future regional development of those counties. It is essential to reasonably control the expansion of construction land and cultivated land, strengthen the protection and restoration of ecological land such as forests and water body. Fundamentally, the core of the intended goal is the balance between economic benefits and ecological benefits in regional development, which delivers an excellent contribution to ecological security.
4.2 Driving factors on the spatial differentiation of ESV
As ESV is a crucial indicator for measuring the quality of regional ecosystems, understanding driving mechanism of ESV is a prerequisite for ecosystem management (Sepehri et al., 2020). The results of the geographical detector confirmed that natural conditions and human activities collectively shaped the spatial differentiation pattern of regional ESV, resulting in significant differences and regional aggregation of the spatial distribution of ESV. The GWR results further unveiled that the impacts of these primary driving factors exhibit non-stationarity in space.
The NDVI was identified as the dominant factor, which was consistent with existing studies on driving forces of ecosystem services (Wen et al., 2022; Duan et al., 2024). NDVI serves as an indicator of vegetation coverage, which forms the foundation of ecosystem services (Hu et al., 2021). Ningxiang city boasts abundant forest resources due to its unique geographical conditions. Particularly, in the northwest, the high hills and steep slopes, fertile soil, and abundant rainfall create comprehensive habitat conditions conducive to the growth of dense vegetation. Under this multi-factor synergy mechanism, an important ecological basis for maintaining ESV has been formed.
HAI and POP, frequently corresponding to human influence, accelerate the spatial differentiation of regional ESV. The central and northeast plains, as well as the areas along the river, provide optimal conditions for human production activities due to their flat terrain and convenient irrigation (Liu Y. L. et al., 2020). Under the economic radiation of the urban agglomeration, the main urban area in the northeast attracts population concentration and large-scale operations. High-intensity land development directly drives the expansion of construction land and increased consumption of natural resources. Coupled with negative impacts such as vegetation destruction and soil fertility decline, this further poses a risk of ESV degradation (Wang et al., 2024). Relatively speaking, county edges and rural areas have relatively sparse populations, less development, and a relatively intact ecological structure. ESV in these areas is relatively high, but the development gap with the core urban areas is large. Evidently, the spatial imbalance of ESV, to some extent, inversely hinders the coordinated integration and sustainable development between the core and peripheral regions. This situation is typical of counties in the metropolitan hinterland.
Overall, this study further validates the perspectives of other research demonstrating that both natural and anthropogenic disturbance factors synergistically affect ecosystem service functions, with anthropogenic disturbance often generating a more immediate and significant impact on ecosystems in the short to medium term (Shao et al., 2022), which has always been a concerning phenomenon. Therefore, it is suggested to adopt the principle of zoning governance and differentiated coordinated regulation to achieve the systematic improvement of regional ESV. In the northeast, efforts should prioritize reducing human disturbance, implementing strategic population planning, and optimizing industrial layout. While in the northwest, it is crucial to focus on protecting existing vegetation resources and proactively establishing and enforcing ecological compensation policies. In summary, the paramount objective is to enhance the ecological environment and foster sustainable development within the county.
4.3 Limitation and further research
The revised equivalent coefficient of ESV per unit area was adopted to estimate regional ESV, which effectively improved the precision of the evaluation. Nevertheless, there is an inevitable gap between the estimated ESV and its actual value by relying on expert decision-making and existing knowledge. In addition, this method assumes homogeneity in value of each ecosystem service provided by each land use across the study area. In fact, value of the same ecosystem service will vary spatially due to the unique geographical characteristics of cities, such as terrain, climate and hydrology (Ye et al., 2018). To accurately reflect these regional differences, it is recommended to utilize data such as net primary productivity (NPP) and precipitation to refine the spatio-temporal coefficients of ecosystem service value (Li W. et al., 2024). Importantly, further research is urgently needed to construct a more refined and regionally targeted ESV assessment model to eliminate these impacts. Lastly, considering that policy factors are difficult to quantify, this study did not add policy factors to the driving layer for analysis. Therefore, in future research, it is considered to quantify policy indicators by attempting to construct policy intensity indices, differentiated policy zoning, and other methods, and incorporate them into the driving factor indicator system.
5 Conclusion
Based on three-phase land use data from 2010 to 2022, this study quantitatively evaluated the spatiotemporal variation of ESV in Ningxiang City. The driving mechanism behinds these variations was unveiled from the perspectives of natural and socio-economic factors by combining geographic detector and GWR model. The following conclusions were drawn:
1. During 2010–2022, ESV demonstrated a persistent downward trend, primarily due to the shrinkage of ecological land (such as forest land, water body and grassland) driven by accelerated urbanization and agricultural expansion. Hydrological regulation and climate regulation contributed most significantly to the total ESV loss.
2. At both the grid unit and township (street) spatial scales, ESV demonstrated a northwest-high-northeast-low distribution pattern with significant spatial clustering effects. The strengthening of low-value clustering in the northeast after 2016 indicated an elevated risk of ecological degradation.
3. The spatial differentiation of ESV was shaped by the synergistic effects of natural and socio-economic driving factors. NDVI was the primary driving factor for ESV spatial differentiation, with a more pronounced positive impact on ESV in the west compared to the east. This is followed by HAI and POP, with negative impacts on ESV demonstrating a decreasing trend from east to west.
The decline in ESV within the study area exemplifies the classic conflict between economic growth and ecological sustainability in counties in the metropolitan hinterland. The research results provide theoretical support for land use planning and ecological governance in these counties.
Data availability statement
The raw data supporting the conclusions of this article will be made available by the authors, without undue reservation.
Author contributions
ZeS: Methodology, Visualization, Writing – original draft. MC: Funding acquisition, Writing – review and editing. HZ: Data curation, Visualization, Writing – original draft. YX: Formal Analysis, Funding acquisition, Visualization, Writing – review and editing. TW: Supervision, Writing – original draft. ZaS: Funding acquisition, Methodology, Supervision, Writing – review and editing.
Funding
The author(s) declare that financial support was received for the research and/or publication of this article. This work was supported by China Geological Survey Project (DD20230515, DD20243178 and DD20220874).
Conflict of interest
The authors declare that the research was conducted in the absence of any commercial or financial relationships that could be construed as a potential conflict of interest.
Conflict of interest
The authors declare that the research was conducted in the absence of any commercial or financial relationships that could be construed as a potential conflict of interest.
Generative AI statement
The author(s) declare that no Generative AI was used in the creation of this manuscript.
Any alternative text (alt text) provided alongside figures in this article has been generated by Frontiers with the support of artificial intelligence and reasonable efforts have been made to ensure accuracy, including review by the authors wherever possible. If you identify any issues, please contact us.
Publisher’s note
All claims expressed in this article are solely those of the authors and do not necessarily represent those of their affiliated organizations, or those of the publisher, the editors and the reviewers. Any product that may be evaluated in this article, or claim that may be made by its manufacturer, is not guaranteed or endorsed by the publisher.
References
An, M., Wu, Y. W., Ouyang, Y. H., Song, M. F., Huang, J., Dong, X. H., et al. (2023). Spatial-temporal evolvement and the contributing factors for the economic potential of ecosystem services in counties situated along a river. J. Nat. Conserv. 75, 126461. doi:10.1016/j.jnc.2023.126461
Arowolo, A. O., Deng, X. Z., Olatunji, O. A., and Obayelu, A. E. (2018). Assessing changes in the value of ecosystem services in response to land-use/land-cover dynamics in Nigeria. Sci. Total Environ. 636, 597–609. doi:10.1016/j.scitotenv.2018.04.277
Cetin, N. I., Bourget, G., and Tezer, A. (2021). Travel-cost method for assessing the monetary value of recreational services in the Ömerli Catchment. Ecol. Econ. 190, 107192. doi:10.1016/j.ecolecon.2021.107192
Chen, S. R., Feng, Y. J., Tong, X. H., Liu, S., Xie, H., Gao, C., et al. (2020). Modeling esv losses caused by urban expansion using cellular automata and geographically weighted regression. Sci. Total Environ. 712, 136509. doi:10.1016/j.scitotenv.2020.136509
Chen, W., Zhang, X. P., and Huang, Y. S. (2021). Spatial and temporal changes in ecosystem service values in karst areas in southwestern China based on land use changes. Environ. Sci. Pollut. Res. 28, 45724–45738. doi:10.1007/s11356-021-13915-5
Costanza, R., D'Arge, R., de Groot, R., Farber, S., Grasso, M., Hannon, B., et al. (1997). The value of the world's ecosystem services and natural capital. Nature 387, 253–260. doi:10.1038/387253a0
Costanza, R., D'Arge, R., de Groot, R., Farber, S., Grasso, M., Hannon, B., et al. (1998). The value of the world's ecosystem services and natural capital. Ecol. Econ. 25, 3–15. doi:10.1016/S0921-8009(98)00020-2
Costanza, R., de Groot, R., Sutton, P., van der Ploeg, S., Anderson, S. J., Kubiszewski, I., et al. (2014). Changes in the global value of ecosystem services. Glob. Environ. Change 26, 152–158. doi:10.1016/j.gloenvcha.2014.04.002
Costanza, R., de Groot, R., Braat, L., Kubiszewski, I., Fioramonti, L., Sutton, P., et al. (2017). Twenty years of ecosystem services: how far have we come and how far do we still need to go? Ecosyst. Serv. 28, 1–16. doi:10.1016/j.ecoser.2017.09.008
Ding, Y. T., Zhang, M., Qian, X. Y., Li, C. R., Chen, S., and Wang, W. W. (2019). Using the geographical detector technique to explore the impact of socioeconomic factors on pm2.5 concentrations in China. J. Clean. Prod. 211, 1480–1490. doi:10.1016/j.jclepro.2018.11.159
Duan, L. S., Yang, S. H., Xiang, M. S., Li, W. H., and Li, J. H. (2024). Spatiotemporal evolution and driving factors of ecosystem service value in the upper minjiang river of China. Sci. Rep. 14, 23398. doi:10.1038/s41598-024-74646-4
Gao, Z. B., Wang, X. L., Su, J., Chen, Z. F., Zheng, M. X., Sun, Y. Y., et al. (2018). Ecological compensation of dongjiang river basin based on evaluation of ecosystem service value. J. Ecol. Rural. Environ. 34, 563–570. doi:10.11934/j.issn.1673-4831.2018.06.012
Gashaw, T., Tulu, T., Argaw, M., Worqlul, A. W., Tolessa, T., and Kindu, M. (2018). Estimating the impacts of land use/land cover changes on ecosystem service values: the case of the andassa watershed in the upper blue nile basin of Ethiopia. Ecosyst. Serv. 31, 219–228. doi:10.1016/j.ecoser.2018.05.001
He, Y., Wang, W. H., Chen, Y. D., and Yan, H. W. (2021). Assessing spatio-temporal patterns and driving force of ecosystem service value in the main urban area of guangzhou. Sci. Rep. 11, 3027. doi:10.1038/s41598-021-82497-6
He, C. J., Shao, H. Y., and Xian, W. (2022). Spatiotemporal variation and driving forces analysis of eco-system service values: a case study of sichuan province, China. Int. J. Environ. Res. Public Health 19, 8595. doi:10.3390/ijerph19148595
Hu, X. Q., Li, Z. W., Nie, X. D., Wang, D. Y., Huang, J. Q., Deng, C. X., et al. (2020). Regionalization of soil and water conservation aimed at ecosystem services improvement. Sci. Rep. 10, 3469. doi:10.1038/s41598-020-60100-8
Hu, B. A., Kang, F. F., Han, H. R., Cheng, X. Q., and Li, Z. Z. (2021). Exploring drivers of ecosystem services variation from a geospatial perspective: insights from China's shanxi province. Ecol. Indic. 131, 108188. doi:10.1016/j.ecolind.2021.108188
Hu, Y., He, K. R., Yu, C., Tian, Z. H., Liu, P., and Zhou, M. (2025). Spatio-temporal differentiation and driving factors analysis of ecosystem service value —a case study of changsha-zhuzhou-xiangtan ecological green heart area. Nat. Resour. Econ. China 38, 22–27. doi:10.19676/j.cnki.1672-6995.001195
Huang, X. H., Xie, Y. P., Lei, F., Cao, L., and Zeng, H. B. (2024). Analysis on spatio-temporal evolution and influencing factors of ecosystem service in the changsha-zhuzhou-xiangtan urban agglomeration, China. Front. Environ. Sci. 11, 1334458. doi:10.3389/fenvs.2023.1334458
Kindu, M., Schneider, T., Teketay, D., and Knoke, T. (2016). Changes of ecosystem service values in response to land use/land cover dynamics in munessa–shashemene landscape of the ethiopian highlands. Sci. Total Environ. 547, 137–147. doi:10.1016/j.scitotenv.2015.12.127
Li, T. H., Li, W. K., and Han, Q. Z. (2010). Variations in ecosystem service value in response to land use changes in shenzhen. Ecol. Econ. 69, 1427–1435. doi:10.1016/j.ecolecon.2008.05.018
Li, W. S., Wang, L. Q., Yang, X., Liang, T., Zhang, Q., Liao, X. Y., et al. (2022). Interactive influences of meteorological and socioeconomic factors on ecosystem service values in a river basin with different geomorphic features. Sci. Total Environ. 829, 154595. doi:10.1016/j.scitotenv.2022.154595
Li, C., Qiao, W. F., Gao, B. P., and Chen, Y. (2024a). Unveiling spatial heterogeneity of ecosystem services and their drivers in varied landform types: insights from the sichuan-yunnan ecological barrier area. J. Clean. Prod. 442, 141158. doi:10.1016/j.jclepro.2024.141158
Li, W., Chen, X., Zheng, J. H., Zhang, F. F., Yan, Y., Hai, W. Y., et al. (2024b). A multi-scenario simulation and dynamic assessment of the ecosystem service values in key ecological functional areas: a case study of the sichuan province, China. Land 13, 468. doi:10.3390/land13040468
Liang, F. C., and Liu, L. M. (2011). Quantitative analysis of human disturbance intensity of landscape patterns and preliminary optimization of ecological function regions: acase of minging county in fujian province. Resour. Sci. 33, 1138–1144.
Liao, Q., Li, T., Wang, Q. Y., and Liu, D. (2023). Exploring the ecosystem services bundles and influencing drivers at different scales in southern jiangxi, China. Ecol. Indic. 148, 110089. doi:10.1016/j.ecolind.2023.110089
Liu, H. X., Li, Y. P., and Yu, L. (2019). Urban agglomeration (guangzhou-foshan-zhaoqing) ecosystem management under uncertainty: a factorial fuzzy chance-constrained programming method. Environ. Res. 173, 97–111. doi:10.1016/j.envres.2019.03.018
Liu, Y. B., Hou, X. Y., Li, X. W., Song, B. Y., and Wang, C. (2020a). Assessing and predicting changes in ecosystem service values based on land use/cover change in the bohai rim coastal zone. Ecol. Indic. 111, 106004. doi:10.1016/j.ecolind.2019.106004
Liu, Y. L., Zhang, X. H., Pan, X. Y., Ma, X. X., and Tang, M. Y. (2020b). The spatial integration and coordinated industrial development of urban agglomerations in the yangtze river economic belt, China. Cities 104, 102801. doi:10.1016/j.cities.2020.102801
Liu, Z. T., Wang, S. J., and Fang, C. L. (2023). Spatiotemporal evolution and influencing mechanism of ecosystem service value in the guangdong-Hong Kong-macao greater bay area. J. Geogr. Sci. 33, 1226–1244. doi:10.1007/s11442-023-2127-5
Luo, Q. L., Zhou, J. F., Li, Z. G., and Yu, B. L. (2020). Spatial differences of ecosystem services and their driving factors: a comparation analysis among three urban agglomerations in China's yangtze river economic belt. Sci. Total Environ. 725, 138452. doi:10.1016/j.scitotenv.2020.138452
Pan, N. H., Guan, Q. Y., Wang, Q. Z., Sun, Y. F., Li, H. C., and Ma, Y. R. (2021). Spatial differentiation and driving mechanisms in ecosystem service value of arid region: a case study in the middle and lower reaches of shule river basin, nw China. J. Clean. Prod. 319, 128718. doi:10.1016/j.jclepro.2021.128718
Peng, Y., Wang, C. Y., and Gao, Y. (2021). Impact of land use change on ecosystem service value in changsha city from 1990 to 2018. Geol. Surv. China 8, 72–80. doi:10.19388/j.zgdzdc.2021.03.09
Qiang, X., Dan, H., and Yang, X. (2017). Assessing changes in soil conservation ecosystem services and causal factors in the three gorges reservoir region of China. J. Clean. Prod. 163, S172–S180. doi:10.1016/j.jclepro.2016.09.012
Rao, Y. X., Zhou, M., Ou, G. L., Dai, D. Y., Zhang, L., Zhang, Z., et al. (2018). Integrating ecosystem services value for sustainable land-use management in semi-arid region. J. Clean. Prod. 186, 662–672. doi:10.1016/j.jclepro.2018.03.119
Sannigrahi, S., Chakraborti, S., Joshi, P. K., Keesstra, S., Sen, S., Paul, S. K., et al. (2019). Ecosystem service value assessment of a natural reserve region for strengthening protection and conservation. J. Environ. Manage. 244, 208–227. doi:10.1016/j.jenvman.2019.04.095
Sepehri, A., Sarrafzadeh, M., and Avateffazeli, M. (2020). Interaction between chlorella vulgaris and nitrifying-enriched activated sludge in the treatment of wastewater with low c/n ratio. J. Clean. Prod. 247, 119164. doi:10.1016/j.jclepro.2019.119164
Shang, Y., Wang, D. Y., Liu, S. H., and Li, H. (2022). Spatial-temporal variation and mechanisms causing spatial differentiation of ecosystem services in ecologically fragile regions based on value evaluation: a case study of western jilin, China. Land 11, 629. doi:10.3390/land11050629
Shao, Y. T., Xiao, Y., and Sang, W. G. (2022). Land use trade-offs and synergies based on temporal and spatial patterns of ecosystem services in south China. Ecol. Indic. 143, 109335. doi:10.1016/j.ecolind.2022.109335
Shi, Y., Wang, R. S., Huang, J. L., and Yang, W. R. (2012). An analysis of the spatial and temporal changes in Chinese terrestrial ecosystem service functions. Chin. Sci. Bull. 57, 2120–2131. doi:10.1007/s11434-012-4978-5
Sutton, P. C., Anderson, S. J., Costanza, R., and Kubiszewski, I. (2016). The ecological economics of land degradation: impacts on ecosystem service values. Ecol. Econ. 129, 182–192. doi:10.1016/j.ecolecon.2016.06.016
Tian, P., Wu, H. Q., Yang, T. T., Jiang, F. L., Zhang, W. J., Zhu, Z. L., et al. (2021). Evaluation of urban water ecological civilization: a case study of three urban agglomerations in the yangtze river economic belt, China. Ecol. Indic. 123, 107351. doi:10.1016/j.ecolind.2021.107351
Wang, Z. F., and Tang, G. L. (2021). Coupling of spatial and temporal evolution of land ecosystem service value and tourism urbanization: a case study of chang-zhu-tan urban agglomeration. J. Cent. South Univ. For. Technol. 15, 88–97. doi:10.14067/j.cnki.1673-9272.2021.05.012
Wang, J. F., and Xu, C. D. (2017). Geodetector: principle and prospective. Acta Geogr. Sin. 72, 116–134. doi:10.11821/dlxb201701010
Wang, X. Z., Wu, J. Z., Liu, Y. L., Hai, X. Y., Shanguan, Z. P., and Deng, L. (2022). Driving factors of ecosystem services and their spatiotemporal change assessment based on land use types in the loess plateau. J. Environ. Manage. 311, 114835. doi:10.1016/j.jenvman.2022.114835
Wang, X., Lu, B. B., Li, J. S., Liu, Q. Y., He, L. H., Lv, S. C., et al. (2024). Spatio-temporal analysis of ecological service value driven by land use changes: a case study with danjiangkou, hubei section. Resour. Environ. 15, 100146. doi:10.1016/j.resenv.2023.100146
Wen, Y. L., Li, H. B., Zhang, X. L., and Li, T. Y. (2022). Ecosystem services in jiangsu province: changes in the supply and demand patterns and its influencing factors. Front. Environ. Sci. 10, 931735. doi:10.3389/fenvs.2022.931735
Windle, M. J. S., Rose, G. A., Devillers, R., and Fortin, M. (2010). Exploring spatial non-stationarity of fisheries survey data using geographically weighted regression (gwr): an example from the northwest atlantic. Ices J. Mar. Sci. 67, 145–154. doi:10.1093/icesjms/fsp224
Xie, G. D., Zhen, L., Lu, C. X., Xiao, Y., and Chen, C. (2008). Expert knowledge based valuation method of ecosystem services in China. J. Nat. Resour. 23, 911–919. doi:10.3724/SP.J.1011.2008.00482
Xie, G. D., Zhang, C. X., Zhang, L. M., Chen, W. H., and Li, S. M. (2015). Improvement of the evaluation method for ecosystem servicevalue based on per unit area. J. Nat. Resour. 30, 911–919. doi:10.11849/zrzyxb.2015.08.001
Yan, E. P., Lin, H., Wang, G. X., and Xia, C. Z. (2014). Analysis of evolution and driving force of ecosystem service values in the three gorges reservoir region during 1990—2011. Acta Ecol. Sin. 34, 5962–5973. doi:10.5846/stxb201312263032
Yang, X., and Liu, X. Z. (2022). Carbon conduction effect and temporal-spatial difference caused by land type transfer in chang-zhu-tan urban agglomeration from 1995 to 2018. Acta Ecol. Sin. 42, 338–347. doi:10.1016/j.chnaes.2022.02.004
Ye, Y. Q., Bryan, B. A., Zhang, J., Connor, J. D., Chen, L. L., Qin, Z., et al. (2018). Changes in land-use and ecosystem services in the guangzhou-foshan metropolitan area, China from 1990 to 2010: implications for sustainability under rapid urbanization. Ecol. Indic. 93, 930–941. doi:10.1016/j.ecolind.2018.05.031
Zhang, Z. M., and Gao, J. F. (2015). Linking landscape structures and ecosystem service value using multivariate regression analysis: a case study of the chaohu lake basin, China. Environ. Earth Sci. 75, 3. doi:10.1007/s12665-015-4862-0
Zhang, D., Ni, J. W., and Wang, S. R. (2020). A practical framework for national park management and protection in China: a case study of nanshan national park system pilot area. Int. J. Geoheritage Parks 8, 250–254. doi:10.1016/j.ijgeop.2020.11.001
Zhang, S., Wang, Y., Xu, W. Z., Sheng, Z. Y., Zhu, Z., and Hou, Y. F. (2023). Analysis of spatial and temporal variability of ecosystem service values and their spatial correlation in xinjiang, China. Remote Sens. 15, 4861. doi:10.3390/rs15194861
Zhao, T. Q., Ouyang, Z. Y., Wang, X. K., Miao, H., and Wei, Y. C. (2003). Ecosystem services and their valuation of terrestrial surface water system in China. J. Nat. Resour. 18, 443–452. doi:10.1007/s11769-003-0044-1
Zhao, X. C., Tian, Y. D., and Zhang, X. X. (2023). Spatio-temporal relationship between land use carbon emissions and ecosystem service value in changzhutan urban agglomeration. J. Soil Water Conserv. 37, 215–225. doi:10.13870/j.cnki.stbcxb.2023.05.026
Zheng, D. F., Wang, Y. H., Hao, S., Xu, W. J., Lv, L. T., and Yu, S. (2020). Spatial-temporal variation and tradeoffs/synergies analysis on multiple ecosystem services: a case study in the three-river headwaters region of China. Ecol. Indic. 116, 106494. doi:10.1016/j.ecolind.2020.106494
Keywords: ecosystem service value (ESV), , spatial-temporal variation, driving factors, geographical detector, GWR model
Citation: Song Z, Chen M, Zhou H, Xiao Y, Wang T and Shi Z (2025) Evaluation of ecosystem service value based on land use change and analysis of driving forces in Ningxiang City, a representative county in the metropolitan hinterland in Hunan Province, China. Front. Environ. Sci. 13:1672389. doi: 10.3389/fenvs.2025.1672389
Received: 28 July 2025; Accepted: 09 September 2025;
Published: 23 September 2025.
Edited by:
Sérgio António Neves Lousada, University of Madeira, PortugalReviewed by:
Xiaoyan Song, Northwest A&F University, ChinaLei Li, Sophia University, Japan
Wei Li, Xinjiang University, China
Madhab Rijal, Mid-West University, Nepal
Copyright © 2025 Song, Chen, Zhou, Xiao, Wang and Shi. This is an open-access article distributed under the terms of the Creative Commons Attribution License (CC BY). The use, distribution or reproduction in other forums is permitted, provided the original author(s) and the copyright owner(s) are credited and that the original publication in this journal is cited, in accordance with accepted academic practice. No use, distribution or reproduction is permitted which does not comply with these terms.
*Correspondence: Yuexin Xiao, NTI5MTIzNjA5QHFxLmNvbQ==; Zhao Shi, c2hpemhhbzE5OTFAZm94bWFpbC5jb20=