 Lijuan Li
 Yudi Han
 Yilin Chen
- 1School of Economics, Dongbei University of Finance and Economics, Dalian, China
- 2School of International Economics and Trade, Jilin University of Finance and Economics, Changchun, China
- 3School of Economics, Ocean University of China, Qingdao, China
Introduction: As China advances its dual carbon targets, the carbon market has become a key policy instrument. However, climate policy uncertainty (CPU) can disrupt expectations and amplify risks in carbon trading prices (CTP), creating challenges for market stability and policy effectiveness.
Methods: To address this issue, this study constructs a weekly China-specific CPU (CCPU) index using text analysis of domestic newspapers and employs the Quantile Vector Autoregression–Diebold-Yilmaz (QVAR-DY) framework to assess its spillover effects on returns and volatility across six regional carbon markets. The quantile Granger-causality test is also applied to further validate the direction and significance of spillovers under different market conditions.
Results: The analysis shows that spillovers remain moderate under normal conditions but intensify considerably under extreme states, particularly at higher quantiles, as confirmed by the quantile Granger-causality tests. The most striking finding is that spillovers from CCPU to volatility are consistently stronger than to returns, indicating that systemic risk contagion is more pronounced through volatility channels.
Discussion: By integrating a quantile perspective with dynamic spillover analysis, this study reveals the asymmetric transmission of policy uncertainty in China’s carbon markets and provides new insights for risk monitoring and policy design in the low-carbon transition.
1 Introduction
Climate change poses serious challenges to sustainable development. Rising sea levels and global warming are already leaving their mark (Flori et al., 2021; Lee et al., 2022). Governments have responded with measures such as the Paris Agreement, national carbon reduction targets and regular climate conferences (Chen et al., 2022). Yet when the timing, scope or stringency of these policies fails to match market expectations, it creates climate policy uncertainty (CPU) (Gavriilidis, 2021; Schubert and Smulders, 2019). CPU represents a key form of climate transition risk. Climate risk is generally divided into physical risk, stemming from direct climate impacts such as extreme weather, and transition risk, arising from policy, technological (Bolton and Kacperczyk, 2023) and market adjustments in the low-carbon shift (Fried et al., 2022). Carbon risk constitutes a central dimension of transition risk, as firms or markets with higher carbon exposure are more vulnerable to policy tightening and carbon pricing (Sun et al., 2025). CPU matters because it captures the unpredictability of climate rules. Uncertainty about policy direction can trigger sharp price adjustments, cause spillovers across markets (Chen et al., 2025a) and amplify systemic risk (Bolton and Kacperczyk, 2021). These effects are especially visible during major events (Chen et al., 2025b). For example, the US withdrawal from the Paris Agreement and the introduction of new vehicle emission standards both pushed up crude oil price volatility (Wang et al., 2023). Cases like this show that CPU, as a manifestation of carbon-transition risk, spreads through multiple channels and often produces nonlinear, state-dependent effects on carbon trading prices (Yan and Cheung, 2023).
Existing research highlights the critical role of climate policies in mitigating climate change (Beck et al., 2023; Fan and Todorova, 2017; Weitzel et al., 2023). However, when policy uncertainty increases, it can weaken their effectiveness and even trigger carbon market failures (Ren et al., 2023; Wen et al., 2022). For instance, overemphasis on emission reduction goals may distort market dynamics, as firms might be locked into irreversible investments that limit the flexibility of carbon trading prices (CTP). Fluctuating CTP, in turn, can foster speculation and create allowances surpluses, which weakens incentives for clean technology adoption and distorts market supply and demand (Xie et al., 2022). At the same time, such price instability makes it harder for policymakers to design credible and consistent regulations, which further amplifies CPU. Rising CTP also increases the burden on industries, making it more difficult for governments to balance emission targets and policy feasibility—again fueling uncertainty (Tan and Wang, 2017). This bidirectional feedback—where CPU drives CTP volatility and CTP dynamics simultaneously reinforce CPU—highlights the need to study their spillover effects to better understand carbon market stability and effectiveness.
So far, most studies have focused on the European Union Emissions Trading System (EU ETS) (Fan et al., 2017; Su et al., 2024; Ye et al., 2021). Much less is known about developing countries. As the world’s largest carbon emitter, China’s climate policies and carbon market are particularly significant. Since 2013, eight ETS pilots have been established in cities such as Beijing, Shanghai, Hubei and Guangdong. By the end of 2022, these pilots had traded 398 million tons of allowances, with a total value exceeding RMB 10.64 billion. Since the launch of its national ETS in 2021, China has also become the world’s largest carbon market. Although the pilots remain administratively independent, they are tied together through economic linkages and regional disparities (Liu X et al., 2022; Munnings et al., 2016). For example, during the 2015 stock market crash, the CTP in Shanghai fell first and then spread to other pilots (Ji et al., 2018; Wen et al., 2020). A similar chain reaction occurred in 2018 during the Sino-US trade dispute (Yin et al., 2021). These experiences highlight the need to better understand how carbon price movements in one pilot can spill over to others under heightened uncertainty. Uncovering these spillover patterns is essential for evaluating whether local pilots operate in isolation as “information islands” or function as effective “testing grounds” for China’s national market. The findings can directly support the optimization of China’s carbon market and provide valuable lessons for other developing countries to build resilient carbon markets (Dissanayake et al., 2020).
Against this backdrop, this study takes up by examining the spillover effects between CPU and CTP in China’s ETS pilots. Specifically, we ask: How does CPU influence CTP across different pilots? Which markets serve as the main sources of risk? How do shocks spread, and are spillovers asymmetric—particularly under extreme conditions? To answer these questions, we first construct a weekly China-specific CPU (CCPU) index using text analysis of domestic newspaper data. We then employ quantile Granger-causality tests, which show that the relationship between CCPU and CTP dynamics is distribution-dependent and much stronger in the tails than around the mean. Based on these results, we apply a quantile vector autoregression model combined with the Diebold–Yilmaz spillover index (QVAR-DY) to capture the transmission of shocks across CCPU and CTP dynamics of six regional ETS pilots. We further distinguish between high, medium, and low uncertainty regimes and analyse spillovers from both returns and volatility. The results show that spillovers are pronounced in the tails, and that volatility spillovers are more contagious, underscoring the systemic risks associated with policy shocks.
Our work makes three key contributions to the literature. First, we introduce a weekly, China-specific CPU index, which offers a more locally relevant and higher-frequency measure than the widely used monthly US index (Gavriilidis, 2021; Bai et al., 2023; Tedeschi et al., 2024). This improvement enables more accurate and timely analysis of China’s carbon trading markets. Second, while prior studies mainly examined the direct, one-way impact of policy uncertainty on carbon markets (e.g., Song et al., 2018; Wen et al., 2022) or used mean-based frameworks (Guo and Feng, 2021; Chen et al., 2024), we move beyond this by analysing quantile-dependent spillover effects. Extending the Diebold-Yilmaz framework (Diebold and Kamil, 2012; Diebold and Yilmaz, 2014) into a quantile setting, our QVAR-DY approach captures bidirectional, heterogeneous and nonlinear transmission mechanisms, which become especially pronounced under extreme conditions. Third, we adopt a dual perspective on returns and volatility, whereas most existing studies rely on a single dimension. This two-dimensional lens reveals how CCPU affects not only price movements but also systemic risk, providing more nuanced evidence to inform policies that balance price discovery with market stability.
The paper is structured as follows: Section 2 reviews the literature, Section 3 examines the theoretical mechanisms between CPU and CTP, Section 4 introduces the QVAR-DY framework, Section 5 describes the data and CCPU index, Section 6 presents main results, robust test and further discussions, and Section 7 concludes with findings and policy recommendations.
2 Literature review
The carbon ETS, widely implemented in the US and EU, has become a key market-based strategy for reducing CO2 emissions (Anke et al., 2020; Oestreich and Ilias, 2015). China’s ETS pilots started later but have expanded rapidly, driven by rising climate risks and the urgent need to reduce carbon emissions (Hu et al., 2020). Research on ETS markets has grown steadily, covering not only their development, mechanisms and effectiveness (Tang et al., 2016; Zhang et al., 2020), but also the main drivers that shape them. These drivers are usually grouped into two categories: influences from related markets (Dong and Yang, 2024; Guo and Feng, 2021) and the effects of policy changes (Wang et al., 2023).
In terms of the influences from relevant markets, the volatility of energy markets plays a major role in ETS. The dominance of traditional energy sources, especially coal, strongly affects the supply-demand balance for carbon allowances and, in turn, shapes CTP (Wang et al., 2024). Studies on the US and EU ETS (Kim and Koo, 2010; Zhu et al., 2019) highlight coal prices as a key driver, and similar evidence is found in China. Zhang et al. (2017) and Zeng et al. (2017) show that coal price fluctuations can push up CTP in the Beijing pilot. Other energy sources also matter: price changes in crude oil, natural gas (Tan et al., 2020) and renewable energy (Ha et al., 2024) have been shown to influence ETS markets. Beyond energy, financial market volatility also affects CTP. Since stock markets reflect broader economic activity linked tied to energy demand and CO2 emissions, they can transmit shocks to the carbon market (Jiménez-Rodríguez, 2019; Koch et al., 2014). Moreover, Jin et al. (2020) identify the green bond index as a tool to reduce risks in carbon futures, while Su et al. (2023) find that it can have a negative impact during bear markets. In short, carbon prices are closely linked with movements in both energy and financial markets, which directly shape the dynamics of ETS.
In terms of policy changes, uncertainty is a critical factor shaping both carbon emissions and trading, often exerting a stronger influence than market dynamics above, since ETS is fundamentally policy-driven. In China’s emerging ETS pilots, trading behaviour is highly sensitive to regulatory design and policy signals (Fan and Todorova, 2017). Policy shifts can trigger volatility in CTP (Song et al., 2018), while major events or amendments may disrupt price transmission and alter correlations with other markets. Policy uncertainty is commonly divided into EPU and CPU. Research on EPU is extensive (Tiwari et al., 2021; Wang et al., 2022). For example, Benlemlih and Yavaş (2024) provide cross-country evidence, including for China, that higher EPU increases firms’ CO2 emissions. In China’s context, Li et al. (2022) and Wang et al. (2024) show that EPU has asymmetric effects on CTP in ETS pilots. However, as climate policies gain greater prominence, their role is becoming increasingly important. Zeng et al. (2022) demonstrate that CPU surpasses EPU in predicting CTP volatility during high-risk scenarios, underscoring the central role of climate policy in reducing emissions. Other studies also highlight the effects of CPU: Gavriilidis (2021) and Guesmi et al. (2023) show that CPU negatively affects CO2 emissions in the US, while Li and Lin (2013) find that climate policies can drive economic restructuring in China, leading to reductions in both emissions and carbon intensity.
Policy uncertainty not only affect the overall stability of ETS but also directly influences CTP. As the key mechanism balancing allowance supply and demand, CTP are highly sensitive to climate policy, especially emissions-related announcements (Song et al., 2018; Wen et al., 2022). This sensitivity is confirmed by the finding in Ozturk et al. (2022) that climate policy is a major determinant of CTP volatility. Specific events provide further evidence: Dai et al. (2018) argue that the US withdrawal from the Paris Agreement would raise China’s carbon prices, while Xie et al. (2022) show that incorporating climate-related textual variables could enhance carbon price predictions in China.
Although previous studies have explored how climate policy adjustment affect CTP, they often lack a systematic analysis of CPU and its deeper link with carbon prices. For instance, Hoque and Batabyal (2022) show that CPU exerts a negative influence on EU carbon prices at higher quantiles, while Su et al. (2024) find a positive long-term correlation at similar quantiles. In China, the effect of CPU on carbon markets appear even uncertain. Yan and Cheung (2023) report an ambiguous relationship between CPU and China’s carbon price, without considering quantile-specific effects—a critical factor emphasized by Wang et al. (2022)—or the spillover dynamics across ETS pilots. Related research has pointed to these gaps: Li and Wang (2022) detect significant volatility spillovers when carbon prices are high, and Guo and Feng (2021) note that spillover effects differ between returns and volatility. However, existing studies rarely integrate these perspectives to capture the nonlinear and distribution-dependent nature of CPU’s influence, nor do they systematically examine spillovers across China’s multiple ETS pilots, which are closely linked to distinct local economic conditions. To fill this gap, this study applies a QVAR-DY framework to investigate between CCPU and CTP—both returns and volatility—across six major pilots, thereby offering a more integrated understanding of CCPU’s role in China’s carbon markets.
3 Theoretical mechanism
CPU mainly arises from the frequency and instability of policy adjustments, as well as the misalignment with market expectations (Li et al., 2023). Its impact on CTP can be understood through three channels: the macroeconomic environment, market functioning and corporate behaviour. At the macroeconomic level, rising CPU often leads to tighter environmental regulation and changes in the supply of carbon allowances, directly amplifying CTP volatility. At the same time, higher uncertainty is usually associated with restricted credit conditions, which limit production and reduce demand for allowances, thereby curbing price growth (Wang et al., 2023). In terms of market functioning, heightened CPU undermines efficiency and stability (Meng et al., 2023). Frequent policy shifts weaken price discovery and distort capital allocation, while higher risk premia and financial frictions raise the chances of default and investment failure (Dong and Yu, 2024a; Dong and Yu, 2024b). Together, these forces magnify fluctuations in carbon prices. At the corporate level, CPU has a more complex and dual effect. On the one hand, where green financial tools and governance mechanisms help ease financing constraints and reduce risk, CPU may work through the innovation channel to stimulate green technological progress and entrepreneurship (Xu et al., 2025; He et al., 2025). This, in turn, encourages firms to adopt cleaner technologies and renewable energy (Golub et al., 2018), changing the balance between emissions and abatement investment (Bouri, Iqbal, and Klein, 2022). On the other hand, higher CPU raises operational risk, especially for high-emission firms (Zhang et al., 2025). Uncertainty aggravates financing frictions and information asymmetry, making long-term green R&D and low-carbon investment riskier (Su et al., 2024). As a result, firms often adopt a “wait-and-see” strategy (Hoang, 2022), delaying abatement and technological upgrading, which increases allowance demand and drives up CTP. Finally, CPU also affects prices indirectly through energy consumption patterns. When uncertainty coincides with extreme weather events (Ren et al., 2023), surges in electricity and heating demand, if not met by clean energy, intensify reliance on fossil fuels. This leads to higher emissions and adds further upward pressure on prices (Shang et al., 2022; Wen et al., 2022).
Carbon markets, enterprises and governments are integral to achieving sustainable development goals and remain closely interconnected (Wang et al., 2023). The ETS serves as a key policy instrument for reducing emissions, while CTP, as an indicator of market dynamics, has a strong influence on CPU. First, fluctuations in carbon prices directly affect the economic viability of climate policies (Liu S et al., 2022). Rising CTP raise the marginal abatement costs of high-emission firms, compress profit margins, reduce tax revenues, and may even slow economic growth, thereby casting doubt on policy feasibility (Vellachami et al., 2023). Secondly, CTP volatility creates challenges for governments by destabilising policy implementation. When prices are high, firms may question emission reduction targets and push for more lenient rules. Volatility also fuels conflicts of interest between traditional energy sectors and policymakers, which can obstruct policy progress (Liu J et al., 2023). Finally, CTP volatility disrupts industrial restructuring and long-term investment. It erodes investor confidence in clean energy, generates uncertainty around capital allocation, and fosters speculation (Wei et al., 2017). Together, these effects undermine stable policy implementation and hinder the transition to a low-carbon economy.
In addition, China’s ETS began with regional pilots before expanding into a national system. These pilots differ widely due to regional and market characteristics (Guo and Feng, 2021). For instance, Shenzhen and Shanghai, as highly urbanised and industrialised cities, benefit from dense populations, concentrated production and consumption, and mature market environments, which shape their responsiveness and sensitivity to external shocks (Wu et al., 2014). During the initial COVID-19 outbreak in 2020, the economic slowdown caused a sharp fall in Hubei’ CTP, leading to a trading suspension and triggering volatility in other regional markets (Chen et al., 2021). Differences in carbon demand, trading schemes and market liquidity further heighten the risk of spillovers across pilots.
Building on these mechanisms illustrated in Figure 1, CPU can amplify carbon price volatility and influence firms’ investment and abatement behaviour. The heterogeneity of China’s ETS pilots—in terms of demand, trading rules and liquidity—makes such effects more likely to spread across regions. Past shocks, such as the COVID-19 outbreak in Hubei, further suggest that these spillovers become particularly strong under extreme conditions. Based on this reasoning, we propose the following Hypothesis 1:
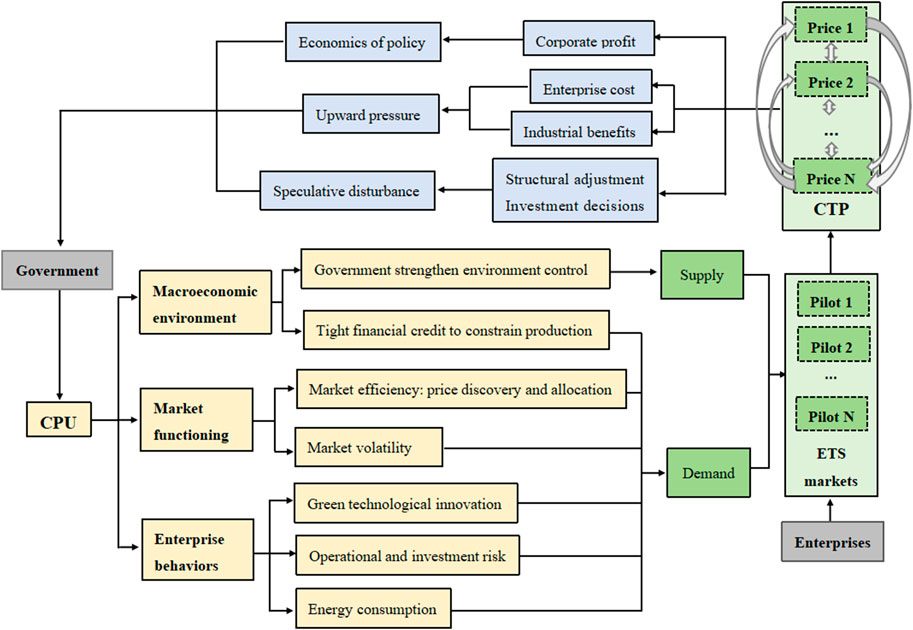
Figure 1. Interaction mechanism between CPU and CTP. The conceptual framework is inspired by Su et al. (2024) but extends their analysis by additionally considering the reverse impact of CTP on CPU. Furthermore, this study explores CPU’s influence on CTP through macroeconomic factors, market functioning and firm behaviour, differing from the three direct transmission channels identified by Su et al. (2024).
Spillover effects exist between CPU and CTP across China’s pilots, and these effects are particularly pronounced under extreme conditions.
4 Connectedness approach of QVAR model
The spillover index proposed by Diebold and Yilmaz (2009) is one of the most widely used approaches for examining dynamic risk transmission across markets. As a statistical measure, it captures how the returns or volatilities of one market are influenced by shocks from others, thereby reflecting the degree of connectedness among markets or variables. In this study, we adopt the QVAR-DY framework recently developed by Ando et al. (2022) to investigate the spillovers between CCPU and CTP under extreme market conditions. Unlike the conventional mean-based framework (Guo and Feng, 2021), the quantile-based approach provides richer insights into tail dependencies and better accounts for the nonlinear and asymmetric nature of risk spillovers. This allows for greater explanatory power in extreme scenarios. We now turn to the details of the model construction.
For an N-dimensional p-order QVAR model, it can be expressed as follows:
where
Using Wold’s theorem, we can express Equation 1 as a vector moving average process, as shown in Equation 2:
where the detailed settings are defined in Equations 3, 4:
where
where
where
The Quantile Total Connectedness (QTC) index measures the total spillover in the system, as defined in Equation 7:
The spillover that variable i transmits to variable j is termed as Quantile Total Directional Connectedness (QTDC) “TO others”:
Similarly, the QTDC “FROM others”, the spillovers that variable i receives from variable j, is quantified as follows:
By Subtracting the two aforementioned measures (Equations 8, 9) from each other, we derive the Quantile Net Total Directional Connectedness (QNTC), as shown in Equation 10, which is interpreted as the net influence that variable i exerts within the network:
A positive QNTC indicates that variable i is a net emitter of shocks to the system, while a negative QNTC suggests that variable i primarily receives shocks from the system.
5 Data and descriptive analysis
The dataset consists of the CCPU index along with the returns and volatility of CTP. The sample spans from 4 April 2014 to 30 June 2023, yielding a total of 483 observations.
5.1 Construction and analysis of CCPU index
Most existing studies examine climate uncertainty in the US (Ardia et al. 2023; Engle et al., 2020), with little attention to the China’s context. To address this gap, we construct a CCPU index using text from three Chinese newspapers: Economic Daily, Guangming Daily and China Environment News. The first two provide broad policy coverage, while the latter focuses on climate and environmental issues. Following Gavriilidis (2021), the index is calculated using the bag-of-words method1 and normalized to an average baseline of 100 to improve interpretability and allow temporal and cross-metric comparisons. Descriptive statistics are reported in Table 1. Results from the augmented Dickey-Fuller (ADF) test confirm the stationarity of the index, supporting its use in vector autoregression (VAR) analysis. The index shows substantial volatility, ranging from 9.267 to 320.503, highlighting the need to focus on the effects of its extreme values.
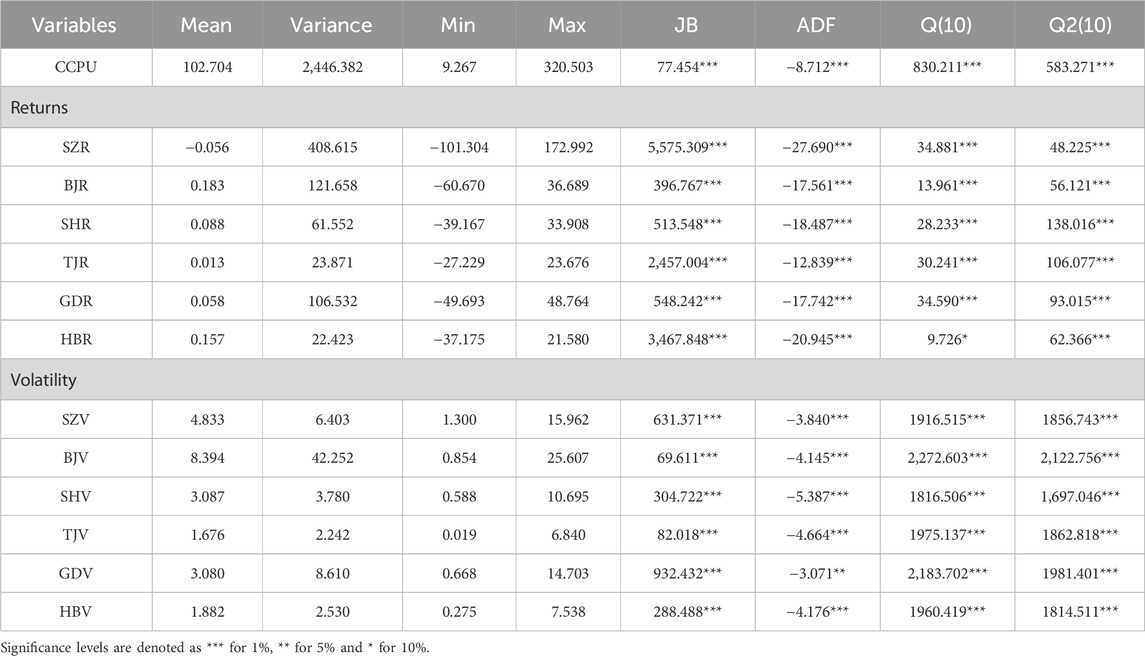
Table 1. Statistics description.
Figure 2 shows the rise and fluctuation of the CCPU, reflecting growing attention to climate action both in China and globally. Using a Markov Switching model (Hamilton, 1989), we identify three phases: a low-fluctuation period (April 2014-June 2018), a stage of moderate increases and fluctuations (July 2018-April 2019), and a phase of sharp rises and significant volatility (May 2020-June 2023).
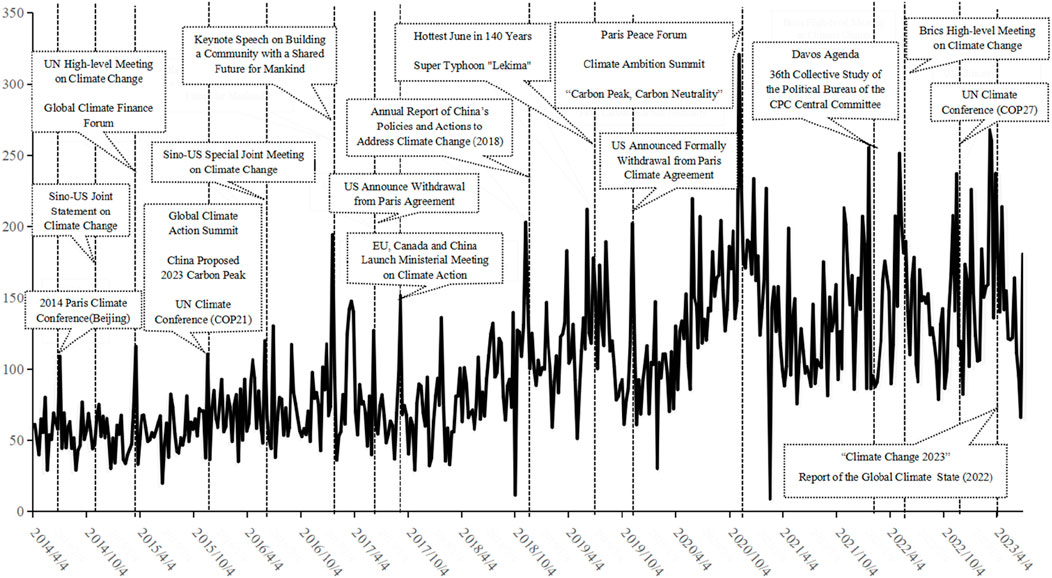
Figure 2. Trend of CCPU index.
In the first phase, the index stayed low with temporary spikes around major events. Notable increases were recorded during the 2014 Paris Climate Conference, the Sino-US Joint Statement on Climate Change, and early 2015 UN and global climate meetings. Volatility continued in 2016 as China pledged to peak carbon emissions by 2030 and participated in COP21. In 2017, the index jumped following the US withdrawal from the Paris Agreement and new climate cooperation initiatives by the EU, Canada and China. The second phase was marked by extreme weather and policy shifts, driving more pronounced fluctuations. In 2018, China’s climate policy report highlighted stronger commitments to environmental governance. In 2019, record heatwaves and Typhoon Lekima push the index higher, while renewed global debates triggered by the US withdrawal from the Paris Agreement sent the CCPU to a peak. The final phase reflects a period of intensified global climate cooperation. China’s 2020 pledge at the Climate Ambition Summit—to peak emissions by 2030 and reach carbon neutrality by 2060—drove the index to record levels. Subsequent reaffirmations at the 2022 Davos Agenda and COP27, combined with the global energy crises and more extreme weather events, further underscored the urgency of strong climate policies and international cooperation.
We compare our CCPU with the UCPU constructed by Gavriilidis (2021), using data aggregated to a monthly scale (Figure 3). The two indices display similar patterns, with noticeable co-movements around major climate events such as the 2014 Sino-US joint statement and the entry into force of the Paris Agreement in 2016. Peaks at the 2021 Climate Ambition Summit and COP26 show a stronger response in the UCPU, while another spike occurred in March 2023 following the release of the IPCC’s Climate Change 2023 report. The correlation coefficient of 0.64 suggests a high degree of synchronization in climate policy focus between China and the US.
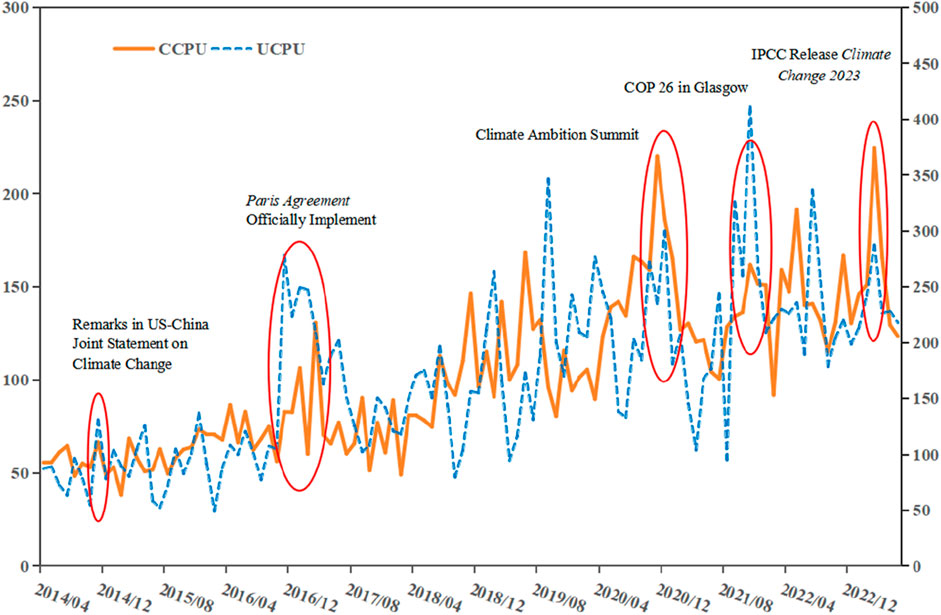
Figure 3. Comparison of CCPU and UCPU.
5.2 Returns and volatility of CTP
To maintain analytical consistency, we focus on six ETS pilots—Shenzhen, Beijing, Tianjin, Guangdong, Hubei and Shanghai—excluding Fujian and Sichuan because of their recent launch and Chongqing due to limited data. Since daily transaction prices are incomplete, we use weekly averages to calculate returns and volatility. Returns are defined as the logarithmic percentage change between consecutive weekly prices and are denoted as SZRt, BJRt, SHRt, GDRt, TJRt and HBRt for Shenzhen, Beijing, Shanghai, Guangdong, Tianjin and Hubei, respectively. Volatility is measured by a 20-week moving standard deviation for each market, represented as SZVt, BJVt, SHVt, GDVt, TJVt and HBVt.
Figure 4 presents the dynamics of CTP returns and volatility. Sharp swings in returns are closely associated with surges in volatility, a pattern typical of financial markets. Regional differences are evident: Shenzhen shows more pronounced fluctuations, while Tianjin and Hubei remain relatively stable. Overall, returns oscillate around zero, whereas volatility tends to cluster over time. Despite some irregularities, strong synchronization appears during high-volatility periods, such as in 2022, when both returns and volatility spiked.
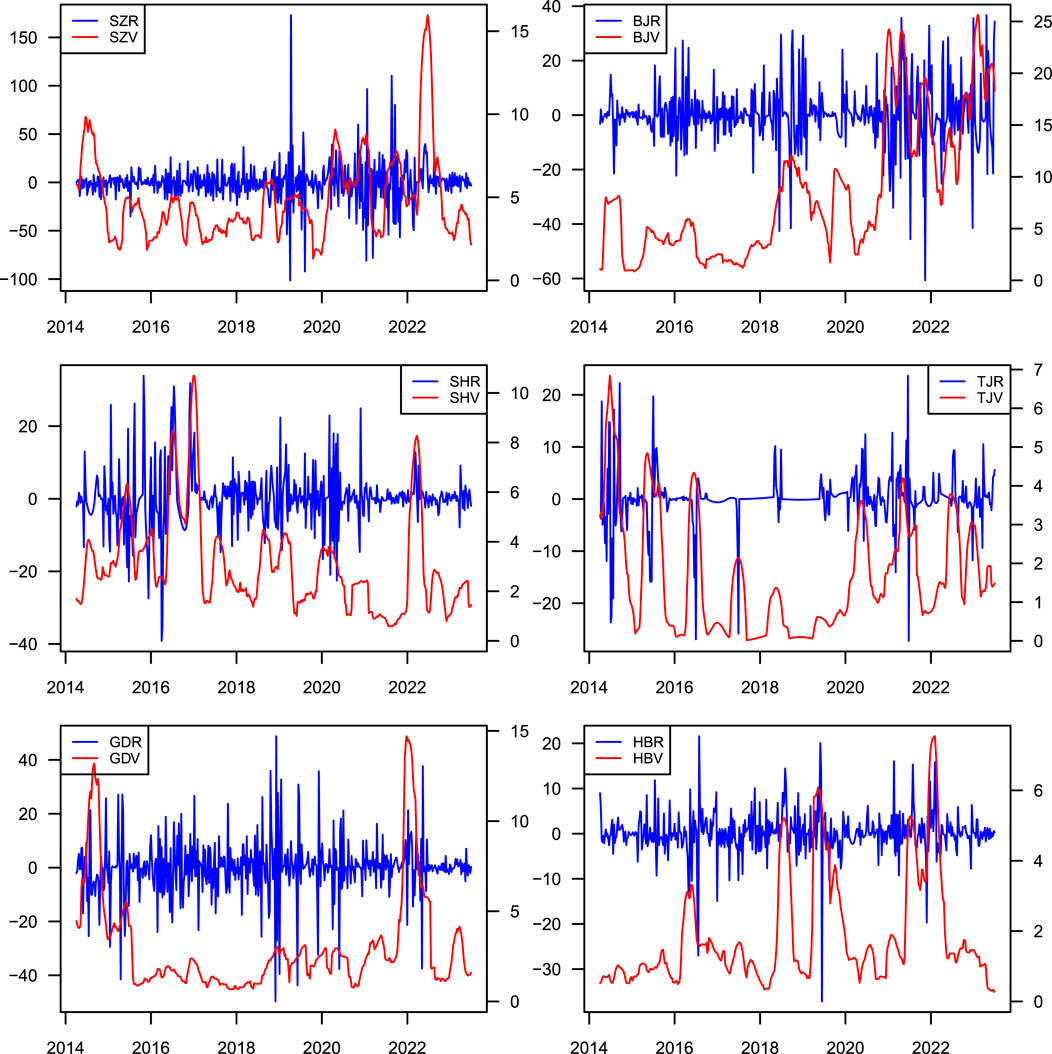
Figure 4. Returns and volatility of CTP in six ETS pilots.
Statistical results in Table 1 show that both returns and volatility are non-normally distributed, as the Jarque-Bera (JB) test rejects the null hypothesis. The ADF test confirms that both series are stationary, supporting their suitability for VAR modelling.
6 Empirical results and discussions
6.1 Spillovers between CCPU and returns
Before looking at the spillover analysis, we start with the standard mean-level Granger-causality test following Granger (1969). The results in Table 2 show that, for most cases, the causal links between CCPU and carbon market returns are weak or insignificant, with only a few exceptions. This suggests that a simple linear approach does not capture the more complex dependencies between CCPU and market dynamics.
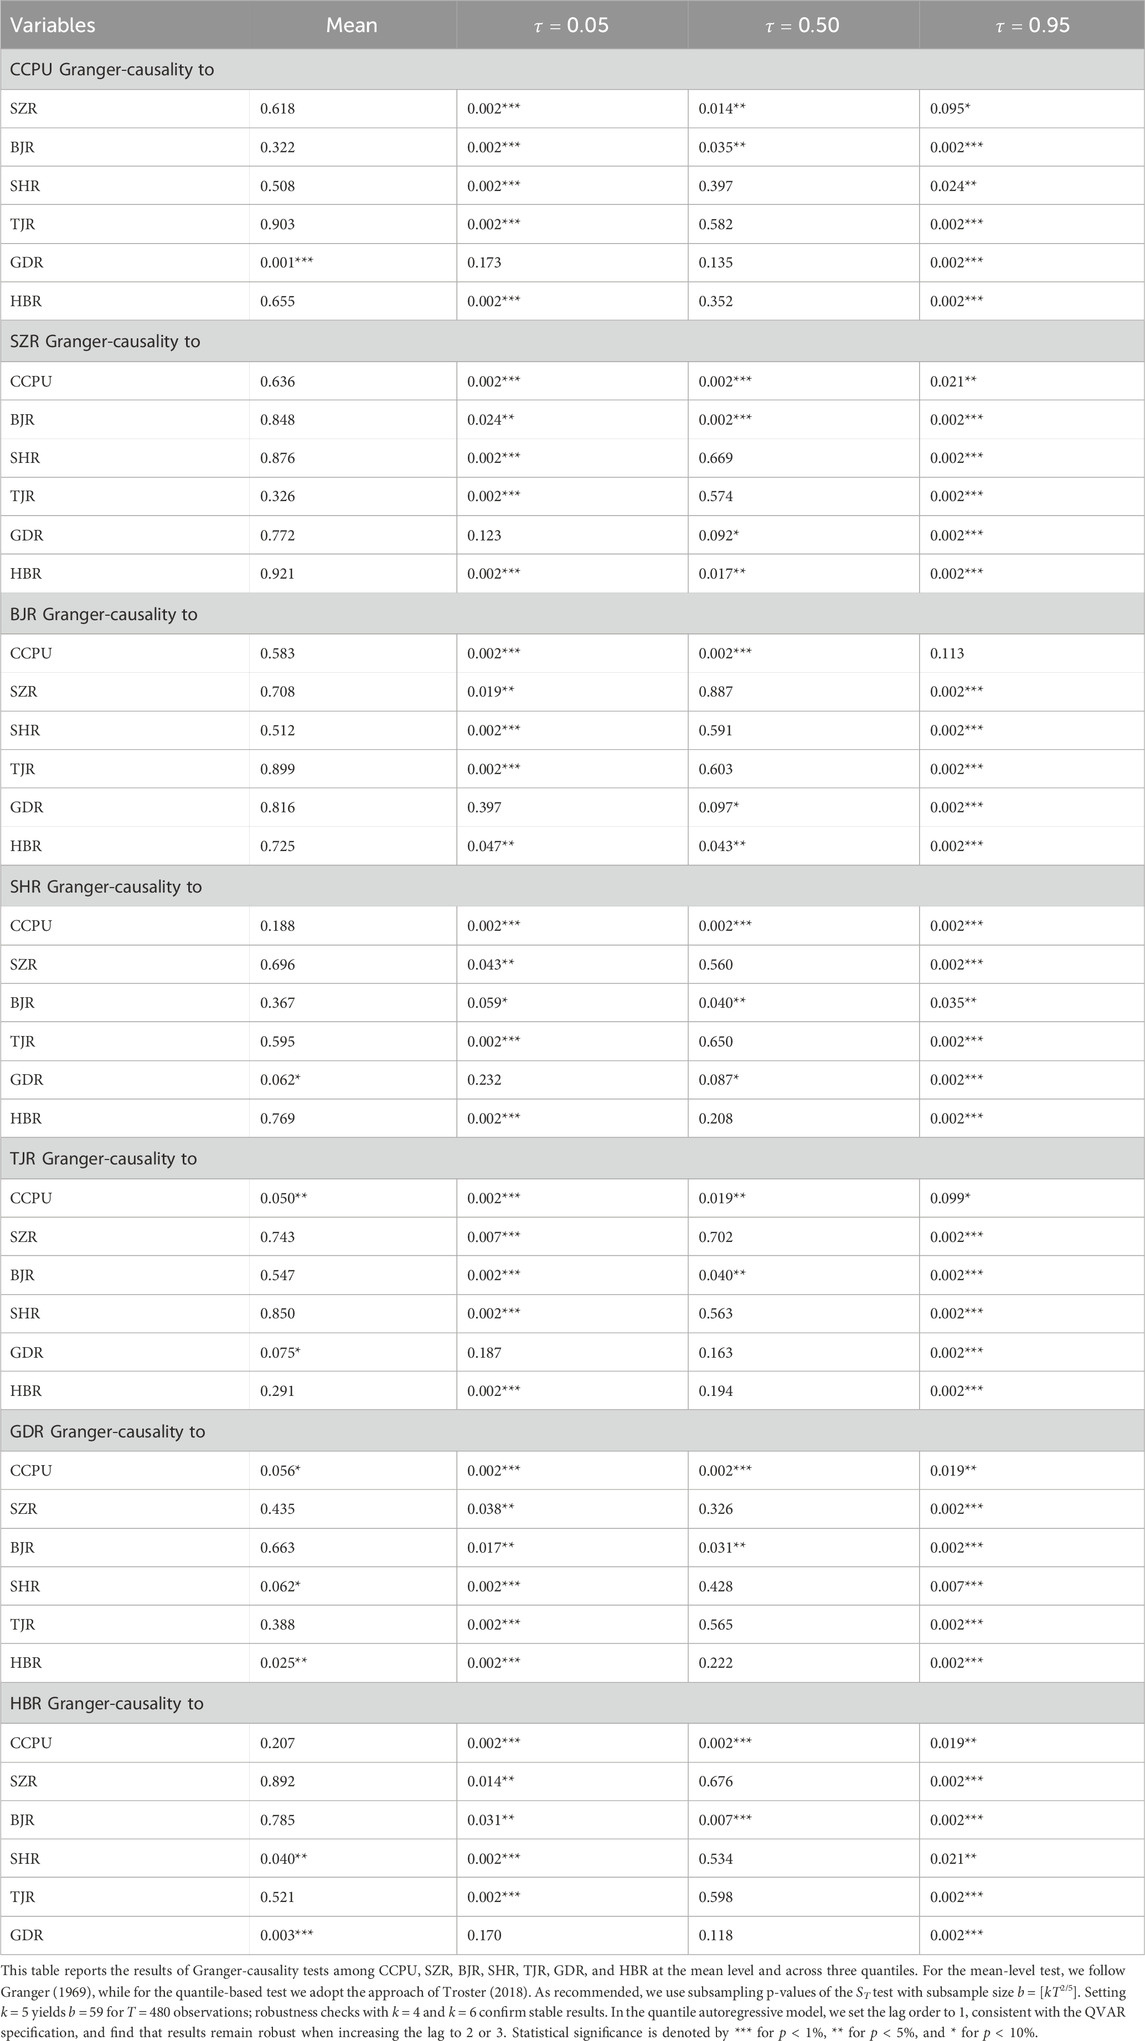
Table 2. Granger-causality test among CCPU and CTP returns.
To dig deeper, we apply the quantile Granger-causality test developed by Troster (2018), which combines a parametric omnibus test with a subsampling procedure. This method is more effective in detecting distributional heterogeneity and tail dependence, and it performs better than Sup-Wald and non-parametric approaches in terms of model specification and small-sample reliability. We look at three representative quantiles—0.05, 0.50 and 0.95—corresponding to lower, median and upper market conditions. The results reveal several key patterns. First, causality is generally absent at the median quantile, suggesting that under normal conditions, CCPU exerts little predictive power over carbon market returns. By contrast, at the lower and upper quantiles, significant causal linkages emerge, highlighting the stronger influence of policy uncertainty in extreme market states. Second, while the Granger causality from carbon market returns to CCPU is present even at the median level in certain markets, the reverse causality—CCPU affecting market returns—mainly appears in the tails, with clear market-specific differences. Third, we observe strong causal connections among the returns of different regional carbon markets, particularly in the tails, suggesting that China’s ETS pilots become more tightly interconnected when markets face stress.
These findings indicate that the relationships are not uniform but distribution-dependent, and that market linkages intensify under extreme conditions. Yet, the Granger-causality framework remains confined to pairwise testing and cannot fully capture the system-wide interactions. To move beyond this, we turn to the QVAR-DY framework, which combines QVAR with the Diebold–Yilmaz spillover approach. Specifically, we use a QVAR (1) model selected by BIC and track dynamic spillovers with a 10-step-ahead forecast error variance decomposition and a 200-week rolling window.
We start with the static connectedness analysis across ETS pilots under a CCPU shock, as reported in Table 3. The results show clear differences across quantiles. At the lower (74.81%) and upper (76.72%) quantiles, the total connectedness index (TCI) is high, while at the median (3.99%) it drops sharply. This gap reflects how, in extreme cases, the impact on the variable itself weakens but spillovers to other markets intensify. Looking at static directional connectedness, we see similar patterns. Under normal conditions, both “FROM others” and “TO others” connectedness remain low, around 5%. In contrast, at the tail these values surge to about 70%, pointing to a much stronger degree of system-wide connectedness. Notably, the “TO others” connectedness of CCPU climbs to 86.35% at the 0.95 quantile, showing its central role in driving connectedness at higher levels. Finally, considering net total directional connectedness (NET), CCPU shows a value of −0.46% at the lower quantile, meaning it mainly absorbs shocks. At the median, the NET stays negative (−1.20%). At the upper quantile, however, the NET rises to 8.80%—the highest among all ETS pilots—showing that CCPU becomes a dominant transmitter of shocks under extreme conditions. Taken together, these results suggest that the CCPU’s spillover effect matter primarily at higher quantiles, where it shifts from being a shock recipient to a leading shock contributor.
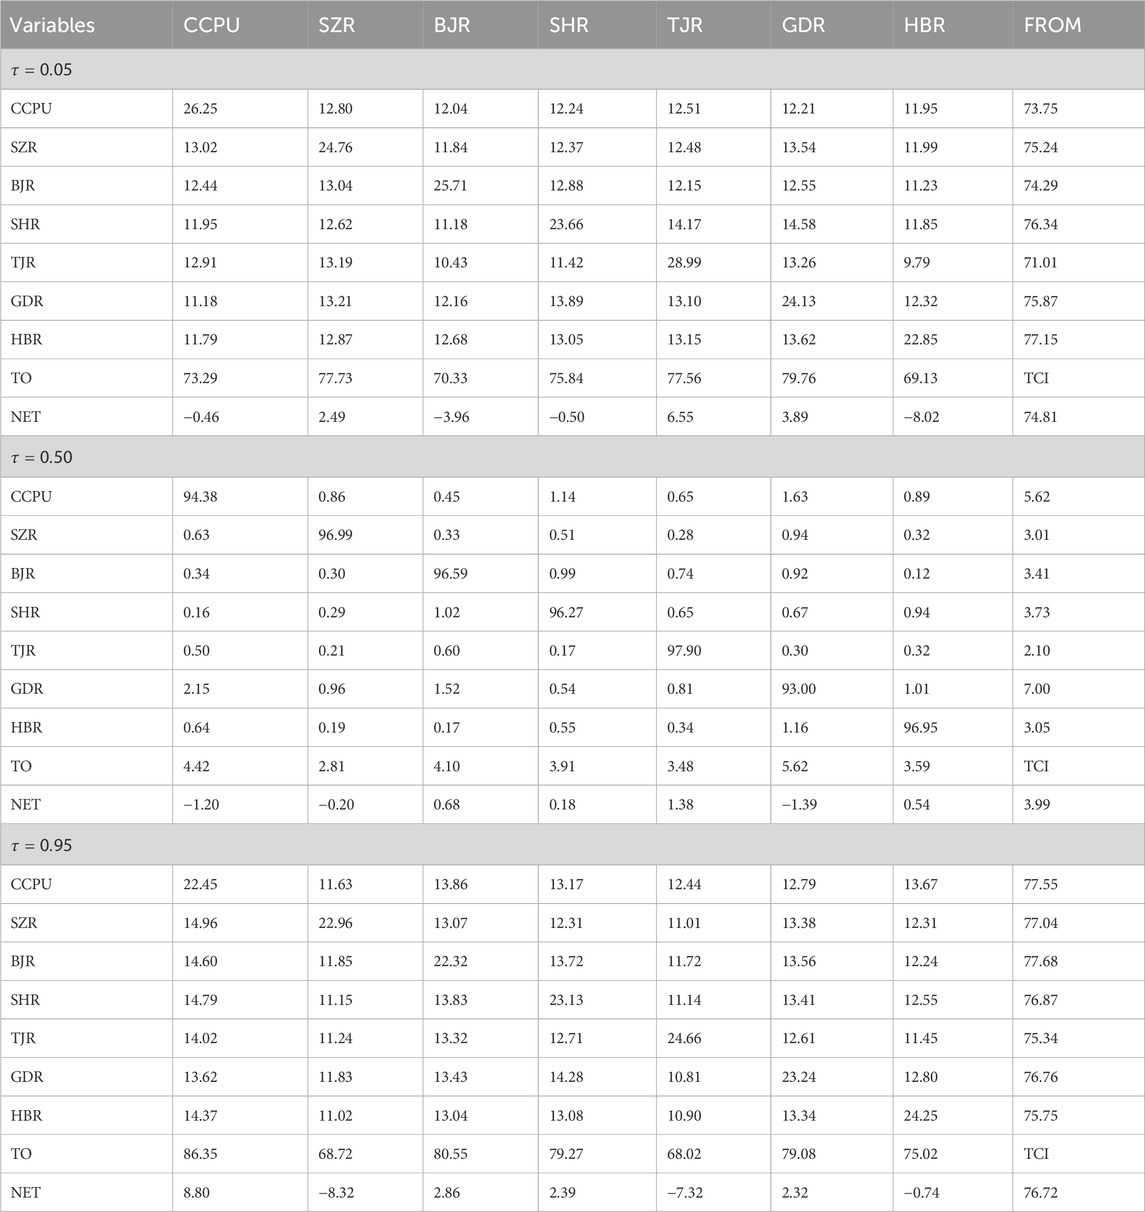
Table 3. Static connectedness between CCPU and returns.
The spillover effects across ETS markets returns show clear heterogeneity. Tianjin displays the largest variation across quantiles, with a NET of 6.55% at the lower quantile, −7.32% at the upper quantile and 1.38% at the median. This reflects its low trading activity, fewer trading days, and a higher incidence of outliers compared with other markets, making it more sensitive to changing conditions (Guo and Feng, 2021). Shenzhen also stands out due to its annual permit listings and differentiated pricing (Xiao et al., 2022). Its NET is −8.32% at the upper quantile, −0.20% at the median and 2.49% at the lower quantile, again showing strong dependence on market conditions. Beijing and Shanghai follow similar patterns, acting as shock transmitters at higher quantiles and recipients at lower quantiles. Their spillovers remain relatively stable, reflecting market maturity (Xiao et al., 2022). Guangdong, supported by its growing trading volume (Li and Wang, 2022), consistently serves as a shock contributor under extreme conditions. Overall, spillovers differ significantly across pilots and quantile, with the most pronounced effects emerging under extreme conditions.
We then turn to the network connectedness analysis in Figure 5, which illustrates connectedness at the lower, median and upper quantiles. In these networks, blue nodes represent net transmitters and yellow nodes represent net recipients of shocks. Node size indicates the magnitude of shocks, while arrows thickness shows the intensity of spillovers. Figure 5a depicts the lower quantile. Here, the CCPU mainly receives shocks from Shanghai, Hubei and Guangdong, while transmitting shocks to Shenzhen, Beijing and Tianjin. Hubei and Tianjin show the highest connectedness, with strong spillovers between them that reinforce overall system linkages. In Figure 5b, under median conditions, the CCPU remains the main shock recipient, absorbing shocks from Beijing, Shanghai, Tianjin, Hubei and Shenzhen, while transmitting only to Guangdong. Tianjin functions solely as a transmitter, whereas other markets both send and receive shocks. Spillovers are weaker overall, reflected in thinner edges between nodes. Figure 5c shows the upper quantile, where the CCPU becomes the dominant transmitter, sending shocks to all ETS markets, especially Shenzhen. As a low-carbon pilot city, Shenzhen is particularly sensitive to air quality concerns (Wen et al., 2022). Beijing, Shanghai and Guangdong also emerge as transmitters, leveraging their economic weight to influence other regions. In summary, network results indicate weak system connectedness at the median, stronger spillovers at the lower quantile, and CCPU’s dominance as a shock transmitter at the upper quantile.
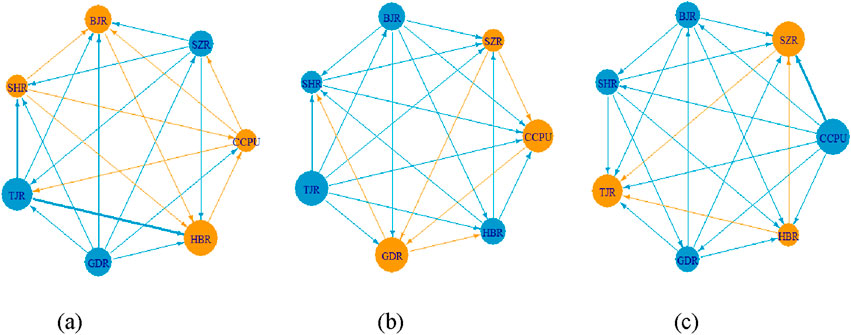
Figure 5. Network between CCPU and returns. (a)
Beyond the static results, we also examine how connectedness evolves over time. Using a rolling window approach, we capture the time-varying connectedness between the CCPU index and EST returns. Figure 6 shows the system’s total dynamic connectedness, where warmer colours indicate higher levels of connectedness. From a quantile perspective, a clear pattern emerges: connectedness is weaker around the median but stronger in the upper and lower 20% quantiles, echoing the earlier static analysis. Over time, connectedness peaks during periods of large return fluctuations or sharp rises in the CCPU index—for instance, in 2020 when China actively advanced the “dual carbon” goals, and in 2019 when Guangdong and Beijing experienced pronounced volatility. Taken together, these findings suggest that total system connectedness both intensifies under extreme conditions and shifts with market events.
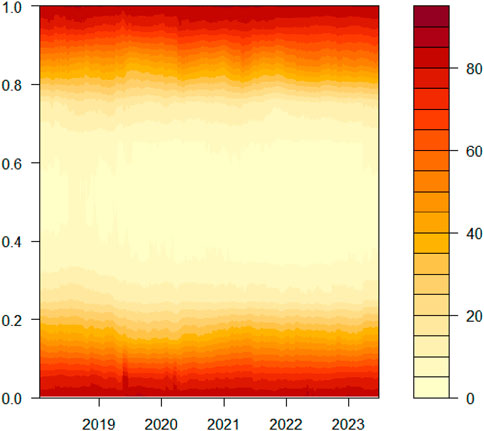
Figure 6. Dynamic total connectedness of CCPU index and returns.
Figure 7 further illustrates the net time-varying connectedness (NET), where blue denotes shock recipients and red indicate shock transmitters, with darker shades reflecting stronger spillovers. The net directional connectedness of the ETS markets shows complex and shifting spillover patterns across quantiles and over time. By contrast, the CCPU displays more evident spillover effects at tails than at the median, confirming its greater influence under extreme conditions. In the following section, we examine these time-varying spillovers in greater details at low, medium and high quantiles.
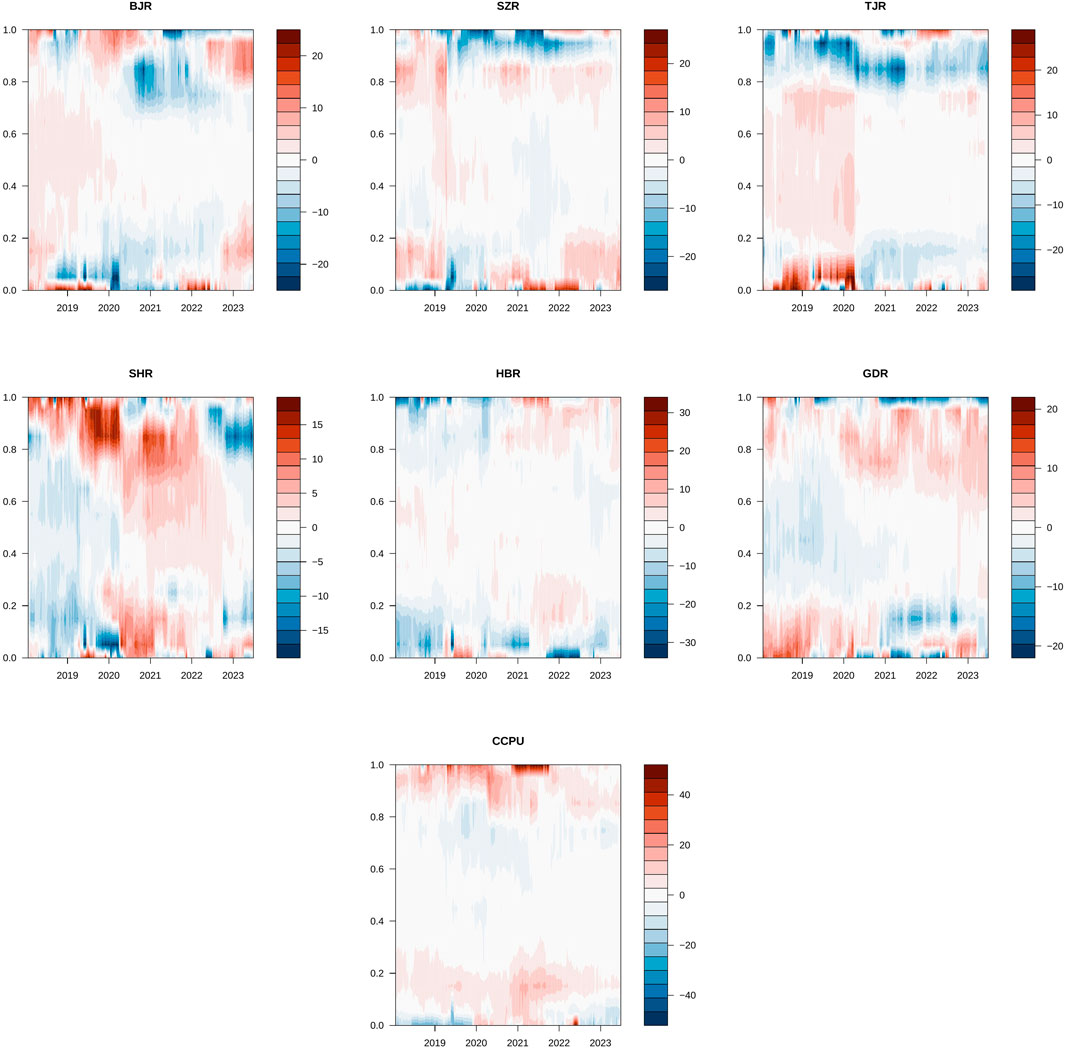
Figure 7. Dynamic net total directional connectedness between CCPU and returns.
At the lower quantile, two key periods stand out. In 2020, new climate and carbon emissions policies—such as the formalisation of the “dual carbon” target and the release of the Carbon Emissions Trading Administration measures—triggered major shifts in ETS spillovers. Beijing moved from being a net contributor to a net recipient, while Shanghai and Tianjin both experienced sharp changes in spillover intensity. The CCPU also switched from receiving shocks to transmitting them. A second turning point came in 2022, when the “14th Five-Year Plan” identified the ETS as central to carbon reduction. During this time, spillovers from Beijing and Shenzhen strengthened, while the CCPU briefly returned to the role of shock recipient, in contrast to its usual behavior at the tails.
At the upper quantile, where higher returns coincide with greater uncertainty, connectedness intensifies and becomes more market-specific. Beijing’s role shift over time—from a contributor in 2020, to a recipient in 2021, and back to a transmitter in 2023 as more enterprises entered its carbon market. Shenzhen and Tianjin mainly acted as recipients, especially in 2021 during the development of the national carbon market. Shanghai, on the other hand, changed from a transmitter in 2020 to a recipient in 2022, likely due to reduced trading during the COVID-19 lockdown. Throughout, the CCPU remained a strong and persistent transmitter, particularly from 2020 to 2021, aligning with China’s carbon goals.
Under median conditions, system-wide connectedness falls sharply. Before 2020, Beijing, Shenzhen, Tianjin and Hubei were the main contributors, with Beijing and Tianjin notably involved in building the national carbon market. Shanghai and Guangdong mainly absorbed shocks. After 2020, spillovers weakened across most markets, with the exception of Shanghai, which became a contributor. This shift suggests that markets turned their attention to local policies and economic development. Meanwhile, the CCPU showed little influence at the median, playing neither a transmitting nor a receiving role.
6.2 Spillovers between CCPU and volatility
Similarly, we first check the Granger causality relationship between CCPU and the volatility of the carbon market. As shown in Table 4, the overall links are weak at the mean and median levels, but they appear more often than in the case of returns. This suggests that CCPU has a wider and stronger impact on volatility than on returns. The quantile results further show that causality is generally stronger in the tails, though it varies across markets. For instance, in Shanghai other variables tend to drive volatility more at higher quantiles, while in Tianjin the effect is stronger at lower quantiles. These patterns point to the need for a closer look at how CCPU and volatility interact under different market conditions.
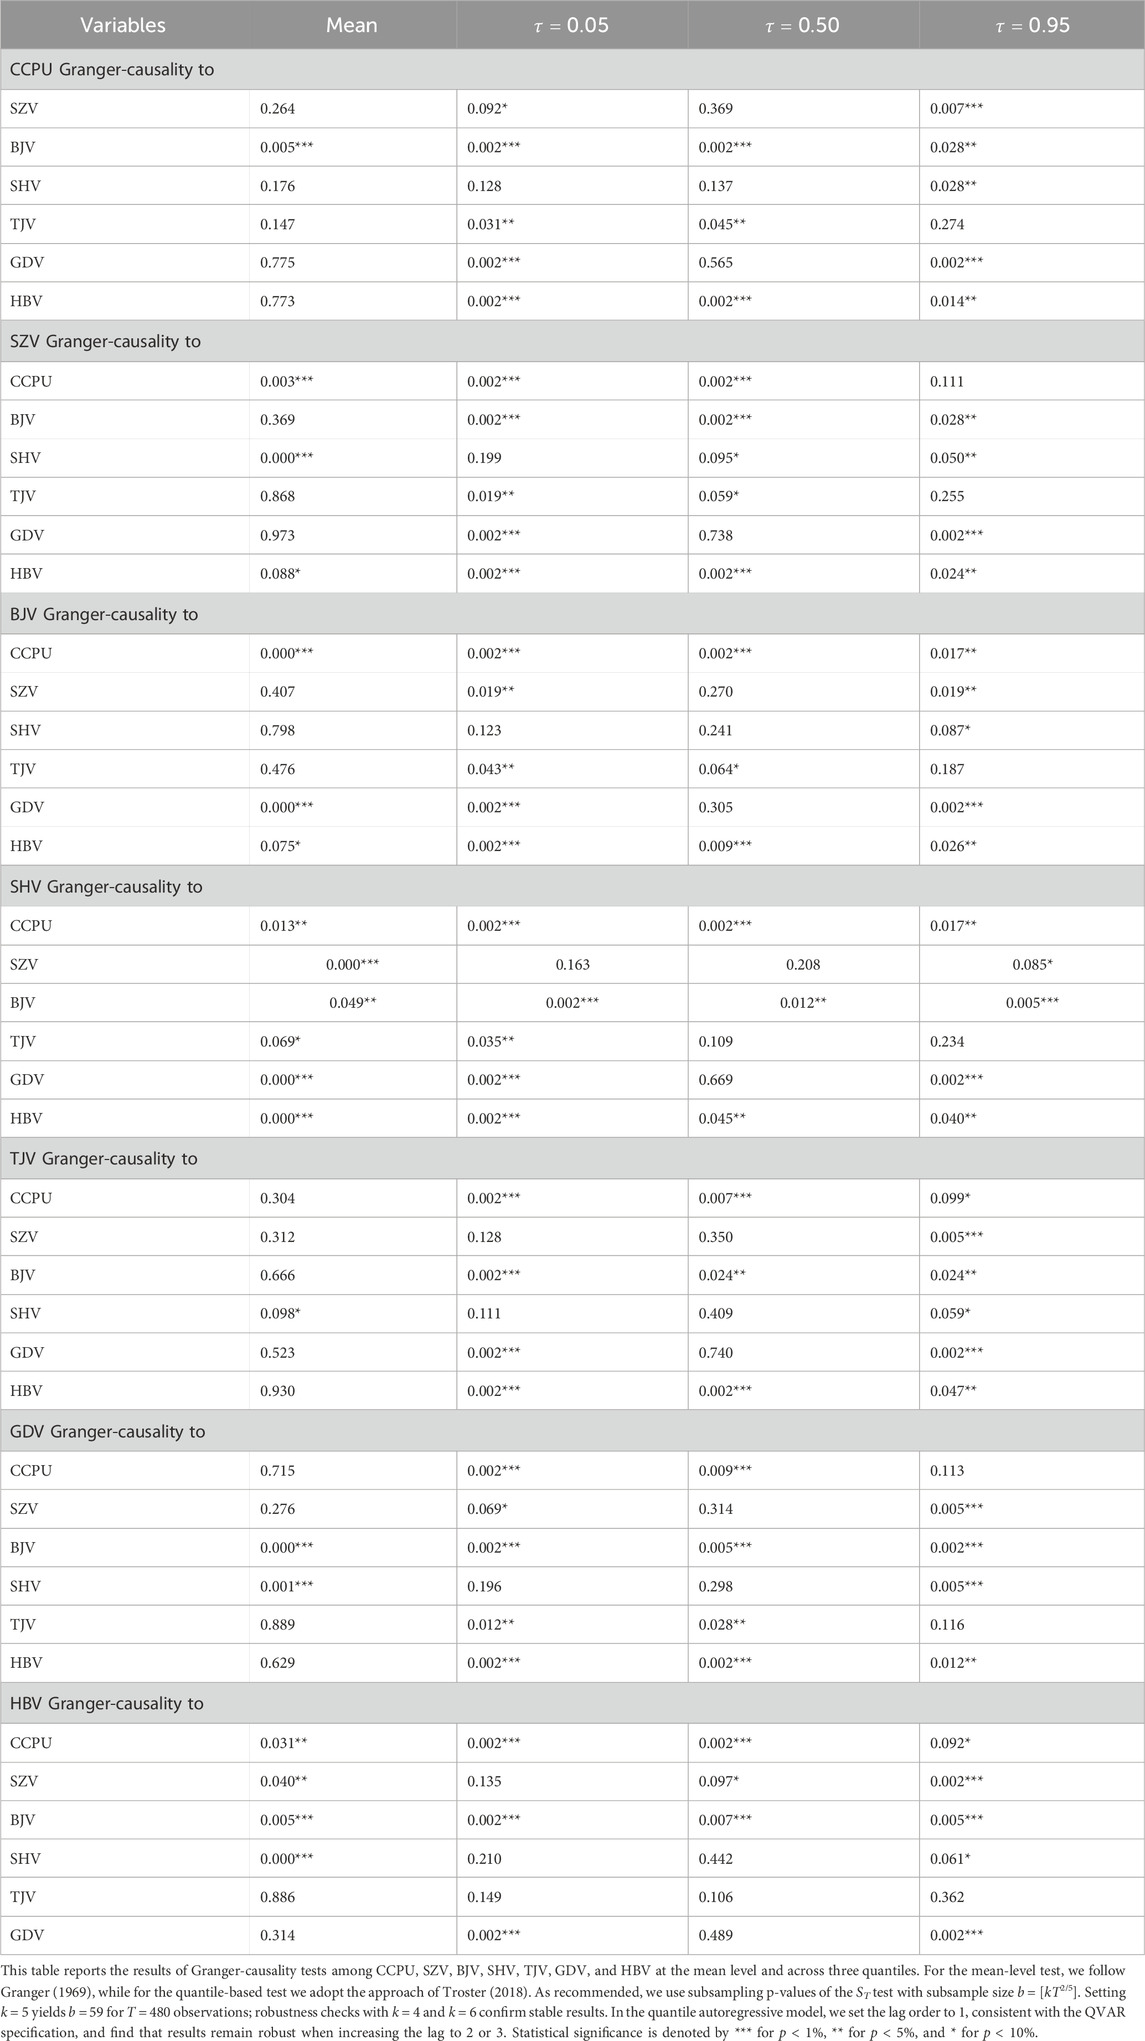
Table 4. Granger-causality test among CCPU and CTP volatility.
To this end, we further examine the spillover effects of the CCPU on ETS volatility across quantiles, with results reported in Table 5. The system’s static connectedness shows clear variation across quantiles, with the TCI rising under extreme conditions. At the lower quantile, the TCI reaches 67.92%, and at the upper quantile it climbs to 76.20%, a pattern similar to that observed for returns. At the median, the TCI is 10.92%—higher than for returns—indicating that volatility is more tightly linked to CCPU than returns under normal conditions. Total directional connectedness (“FROM” and “TO” others) follows the same pattern, with values increasing sharply at the extremes, especially at the upper quantile. The NET measure highlights the ultimate role of each variable. At the upper quantile, the CCPU records the highest NET (12.97%), confirming its role as the dominant shock contributor. At the lower quantile, the CCPU continues to emit shocks, though its influence is smaller. At the median, its NET turns negative (−3.94%), showing that it mainly absorbs shocks, while Tianjin (4.17%) and Guangdong (5.85%) act as the primary transmitters.
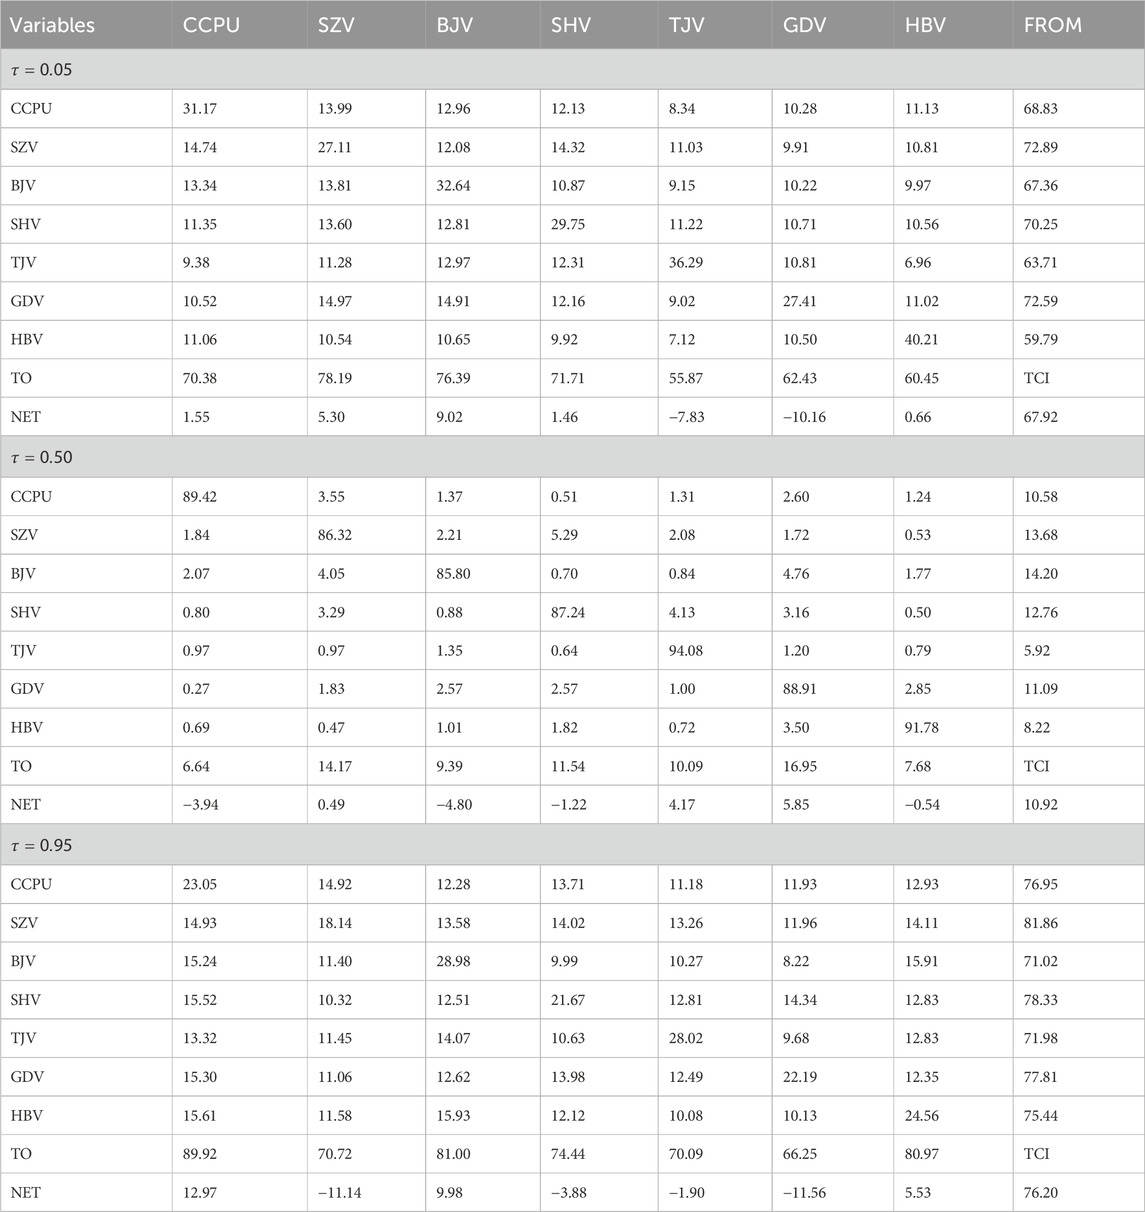
Table 5. Static connectedness between CCPU and volatility.
Figure 8 visualises the network connectedness between the CCPU and volatility across quantiles. At the lower quantile, the CCPU mainly absorbs shocks from Shanghai and Hubei but transmits to other pilots. Guangdong emerges as the main shock recipient, heavily influenced by Beijing and Shenzhen, as indicated in the thick arrows. Beijing also exerts a strong impact on Tianjin, pointing to a high degree of interconnectedness within the system. At the upper quantile, the CCPU becomes the dominant transmitter, sending shocks to all pilots, particularly Guangdong, Tianjin and Beijing, with thick arrows signaling intensified interactions. By contrast, at the median, system connectedness falls sharply. The CCPU shifts to being a shock recipient, mainly influenced by Guangdong, Tianjin and others. Guangdong reverses its role and transmits substantial shocks to Beijing, which in turn affects the CCPU. Overall, these results show that the spillover effects between the CCPU and volatility are weakest at the median and strongest at the extremes, underscoring the importance of tail dynamics in understanding market interconnectedness.
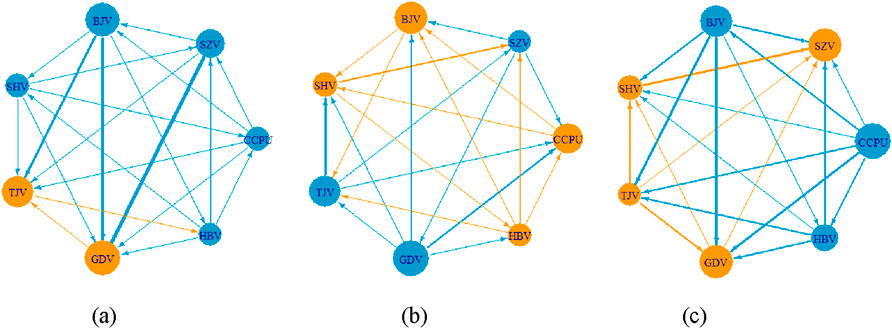
Figure 8. Network between CCPU and volatility. (a)
Extending the static tail dynamic, Figure 9 plots the dynamic total connectedness over time, where spillovers are again strongest at upper and lower quantiles. Total connectedness is especially pronounced in the top and bottom 20%, with the most substantial effects near the extreme of 1 or 0, as shown by the darker color. A comparison across quantile indicates stronger spillovers in the upper quantiles than in the lower ones. Consistent with static analysis, connectedness around the median remains weak. Although variability across quantiles is limited, a clear rise appears in 2021, coinciding with the rollout of China’s “dual carbon” targets and visible as darker shading at the upper quantiles.
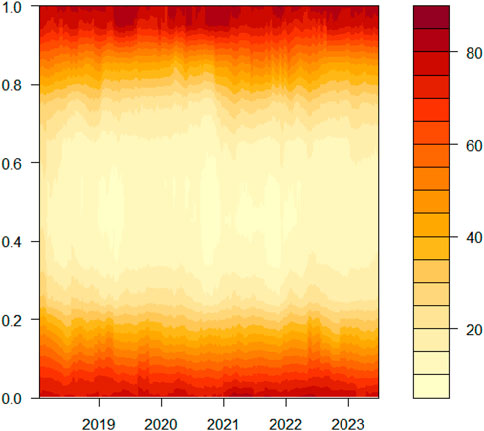
Figure 9. Dynamic total connectedness of CCPU index and volatility.
Figure 10 presents the dynamic net connectedness (NET) between the CCPU and volatility, which is generally stronger than for returns. This relationship varies by quantiles and over time, but does not always align with fluctuations in returns.
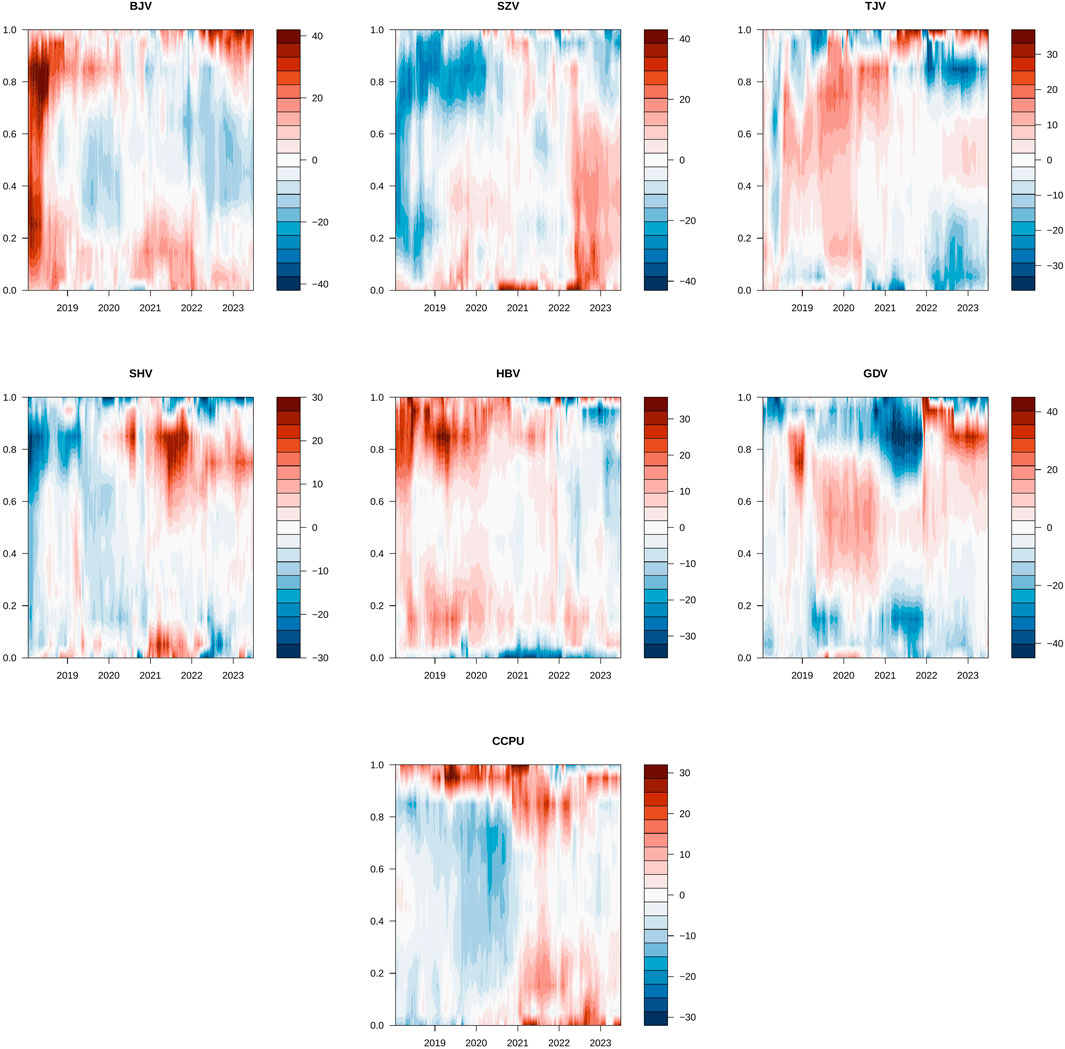
Figure 10. Net total directional connectedness for volatility.
At lower quantiles, volatility spillovers remain relatively stable. Beijing and Shanghai act as the main transmitters, with Beijing’s spillovers intensifying in 2018 due to national carbon market preparations and stricter emissions management policies. By 2021, Shenzhen’s rising trading volume and renewable energy initiatives amplified its volatility. During this period, Tianjin, Shanghai, Guangdong and Hubei were mostly shock recipients, although Shanghai experienced a temporary surge in spillovers in 2021 following the launch of the “China Securities Shanghai Environmental Exchange Carbon Neutrality Index”. The CCPU also shifted from being a shock recipient before 2020 to a shock emitter afterwards, reflecting the growing role of climate policy.
At higher quantiles, spillovers intensifies and market roles shift more frequently. Beijing and Hubei dominate as contributors, with Beijing’s influence peaking in 2018 and 2022, while Hubei’s impact peaked in 2019 before falling back after COVID-19 outbreak (Li et al., 2022). Shanghai and Shenzhen generally absorbed shock, although Shanghai became a strong transmitter in 2021. Tianjin and Guangdong reversed roles after 2022, with Tianjin moving to a recipient role and Guangdong emerging as a transmitter. Post-2020, the CCPU consistently served as a dominant transmitter, particularly around the announcement and rollout of the “dual carbon” targets.
At the median, overall connectedness is weaker, though volatility spillovers remain present. Beijing acted as a notable transmitter in 2018, while Shenzhen and Shanghai were recipients. Across the period, Tianjin, Guangdong and Hubei contributed to spillovers (Xu and Salem, 2021), with their influence intensifying in 2020. Outside extreme conditions, the CCPU mainly received shocks and showed limited spillover effects.
In sum, the spillover effects of CCPU on volatility are far more evident at the extremes than at the median, reinforcing the Hypothesis 1. These effects are stronger for volatility than for returns, and the interactions among ETS markets display heterogeneity and lack of synchronicity across quantile and over time.
6.3 Robustness tests
To test the robustness of our finding, we conduct six checks across three dimensions: (1) varying QVAR forecast horizons from 10 to 5 and 15, (2) adjusting rolling window lengths from 200-week to 150-week and 250-week and (3) testing volatility reliability by modifying the moving standard deviation window from 20 to 18 and 22. Detailed results are reported in the Supplementary Material. Overall, system connectedness remains stable across these alternative specifications. The static analysis shows that, under extreme conditions, the spillover effects of CCPU on CTP returns and volatility remain significant, consistent with our main conclusions. The dynamic analysis further confrims that the directional linkages between returns, volatility and CCPU are robust.
6.4 Discussion
The dynamics of CTP can be understood through returns and volatility, each carrying different meanings and spillover patterns with CCPU. Returns capture short-term price changes and are shaped largely by the internal dynamics of pilot schemes (Guo and Feng, 2021). Volatility, by contrast, reflects the intensity of price fluctuations, signaling risks, uncertainties and co-movements across markets. It often displays stronger spillover effect during external shocks. For instance, the Hubei pilot saw heightened volatility spillovers during the COVID-19 period, driven not only by supply-demand factors but also policy uncertainty, shifting market expectations and climate targets (Xu et al., 2019). Our findings confirms this: volatility spillovers tend to exceed those of returns, reflecting their sensitivity to both internal and external forces.
These patterns are also shaped by market conditions. In stable periods, markets remain interdependent, while in turbulent periods, risk contagion becomes pronounced (Luo et al., 2021). Differences in economic and operational contexts across pilots generate heterogeneous spillovers, with volatility playing a stronger role in influencing returns. This results in asynchronous spillover dynamics, consistent with earlier evidence (Li et al., 2022). Such behaviour highlights the need for enterprises, investors and policymakers to closely monitor the multi-dimensional spillover features of carbon markets.
Returns and volatility are, of course, closely linked. Negative returns and high volatility often co-occurred in the early years of ETS implementation, particularly when CCPU was rising. In 2020, for example, the dual shock of COVID-19 and reinforced carbon neutrality targets reduced returns and increased volatility across several pilots, demonstrating their financial asset characteristics (Wang et al., 2022). Volatility not only measures risk but also explains expected risk premiums through its relationship with returns and conditional variance. High risks are often associated with higher expected returns, and large CCPU shocks can amplify the co-movement between returns and volatility, contributing to systemic risk (Fan et al., 2021). In line with the financial nature of ETS, contagion tends to remain muted in stable periods but escalates sharply under extreme conditions.
This pattern is not unique to ETS but extends to climate and green finance more broadly. When markets face abrupt climatic events, sharp oil prices swings, or major policy shifts, green financial markets frequently exhibit non-linear and asymmetric dynamics (Dong and Yu, 2024b; Xu et al., 2025), with spillovers amplified in the tails. Extending the quantile-based analysis of CCPU-CTP spillovers to the broader climate and green finance domains helps shed light on how extreme shocks shape the mechanisms and pathways of risk transmission.
Underlying these dynamics are two persistent challenges for green innovation: information asymmetry and financing constraints. These issues, closely watched by external investors, are also the key channels through which policy shocks exert influence. Rising policy uncertainty exacerbates both frictions, heightening risks for corporate investment decisions and accelerating the spread of such risks across sectors and regions. Evidence suggests that reforms in green finance can strengthen firms’ resilience by fostering green technological innovation, improving energy efficiency, and easing financing conditions, thereby dampening the amplification effect of policy uncertainty. In addition, in more market-oriented environments, green bond issuance provides firms with long-term and stable funding (Dong and Yu, 2024a), while optimised ownership structures—particularly the involvement of institutional investors and debt–equity dual holders—help mitigate information asymmetry and governance costs (Zhang et al., 2025). These mechanisms are highly relevant for risk prevention and for strengthening financial market stability in the face of extreme shocks.
7 Conclusion and policy implications
This study examines the spillover effects of the CCPU on CTP returns and volatility. First, we construct a weekly CCPU index using word frequency analysis of Chinese newspapers. The index captures peaks linked to key climate events and broadly tracks the UCPU during milestones such as the Sino-US climate agreement and the Paris Agreement, while also reflecting China’s own policy shifts, especially the adoption of the “dual carbon” goals.
Second, results from the QVAR-DY framework show that spillover effects are limited under normal conditions but become much stronger in extreme states, a pattern echoed by the quantile Granger-causality tests. In particular, at higher quantiles, the CCPU exerts a clear influence on major carbon markets. For return spillovers, Shanghai and Guangdong act mainly as transmitters at higher quantiles, while Hubei tends to be a receiver. For volatility spillovers, Hubei and Beijing emerge as the primary transmitters, whereas Guangdong is more often a receiver. Return spillovers capture short-term trading sentiment and information flow, which are more pronounced in Shanghai and Guangdong, where markets are relatively advanced. Volatility spillovers instead reflect stability and resilience, features more evident in large and mature markets such as Hubei and Beijing. Overall, volatility spillovers are stronger than return spillovers, indicating that systemic risk transmission outweighs short-term price fluctuations, especially under extreme conditions. These findings reveal the asymmetric and heterogeneous nature of spillovers, underline the value of quantile-based analysis, and show that such patterns are closely tied to regional market development and shifts in CCPU index.
Based on these results, we offer several policy recommendations to strengthen China’s carbon market. With national and regional markets currently coexisting, our findings show that different regions play distinct roles in transmitting risk. Regulators should take these differences into account when promoting national market integration, to prevent local shocks from spreading nationwide. Since systemic risk transmission is more severe than short-term price fluctuations, market management should focus not only on improving price discovery but also on reinforcing risk control to safeguard long-term stability.
Greater transparency and stronger regulation are also essential. A coordinated risk monitoring and early warning system across both national and regional levels is needed to enable timely intervention during periods of extreme volatility and to prevent local risks from escalating into systemic crises. At the same time, deeper integration with green finance is necessary. Tools such as green bonds, funds and climate-related financial instruments can help spread risks, allocate resources efficiently, and channel long-term capital into low-carbon sectors. Most importantly, climate policy should maintain consistency between long-term goals and implementation pathways, reducing uncertainty that could disrupt the market. Taken together, strengthening regional coordination, enhancing risk prevention, and aligning green finance with climate policy are key to ensuring the sustainable development of China’s carbon market.
Finally, this study analyses the spillover effects between CCPU and CTP primarily from a distributional perspective. Future research may build on this by examining carbon price formation mechanisms in greater depth (Yang et al., 2025), incorporating more advanced treatments of data tails in quantile models (Li et al., 2025), or testing dynamic adjustments between markets (Li et al., 2021).
Data availability statement
The original contributions presented in the study are included in the article/Supplementary Material, further inquiries can be directed to the corresponding author.
Author contributions
LL: Software, Investigation, Conceptualization, Writing – review and editing, Funding acquisition, Data curation, Formal Analysis, Writing – original draft, Methodology. YH: Visualization, Writing – review and editing, Validation, Conceptualization, Supervision, Resources, Investigation. YC: Writing – review and editing, Methodology, Supervision, Conceptualization, Visualization, Data curation, Validation.
Funding
The author(s) declare that financial support was received for the research and/or publication of this article. This work was supported by the National Social Science Foundation of China project under Grant number 21AJY014; and State Scholarship Fund of China Scholarship Council under Grant number 202308210366.
Conflict of interest
The authors declare that the research was conducted in the absence of any commercial or financial relationships that could be construed as a potential conflict of interest.
Generative AI statement
The author(s) declare that no Generative AI was used in the creation of this manuscript.
Any alternative text (alt text) provided alongside figures in this article has been generated by Frontiers with the support of artificial intelligence and reasonable efforts have been made to ensure accuracy, including review by the authors wherever possible. If you identify any issues, please contact us.
Publisher’s note
All claims expressed in this article are solely those of the authors and do not necessarily represent those of their affiliated organizations, or those of the publisher, the editors and the reviewers. Any product that may be evaluated in this article, or claim that may be made by its manufacturer, is not guaranteed or endorsed by the publisher.
Supplementary material
The Supplementary Material for this article can be found online at: https://www.frontiersin.org/articles/10.3389/fenvs.2025.1673541/full#supplementary-material
Footnotes
1A specific list of keywords is available in the supplement.
References
Ando, T., Greenwood-Nimmo, M., and Shin, Y. (2022). Quantile connectedness: modeling tail behavior in the topology of financial networks. Manag. Sci. 68 (4), 2401–2431. doi:10.1287/mnsc.2021.3984
Anke, C.-P., Hobbie, H., Schreiber, S., and Möst, D. (2020). Coal phase-outs and carbon prices: interactions between EU emission trading and national carbon mitigation policies. Energy Policy 144 (September), 111647. doi:10.1016/j.enpol.2020.111647
Ardia, D., Bluteau, K., Boudt, K., and Inghelbrecht, K. (2023). Climate change concerns and the performance of green vs. brown stocks. Manag. Sci. 69 (12), 7607–7632. doi:10.1287/mnsc.2022.4636
Bai, D., Du, L., Xu, Y., and Abbas, S. (2023). Climate policy uncertainty and corporate green innovation: evidence from Chinese A-Share listed industrial corporations. Energy Econ. 127 (November), 107020. doi:10.1016/j.eneco.2023.107020
Beck, U. R., Kruse-Andersen, P. K., and Stewart, L. B. (2023). Carbon leakage in a small open economy: the importance of international climate policies. Energy Econ. 117 (January), 106447. doi:10.1016/j.eneco.2022.106447
Benlemlih, M., and Yavaş, Ç. V. (2024). Economic policy uncertainty and climate change: evidence from CO2 emission. J. Bus. Ethics 191 (3), 415–441. doi:10.1007/s10551-023-05389-x
Bolton, P., and Kacperczyk, M. (2021). Do investors care about carbon risk? J. Financial Econ. 142 (2), 517–549. doi:10.1016/j.jfineco.2021.05.008
Bolton, P., and Kacperczyk, M. (2023). Global pricing of carbon-transition risk. J. Finance 78 (6), 3677–3754. doi:10.1111/jofi.13272
Bouri, E., Iqbal, N., and Klein, T. (2022). Climate policy uncertainty and the price dynamics of green and brown energy stocks. Finance Res. Lett. 47 (June), 102740. doi:10.1016/j.frl.2022.102740
Chen, Y., Ba, S., Yang, Q., Yuan, T., Zhao, H., Zhou, M., et al. (2021). Efficiency of China’s carbon market: a case study of Hubei pilot market. Energy 222, 119946. doi:10.1016/j.energy.2021.119946
Chen, Y., Wang, C., and Zhu, Z. (2022). Toward the integration of European gas futures market under COVID-19 shock: a quantile connectedness approach. Energy Econ. 114 (October), 106288. doi:10.1016/j.eneco.2022.106288
Chen, H., Shi, H.-L., and Zhou, W.-X. (2024). Carbon volatility connectedness and the role of external uncertainties: evidence from China. J. Commod. Mark. 33 (March), 100383. doi:10.1016/j.jcomm.2024.100383
Chen, Y., Shen, S., and Wang, C. (2025a). Climate risks and stock market volatility spillover: new insights from wavelet and causality methods. Econ. Change Restruct. 58 (3), 37. doi:10.1007/s10644-025-09877-0
Chen, Y., Msofe, Z. A., Wang, C., and Chen, M. (2025b). Oil price uncertainty, exchange rate volatility, and African stock markets: a nonparametric quantile-on-quantile analysis. Int. Rev. Financial Analysis 105 (September), 104385. doi:10.1016/j.irfa.2025.104385
Dai, H., Xie, Y., Zhang, H., Yu, Z., and Wang, W. (2018). Effects of the US withdrawal from Paris agreement on the carbon emission space and cost of China and India. Front. Energy 12 (3), 362–375. doi:10.1007/s11708-018-0574-y
Diebold, F. X., and Kamil, Y. (2012). Better to give than to receive: predictive directional measurement of volatility spillovers. Int. J. Forecast. Special Sect. 1 Predict. Financial Mark. 28 (1), 57–66. doi:10.1016/j.ijforecast.2011.02.006
Diebold, F. X., and Yilmaz, K. (2009). Measuring financial asset return and volatility spillovers, with application to global equity markets. Econ. J. 119 (534), 158–171. doi:10.1111/j.1468-0297.2008.02208.x
Diebold, F. X., and Yılmaz, K. (2014). On the network topology of variance decompositions: measuring the connectedness of financial firms. J. Econ. Causality, Predict. Specif. Analysis Recent Adv. Future Dir. 182 (1), 119–134. doi:10.1016/j.jeconom.2014.04.012
Dissanayake, S., Mahadevan, R., and Asafu-Adjaye, J. (2020). Evaluating the efficiency of carbon emissions policies in a large emitting developing country. Energy Policy 136 (January), 111080. doi:10.1016/j.enpol.2019.111080
Dong, H., and Yang, J. (2024). Study on regional carbon quota allocation at provincial level in China from the perspective of carbon peak. J. Environ. Manag. 351 (February), 119720. doi:10.1016/j.jenvman.2023.119720
Dong, X., and Yu, M. (2024a). Green bond issuance and green innovation: evidence from China’s energy industry. Int. Rev. Financial Analysis 94 (July), 103281. doi:10.1016/j.irfa.2024.103281
Dong, X., and Yu, M. (2024b). Time-varying effects of macro shocks on cross-border capital flows in China’s bond market. Int. Rev. Econ. and Finance 96 (November), 103720. doi:10.1016/j.iref.2024.103720
Engle, R. F., Giglio, S., Kelly, B., Lee, H., and Stroebel, J. (2020). Hedging climate change news. Rev. Financial Stud. 33 (3), 1184–1216. doi:10.1093/rfs/hhz072
Fan, J. H., and Todorova, N. (2017). Dynamics of China’s carbon prices in the pilot trading phase. Appl. Energy 208 (December), 1452–1467. doi:10.1016/j.apenergy.2017.09.007
Fan, Y., Jia, J.-J., Wang, X., and Xu, J.-H. (2017). What policy adjustments in the EU ETS truly affected the carbon prices? Energy Policy 103 (April), 145–164. doi:10.1016/j.enpol.2017.01.008
Fan, X., Wang, Y., and Wang, D. (2021). Network connectedness and china’s systemic financial risk contagion: an analysis based on big data. Pacific-Basin Finance J. 68 (September), 101322. doi:10.1016/j.pacfin.2020.101322
Flori, A., Pammolli, F., and Spelta, A. (2021). Commodity prices Co-Movements and financial stability: a multidimensional visibility nexus with climate conditions. J. Financial Stab. 54 (June), 100876. doi:10.1016/j.jfs.2021.100876
Fried, S., Novan, K., and Peterman, W. B. (2022). Climate policy transition risk and the macroeconomy. Eur. Econ. Rev. 147 (August), 104174. doi:10.1016/j.euroecorev.2022.104174
Gavriilidis, K. (2021). Measuring climate policy uncertainty. SSRN Electron. J. ahead of print. doi:10.2139/ssrn.3847388
Golub, A. A., Fuss, S., Lubowski, R., Hiller, J., Khabarov, N., Koch, N., et al. (2018). Escaping the climate policy uncertainty trap: options contracts for REDD+. Clim. Policy 18 (10), 1227–1234. doi:10.1080/14693062.2017.1422478
Granger, C. W. J. (1969). Investigating causal relations by econometric models and cross-spectral methods. Econometrica 37 (3), 424. doi:10.2307/1912791
Guesmi, K., Makrychoriti, P., and Spyrou, S. (2023). The relationship between climate risk, climate policy uncertainty, and CO2 emissions: empirical evidence from the US. J. Econ. Behav. and Organ. 212 (August), 610–628. doi:10.1016/j.jebo.2023.06.015
Guo, L.-Y., and Feng, C. (2021). Are there spillovers among China’s pilots for carbon emission allowances trading? Energy Econ. 103 (November), 105574. doi:10.1016/j.eneco.2021.105574
Ha, Le T., Ahmed, B., Taimur, S., and Abedin, M. Z. (2024). Dynamic interlinkages between carbon risk and volatility of green and renewable energy: a TVP-VAR analysis. Res. Int. Bus. Finance 69 (April), 102278. doi:10.1016/j.ribaf.2024.102278
Hamilton, J. D. (1989). A new approach to the economic analysis of nonstationary time series and the business cycle. Econometrica 57 (2), 357–384. doi:10.2307/1912559
He, Q., Rahman, M.Ur, Hu, J., and Cui, J. (2025). Dynamic relationship between carbon trading system resilience and low-carbon stock market returns using time-varying granger causality. Fractals 21, 2540181. doi:10.1142/S0218348X25401814
Hoang, K. (2022). How does corporate R&D investment respond to climate policy uncertainty? Evidence from heavy emitter firms in the United States. Corp. Soc. Responsib. Environ. Manag. 29 (4), 936–949. doi:10.1002/csr.2246
Hoque, M. E., and Batabyal, S. (2022). Carbon futures and clean energy stocks: do they hedge or safe haven against the climate policy uncertainty? J. Risk Financial Manag. 15 (9), 397. doi:10.3390/jrfm15090397
Hu, J., Pan, X., and Huang, Q. (2020). Quantity or quality? The impacts of environmental regulation on firms’ Innovation–Quasi-Natural experiment based on China’s carbon emissions trading pilot. Technol. Forecast. Soc. Change 158 (September), 120122. doi:10.1016/j.techfore.2020.120122
Ji, Q., Zhang, D., and Geng, J. (2018). Information linkage, dynamic spillovers in prices and volatility between the carbon and energy markets. J. Clean. Prod. 198 (October), 972–978. doi:10.1016/j.jclepro.2018.07.126
Jiménez-Rodríguez, R. (2019). What happens to the relationship between EU allowances prices and stock market indices in Europe? Energy Econ. 81 (June), 13–24. doi:10.1016/j.eneco.2019.03.002
Jin, J., Han, L., Wu, L., and Zeng, H. (2020). The hedging effect of green bonds on carbon market risk. Int. Rev. Financial Analysis 71 (October), 101509. doi:10.1016/j.irfa.2020.101509
Kim, H. S., and Koo, W. W. (2010). Factors affecting the carbon allowance market in the US’. Energy Policy. Energy Secur. - Concepts Indic. Regul. Pap. 38 (4), 1879–1884. doi:10.1016/j.enpol.2009.11.066
Koch, N., Fuss, S., Grosjean, G., and Edenhofer, O. (2014). Causes of the EU ETS price drop: recession, CDM, renewable policies or a bit of everything? New evidence. Energy Policy 73 (October), 676–685. doi:10.1016/j.enpol.2014.06.024
Lee, C.-C., Li, X., Yu, C.-H., and Zhao, J. (2022). The contribution of climate finance toward environmental sustainability: new global evidence. Energy Econ. 111 (July), 106072. doi:10.1016/j.eneco.2022.106072
Li, A., and Lin, B. (2013). Comparing climate policies to reduce carbon emissions in China. Energy Policy 60 (September), 667–674. doi:10.1016/j.enpol.2013.04.041
Li, Z., and Wang, J. (2022). Spatial spillover effect of carbon emission trading on carbon emission reduction: empirical data from pilot regions in China. Energy 251 (July), 123906. doi:10.1016/j.energy.2022.123906
Li, B., Li, G., and Luo, J (2021). Latent but not absent: the “Long Tail” nature of rural special education and its dynamic correction mechanism. PLOS ONE 16 (3), e0242023. doi:10.1371/journal.pone.0242023
Li, X., Li, Z., Su, C.-W., Umar, M., and Shao, X. (2022). Exploring the asymmetric impact of economic policy uncertainty on China’s carbon emissions trading market price: do different types of uncertainty matter? Technol. Forecast. Soc. Change 178 (May), 121601. doi:10.1016/j.techfore.2022.121601
Li, Z. Z., Su, C.-W., Moldovan, N.-C., and Umar, M. (2023). Energy consumption within policy uncertainty: considering the climate and economic factors. Renew. Energy 208 (May), 567–576. doi:10.1016/j.renene.2023.03.098
Li, L., Yue, X., Ren, S., and Yang, X. (2025). Homogeneity pursuit in the functional-coefficient quantile regression model for panel data with censored data. Stud. Nonlinear Dyn. and Econ. 29 (3), 323–348. doi:10.1515/snde-2023-0024
Liu, J., Hu, Y., Yan, L.-Z., and Chang, C.-P. (2023). Volatility spillover and hedging strategies between the European Carbon emissions and energy markets. Energy Strategy Rev. 46, 101058. doi:10.1016/j.esr.2023.101058
Liu, S., Qi, H., and Wan, Y. (2022). Factors Driving the Development of China’s Green Bond Market. J. Clean. Prod. 354, 131705. doi:10.1016/j.jclepro.2022.131705
Liu, X., Zhang, L., Yan, H., Yin, X., and Shi, Z. (2022). Increasing disparities in the embedded carbon emissions of provincial urban households in China. J. Environ. Manag. 302, 113974. doi:10.1016/j.jenvman.2021.113974
Luo, C., Liu, L., and Wang, D. (2021). Multiscale financial risk contagion between international stock markets: evidence from EMD-Copula-CoVaR analysis. North Am. J. Econ. Finance 58 (November), 101512. doi:10.1016/j.najef.2021.101512
Meng, Q., Xu, J., Luo, F., Jin, X., Xu, L., Yao, W., et al. (2023). Collaborative and effective scheduling of integrated energy systems with consideration of carbon restrictions. IET Generation, Transm. and Distribution 17 (18), 4134–4145. doi:10.1049/gtd2.12971
Munnings, C., Morgenstern, R. D., Wang, Z., and Liu, Xu (2016). Assessing the design of three carbon trading pilot programs in China. Energy Policy 96 (September), 688–699. doi:10.1016/j.enpol.2016.06.015
Oestreich, A. M., and Ilias, T. (2015). Carbon emissions and stock returns: evidence from the EU emissions trading scheme. J. Bank. and Finance 58 (September), 294–308. doi:10.1016/j.jbankfin.2015.05.005
Ozturk, S. S., Demirer, R., and Gupta, R. (2022). Climate uncertainty and carbon emissions prices: the relative roles of transition and physical climate risks. Econ. Lett. 217 (August), 110687. doi:10.1016/j.econlet.2022.110687
Ren, X., Li, J., He, F., and Lucey, B. (2023). Impact of climate policy uncertainty on traditional energy and green markets: evidence from time-varying granger tests. Renew. Sustain. Energy Rev. 173 (March), 113058. doi:10.1016/j.rser.2022.113058
Schubert, K., and Smulders, S. (2019). How important are uncertainty and dynamics for environmental and climate policy? Some analytics. J. Environ. Econ. Manag. 97 (September), 1–22. doi:10.1016/j.jeem.2019.102249
Shang, Y., Han, D., Gozgor, G., Kumar Mahalik, M., and Sahoo, B. K. (2022). The impact of climate policy uncertainty on renewable and non-renewable energy demand in the United States. Renew. Energy 197 (September), 654–667. doi:10.1016/j.renene.2022.07.159
Song, Y., Liang, D., Liu, T., and Song, X. (2018). How China’s current carbon trading policy affects carbon price? An investigation of the Shanghai emission trading scheme pilot. J. Clean. Prod. 181 (April), 374–384. doi:10.1016/j.jclepro.2018.01.102
Su, C.-W., Pang, L.-D., Qin, M., Lobonţ, O.-R., and Umar, M. (2023). The spillover effects among fossil fuel, renewables and carbon markets: evidence under the dual dilemma of climate change and energy crises. Energy 274 (July), 127304. doi:10.1016/j.energy.2023.127304
Su, C. W., Wei, S., Wang, Y., and Ran, T. (2024). How does climate policy uncertainty affect the carbon market? Technol. Forecast. Soc. Change 200 (March), 123155. doi:10.1016/j.techfore.2023.123155
Sun, C., Pan, C., and Xu, N. (2025). Industry-level climate policy risk exposure and corporate ESG performance. Finance Res. Lett. 81 (July), 107542. doi:10.1016/j.frl.2025.107542
Tan, X.-P., and Wang, X.-Y (2017). Dependence changes between the carbon price and its fundamentals: a quantile regression approach. Appl. Energy 190 (March), 306–325. doi:10.1016/j.apenergy.2016.12.116
Tan, X., Sirichand, K., Vivian, A., and Wang, X. (2020). How connected is the carbon market to energy and financial markets? A systematic analysis of spillovers and dynamics. Energy Econ. 90 (August), 104870. doi:10.1016/j.eneco.2020.104870
Tang, L., Shi, J., and Bao, Q. (2016). Designing an emissions trading scheme for China with a dynamic computable general equilibrium model. Energy Policy 97 (October), 507–520. doi:10.1016/j.enpol.2016.07.039
Tedeschi, M., Foglia, M., Bouri, E., and Dai, P.-F. (2024). How does climate policy uncertainty affect financial markets? Evidence from Europe. Econ. Lett. 234 (January), 111443. doi:10.1016/j.econlet.2023.111443
Tiwari, A. K., Abakah, E. J. A., Le, T. N.-L., and Leyva-de La Hiz, D. I. (2021). Markov-switching dependence between artificial intelligence and carbon price: the role of policy uncertainty in the era of the 4th industrial revolution and the effect of COVID-19 pandemic. Technol. Forecast. Soc. Change 163 (February), 120434. doi:10.1016/j.techfore.2020.120434
Troster, V. (2018). Testing for granger-causality in quantiles. Econ. Rev. 37 (8), 850–866. doi:10.1080/07474938.2016.1172400
Vellachami, S., Hasanov, A. S., and Brooks, R. (2023). Risk transmission from the energy markets to the carbon market: evidence from the recursive window approach. Int. Rev. Financial Analysis 89 (October), 102715. doi:10.1016/j.irfa.2023.102715
Wang, K.-H., Liu, L, Zhong, Y., and Lobonţ, O.-R. (2022). Economic policy uncertainty and carbon emission trading market: a China’s perspective. Energy Econ. 115 (November), 106342. doi:10.1016/j.eneco.2022.106342
Wang, K.-H., Wang, Z.-S., Yunis, M., and Kchouri, B. (2023). Spillovers and connectedness among climate policy uncertainty, energy, green bond and carbon markets: a global perspective. Energy Econ. 128 (December), 107170. doi:10.1016/j.eneco.2023.107170
Wang, J., Dai, P.-F., Chen, X. H., and Nguyen, D. K. (2024). Examining the linkage between economic policy uncertainty, coal price, and carbon pricing in China: evidence from pilot carbon markets. J. Environ. Manag. 352 (February), 120003. doi:10.1016/j.jenvman.2023.120003
Wei, Yu, Liu, J., Lai, X., and Hu, Y. (2017). Which determinant is the Most informative in forecasting crude oil market volatility: fundamental, speculation, or uncertainty? Energy Econ. 68, 141–150. doi:10.1016/j.eneco.2017.09.016
Weitzel, M., Vandyck, T., Rey Los Santos, L., Tamba, M., Temursho, U., and Wojtowicz, K. (2023). A comprehensive socio-economic assessment of EU climate policy pathways. Ecol. Econ. 204 (February), 107660. doi:10.1016/j.ecolecon.2022.107660
Wen, F., Zhao, L., He, S., and Yang, G. (2020). Asymmetric relationship between carbon emission trading market and stock market: evidences from China. Energy Econ. 91 (September), 104850. doi:10.1016/j.eneco.2020.104850
Wen, F., Zhao, H., Zhao, L., and Yin, H. (2022). What drive carbon price dynamics in China? Int. Rev. Financial Analysis 79 (January), 101999. doi:10.1016/j.irfa.2021.101999
Wu, L., Qian, H., and Jin, L (2014). Advancing the experiment to reality: perspectives on Shanghai Pilot carbon emissions trading scheme. Energy Policy 75, 22–30. doi:10.1016/j.enpol.2014.04.022
Xiao, Z., Ma, S., Sun, H., Ren, J., Feng, C., and Cui, S. (2022). Time-varying spillovers among pilot carbon emission trading markets in China. Environ. Sci. Pollut. Res. 29 (38), 57421–57436. doi:10.1007/s11356-022-19914-4
Xie, Q., Jingjing, H., Li, J., and Zheng, X. (2022). Carbon price prediction considering climate change: a text-based framework. Econ. Analysis Policy 74 (June), 382–401. doi:10.1016/j.eap.2022.02.010
Xu, Y., and Salem, S. (2021). Explosive behaviors in Chinese carbon markets: are there price bubbles in eight pilots? Renew. Sustain. Energy Rev. 145 (July), 111089. doi:10.1016/j.rser.2021.111089
Xu, J., Tan, X., He, G., and Liu, Y. (2019). Disentangling the drivers of carbon prices in China’s ETS pilots — an EEMD approach. Technol. Forecast. Soc. Change 139 (February), 1–9. doi:10.1016/j.techfore.2018.11.009
Xu, A., Dai, Y., Hu, Z., and Qiu, K. (2025). Can green finance policy promote inclusive green Growth? Based on the quasi-natural experiment of China’s green finance reform and innovation pilot zone. Int. Rev. Econ. and Finance 100 (June), 104090. doi:10.1016/j.iref.2025.104090
Yan, W.-L., and Cheung, A. W. K. (2023). The dynamic spillover effects of climate policy uncertainty and coal price on carbon price: evidence from China. Finance Res. Lett. 53 (May), 103400. doi:10.1016/j.frl.2022.103400
Yang, X., Han, Q., Ni, J., and Lu, Li (2025). Research on the expansion of deposit insurance pricing model based on the merton option pricing framework. Comput. Econ. ahead of print, March 8. doi:10.1007/s10614-025-10876-6
Ye, S., Dai, P.-F., Nguyen, H. T., and Huynh, N. Q. A. (2021). Is the cross-correlation of EU carbon market price with policy uncertainty really being? A multiscale multifractal perspective. J. Environ. Manag. 298 (November), 113490. doi:10.1016/j.jenvman.2021.113490
Yin, J., Zhu, Y., and Fan, X. (2021). Correlation analysis of China’s carbon market and coal market based on multi-scale entropy. Resour. Policy 72 (August), 102065. doi:10.1016/j.resourpol.2021.102065
Zeng, S., Nan, X., Liu, C., and Chen, J. (2017). The response of the Beijing carbon emissions allowance price (BJC) to macroeconomic and energy price indices. Energy Policy 106 (July), 111–121. doi:10.1016/j.enpol.2017.03.046
Zeng, Q., Ma, F., Lu, X., and Xu, W. (2022). Policy uncertainty and carbon neutrality: evidence from China. Finance Res. Lett. 47 (June), 102771. doi:10.1016/j.frl.2022.102771
Zhang, J., Wang, Z., and Du, X. (2017). Lessons learned from China’s regional carbon market pilots. Econ. Energy and Environ. Policy 6 (2), 19–38. doi:10.5547/2160-5890.6.2.jzha
Zhang, Y., Sheng, Li, Luo, T., and Gao, J. (2020). The effect of emission trading policy on carbon emission reduction: evidence from an integrated study of pilot regions in China. J. Clean. Prod. 265 (August), 121843. doi:10.1016/j.jclepro.2020.121843
Zhang, Y., Ding, Y., and Yan, W. (2025). United in green: institutional dual ownership and corporate green innovation. Finance Res. Lett. 84 (November), 107814. doi:10.1016/j.frl.2025.107814
Keywords: CCPU index, CTP, QVAR-DY, return spillover effects, volatility spillover effects
Citation: Li L, Han Y and Chen Y (2025) Exploring spillover effects between climate policy uncertainty and carbon trading prices: evidence from China. Front. Environ. Sci. 13:1673541. doi: 10.3389/fenvs.2025.1673541
Received: 26 July 2025; Accepted: 06 October 2025;
Published: 31 October 2025.
Edited by:
Shigeyuki Hamori, Yamato University, JapanReviewed by:
Yufeng Chen, Zhejiang Normal University, ChinaYuanjun Zhao, Nanjing Audit University, China
Copyright © 2025 Li, Han and Chen. This is an open-access article distributed under the terms of the Creative Commons Attribution License (CC BY). The use, distribution or reproduction in other forums is permitted, provided the original author(s) and the copyright owner(s) are credited and that the original publication in this journal is cited, in accordance with accepted academic practice. No use, distribution or reproduction is permitted which does not comply with these terms.
*Correspondence: Yilin Chen, ODI1NzUwNjM3QHFxLmNvbQ==
†ORCID: Lijuan Li, orcid.org/0009-0004-1376-6379; Yudi Han, orcid.org/0009-0006-4968-2470; Yilin Chen, orcid.org/0009-0007-1725-6191