 Shengjuan Yue
 Mengjing Guo4*
 Bo Yuan
 Wenwen Bai
- 1School of Civil Engineering and Water Resources, Qinghai University, Xining, China
- 2Laboratory of Ecological Protection and High Quality Development in the Upper Yellow River, Qinghai University, Xining, China
- 3Key Laboratory of Water Ecology Remediation and Protection at Headwater Regions of Big Rivers, Ministry of Water Resources, Qinghai University, Xining, China
- 4State Key Laboratory of Eco-hydraulics in Northwest Arid Region of China, Xi’an University of Technology, Xi’an, China
- 5College of Geology and Environment, Xi’an University of Science and Technology, Xi’an, China
- 6Qinghai Huanghe Hydropower Development Co.,LTD., Xining, China
To clarify the influence of photovoltaic (PV) panels on the spatial distribution characteristics of soil properties in desert areas, the soil of fixed-axis (FIX) PV panels and tracking tilted single-axis (TTS) PV panels in the Gonghe large-scale PV power plant in the Qinghai desert was taken as the research object. The PV panels were divided into the south edge, the north edge, under and between panels. The soil in the undisturbed area outside the PV power plant was taken as the control area. The results showed that, except between the PV panels, the soil bulk density (BD) increased significantly at other locations of the TTS PV panels (p < 0.001), soil organic carbon (SOC), total carbon (TC) and total nitrogen (TN), and available nitrogen (AN) decreased significantly (−35.07%, −29.62%, −38.25%, and −32.86% under the panels, respectively), and the total phosphorus (TP) content was significantly decreased only in the north edge and between the panels (p < 0.01). Soil water content (SWC) of FIX PV panels increased significantly (+74.74% under the panels, p < 0.001), and pH decreased. Comparing the two types of PV panels, except the north edge, SWC, SOC, TN, SOC: TP, TN: TP, and AN were significantly higher in the FIX PV panels than in the TTS PV panels, and BD, total potassium (TK), and SOC: TN were considerably lower than in the TTS PV panels. There was no significant difference (p > 0.05) in soil quality and multifunctionality index in the PV panel area. The research results can provide theoretical support for soil restoration of PV power plants in desert grassland.
1 Introduction
In order to cope with energy needs and reduce carbon emissions, renewable energy has become an essential choice, and photovoltaic (PV) has become the dominant force in the growth of renewable energy. According to an estimate by the International Renewable Energy Agency (IRENA), global renewable energy capacity additions will exceed 5,500 GW from 2024 to 2030, almost tripling the increase from 2017 to 2023. From 2024 to 2030, the global average annual increase in PV installed capacity will exceed 600 GW (IEA, 2024). By the end of 2024, China’s total installed power generation capacity reached approximately 3,350 GW, with PV capacity accounting for about 890 GW (National Energy, 2024). Large-scale deployment of ground-mounted PVs requires vast land. Consequently, China’s northwestern deserts and Gobi desert regions have become the main development areas of PV power generation.
The installation of PV power plants has consistently been regarded as a “win-win” strategy, as it reduces carbon emissions and prevents desertification in arid regions (Xia et al., 2023; Xia et al., 2022; Lu et al., 2021). However, the leveling of the site during the construction of the PV power plant will destroy the soil structure and make the soil more susceptible to wind and water erosion. The removal of topsoil during construction reduces soil carbon (Choi et al., 2020), nitrogen, and phosphorus (Geissen et al., 2013) and reduces the stability of soil aggregates, which has a negative impact on the environment. During the operational stage, the physical presence of the PV panels changes the local climatic conditions (Bai et al., 2022). At the same time, the PV panels will concentrate water on their lower edge, which increases the local heterogeneity of the soil moisture distribution and produces more lasting water storage under the PV panels (Adeh et al., 2018). In addition, due to the reduction in solar radiation directly under the PV panels, the potential evaporation is reduced, which reduces drought, increases soil moisture availability, and helps to reduce water loss in arid climates (Choi et al., 2020). Wu et al. (2023) showed that different positions of PV panels have little effect on SOC and available phosphorus (AP). The contents of nitrate nitrogen (NO3-N), TN, and TC under the PV panel are slightly higher than those between the PV panels, and the content of available potassium (AK) is significantly increased. Wang et al. (2016) showed that the soil SWC, organic matter, AK, and AP in the PV panel area increased compared with the non-PV control area. The soil BD increased in the shaded area and decreased in the unshaded area. Andrew et al. (2024) found that soil organic matter in the PV plant in the northeastern United States increased, and the pH increased significantly. Sheep grazing in the PV plant may improve the pasture quality of the solar site over time. In contrast, Moscatelli et al. (2022) showed that soil nutrients, soil moisture, and soil temperature under PV panels were significantly reduced. Furthermore, the heterogeneous light intensity under PV panels results in significant differences in soil microbial community composition (Li et al., 2023), decreased microbial activity (Moscatelli et al., 2022) and microbial biomass (Lambert et al., 2021b), whereas increased alpha diversity of the fungal community (Li et al., 2023). These studies found that the influence of PV plants on soil properties is still uncertain, and may be affected by local climate, soil conditions, PV panel operation mode and other factors (Yavari et al., 2022).
Tracking PV panels can adjust the solar incident angle in real time to obtain maximum power generation efficiency (Li et al., 2025). Compared to fixed systems, their annual electricity output can increase by up to 29% (Lubitz, 2011), and the gap between adjacent PV module strings receives up to 84% of solar radiation (Graham et al., 2021). Tracking PV panels optimise ventilation, light and humidity through elevated panels and dynamic shading, creating a more uniform microenvironment conducive to positive changes in soil properties (Liu et al., 2025). This enhances vegetation photosynthesis and SOC inputs, thereby improving soil quality (Ramos-Fuentes et al., 2023; Zhang B. et al., 2024). In contrast, FIX PV panels are mounted at a fixed angle; they reconfigure precipitation and solar radiation differently than tracking PV panels. Static shading in FIX PV panels may limit photosynthesis and SOC accumulation (Zhang et al., 2025).
In view of this, the goal of this research is to assess the effects of TTS PV panels and FIX PV panels on soil physicochemical properties and whether the PV panels induced spatial heterogeneity of soils in desert areas. The specific goals were to: (1) compare soil physicochemical properties of TTS PV panels, FIX PV panels, and undisturbed control areas (CK), and (2) compare soil physicochemical properties of PV panels at different shading locations.
2 Study area and methods
2.1 Overview of the study area
The study area is located in the Longyangxia Hydro-PV Park in Talatan, Qinghai Province (100°22′E−100°39′E, 35°56′N-36°13′N). The PV power plant was built in 2012 and completed in 2015, with a total installed capacity of 850 MW. It is characterized by ‘PV + ecological management + ecological pastoralism'. We collected soil samples at a FIX and a TTS PV array (Figure 1). FIX PV mounting system that does not track the rotation of the sun. The lower eaves of the PV panels are 0.5 m from the ground, the inclination angle of the PV panels is 39°, and the spacing between the PV panels is 6.87 m (Figure 2c). TTS PV mounting system rotates at a fixed inclination to track the sun’s trajectory from east to west, with the lower eave of the PV panels 1.2 m above the ground (Figure 2d).
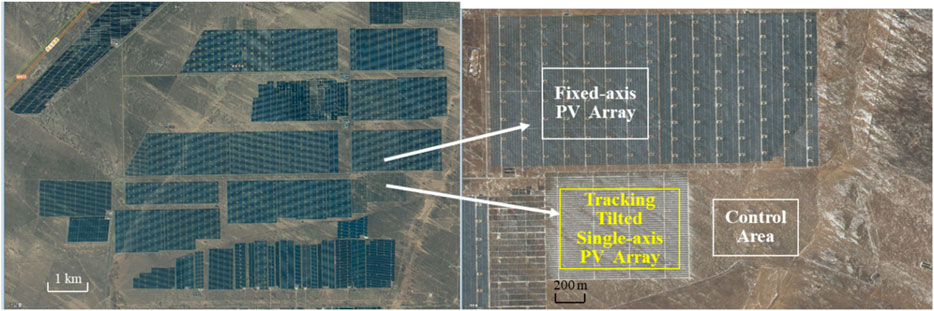
Figure 1. The position of the FIX PV array, the TTS PV array and the CK. FIX, fixed-axis. TTS, tracking tilted Single-axis. CK, control area.
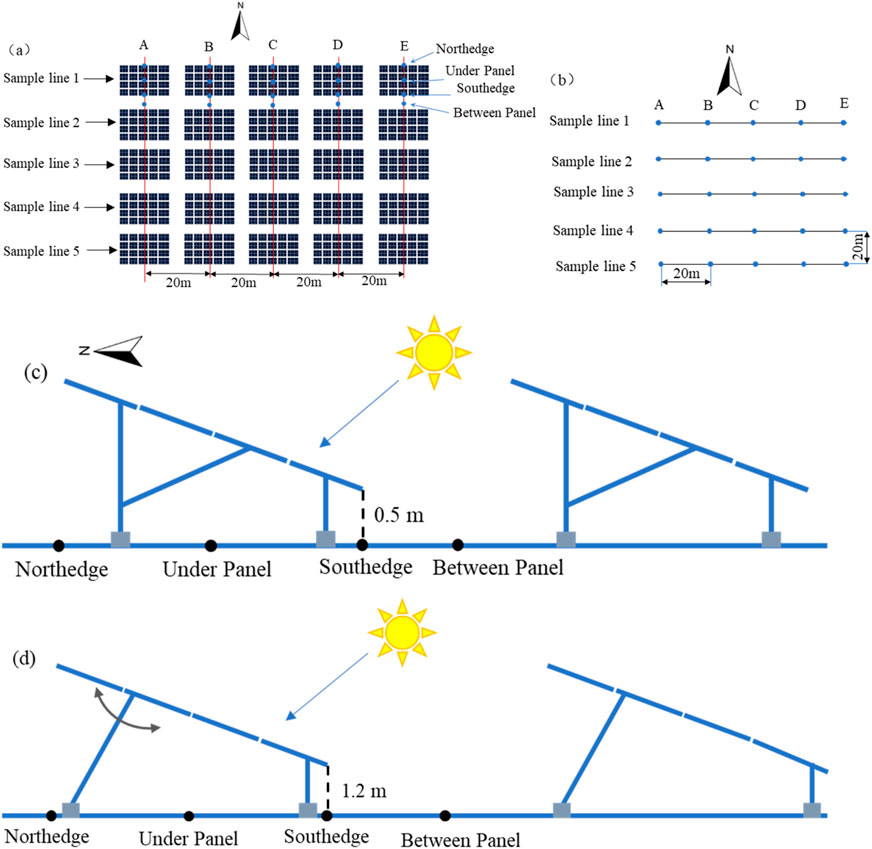
Figure 2. Soil sampling point layout diagram. (a) PV arrays. (b) CK. (c) Schematic detailing the sampling locations relative to the FIX PV panels. (d) Schematic detailing the sampling locations relative to the TTS PV panels.
The ground elevation of the PV plant is 2,900–2,950 m. The overall terrain is high in the west and low in the east, and the slope is not large. The climate in the region is predominantly a highland continental climate, with an annual rainfall of 246.3 mm and an average annual temperature of 4 °C. Local soil types mainly include calcic brown soil and calcite chestnut soil (Zhao and Na, 1996).
2.2 Soil sample collection
In July 2019, 6 years after the construction of the PV power plant, soil samples were collected. Five samples were taken from five rows of 20 m intervals along the east-west direction in the FIX and TTS PV arrays (Figure 2a). The sampling points were located on the south edge, north edge, under, and between PV panels (Figures 2c,d). Therefore, there were 100 sampling positions in the FIX and TTS PV arrays, respectively. The non-PV panel area at 400 m east of the TTS PV array area was used as the control area. The spacing of the east-west and north-south sampling points in the control area was 20 m (Figure 2b). There were 25 sampling points in the control area. Soil samples were collected from the 0–20 cm top soil layer mixed and bagged, air-dried, and brought back to the laboratory for physical and chemical properties. A total of 225 soil samples were collected.
2.3 Measurement of soil physicochemical properties
A total of 14 soil physicochemical indicators were measured. The indicators were monitored referencing the “analytical method of soil agriculture chemistry” (Lu, 2000). Bulk density was measured by ring knife method, and pH was measured by potentiometric method. TN was measured by the concentrated sulfuric acid-catalyst-flow analyzer method. TP was measured based on the sodium hydroxide melting-molybdenum antimony colorimetric method. TK was measured by the sodium hydroxide melting-flame photometric method. TC was measured by the combustion method. SOC was measured using potassium dichromate combined with the heating method. AK was measured by the ammonium acetate-flame photometric method. AP was measured by the molybdenum antimony anti-colorimetric method. AN was measured by the alkaline hydrolysis diffusion method. Mechanical composition was measured using a laser particle sizer (Malvern, model 2000), and SWC was measured in situ with a WET instrument (Delta-T, WET-2).
2.4 Calculation of the soil quality index (SQI)
The data of the 14 soil physicochemical indicators measured were standardised and the indicators were converted to values between 0 and 1 using the linear scoring function method. Indicators were categorized into two types based on the sensitivity of soil quality. If the indicator is positively correlated with soil quality, the “more is better” scoring model applies, i.e., Equation 1. Conversely, the “less is better” scoring model, Equation 2, applies.
Where SL is the linear score of each indicator between 0 and 1; x is the measured value; xmax and xmin are the maximum and minimum values of the indicator, respectively.
The weight of each indicator is calculated by principal component analysis. The calculation method is detailed in Yue et al. (2024). The results were shown in Supplementary Tables 1–9. The SQI is calculated according to Equation 3:
Where Wi is the weight value of each quality factor, n is the total number of indicators, Si is a linear score. The SQI ranges from 0 to 1, with higher SQI indicating higher soil quality.
2.5 Calculation of the soil multifunctionality index (MFI)
The multifunctionality of soils reflects the cycling of carbon, nitrogen, and phosphorus, as well as the supply capacity of the resources available to the soil (Manning et al., 2018). MFI was calculated based on the measured 14 soil physicochemical indicators. MFI was calculated by the mean value method, and the measured values of different functions were transformed and averaged. Finally, the representative index of functional average level, namely, the soil multifunctional index, was obtained. The MFI calculation formula is as shown in Equation 4:
Where F is the number of functions measured, fi is the measured value of function i, ri is the mathematical function that transforms fi into a positive function, and g is the normalization function.
2.6 Statistical analysis
SPSS 25.0 software was used to perform one-way ANOVA, principal component analysis, and significance tests. Origin 2021 software was used for graphing.
3 Results
3.1 Characteristics of soil basic physicochemical properties
The soil BD in the south edge, north edge, under, and between panels of TTS PV panels was significantly (p < 0.001) higher than that in the control area. They were 3.14%, 3.11%, 3.38% and 2.90% higher, respectively. Whereas, the BD of the FIX PV panels was not significantly different (p > 0.05) from the control area. The soil BD of the two PV panels was significantly (p < 0.05) different only at the southern edge, under and between the panels, whereas there was no significant difference (p > 0.05) at the northern edge (Figure 3a).
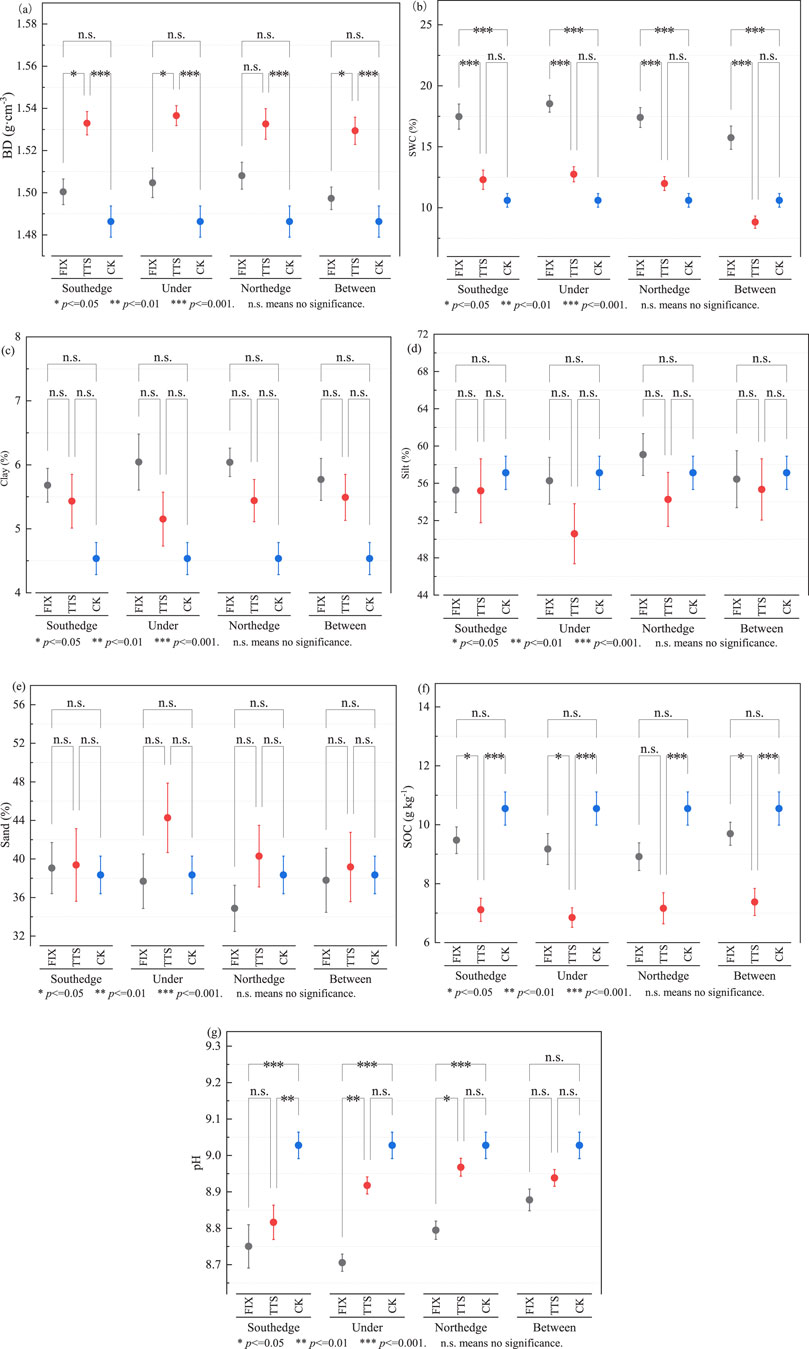
Figure 3. Results of analyses of soil basic physicochemical properties at different locations of PV panels. (a) Bulk density (BD), (b) soil water content (SWC), (c) clay, (d) silt, (e) sand, (f) soil organic carbon (SOC). (g) pH. FIX, fixed-axis PV panels. TTS, tracking tilted Single-axis PV panels. CK, control area.
SWC of the FIX PV panels was significantly (p < 0.001) higher than that of the TTS PV panels and the control area. SWC of the FIX PV panels increased by 64.81%, 64.12%, 74.74%, and 48.49% at the south edge, north edge, under, and between PV panels, respectively, compared with the control area (Figure 3b).
There was no significant difference (p > 0.05) in soil clay, silt, and sand content among FIX PV, TTS PV panels, and control area (Figures 3c–e).
SOC at the south edge, north edge, under and between TTS PV panels was significantly (p < 0.001) lower than that of the control area by 32.57%, 32.10%, 35.07% and 30.06%, respectively. While the SOC of FIX PV panels was not significantly different (p > 0.05) from the control area. SOC at the southern edge, under and between TTS PV panels was significantly (p < 0.05) decreased by 24.93%, 25.35%, and 23.88% compared to the FIX PV panels (Figure 3f).
Soil pH at the south edge, north edge, and under FIX PV panels was significantly (p < 0.05) decreased by 3.07%, 2.58% and 3.57% compared to the control area. Soil pH between panels with FIX and TTS PV was not significantly different (p > 0.05) from the control area (Figure 3g).
3.2 Soil total nutrient properties
TC content in the south edge and under the TTS PV panel was significantly (p < 0.01) decreased by 29.03% and 29.62% compared to the control area, and the north edge was significantly (p < 0.05) decreased by 27.94%. There was no significant (p > 0.05) difference in FIX PV panels (Figure 4a).
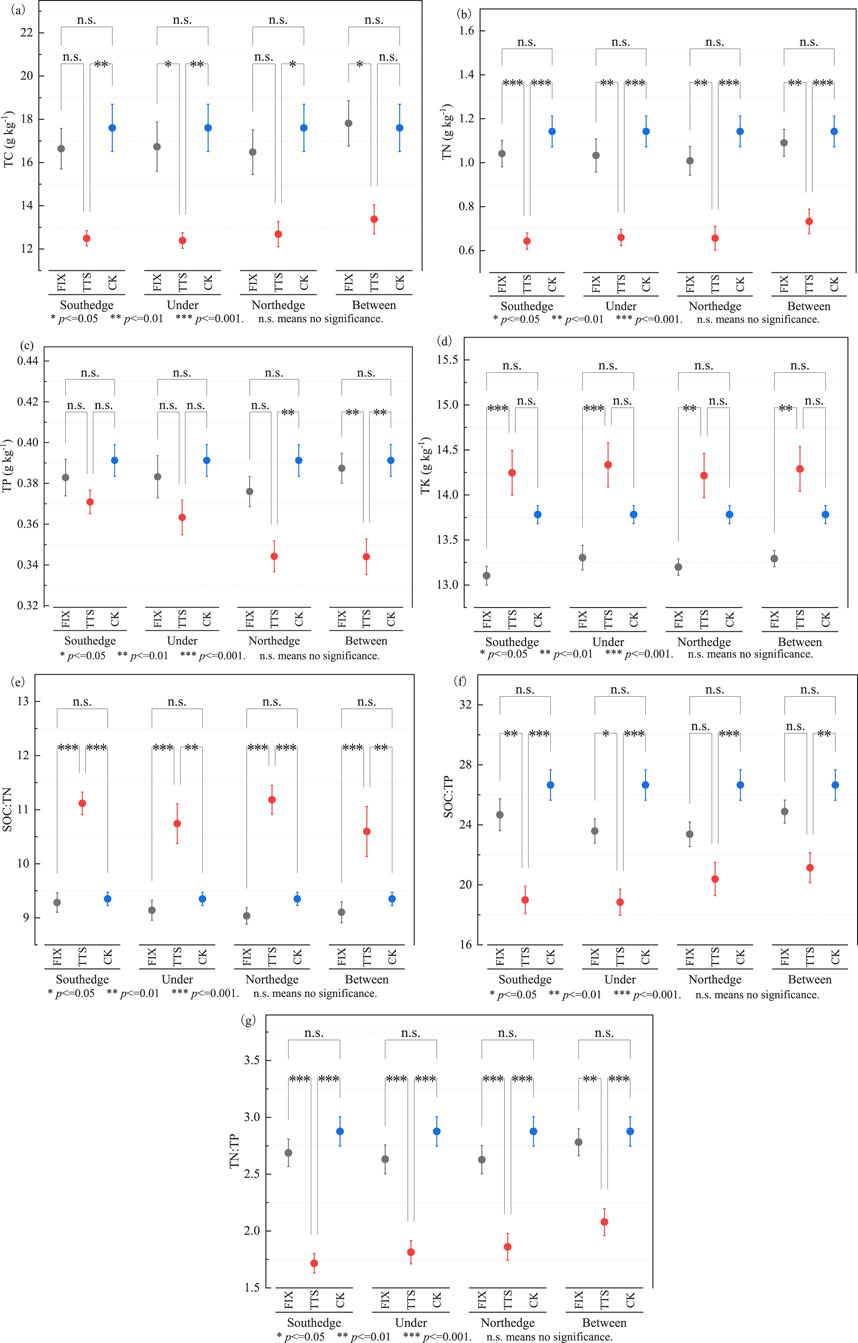
Figure 4. Results of analyses of soil total nutrient properties at different locations of PV panels. (a) Total carbon (TC), (b) total nitrogen (TN), (c) total phosphorus (TP), (d) total potassium (TK), (e) C: N ratio (SOC: TN), (f) C: P ratio (SOC: TP), (g) N:P ratio (TN: TP).
TN content of the south edge, north edge, under and between TTS PV panels was significantly lower (p < 0.001) than that in the control area, which was reduced by 43.71%, 42.56%, 42.27%and 35.86%, respectively. Whereas, there was no significant difference (p > 0.05) in the FIX PV panels. TN content of TTS PV panels was significantly decreased by 38.25% (p < 0.001) in the south edge, and by 34.93%, 36.14%, and 32.80% (p < 0.01) in the north edge, under and between panels, respectively, compared to that of the FIX PV (Figure 4b).
TP content was significantly reduced by 12.02% and 12.06% only in the north edge and between TTS PV panels compared with the control area. There was no significant difference (p > 0.05) between the FIX PV panels (Figure 4c).
TK content in FIX PV and TTS PV panels was not significantly different (p > 0.05) from that of the control area, whereas TK content in the south edge and under the FIX PV panels was significantly lower (p < 0.001) than that of TTS PV, and in the north edge and between the panels was significantly lower (p < 0.01) by 7.15%, and by 6.97%, respectively (Figure 4d).
SOC: TN of the TTS PV panels was significantly increased (p < 0.001) than that in the control area (Figure 4e), SOC: TP (except between panels), and TN: TP was significantly decreased (p < 0.001), while the FIX PV panel had no significant difference (p > 0.05) (Figures 4f,g).
3.3 Soil available nutrient properties
Compared with the control area, the south edge of the TTS PV panel significantly increased AP (p < 0.05, +27.56%), and AN was significantly reduced (p < 0.05, −27.97%). AN under the panel and the north edge were significantly reduced (p < 0.01) by 32.86% and 30.12%, and there was no significant difference (p > 0.05) in AK. There was no significant difference (p > 0.05) in AP, AK, and AN between the FIX PV panels and the control area (Figure 5).
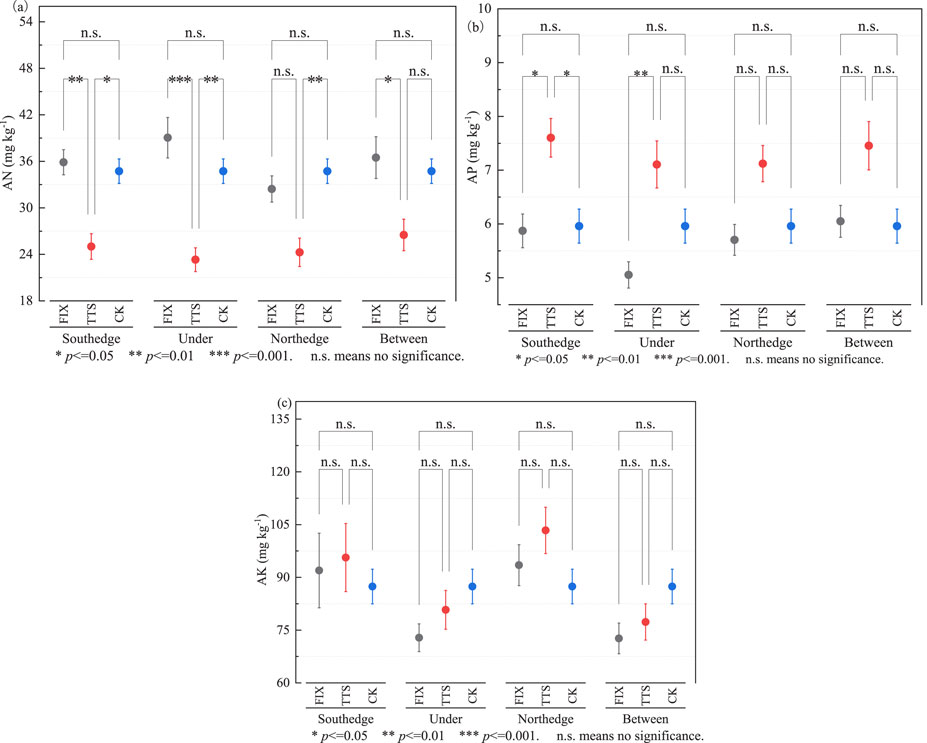
Figure 5. Results of analyses of soil available nutrient properties at different locations of PV panels. (a) Available nitrogen (AN), (b) available phosphorus (AP) and (c) available potassium (AK).
3.4 Soil quality and multifunctionality assessment
3.4.1 Principal component analysis
Principal component analysis (PCA) was conducted on 14 indicators (S1-S9). The results indicate that three principal components can be extracted for soil indicators at the north edge of the TTS panels (S6), between FIX panels (S7), and between TTS PV panels (S8), with cumulative contribution rates of 76.864%, 74.421%, and 74.771% respectively. Meanwhile, soil indicators from the remaining locations can be extracted into four principal components, with cumulative contribution rates exceeding 80.342%, effectively representing the variation information of the indicator variables. This demonstrates that the extracted components effectively represent the variation in the indicator variables. In the first principal component, BD at the southern edge of the TTS PV panel (S2) and under TTS PV panels (S4) has a higher weight, whereas TN at other locations has a higher weight. In the second principal component, the sand indicator demonstrates higher weighting at the following locations: under TTS PV panels (S4), north edge of the TTS PV (S6), between TTS PV (S8), and control area (S9).
The weights of soil quality evaluation indexes at different locations were obtained by PCA (Figure 6), and the weights were between 0.0712 and 0.0715, with little difference.
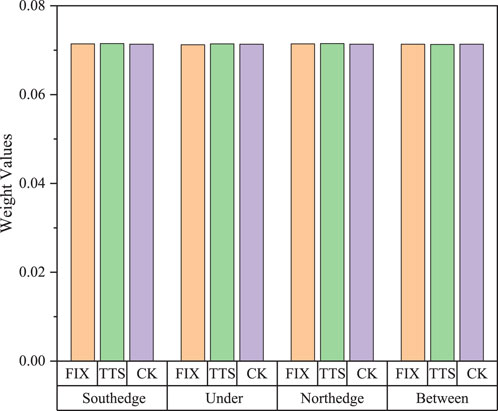
Figure 6. The average weight value of soil quality evaluation index at different locations.
3.4.2 Soil quality and multifunctionality index
Changes in soil physicochemical properties directly affect soil fertility and plant growth. There was no significant difference (p > 0.05) in SQI and MFI between the FIX PV panel, the TTS PV panel, and the control area (Figure 7). The SQI of FIX PV panels was higher in the south edge than in the control area, and the MFI was higher in the control area than in other locations. The SQI of the TTS PV panel was higher in the south edge and under the panel than in the control area, and the MFI was higher under the panel than in the control area.
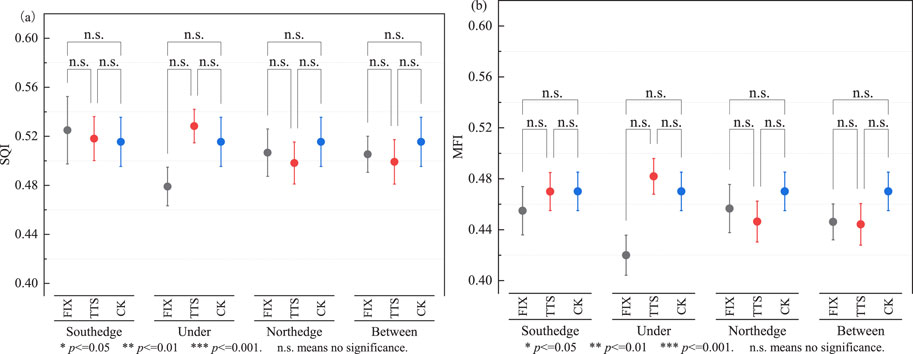
Figure 7. Soil quality and multifunctionality index. (a) Soil quality index (SQI) at different locations of PV panels. (b) Soil multifunctionality index (MFI) at different locations of PV panels.
Regression analysis of SQI and MFI showed a significant positive correlation (R2 > 0.89) (Figure 8).
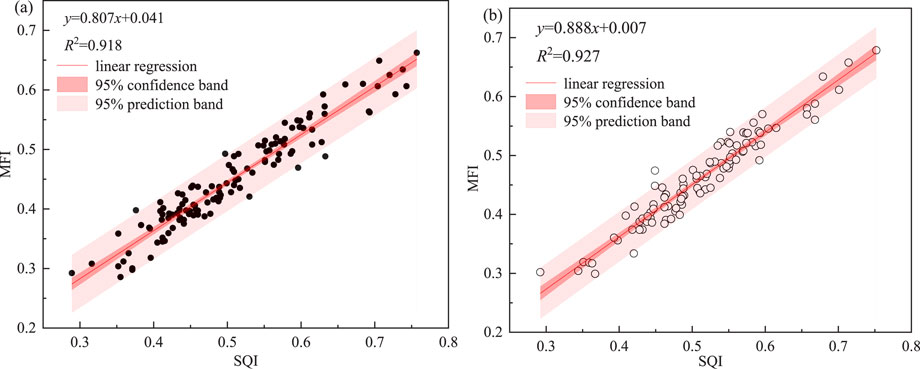
Figure 8. The linear model of SQI and MFI. (a) FIX PV panels. (b) TTS PV panels.
4 Discussion
4.1 Effect of PV panels on soil physicochemical properties
In this study, soil BD of TTS PV panels increased significantly, while there was no significant difference in FIX PV panels (Figure 3A). This may be due to the shading effect of PV panels will reduce soil moisture evaporation, enhance soil water retention capacity, reduce porosity, and increase BD (Zhang et al., 2021). In addition, PV panels cause uneven distribution of precipitation, and uneven precipitation affects BD differently, as concentrated precipitation causes soil erosion and increases bulk density (Wang Y. et al., 2021; Zhang et al., 2020; Dvoráčková et al., 2024). If the soil is located in arid regions, the addition of water can lead to a decrease in BD, as moisture helps to loosen the bond between soil particles, thereby increasing the gaps between them. This decrease in soil density enhances water and air permeability, positively impacting plant growth and other biological processes within the soil (Pan et al., 2020).
In this study, SWC of the FIX PV panel was significantly higher than that of the control area and the TTS PV panel (Figure 3b). The main reason was that the FIX PV panel had a relatively large shading area and reduced soil water evaporation. In contrast, tracking PV systems were found to increase SWC in the Zhangjiakou PV power plant at the southern edge of the typical temperate grassland in Inner Mongolia, China, but the increase was not significant for fixed PV systems (Zhang S. et al., 2024). The presence of PV panels concentrates water along their lower edges, resulting in great heterogeneity in the spatial distribution of soil moisture (Choi et al., 2023), and soil moisture heterogeneity may have an important effect on plant growth, especially in arid regions where small changes in water availability may have a large impact on plant growth (D’Odorico et al., 2007). Compared with the fixed PV system, the east/west (E/W) agricultural PV design for vertical bifacial solar panels provides better spatial uniformity in the daily crop shading distribution of crops, providing higher crop yield and greater energy production (Riaz et al., 2021).
The pH of the FIX PV panels in this study was generally reduced (Figure 3g). Shading by PV panels lowers soil temperatures and slows down the rate of biological processes in the soil, such as organic matter decomposition and nutrient mineralization. With the slow decomposition of organic matter, humic and fulvic acid, and other acidic substances are released, which can reduce soil pH (Wang C. et al., 2021). Soil pH decreased by 13.93% at the Datong saline-alkali PV power plant in China (Yi, 2020).
The TN, TC, and SOC contents of FIX PV panels were higher than those of TTS PV panels at all locations in this study (Figures 4a,b,e). While soil TN and TC content in Zhangjiakou PV power plant at the southern edge of the typical temperate grassland in Inner Mongolia, China was significantly higher in the tracking tilted PV system. And soil TN, TC, and SOC contents were significantly lower in the fixed system (Zhang S. et al., 2024). The rotation of the tracking tilted PV system allows plants to capture more light and increase litter, thereby further increasing biomass accumulation and improving soil nutrients. In the desert grassland PV power plant on the southern margin of the Mu Us Sandy Land, it was also found that SOC under the flat single-axis tracking PV panel was significantly higher than that under the fixed adjustable tracking PV panel (Tong et al., 2024). In the Hongsibu PV power plant in Ningxia, it was found that the SOC under and in front of the PV panel increased, and the PV panel had a positive impact on the carbon sink of arid and semi-arid ecosystems (Liu et al., 2023). Since the topsoil was removed during the PV construction process, the carbon and nitrogen contents in the PV soil were still lower than those in the control area after 7 years of vegetation restoration in a non-vegetated PV power plant in Colorado, United States (Choi et al., 2023). In addition, studies on PV power plants in Malaysia have shown that significant changes in microclimate characteristics cannot affect the physical and chemical properties of the soil (Noor and Reeza, 2022).
In this study, SOC: TP and TN: TP were significantly reduced at all positions of the TTS PV panel (Figures 4f,g), which may be due to the improvement of soil moisture conditions promoting plant growth and increasing biomass and litter input, which further altered the soil C/N and N/P ratios (Hume et al., 2016). On the other hand, if precipitation infiltration is too intensive, it may lead to soil nutrient leaching and loss of organic matter, which may also lead to changes in soil C/N ratios (Brust, 2019).
In this study, soil AP significantly increased in the south edge of TTS PV panels, AN significantly decreased under and between panels, and there was no significant difference in AK (Figure 5). PV panels change the distribution of precipitation and affect soil moisture, nitrogen, and phosphorus availability (Uldrijan et al., 2023). TTS PV panels promoted biomass accumulation and grassland restoration (Zhang S. et al., 2024), potentially reducing AN. In contrast, the desert grassland PV plant at the southern edge of the Mu Us Sandy Land showed that soil NO3-N, AP and AK content did not change significantly under panels, between panels and at the control site (Tong et al., 2024), The reason may be that in the aeolian sandy soil, the content of these available nutrients is very low, and the degree of disturbance under and between the panels is not enough to have an impact on the content of these available nutrients, and also because the time for natural restoration is only 2 years, so the content of the soil available nutrients changes have not yet been observed.
4.2 Soil quality in PV power plant
There is no significant difference in SQI and MFI between FIX PV panels and TTS PV panels in this study (Figure 7). It may be due to the fact that the mean value method was used to calculate the MFI in this study. While this method is straightforward to calculate and widely used, it fails to reflect the differing weightings of each individual function. SQI is greater than the control area for the south edge of FIX PV panels, and greater than the control area for the south edge and under panels of TTS PV. MFI is less than the control area for the FIX PV panels at all locations, and TTS PV with the south edge and under the panels is higher than the control area. MFI is lower than the control area for FIX PV panels at all locations, and higher than the control area for the under and south edge of the panels with TTS PV. This may be due to the fact that the tracking PV panel has a dynamic change in the precipitation redistribution at the southern edge of the PV panel, and there are also differences in the light and heat distribution. The influence of TTS PV panels on microclimate and soil is more complicated than that of FIX PV panels (Suuronen et al., 2017). Soil quality of tracking flat single-axis PV panels in a typical sandy PV plant in western Inner Mongolia was higher than that of the control area, with higher soil quality between PV panels, before and after the panels, and lower soil quality under the panels (Yuan and Gao, 2024). The soil quality between and under the flat single-axis tracking PV panels in the desert grassland on the southern edge of the Mu Us Sandy Land is better than that of the fixed PV panel (Tong et al., 2024). Yunnan agro-PV plant showed that planting crops significantly improved the soil quality and versatility index (Luo et al., 2024). In rocky desertification PV power plants, different degrees of shading by PV panels had no significant effect on the SQI (Wu et al., 2023). Similarly, agricultural PV systems in the Mediterranean environment of the Puglia region (Italy), the land equivalence ratio was improved and without negative impacts on biological soil quality (Riaz et al., 2021). The SQI in Mediterranean PV power plants is about three times lower than that of semi-natural land (Lambert et al., 2021a), and the main reason for the decrease in soil quality is the increase in soil erosion due to the disturbance of the soil during the construction period, the decrease in soil compaction (Quinton et al., 2010) and organic matter content, and consequently the decrease in the soil’s water-holding capacity (Mujdeci et al., 2017) and stability (Šimansk’y et al., 2013).
5 Conclusion
The environmental heterogeneity of different shading positions of PV panels affected soil physicochemical properties to different degrees. FIX PV panels showed a significant increase in SWC, which was very beneficial to vegetation restoration in the desert area. There was no significant difference in soil quality and soil multifunctionality index between the two types of PV panels. The high efficiency of tracking PV arrays in electricity generation also contributes to a more uniform distribution of sunlight and moisture. In the future, as we face arid climates and increasing land scarcity, the combination of tracking PV technology and agriculture holds great potential.
Data availability statement
The original contributions presented in the study are included in the article/Supplementary Material, further inquiries can be directed to the corresponding author.
Author contributions
SY: Conceptualization, Writing – original draft. MG: Conceptualization, Writing – review and editing. BY: Conceptualization, Writing – review and editing. DY: Supervision, Writing – review and editing. HM: Supervision, Writing – review and editing. WB: Data curation, Writing – review and editing.
Funding
The author(s) declare that financial support was received for the research and/or publication of this article. This research was supported by the Kunlun Talent, High-end Innovation and Entrepreneurship Talents Program of Qinghai Province, Qinghai University Youth Fund (2024-QGY-9), the Natural Science Foundation of Technology Department of Qinghai Province (Grant No. 2025-ZJ-976Q), the Qinghai University Research Ability Enhancement Project (2025KTST07), and SPIC Huanghe Hydropower Development Co.,LTD. Scientific Research Project (KY-C-2024-GF04, KY-C-2025-HB05).
Conflict of interest
Authors DY and HM were employed by Qinghai Huanghe Hydropower Development Co.,LTD.
The remaining authors declare that the research was conducted in the absence of any commercial or financial relationships that could be construed as a potential conflict of interest.
Generative AI statement
The author(s) declare that no Generative AI was used in the creation of this manuscript.
Any alternative text (alt text) provided alongside figures in this article has been generated by Frontiers with the support of artificial intelligence and reasonable efforts have been made to ensure accuracy, including review by the authors wherever possible. If you identify any issues, please contact us.
Publisher’s note
All claims expressed in this article are solely those of the authors and do not necessarily represent those of their affiliated organizations, or those of the publisher, the editors and the reviewers. Any product that may be evaluated in this article, or claim that may be made by its manufacturer, is not guaranteed or endorsed by the publisher.
Supplementary material
The Supplementary Material for this article can be found online at: https://www.frontiersin.org/articles/10.3389/fenvs.2025.1673993/full#supplementary-material
References
Adeh, E. H., Selker, J. S., and Higgins, C. W. (2018). Remarkable agrivoltaic influence on soil moisture, micrometeorology and water-use efficiency. PLoS One 13, e0203256. doi:10.1371/journal.pone.0203256
Andrew, A., Hain, L., Barter, J., Goldberg, Z., Desario, A., Antoszewski, K., et al. (2024). “Sheep grazing impacts on soil health and pasture quality at commercial solar sites in northeastern USA: solar sheep grazing and site conditions”, in AgriVoltaics conference proceedings.
Bai, Z., Jia, A., Bai, Z., Qu, S., Zhang, M., Kong, L., et al. (2022). Photovoltaic panels have altered grassland plant biodiversity and soil microbial diversity. Front. Microbiol. 13, 1065899. doi:10.3389/fmicb.2022.1065899
Brust, G. E. (2019). “Management strategies for organic vegetable fertility”, in Safety and practice for organic food (Elsevier), 193–212.
Choi, C. S., Cagle, A. E., Macknick, J., Bloom, D. E., Caplan, J. S., and Ravi, S. (2020). Effects of revegetation on soil physical and chemical properties in solar photovoltaic infrastructure. Front. Environ. Sci. 8, 140. doi:10.3389/fenvs.2020.00140
Choi, C. S., Macknick, J., Li, Y., Bloom, D., McCall, J., and Ravi, S. (2023). Environmental Co-benefits of maintaining native vegetation with solar photovoltaic infrastructure. Earth’s Futur 11, e2023EF003542. doi:10.1029/2023EF003542
Dvo\vráčková, H., Dvo\vráček, J., Vlček, V., and R\uužička, D. (2024). Are the soils degraded by the photovoltaic power plant? Cogent Food \& Agric. 10, 2294542. doi:10.1080/23311932.2023.2294542
D’Odorico, P., Caylor, K., Okin, G. S., and Scanlon, T. M. (2007). On soil moisture--vegetation feedbacks and their possible effects on the dynamics of dryland ecosystems. J. Geophys. Res. Biogeosciences 112, G4. doi:10.1029/2006jg000379
Geissen, V., Wang, S., Oostindie, K., Huerta, E., Zwart, K. B., Smit, A., et al. (2013). Effects of topsoil removal as a nature management technique on soil functions. Catena 101, 50–55. doi:10.1016/j.catena.2012.10.002
Graham, M., Ates, S., Melathopoulos, A. P., Moldenke, A. R., DeBano, S. J., Best, L. R., et al. (2021). Partial shading by solar panels delays bloom, increases floral abundance during the late-season for pollinators in a dryland, agrivoltaic ecosystem. Sci. Rep. 11, 7452. doi:10.1038/s41598-021-86756-4
Hume, A., Chen, H. Y. H., Taylor, A. R., Kayahara, G. J., and Man, R. (2016). Soil C: N: P dynamics during secondary succession following fire in the boreal forest of central Canada. For. Ecol. Manage. 369, 1–9. doi:10.1016/j.foreco.2016.03.033
IEA (2024). “Renewables 2023”,. Paris. Available online at: https://www.iea.org/reports/renewables-2023.
Lambert, Q., Bischoff, A., Cluchier, A., Cueff, S., and Gros, R. (2021a). Effects of solar parks on soil quality, CO2 effluxes and vegetation under Mediterranean climate. Authorea Prepr. doi:10.22541/au.162300877.73953918/v1
Lambert, Q., Bischoff, A., Cueff, S., Cluchier, A., and Gros, R. (2021b). Effects of solar park construction and solar panels on soil quality, microclimate, CO2 effluxes, and vegetation under a Mediterranean climate. L. Degrad. \and Dev. 32, 5190–5202. doi:10.1002/ldr.4101
Li, C., Liu, J., Bao, J., Wu, T., and Chai, B. (2023). Effect of light heterogeneity caused by photovoltaic panels on the plant--soil--microbial system in solar park. Land 12, 367. doi:10.3390/land12020367
Li, Y., Armstrong, A., Simmons, C., Krasner, N. Z., and Hernandez, R. R. (2025). Ecological impacts of single-axis photovoltaic solar energy with periodic mowing on microclimate and vegetation. Front. Sustain 6, 1497256. doi:10.3389/frsus.2025.1497256
Liu, Z., Peng, T., Ma, S., Qi, C., Song, Y., Zhang, C., et al. (2023). Potential benefits and risks of solar photovoltaic power plants on arid and semi-arid ecosystems: an assessment of soil microbial and plant communities. Front. Microbiol. 14, 1190650. doi:10.3389/fmicb.2023.1190650
Liu, Y., Ma, S., Miao, Y., Liu, Y., Wei, S., Su, J., et al. (2025). Comparison of tracking and fixed photovoltaic systems for soil quality improvement in desert: a 5-year field study. Sci. Total Environ. 997, 180221. doi:10.1016/j.scitotenv.2025.180221
Lu, R. (2000). Analytical method of soil agriculture chemistry. Beijing, China: China Agricultural Science and Technology Press.
Lu, Z., Zhang, Q., Miller, P. A., Zhang, Q., Berntell, E., and Smith, B. (2021). Impacts of large-scale Sahara solar farms on global climate and vegetation cover. Geophys. Res. Lett. 48, e2020GL090789. doi:10.1029/2020gl090789
Lubitz, W. D. (2011). Effect of manual tilt adjustments on incident irradiance on fixed and tracking solar panels. Appl. Energy 88, 1710–1719. doi:10.1016/j.apenergy.2010.11.008
Luo, J., Luo, Z., Li, W., Shi, W., and Sui, X. (2024). The early effects of an agrivoltaic system within a different crop cultivation on soil quality in dry--hot valley eco-fragile areas. Agronomy 14, 584. doi:10.3390/agronomy14030584
Manning, P., Van Der Plas, F., Soliveres, S., Allan, E., Maestre, F. T., Mace, G., et al. (2018). Redefining ecosystem multifunctionality. Nat. Ecol. \and Evol. 2, 427–436. doi:10.1038/s41559-017-0461-7
Moscatelli, M. C., Marabottini, R., Massaccesi, L., and Marinari, S. (2022). Soil properties changes after seven years of ground mounted photovoltaic panels in Central Italy coastal area. Geoderma Reg. 29, e00500. doi:10.1016/j.geodrs.2022.e00500
Mujdeci, M., Simsek, S., and Uygur, V. (2017). The effects of organic amendments on soil water retention characteristics under conventional tillage system. Fresenius Environ. Bull. 26, 4075–4081.
Noor, N. F. M., and Reeza, A. A. (2022). Effects of solar photovoltaic installation on microclimate and soil properties in UiTM 50MWac Solar Park, Malaysia. IOP Conf. Ser. Earth Environ. Sci. 12031. doi:10.1088/1755-1315/1059/1/012031
Pan, H., Chen, M., Feng, H., Wei, M., Song, F., Lou, Y., et al. (2020). Organic and inorganic fertilizers respectively drive bacterial and fungal community compositions in a fluvo-aquic soil in northern China. Soil Tillage Res. 198, 104540. doi:10.1016/j.still.2019.104540
Quinton, J. N., Govers, G., Van Oost, K., and Bardgett, R. D. (2010). The impact of agricultural soil erosion on biogeochemical cycling. Nat. Geosci. 3, 311–314. doi:10.1038/ngeo838
Ramos-Fuentes, I. A., Elamri, Y., Cheviron, B., Dejean, C., Belaud, G., and Fumey, D. (2023). Effects of shade and deficit irrigation on maize growth and development in fixed and dynamic AgriVoltaic systems. Agric. Water Manag. 280, 108187. doi:10.1016/j.agwat.2023.108187
Riaz, M. H., Imran, H., Younas, R., and Butt, N. Z. (2021). The optimization of vertical bifacial photovoltaic farms for efficient agrivoltaic systems. Sol. Energy 230, 1004–1012. doi:10.1016/j.solener.2021.10.051
Šimansk’y, V., Bajčan, D., and Ducsay, L. (2013). The effect of organic matter on aggregation under different soil management practices in a vineyard in an extremely humid year. Catena 101, 108–113. doi:10.1016/j.catena.2012.10.011
Suuronen, A., Muñoz-Escobar, C., Lensu, A., Kuitunen, M., Guajardo Celis, N., Espinoza Astudillo, P., et al. (2017). The influence of solar power plants on microclimatic conditions and the biotic community in Chilean desert environments. Environ. Manage. 60, 630–642. doi:10.1007/s00267-017-0906-4
Tong, W., Yuanyuan, D., Jie, L., Jiena, L., Xiaozheng, W., and Zhenggang, G. (2024). Effects of different photovoltaic array construction on natural restoration of plant community and soil physicochemical properties in desert grassland. Pratacultural Sci., 1–13.
Uldrijan, D., Winkler, J., and Vaverková, M. D. (2023). Bioindication of environmental conditions using solar park vegetation. Environments 10, 86. doi:10.3390/environments10050086
Wang, T., Wang, D., Guo, T., Zhang, G., Zhao, S., Niu, H., et al. (2016). The impact of photovoltaic power construction on soil and vegetation. Res. Soil Water Conserv. 23, 90–94. doi:10.13869/j.cnki.rswc.2016.03.016
Wang, C., Morrissey, E. M., Mau, R. L., Hayer, M., Piñeiro, J., Mack, M. C., et al. (2021). The temperature sensitivity of soil: microbial biodiversity, growth, and carbon mineralization. ISME J. 15, 2738–2747. doi:10.1038/s41396-021-00959-1
Wang, Y., Zhang, Q., Majidzadeh, H., He, C., Shi, Q., Kong, S., et al. (2021). Depletion of soil water-extractable organic matter with long-term coverage by impervious surfaces. Front. Environ. Sci. 9, 714311. doi:10.3389/fenvs.2021.714311
Wu, C., Liu, H., Yu, Y., Zhao, W., Liu, J., Yu, H., et al. (2022). Ecohydrological effects of photovoltaic solar farms on soil microclimates and moisture regimes in arid Northwest China: a modeling study. Sci. Total Environ. 802, 149946. doi:10.1016/j.scitotenv.2021.149946
Wu, Z., Luo, Z., Luo, J., Sui, X., Wu, S., and Luo, X. (2023). Spatial differentiation of soil fertility in a photovoltaic power station in rocky desertification zone. Chin. J. Ecol. 42, 2597–2603. doi:10.11829/j.issn.1001-0629.2024-0089
Xia, Z., Li, Y., Zhang, W., Chen, R., Guo, S., Zhang, P., et al. (2022). Solar photovoltaic program helps turn deserts green in China: evidence from satellite monitoring. J. Environ. Manage. 324, 116338. doi:10.1016/j.jenvman.2022.116338
Xia, Z., Li, Y., Zhang, W., Guo, S., Zheng, L., Jia, N., et al. (2023). Quantitatively distinguishing the impact of solar photovoltaics programs on vegetation in dryland using satellite imagery. L. Degrad. \and Dev. 34, 4373–4385. doi:10.1002/ldr.4783
Yavari, R., Zaliwciw, D., Cibin, R., and McPhillips, L. (2022). Minimizing environmental impacts of solar farms: a review of current science on landscape hydrology and guidance on stormwater management. Environ. Res. Infrastruct. Sustain. 2, 032002. doi:10.1088/2634-4505/ac76dd
Yi, L. (2020). Effects of photovoltaic power station on two typical degraded ecosystems in northern Shanxi Province. Shanxi: Shanxi University of Finance and Economics.
Yuan, J., and Gao, Y. (2024). Spatial differentiation characteristics of soil nutrients in sand area tracking photovoltaic array area. J. Agric. Sci. Technol., 1–10.
Yue, S., Guo, M., Yuan, B., and Zhao, Q. (2024). Large-scale photovoltaic farms in the Qinghai desert: soil quality assessment methods. Environ. Eng. Sci. 41, 251–259. doi:10.1089/ees.2023.0290
Zhang, Z., Teng, C., Zhou, K., Peng, C., and Chen, W. (2020). Degradation characteristics of dissolved organic matter in nanofiltration concentrated landfill leachate during electrocatalytic oxidation. Chemosphere 255, 127055. doi:10.1016/j.chemosphere.2020.127055
Zhang, D., Gong, C., Zhang, W., Zhang, H., Zhang, J., and Song, C. (2021). Labile carbon addition alters soil organic carbon mineralization but not its temperature sensitivity in a freshwater marsh of Northeast China. Appl. Soil Ecol. 160, 103844. doi:10.1016/j.apsoil.2020.103844
Zhang, B., Zhang, R., Li, Y., Wang, S., Zhang, M., and Xing, F. (2024). Deploying photovoltaic arrays in degraded grasslands is a promising win-win strategy for promoting grassland restoration and resolving land use conflicts. J. Environ. Manage. 349, 119495. doi:10.1016/j.jenvman.2023.119495
Zhang, S., Gong, J., Zhang, W., Dong, X., Hu, Y., Yang, G., et al. (2024). Photovoltaic systems promote grassland restoration by coordinating water and nutrient uptake, transport and utilization. J. Clean. Prod. 447, 141437. doi:10.1016/j.jclepro.2024.141437
Zhang, S., Gong, J., Wang, R., Zheng, K., Zhang, W., Dong, X., et al. (2025). Improving the microenvironment of tracking photovoltaic systems promotes soil organic carbon accumulation by mediating plant carbon inputs and microbial necromass retention. J. Environ. Manage. 388, 125937. doi:10.1016/j.jenvman.2025.125937
Keywords: desert area, large-scale PV power plant, soil properties, soil quality index, multifunctionality index
Citation: Yue S, Guo M, Yuan B, Ye D, Ma H and Bai W (2025) Spatial variability characteristics of soil physicochemical properties in fixed-axis and tracking tilted single-axis photovoltaic panels in qinghai desert areas. Front. Environ. Sci. 13:1673993. doi: 10.3389/fenvs.2025.1673993
Received: 27 July 2025; Accepted: 17 September 2025;
Published: 07 October 2025.
Edited by:
Qiang Li, University of Houston–Downtown, United StatesReviewed by:
Jianhua Xiao, Chinese Academy of Sciences (CAS), ChinaPankaj Kumar Sharma, Birla Institute of Technology and Science, India
Ferdinand J. Dina Ebouel, Botswana International University of Science and Technology, Botswana
Copyright © 2025 Yue, Guo, Yuan, Ye, Ma and Bai. This is an open-access article distributed under the terms of the Creative Commons Attribution License (CC BY). The use, distribution or reproduction in other forums is permitted, provided the original author(s) and the copyright owner(s) are credited and that the original publication in this journal is cited, in accordance with accepted academic practice. No use, distribution or reproduction is permitted which does not comply with these terms.
*Correspondence: Mengjing Guo, Z3VvbWVuZ2ppbmcyNjNAMTYzLmNvbQ==