 Krupal Vidhyarthi1†
 Gautam Priyadarshi2†
 Bhakti Patel2Santosh Kumar Sahu2
 Esha Rami1*
 Dipak Kumar Sahoo3*
 Ashish Patel2*
- 1Department of Life Sciences, Parul Institute of Applied Science, Parul University, Vadodara, Gujarat, India
- 2Department of Life Sciences, Hemchandracharya North Gujarat University, Patan, Gujarat, India
- 3Department of Veterinary Clinical Sciences, College of Veterinary Medicine, Iowa State University, Ames, IA, United States
Pendimethalin (PND), a persistent dinitroaniline herbicide, poses significant ecological and human health risks due to its high stability, bioaccumulation, and toxicity. The present study explores microwave-assisted rapid synthesis of carbon nanospheres (CNSs) from Vachellia nilotica biochar (VNBC) for the removal of PND from an aqueous medium. The synthesized CNSs were characterized in detail using Fourier-transform infrared (FT-IR) spectroscopy, X-ray diffraction (XRD), scanning electron microscopy (SEM)–energy dispersive X-ray spectroscopy (EDS), Brunauer–Emmett–Teller (BET), and pHZPC to confirm the oxygen-rich functional groups, crystalline graphitic domains, spherical morphology, elemental composition, surface area, and surface charge. A batch adsorption study was conducted to evaluate the effect of initial concentration (30 mg L-1–70 mg L-1), contact time (0 min–150 min), dose (2.5 mg–20 mg), and solution pH (2–12) at room temperature. The maximum removal efficiency (95.8%) and adsorption capacity (76.95 mg g-1) were achieved at 50 mg L-1 PND, pH 10, and a 50 mg dose of CNSs. Adsorption kinetics followed a pseudo-second-order model in linear fitting, while non-linear modeling indicated the dominance of physisorption with intraparticle diffusion, indicating a hybrid mechanism. Isotherm studies showed the Langmuir and Freundlich models best describe the adsorption process, confirming monolayer–multilayer adsorption. Furthermore, the presence of multivalent salts enhanced the removal efficiency through strong ionic bridging interaction and higher regeneration capacity up to five cycles, demonstrating potential toward real-water applicability. Compared to the conventional adsorbent, CNSs exhibited superior performance with rapid synthesis (3 min) and higher capacity. These findings establish biochar-derived CNSs as a cost-effective, eco-friendly, and efficient adsorbent for pesticide remediation in contaminated waters.
1 Introduction
Pesticides are among the few toxins that are deliberately introduced into the environment to eliminate living organisms. Although the term “pesticide” broadly includes herbicides, fungicides, and other pest-control agents, it is often mistakenly used to refer exclusively to insecticides. The environmental consequences of pesticide application were predominantly highlighted in the landmark book “Silent Spring” by Rachel Carson in 1962, which argued that widespread use of pesticides poses significant threats to the environment (Rani et al., 2021). Additionally, multiple pesticides can interact through synergistic, antagonistic, or additive mechanisms, leading to combined effects that may enhance the toxicity. Therefore, research on the effects of pesticides on the environment has become essential to estimate their cumulative effects on the ecosystem (Madakka et al., 2017).
Pendimethalin (PND) is a dinitroaniline class of herbicide, which is chemically known as N-(1-ethylpropyl)-2,6-dinitro-3,4-xylidine (Swarcewicz and Gregorczyk, 2012). It has been registered and marketed for 30 years as an agricultural application in various countries across the globe, with the specific crops it is applied to varying according to regional agricultural practices and regulatory approvals. However, it is under review in the European Union (EU) due to environmental concerns, such as bioaccumulation and toxicity (Vighi et al., 2017). It is widely used as a herbicide to protect a variety of crops, including soybeans, corn, rice, vegetables, legumes, nuts, fruits, lawns, ornamental plants, and cereals such as wheat, barley, rye, and triticale. However, its mode of action involves disrupting division by interfering with chromosome separation and inhibiting cell-wall development, ultimately impairing plant growth (Tabassum et al., 2015). Due to its complex chemical structure, PND exhibits strong adsorption in soil but is difficult to desorb, leading to its persistence in the environment. It was reported to have a half-life of 90 days in soil (Rohit and Kailasa, 2017). Moreover, dinitroaniline herbicides, including PND, are toxic to aquatic organisms and non-targeted invertebrates. PND can also form nitrosamine derivatives, which are recognized as carcinogenic substances to humans (Acar et al., 2022). As a result, the United States Environmental Protection Agency (USEPA) classifies PND as a group-C human carcinogen. Environmental contamination may occur through foliar application, spray drift, rainfall-induced runoff, and leaching from treated soils into surface water bodies and groundwater (Abbassy et al., 2021). Consequently, the removal of PND from the contaminated ecosystem is necessary to improve quality of life. Various techniques have been used for the removal of pesticides from contaminated water, including coagulation, biological and photochemical degradation, chemical oxidation, and biosorption. Out of these methods, surface adsorption was found to be more suitable than other conventional methods (Zolgharnein et al., 2011).
Carbon-based materials are among the most widely used materials in scientific research and industrial applications. Carbon nanospheres (CNSs) are currently receiving global attention for their potential application in multiple fields (Saleh et al., 2025). Green synthesis approaches are increasingly emphasized in nanomaterial production due to their alignment with the principle of green chemistry, which advocates more environmentally friendly methods, relatively low temperatures, and the use of green solvents, thereby minimizing hazardous emissions. Therefore, it reduces the overall ecological footprint compared to that of high-temperature methods (Omoriyekomwan et al., 2021). Conventional methods such as chemical vapor deposition, sol–gel, and hydrothermal synthesis often require prolonged heating, high temperature, or toxic reagents, which increases both the cost and environmental footprint (Sanjeev et al., 2024). In contrast, microwave-assisted synthesis offers rapid, energy-efficient heating and uniform particle formation (Abdulwali et al., 2024). Microwave-assisted synthesis of CNSs has emerged as a promising and widely explored approach in the field of carbon materials (Devi et al., 2021).
Despite increasing concern regarding pendimethalin contamination, most reported adsorption substances, such as untreated agricultural wastes, activated carbons, and orange peel composites, exhibit limitations, including long synthesis time (6–24), low adsorption capacity (<30 mg g-1), and limited reusability (Ayuba and Nyijime, 2021b; Murtaza et al., 2024). Recent studies on nano-magnetized peels and biochar-derived adsorbents show promise, but they still require harsh conditions, costly precursors, or extensive activation steps (Nyijime et al., 2021a; Parveen et al., 2025). Therefore, there remains a critical need for rapid, sustainable, and low-cost adsorbents with higher efficiency under environmental conditions.
The novelty of the present study lies in the microwave-assisted synthesis of CNSs from Vachellia nilotica biochar (VNBC) using ferrocene as a catalyst, which is faster (within 3 min) and more eco-friendly than conventional carbonization and activation techniques. Furthermore, V. nilotica is an abundant and underutilized lignocellulosic resource, providing a high carbon yield with low ash content. Additionally, phyto-constitutes such as polyphenols and tannins may act as natural stabilizers and reducing agents, enhancing CNSs’ nucleation and stability. Ferrocene has been used as a catalyst for microwave-assisted synthesis of carbon nanomaterials by decomposing ferrocene under microwave irradiation, promoting the growth of carbon nanostructures, and enhancing surface reactivity (Baghel et al., 2022; Hidalgo et al., 2023).
The synthesized CNSs were systematically characterized and evaluated for PND removal under varying conditions of concentrations, contact time, dose, and pH. The real-world application potential was evaluated using ionic strength and regeneration capacity. Therefore, the objectives of the present study were (i) rapid microwave-assisted synthesis of CNSs from V. nilotica biochar and characterization of their structural and surface properties; (ii) evaluation of the adsorption performance for PND removal under different environmental conditions; (iii) investigation of the adsorption kinetics, isotherm behavior, and underlying mechanism; and (iv) comparison of the adsorption performance for PND removal with previously reported adsorbents, including synthesis time, efficiency, and sustainability. Overall, the present study demonstrates a cost effective, eco-friendly, and high-performance adsorbent for pesticide removal, contributing to sustainable water treatment.
2 Materials and methods
2.1 Materials
Vachellia nilotica (commonly known as gum acacia) root wood was collected from a local market in Patan, Gujarat, India. The biomass was washed thoroughly with deionized water to remove dust and soluble impurities and then dried in an oven at 80 °C for 24 h. The dried wood was ground and sieved to obtain a particle fraction of <500 μm, which was used as the precursor for biochar preparation. Analytical-grade chemicals, including ferrocene (Fe(C5H5)2) (purity 98%), ethanol (C2H5OH), magnesium carbonate (MgCO3), hydrochloric acid (HCl), potassium chloride (KCl), sodium hydroxide (NaOH), sodium chloride (NaCl), and calcium carbonate (CaCO3), were purchased from Sisco Research Laboratories (SRL) Pvt. Ltd. Mumbai, India. Pendimethalin (30% W/V), a dinitroaniline herbicide, was obtained from TATA Panida, India. The physico-chemical properties of PND are presented in Supplementary Table S1. A stock solution of PND (1,000 mg L-1) was prepared by diluting an appropriate amount of the commercial herbicide (30% w/v) in deionized water. This stock solution was diluted with deionized water to obtain the required working concentration (30 mg L-1–70 mg L-1) for all adsorption experiments.
2.2 Synthesis of biochar
The pretreated V. nilotica wood powder (<500 µm) was placed in a ceramic crucible with a lid to restrict oxygen supply. The crucible was transferred into a muffle furnace (PSI-HTMF2L) for pyrolysis. Pyrolysis was carried out at a heating rate of 10 °C min-1 from room temperature to 600 °C, which was then held for a dwell time of 2 h (residence time). After pyrolysis, the furnace was allowed to cool gradually to avoid thermal shock and moisture absorption. The resulting V. nilotica biochar was crushed, sieved (<200 µm), and stored in an airtight container for further application.
2.3 Microwave-assisted synthesis of carbon-nanospheres
To prepare CNSs, VNBC and ferrocene were mixed in a ratio of 1:0.5 (e.g., 150 mg VNBC and 75 mg ferrocene), as represented in Figure 1. The mixture was homogenized by dry mixing in an agate mortar for 10 min to ensure uniform blending of the solid precursors. No organic solvents or hazardous reagents were used, which is in line with the principles of green chemistry. The homogenized mixture was transferred into a 10 mL borosilicate glass vial and underwent microwave irradiation at 150 °C for 3 min. Following irradiation, the reaction product was washed three times with 60% ethanol (10 mL each wash) to remove unreacted ferrocene residues, and then it was filtered using Whatman filter paper no. 42. The washed material was re-dispersed in 60% ethanol and ultrasonicated for 10 min to prevent agglomeration. Finally, CNSs were dried in a hot air oven at 60 °C and stored in airtight containers for subsequent characterization and adsorption experiments.
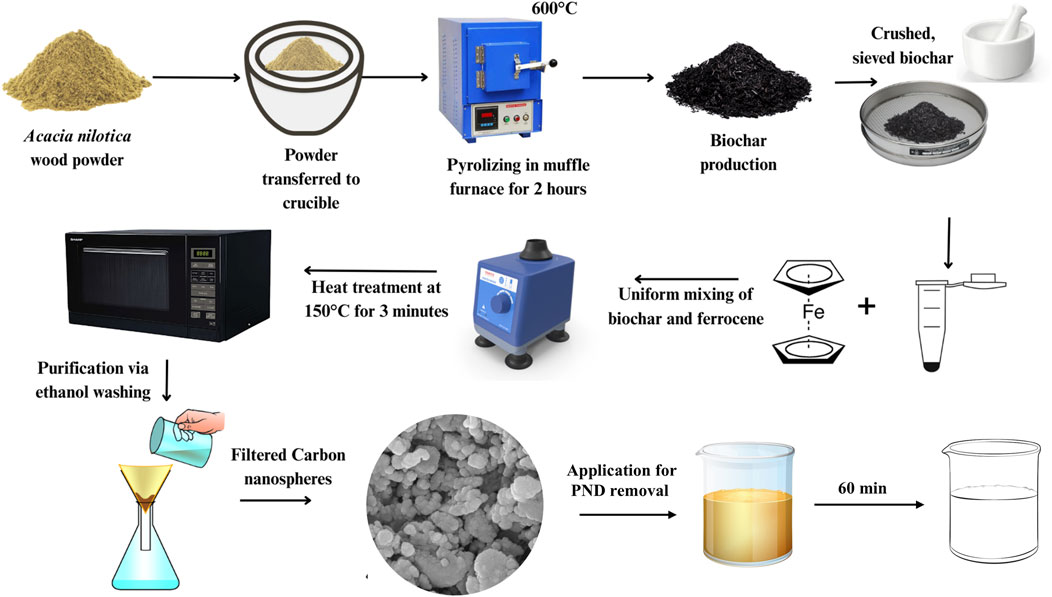
Figure 1. Representation of the synthesis of CNSs from Vachellia nilotica wood biochar.
2.4 Characterization of CNSs
The structural, morphological, and surface characterizations of CNSs were evaluated by multiple analytical techniques. Surface morphology and particle size were examined by scanning electron microscopy (SEM; The Nova NanoSEM, FEI 450) operated at 20 kV with gold sputter coating to enhance conductivity. Elemental composition was determined using energy dispersive X-ray spectroscopy (EDS) attached to the scanning electron microscope. X-ray diffraction (XRD; Advanced D-8 Bruker, Netherlands) was performed between 3° and 90° 2Ɵ values. Fourier-transform infrared spectroscopy (FT-IR; PerkinElmer S6500 spectrum instrument) was conducted in the range of 550 cm-1–4,000 cm-1 to identify CNSs’ functional groups. Surface area and porosity measurements of CNSs were determined by nitrogen adsorption and desorption isotherms at 77 K using a Brunauer–Emmett–Teller (BET) analyzer (Anton Paar, Autosorb iQ-C-XR-XR-XR). The BET method was applied to calculate the surface area, while the pore size distribution and pore volume were derived using the Barrett–Joyner–Halenda (BJH) method. The point zero charge (pHZPC) was determined using the pH drift method, in which CNSs were equilibrated with various pH solutions: 2, 4, 6, 8, 10, and 12. The pH solutions were prepared using 0.1 M and 0.01 M NaOH and HCl. The difference between the initial and final pH was used to determine the pHZPC (Thacker et al., 2023).
2.5 Adsorption studies: effect of operational parameters, kinetics, and isotherms
The PND removal studies were conducted in 50 mL of PND at various concentrations, including 30, 40, 50, 60, and 70 mg L-1, with 50 mg of CNSs added to each conical flask. The solutions were mechanically stirred at 250 rpm using a magnetic stirrer. Aliquots (2 mL) were taken out at intervals of 0, 30, 60, 90, 120, and 150 min to measure the optical density (OD) using a Labman UV–VIS double-beam spectrophotometer—LMSPUV1900. The removal efficiency and adsorption of CNSs for PND herbicide were calculated using Formulas 1, 2. The adsorption kinetics were examined by pseudo first-order (PFO), pseudo second-order (PSO), and intra-particle diffusion models, while the isotherms were evaluated by the Langmuir, Freundlich, and Temkin models; their linear and non-linear expressions and parameters are listed in Supplementary Table S2.
Here, C0 represents the initial PND concentration in mg L-1; Ce represents the final PND concentration in mg L-1 at equilibrium; W represents the dry weight of CNSs in g; and V represents the PND solution volume in L.
The effect of pH solution on PND removal was evaluated in 10 mL of a 50 mg L-1 solution at six different pH values: 2, 4, 6, 8, 10, and 12. The pH values of the solutions were obtained using 0.1 and 0.01 M HCl and NaOH solutions. In each PND solution, 10 mg of CNSs were added and agitated for 120 min at room temperature. At the equilibrium, the remaining PND was measured. In a similar condition, at pH 6, the effect of CNSs’ doses was evaluated using various amounts, including 2.5, 5, 10, and 20 mg, in a 10 mL 50 mg L-1 PND solution.
2.6 Field applicability studies
2.6.1 Ionic strength and regeneration of CNSs
Amounts of 1 M salt concentration of NaCl, KCl, MgCO3, ZnSO4, and CaCO3 were prepared to examine the ionic strength of CNSs. Each solution was prepared (10 mL) with 1 mL of salt solution (1 M), 1 mL of the stock solution PND (500 mg L-1), and 8 mL deionized water to obtain 50 mg L-1 PND with 0.1 M salt solution. An amount of 10 mg of CNSs was added to all the salt-containing PND solutions and shaken at room temperature for 120 min. The CNSs were separated from the mixtures by centrifugation to determine the % removal of PND under ionic solution (Raval et al., 2022).
2.6.2 Regeneration of CNSs
Regeneration and reusability studies of CNSs were conducted in a 100 mL of a 50 mg L-1 PND solution at pH 7, using a 50 mg dose of CNSs, with stirring at 250 rpm at room temperature. After 60 min, CNSs were separated from the PND solution through centrifugation. The removal efficiency (adsorption %) was measured using a UV–VIS spectrophotometer. The PND-adsorbed CNSs (PND–CNSs) were dispersed in 60% ethanol and again stirred at 250 rpm and room temperature. The desorption % was calculated after the separation of CNSs using a UV spectrophotometer. The adsorption–desorption processes were performed for up to five successive cycles.
3 Results and discussion
3.1 Characterization of the synthesized material
3.1.1 SEM–EDS analysis
The surface morphology of VNBC was analyzed using FEG–SEM, as shown in Supplementary Figure S3. The image captured at 25,000 × magnification reveals a porous and heterogeneous structure, which is characteristic of lignocellulosic biomass pyrolyzed at 600 °C (Liu et al., 2024). The SEM micrograph of CNSs synthesized from VNBC using a microwave-assisted technique is represented in Figure 2a. At 100,000 × magnification, the image reveals predominantly spherical nanostructures with particle sizes ranging from ∼72 to 127 nm. The surface morphology appears non-uniform due to aggregation and variations in particle formation during the pyrolysis and microwave activation processes (Hussain et al., 2020). Furthermore, the sample preparation process for SEM analysis can promote agglomeration and flattering at contact points, which makes perfectly round, isolated nanospheres less prominent in some fields of view.
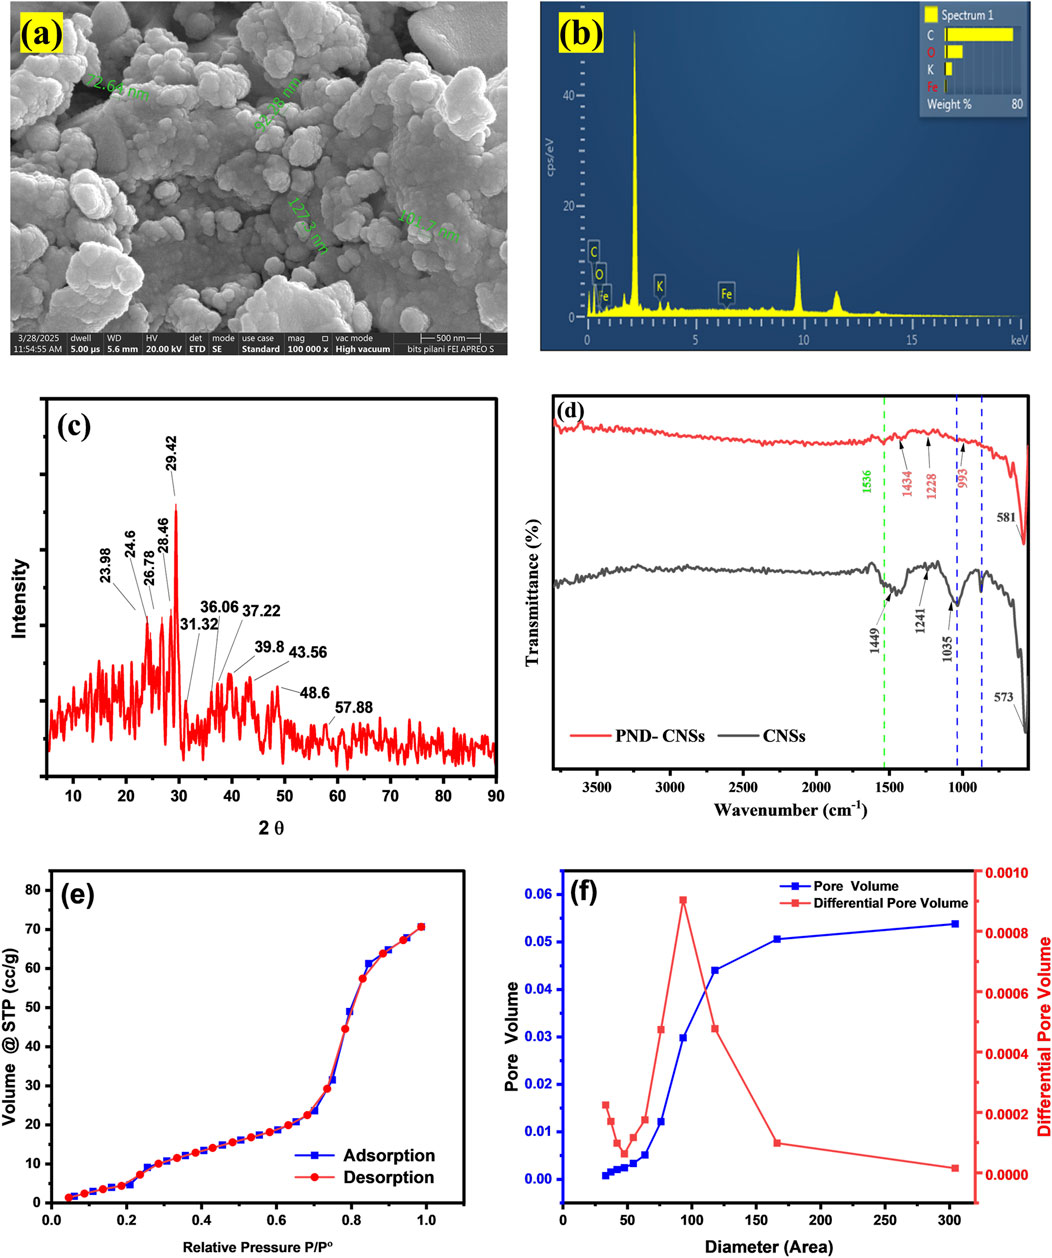
Figure 2. SEM-EDX analysis of CNSs (a,b), XRD pattern of CNSs (c), FT-IR spectra of CNSs (d), N2 adsorption–desorption isotherm (e), and BJH pore size distribution curve (f).
EDS analysis (Table 1; Figure 2b) shows that carbon predominates the element atomic weight at 80.91%, followed by oxygen (O) at 15.90%, potassium (K) at 2.64%, and iron (Fe) at 0.55%. The presence of oxygen is attributed to residual functional groups and surface oxidation of the biomass precursor, while potassium originates from the plant material itself. The trace presence of Fe confirms the incorporation of the ferrocene catalyst used for microwave-assisted synthesis of CNSs (Beautlin Nisha et al., 2024). The trace Fe likely acted as a graphitization or shape-directing catalysis during microwave irradiation, promoting the formation of more ordered carbon domains and influencing surface chemistry. The low amounts (0.55%) indicate that most ferrocene residues were removed during the washing process in synthesis. The calculated C:O atomic ratio of 5.08 indicates a high degree of carbon purity with moderate oxygen-containing groups. These results are consistent with the FT-IR, where the presence of O–H, C=O, and C–O, as depicted in Figure 2d, contributes to the adsorptive performance of CNSs.
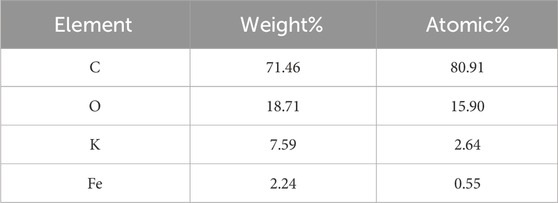
Table 1. Elemental composition of CNSs.
3.1.2 X-ray diffraction spectroscopy analysis
The XRD pattern of the synthesized CNSs, as shown in Figure 2c, reveals the structure and degree of crystallinity of the material. The prominent diffraction peak observed at 2 Ɵ values 24.12° and 26.42° corresponds to the (002) plane of graphite carbon (JCPDS No. 75–2078), which is indicative of SP2-hybridized carbon atoms arranged in stacked graphite-like layers (Faisal and Aljubouri, 2016). The broad peaks indicate a semi-crystalline or troostitic structure, typically of carbonaceous material derived from biomass. Another notable peak found at 2 Ɵ value 39.3°, which is attributed to the (100) planes of the carbon material (Lazo-Cannata et al., 2011), represents the in-plane ordering of carbon atoms. A minor diffraction peak found near 2 Ɵ = 29.42°, 31.32°, 36.06°, 37.22°, 39.38°, 43.56°, 48.6°, and 57.88° corresponding to the iron oxide (γ-Fe2O3 and Fe3O4) phase may have originated from catalytic decomposition of ferrocene during synthesis (as confirmed by EDS analysis). The presence of iron oxide species may enhance the adsorption of PND by providing Lewis acid sites that interact with the nitro functional group of PND and by increasing surface heterogeneity (Saha et al., 2011). Overall, the XRD results confirmed the presence of partially ordered graphitic domains within the CNSs, consistent with the expected structure of carbon nanomaterial synthesized via a microwave-assisted method.
3.1.3 FT-IR analysis of CNSs
FT-IR analysis was conducted to identify the surface functional groups present on CNSs and investigate their interaction with PND after adsorption, as shown in Figure 2d. The CNSs exhibit a prominent peak at 1,035 cm-1 corresponding to C–O stretching vibrations, which was consistent with a previous study (Ţucureanu et al., 2016). Furthermore, a peak at 1,449 cm-1 was related to CH2 bending vibrations, and a band near 1,600 to 1,375 cm-1 was related to the -CH3 and C=C of the aromatic system (Ganeshkumar et al., 2013). The peak at 573 corresponded to the presence of FeO at CNSs’ surface.
Noticeable spectral peak changes were observed after PND adsorption. The C–O peak shifted from 1,035 to 993 cm-1, which may be the overlapping of C–N stretching, suggesting the amine functionalities from PND (Baudot et al., 2010). Additionally, the CH2 bending vibrations shifted from 1,449 to 1,434 cm-1, further confirming the surface-level interaction between CNSs and PND molecules. An intensified band consistent with the nitro (-NO2) group of PND appeared in the fingerprint region, with the symmetric and asymmetric NO2 stretches for aromatic nitro compounds at 1,536 cm-1. These spectral shifts validate that specific functional groups on the surface of CNSs actively participate in PND-binding via hydrogen bonding, π–π interactions, and dipole interactions, highlighting the chemical affinity of CNSs toward PND.
3.1.4 Surface area and pHZPC analysis
The N2 adsorption–desorption curve and BJH pore size distribution of CNSs are depicted in Figures 2e, f. The CNSs displayed a type-IV isotherm with a hysteresis loop, indicating a mesopore structure. The steep increase in the adsorbed volume at relative volume at relative pressure (P/P°) above 0.8 corresponds to the capacity condensation due to the mesoporous structure. The close overlap between adsorption and desorption branches suggests uniform pore distribution and minimal pore-blocking effect, highlighting the structural integrity of CNSs. The BET surface area of CNSs was 80.8 m2/g, with a 18.56 cc/g monolayer capacity (Vm). The value indicates a substantial mesoporous surface, which is suitable for effective adsorption application (Mehdipour-Ataei and Aram, 2022). The BJH pore distribution curve shown in Figure 2f reveals the mesoporous character of CNSs. The primary pore volume was between 50 and 100 nm in diameter. The average pore volume increased up to 300 nm, confirming the broad mesopore–macropore regime. Such hierarchical porosity is advantageous for molecular diffusion, enhancing adsorbate access to active sites and overall performance (Zhang et al., 2024).
The pHZPC of CNSs was obtained at pH 10, as shown in Supplementary Figure S1. Therefore, the surface charge of CNSs at pH 10 will be zero. While pH > pHZPC, it has a negative charge on the surface; on the other hand, at pH < pHZPC, it has a positive charge on the surface.
3.2 Adsorption studies: optimization of parameters, kinetics, and isotherm
3.2.1 Optimization parameters (initial concentration, contact time, pH, and dose)
To evaluate the adsorbent enhancement achieved by microwave-assisted synthesis, a comparative adsorption experiment was conducted using only the VNBC biochar and CNSs under identical conditions (50 mg L-1 PND, pH 7, 100 mL volume, 100 mg adsorbent dose, and 120 min contact time). As shown in Supplementary Figure S2, VNBC achieved 85% removal, whereas CNSs achieved 95% removal. The superior performance of CNSs highlights the beneficial role of microwave-ferrocene treatment in improving the surface area, porosity, and functional group availability, thereby enhancing adsorption efficiency.
The impact of PND’s initial concentration and contact time on the adsorption efficacy of CNSs was studied in the range of 30 mg L-1–70 mg L-1 and 0 min–150 min. As depicted in Figures 3a, b, higher removal efficiency was achieved with increasing PND concentration, reaching the peak at 95.81% for 50 mg L-1, which suggested the optimum condition for effective removal. Even at lower concentrations, it shows better removal with 89.88% for 30 mg L-1 and 88.55% for 40 mg L-1. However, at higher concentrations of 60 and 70 mg L-1, it exhibits 86.36% and 88.17%, respectively. This reduction may be due to the saturation of available active sites on CNSs for PND molecules. The adsorption capacity (qe) increased consistently, ranging from 26.96 to 61.72 mg g-1 with the initial concentration ranging from 30 to 70 mg L-1. The maximum adsorption capacity of 61.72 mg g-1 was observed at 70 mg L-1. This trend indicates that while the removal efficiency is the highest at a moderate concentration (50 mg L-1), the adsorptive loading per gram of CNSs continues to increase with higher concentrations. The first 30 min showed higher adsorption rates and reached equilibrium at 120 min–150 min for each concentration, suggesting sufficient contact time for maximum removal of PND (Ayuba and Nyijime, 2021a).
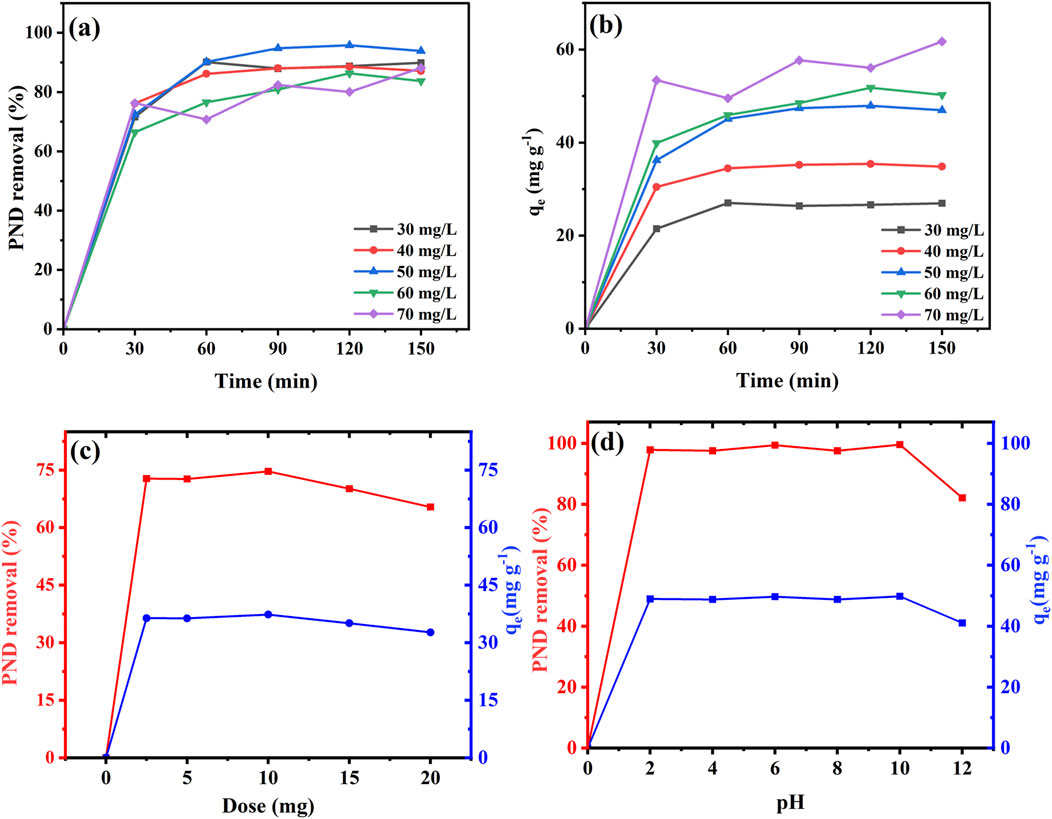
Figure 3. Optimization parameters for PND removal using CNSs under various initial concentrations and contact times; % PND removal (a), adsorption capacity qe mg g-1 (b), effect of dose (c), and effect of pH (d).
The effect of CNSs’ dosage on PND removal was evaluated by various doses of CNSs, including 2.5 mg–20 mg per 10 mL of the 50 mg L-1 PND solution. As depicted in Figure 3c, the removal efficiency increased with increasing doses up to 10 mg, achieving a maximum of 74.65% removal. However, a slight decline was observed when increasing the dosages from 15 to 20 mg. The reduction may be attributed to the accumulation of CNS particles at elevated amounts, which leads to a reduced effective surface area and fewer available binding sites. Although a higher dose introduces more adsorbent surface overall, excessive crowding of particles may hinder the diffusion of PND molecules, thereby lowering the efficiency at high doses.
The effect of pH on PND removal was investigated over a wide range of pH, from 2 to 12, and the results are represented in Figure 3d. The CNSs maintained high removal efficiency across all pH values, suggesting robust performance under varying environmental conditions. At pH 2, the removal % was 97.85%, which slightly decreased to 97.54% at pH 4, demonstrating lower sensitivity toward small pH changes. A moderate reduction in the removal % of PND was found at pH 6, which was 93.39%, while at pH 8, it was found to increase up to 97.55%. The highest removal was found at pH 10, which was 99.59%, suggesting that both acidic and alkaline conditions favor adsorption. Therefore, pH 10 was identified as the optimum pH for PND removal, as reported in Table 5. However, at pH 12, the removal % decreased to 82.12%, which may be attributed to the surface deactivation of CNSs’ adsorbent ability in a strongly alkaline condition (Giwa et al., 2019). The results suggest that CNSs show a broad pH range for PND removal, with the best performance under alkaline conditions.
3.2.2 Adsorption kinetics and isotherm
Both linear and non-linear forms of adsorption isotherm models were evaluated in this study. The rationale for using both approaches is that linearization, while historically common and methodologically convenient, can introduce distortion due to error propagation during transformation. In contrast, non-linearization directly minimizes the sum of squared residuals without transformation; therefore, it often provides more accurate parameter estimation (Paranjape and Sadgir, 2023). To compare with previous studies that predominantly used the linearized model, the present study included both forms of regression.
The adsorption kinetics of PND onto CNSs were evaluated using linear PFO, PSO, and intraparticle diffusion (IPD) models, as shown in Figures 4a–c and Table 2. Among the linear models, the PSO model best described the adsorption process, showing the highest R2 (0.985–0.998) and excellent agreement between the experimental and calculated equilibrium adsorption capacities, as shown in Table 2. The higher adsorption rates K2 at low concentration are due to the abundance of available sites, while at higher concentrations, site saturation and mass transfer resistance lower the apparent rate constant (Satyam and Patra, 2024). The results indicate that chemisorption governs the adsorption process (Shah et al., 2025). The IPD model exhibits moderate fits with R2 values ranging from 0.799 to 0.867. The diffusion rate constant Kdiff varied significantly (0.173 mg g-1. min-1/2–4.139 mg g-1. min-1/2), and the non-zero intercept indicates that IPD contributes to the overall adsorption process but is not a completely rate-limiting factor. Meanwhile, negative values (occasionally observed in non-linear fits) are considered fitting artifacts that reflect the contribution of multiple simultaneous mechanisms (film diffusion + pore diffusion) rather than pure intra-particle diffusion (Ko et al., 2001).
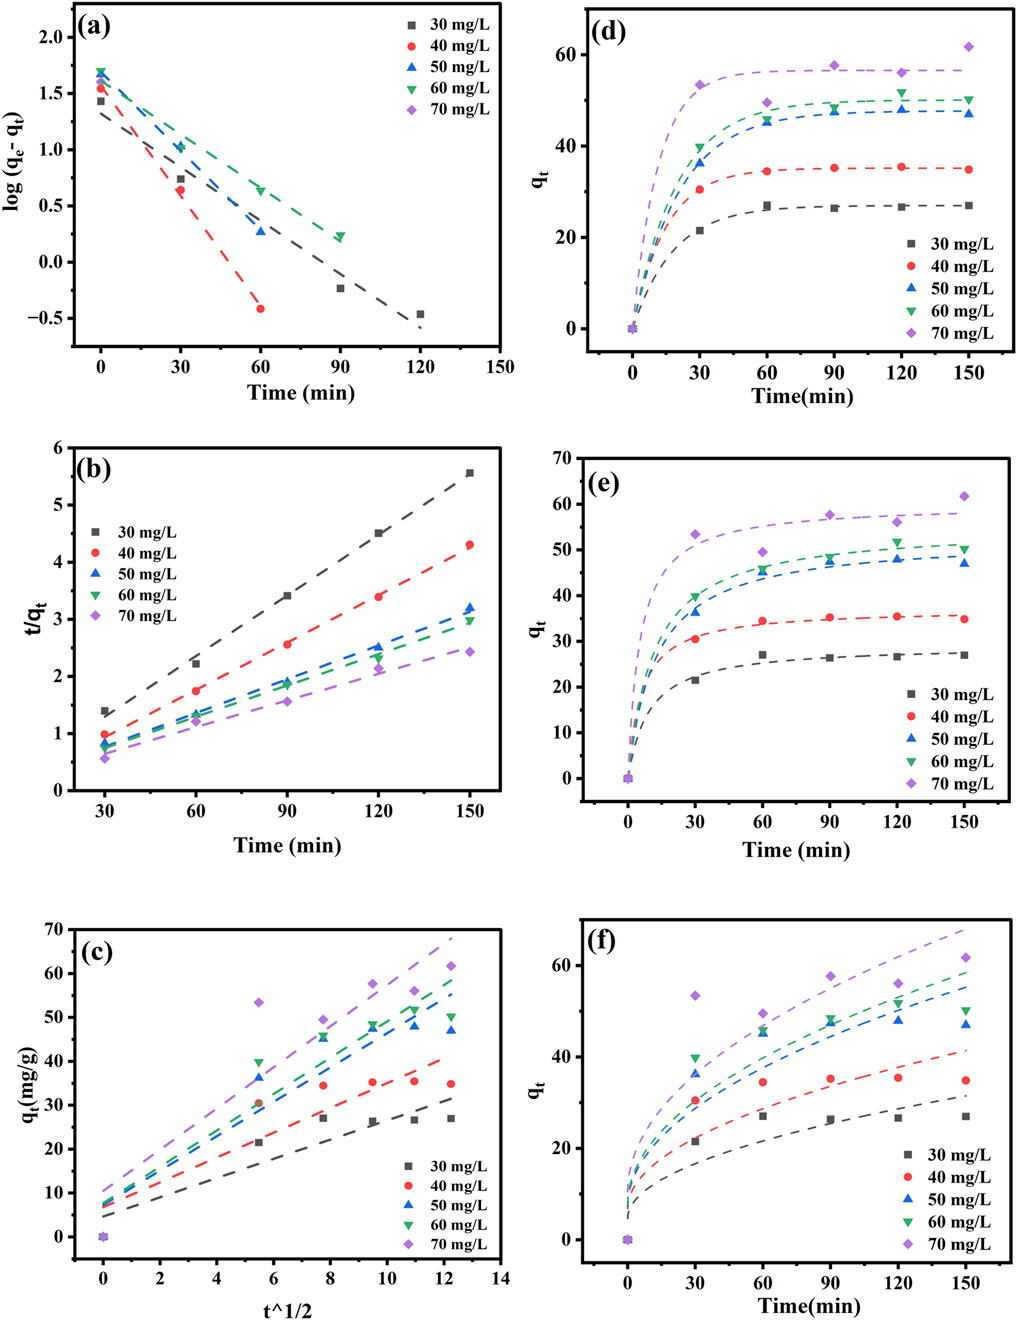
Figure 4. Kinetic models for PND adsorption onto CNSs using linear and non-linear pseudo first-order (a,d), pseudo second-order (b,e), and intraparticle diffusion (c,f) models.
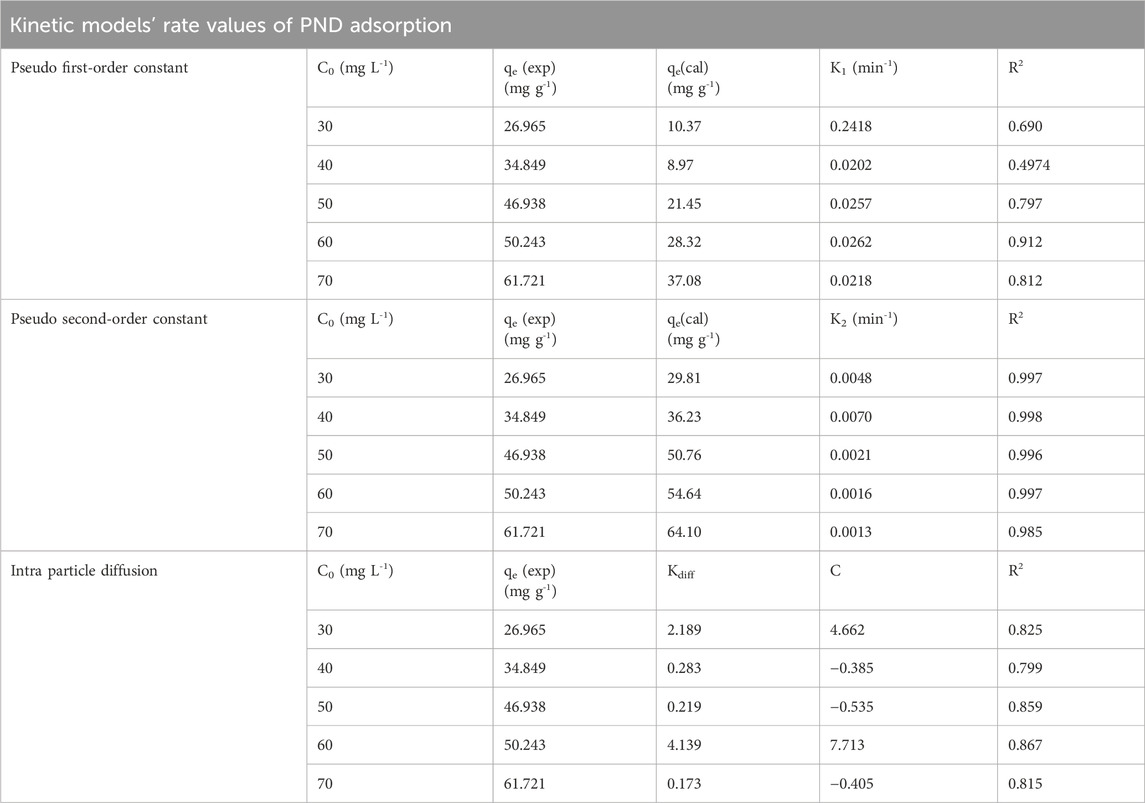
Table 2. Linear regression of kinetic models for the adsorption of PND onto CNSs.
The non-linear adsorption kinetics of PND adsorption onto CNSs is shown in Figures 4d, e and Table 3. The results revealed that the PFO model provides an excellent fit to the experimental data with high R2 values ranging 0.972 to 0.999, as shown in Table 3. The obtained values suggest that the adsorption process is primarily governed by physisorption. Additionally, the rate constant K1 exhibited an increasing value with increasing initial concentrations ranging from 0.047 to 0.087 min-1 (Shah et al., 2025). The PSO model also showed a good fit between qe (exp) and qe (cal) values (29.15 mg g-1–60.03 mg g-1). Although the smaller R2 values, in comparison to the first-order model, showed that it cannot be the primary pathway, the decrease in K2 values (0.00153 min-1–0.00447 min-1) with increasing concentration supports a chemisorption mechanism, particularly at lower concentrations (Aparecida Matias et al., 2019). The non-linear models offer more accurate predictions for adsorption behavior, particularly with varying concentrations. The best-fitted non-linear PSO model suggests a rapid initial adsorption phase through physisorption, followed by the intraparticle diffusion.
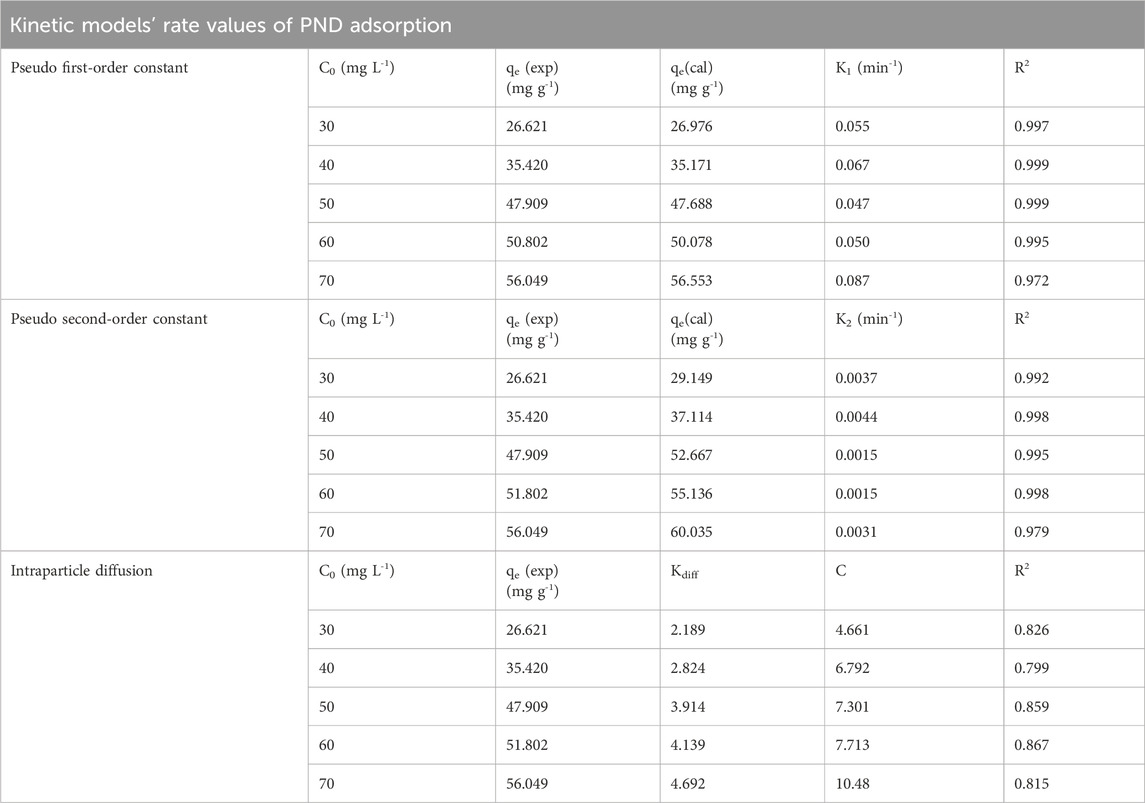
Table 3. Non-linear regression of adsorption kinetics models for the adsorption of PND onto CNSs.
The relationship between the adsorbent and adsorbate concentrations in the solution is described by the adsorption isotherm, which helps elucidate the adsorption mechanism (Dehghani et al., 2021). The Langmuir, Freundlich, and Temkin isotherm models in a linear form are shown in Figures 5a–c and those in non-linear form are shown in Figures 5d, e. The isotherm parameters for both the linear and non-linear forms are listed in Table 4.
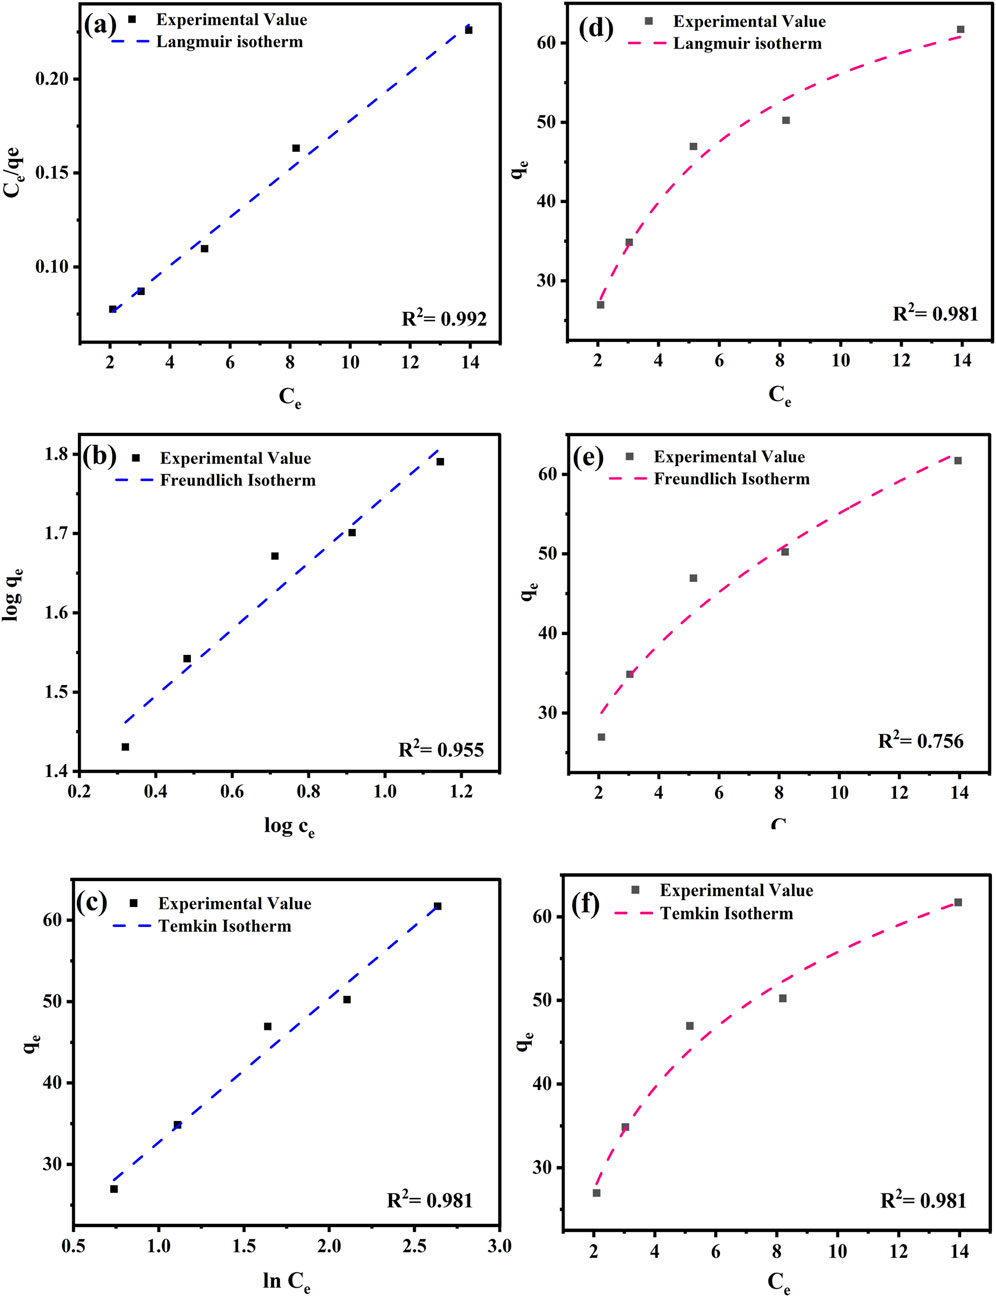
Figure 5. Linear and non-linear regression of adsorption isotherm of Langmuir (a,d), Freundlich (b,e), and Temkin (c,f) models for the removal of PND onto CNSs.
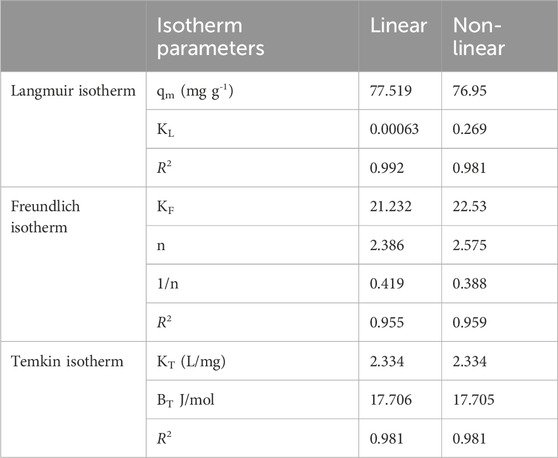
Table 4. Linear and non-linear isotherm model parameters.
The Langmuir model in linear form showed the best fit with an R2 value of 0.992. This suggests a monolayer adsorption process (Giwa et al., 2019). The calculated maximum adsorption capacity (qm) was 77.52 mg g-1, and KL was 0.00063 L g-1. In contrast, the non-linear Langmuir model exhibited a lower R2 value of 0.981 and a comparable qm value of 76.95 mg g-1 but higher KL value, indicating a difference in model fitting (Tay et al., 2021). The Freundlich model, which accounts for heterogeneous surface adsorption, also showed a good fit in both the linear (R2 = 0.955) and non-linear (R2 = 0.959) forms. The non-linear fitting showed a better fit with higher Kf and n values, as shown in Table 4. The 1/n values in both forms shows 0.419 and 0.388, which further confirm the favorable adsorption conditions. The Temkin model exhibited R2 values of 0.981 for both the linear and non-linear forms, with a nearly identical KT value of 2.334 Lmg-1 and BT value of 17.7 J mol-1. The results indicate moderate adsorbent–adsorbate interactions and suggest that physisorption plays a dominant role. Overall, the Langmuir (linear) and Freundlich (non-linear) models are the most suitable for describing PND adsorption onto CNSs, with mixed monolayer–multilayer interactions governed by physisorption. The adsorption capacity of various previously studied adsorbents is listed in Table 5 for comparison.
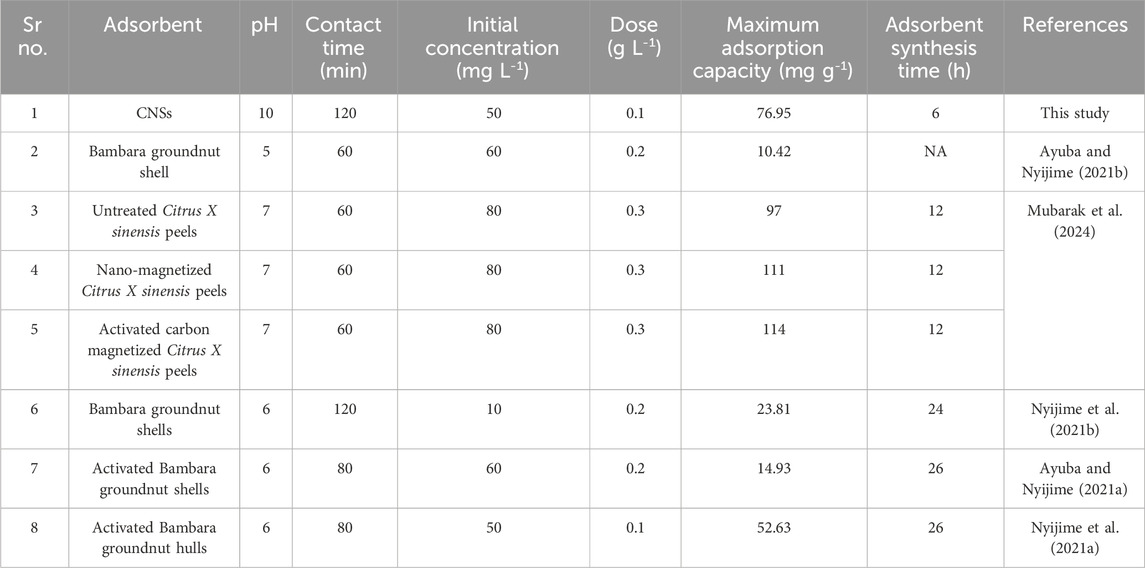
Table 5. Comparison of the maximum adsorption capacity with other studies for PND removal.
The adsorption of PND on CNSs is governed by a combination of hydrophobic partitioning, π–π electron donor–acceptor interactions, hydrogen bonding, and cation bridging, supported by kinetic, ionic strength, and pHpzc analyses. Film diffusion and intraparticle diffusion jointly contribute to the overall rate-limiting steps, with pseudo-second-order kinetics confirming the contribution of chemisorption. The neutral nature and hydrophobicity of PND, along with the porous and functionalized surface of CNSs, explain the high removal efficiency observed across a wide pH range.
3.3 Field applicability studies
3.3.1 Ionic strength of CNSs
To simulate the natural water conditions, the effect of background electrolytes on PND adsorption was evaluated with various salt solutions, including NaCl, KCl, MgCO3, CaCO3, and ZnSO4, as depicted in Figure 6a. The presence of monovalent salts resulted in comparatively lower removal efficiency, such as with NaCl (40.02%) and KCl (46.81%). In contrast, significantly higher removal efficiency was observed in the presence of multivalent salts, including MgCO3 (71.51%), CaCO3 (81.08%), and ZnSO4 (51.92%). The reduction caused by monovalent ions is interpreted as an antagonistic effect, likely due to ionic shielding, modification of surface hydration, and possible salting-in of PND, leading to less favorable adsorption interactions. The enhanced performance in the presence of multivalent salts is attributed to the bridging effect of divalent cations, including Ca+2, Mg+2, and Zn+2, which promotes coordination interactions or electrostatic interactions between CNSs and PND molecules, which is considered a synergistic effect. This phenomenon is consistent with previous reports (Kyriakopoulos et al., 2006; Vallabha et al., 2024); it shows that increasing the ionic strength through divalent salts can enhance the removal of PND by increasing interactions between CNSs and PND. These findings indicate that CNSs maintain good adsorption efficiency in real water matrices where divalent cations are often present, further supporting their practical applicability.
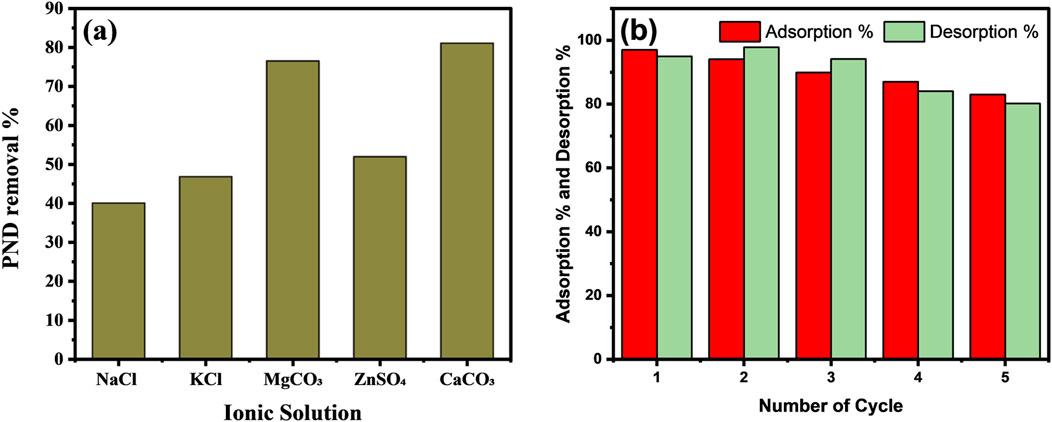
Figure 6. Effect of ionic strength on the percentage of PND removal (a) and adsorption and desorption percentages for regeneration capacity up to five cycles (b).
3.3.2 Regeneration and reusability of CNSs
Regeneration and reusability experiments were performed for five consecutive adsorption–desorption cycles. As presented in Figure 6b, adsorption efficiency decreased gradually from the first cycle (97%) to the fifth cycle (83%), while the desorption % ranged from 95% to 80%. The desorption efficiency showed a slight increase in the second cycle (98%) compared to the first (95%) and third (94%) cycles. This variation is likely due to the rearrangement and re-equilibrium of the adsorbent’s active sites during the first desorption cycle. The initial cycle may not have fully desorbed all weakly bound PND molecules or it may have slightly altered the surface morphology, making the fraction of the sites more accessible for desorption in the subsequent cycle. After this initial adjustment, the desorption efficiency followed a consistent declining trend from the third cycle onward, which is attributed to pore blockage and irreversible adsorption of a fraction of PND molecules on high-energy sites. Despite this, CNSs retained >80% of their original efficiency after five cycles, indicating good reusability and stability. These results are consistent with the literature on carbon-based nanomaterials used for organic contaminant adsorption (Manjunath et al., 2024).
3.3.3 Cost analysis of CNSs
The cost of producing 1 kg of CNSs from VNBC was quantified at the laboratory scale. The total cost includes expenditure on electricity usage, chemicals, and water. The production cost obtained was 455 INR per g (∼$5.45/g). The details of the calculations are given in Supplementary Table S3. The high value of CNSs reflects the small laboratory scale and dominance of the solvent (∼52%) and furnace energy cost (∼42%). In practical, scaled-up scenarios, recycling of ethanol and reuse of ferrocene would significantly reduce the cost, with projected values several orders of magnitude lower, which is consistent with the techno-economic assessment of carbon nanomaterial synthesis (Patil et al., 2024).
4 Conclusion
The study focuses on the microwave-assisted rapid synthesis of CNSs using V. nilotica biomass and ferrocene as a catalyst. The synthesized CNSs were thoroughly characterized to evaluate their structural and chemical composition using SEM-EDS, FT-IR, XRD, BET, and pHZPC. The high surface area (80.8 m2 g-1) and a pHZPC value of 10.0 indicated favorable surface properties for pollutant adsorption. The batch adsorption experiments revealed a maximum PND removal of 99.6% at pH 10 and room temperature. However, from a practical application point of view, the minor performance gain at pH 10 compared to the high removal efficiency at the near-neutral pH range (e.g., 97.5% at pH 8 and 93.39% at pH 6) may not justify the significant chemical cost and operational capacity of pH adjustment in real treatment systems. Therefore, for routine operations, CNSs at near-neutral pH are highly recommended. The kinetic and isotherm study revealed a hybrid mechanism. The process is best described as a physisorption-dominated process, as indicated by the well-fitted non-liner pseudo-first order kinetics and Temkin isotherm. However, the good fit with both the Langmuir and Freundlich isotherm models suggests that adsorption occurs not only as a monolayer on specific homogenous sites but also as multilayers on heterogeneous surfaces. Furthermore, the well-fitted pseudo-second-order model suggests a contribution of weak chemisorption interactions, such as π–π electron donor–acceptor interactions between the aromatic rings of PND and CNSs and hydrogen bonding with surface functional groups. In addition, the study explores the effects of ionic strength and regeneration capacity over five successive cycles and a cost analysis supporting the potential application of CNSs in real water treatment systems. Overall, the results highlight CNSs as a promising adsorbent for the elimination of PND and potentially other organic pollutants from contaminated water.
Data availability statement
The original contributions presented in the study are included in the article/Supplementary Material; further inquiries can be directed to the corresponding authors.
Author contributions
KV: Investigation, Methodology, Writing – original draft, Writing – review and editing. GP: Investigation, Project administration, Writing – original draft, Writing – review and editing. BP: Data curation, Formal analysis, Methodology, Writing – review and editing. SS: Formal analysis, Resources, Software, Writing – review and editing. ER: Funding acquisition, Project administration, Supervision, Writing – review and editing. DS: Conceptualization, Supervision, Validation, Writing – review and editing. AP: Conceptualization, Supervision, Visualization, Writing – review and editing.
Funding
The author(s) declare that no financial support was received for the research and/or publication of this article.
Acknowledgments
AcknowledgementsThe authors would like to thank the Department of Life Sciences, Parul Institute of Applied Science, Parul University, Vadodara and the Department of Life Sciences, Hemchandracharya North Gujarat University, Patan, for conducting this study.
Conflict of interest
The authors declare that the research was conducted in the absence of any commercial or financial relationships that could be construed as a potential conflict of interest.
Generative AI statement
The author(s) declare that no Generative AI was used in the creation of this manuscript.
Any alternative text (alt text) provided alongside figures in this article has been generated by Frontiers with the support of artificial intelligence and reasonable efforts have been made to ensure accuracy, including review by the authors wherever possible. If you identify any issues, please contact us.
Publisher’s note
All claims expressed in this article are solely those of the authors and do not necessarily represent those of their affiliated organizations, or those of the publisher, the editors and the reviewers. Any product that may be evaluated in this article, or claim that may be made by its manufacturer, is not guaranteed or endorsed by the publisher.
Supplementary material
The Supplementary Material for this article can be found online at: https://www.frontiersin.org/articles/10.3389/fenvs.2025.1674858/full#supplementary-material
References
Abbassy, M. A., Abdel-Halim, K. Y., and Nassar, A. M. K. (2021). Efficacy of single-walled carbon nanotubes and titanium dioxide nanoparticles as remediators of the aquatic environment from pendimethalin residues. Available online at: http://www.opastonline.com.
Abdulwali, N., van der Zalm, J., Thiruppathi, A. R., Khaleel, A., and Chen, A. (2024). Microwave-assisted green synthesis of monodispersed carbon micro-spheres and their antibacterial activity. Appl. Surf. Sci. 642, 158579. doi:10.1016/J.APSUSC.2023.158579
Acar, A., Singh, D., and Srivastava, A. K. (2022). Assessment of the ameliorative effect of curcumin on pendimethalin-induced genetic and biochemical toxicity. Sci. Rep. 12, 2195. doi:10.1038/s41598-022-06278-5
Aparecida Matias, C., Vilela, P. B., Becegato, V. A., and Paulino, A. T. (2019). Adsorption kinetic, isotherm and thermodynamic of 2,4-Dichlorophenoxyacetic acid herbicide in novel alternative natural adsorbents. Water Air Soil Pollut. 230, 276. doi:10.1007/s11270-019-4324-5
Ayuba, A. M., and Nyijime, T. A. (2021a). Adsorption and kinetics study for the removal of pendimethalin from aqueous solution using activated carbon prepared from agricultural waste. J. Exp. Res. 9 (2), 6–16.
Ayuba, A. M., and Nyijime, T. A. (2021b). Removal of pendimethalin herbicide from aqueous solution using untreated Bambara groundnut hulls as a low-cost adsorbent. J. Mater. Environ. Sci. 12 (11), 1–12.
Baghel, P., Sakhiya, A. K., and Kaushal, P. (2022). Ultrafast growth of carbon nanotubes using microwave irradiation: characterization and its potential applications. Heliyon 8, e10943. doi:10.1016/j.heliyon.2022.e10943
Baudot, C., Tan, C. M., and Kong, J. C. (2010). FTIR spectroscopy as a tool for nano-material characterization. Infrared Phys. Technol. 53, 434–438. doi:10.1016/j.infrared.2010.09.002
Beautlin Nisha, R., Jaya Rajan, M., and Author, C. (2024). Characterization studies of activated carbon prepared from agricultural wastes of Vachellia nilotica. J. Bio. and Env. Sci 2024, 94–101. Available online at: http://www.innspub.net.
Dehghani, M. H., Hassani, A. H., Karri, R. R., Younesi, B., Shayeghi, M., Salari, M., et al. (2021). Process optimization and enhancement of pesticide adsorption by porous adsorbents by regression analysis and parametric modelling. Sci. Rep. 11, 11719. doi:10.1038/s41598-021-91178-3
Devi, N., Sahoo, S., Kumar, R., and Singh, R. K. (2021). A review of the microwave-assisted synthesis of carbon nanomaterials, metal oxides/hydroxides and their composites for energy storage applications. Nanoscale 13, 11679–11711. doi:10.1039/D1NR01134K
Faisal, A. D., and Aljubouri, A. A. (2016). Synthesis and production of carbon nanospheres using noncatalytic CVD method. Int. J. Adv. Mater. Res. 2, 86–91. Available online at: http://www.aiscience.org/journal/ijamrhttp://creativecommons.org/licenses/by/4.0/.
Ganeshkumar, M., Ponrasu, T., Sathishkumar, M., and Suguna, L. (2013). Preparation of amphiphilic hollow carbon nanosphere loaded insulin for oral delivery. Colloids Surf. B Biointerfaces 103, 238–243. doi:10.1016/j.colsurfb.2012.10.043
Giwa, S. O., Moses, J., Adeyi, A. A., Giwa, A., Moses, J. S., and Adeyi, A. A. (2019). Adsorption of atrazine from aqueous solution using desert date seed shell activated carbon. Available online at: http://www.ajerd.abuad.edu.ng/317.
Hidalgo, P., Navia, R., Hunter, R., Camus, C., Buschmann, A., and Echeverria, A. (2023). Carbon nanotube production from algal biochar using microwave irradiation technology. J. Anal. Appl. Pyrolysis 172, 106017. doi:10.1016/j.jaap.2023.106017
Hussain, N., Alwan, S., Alshamsi, H., and Sahib, I. (2020). Green synthesis of S- A nd N-Codoped carbon nanospheres and application as adsorbent of Pb (II) from aqueous solution. Int. J. Chem. Eng. 2020, 1–13. doi:10.1155/2020/9068358
Ko, D. C. K., Porter, J. F., and McKay, G. (2001). Film-pore diffusion model for the fixed-bed sorption of copper and cadmium ions onto bone char. Water Res. 35, 3876–3886. doi:10.1016/S0043-1354(01)00114-2
Kyriakopoulos, G., Doulia, D., and Hourdakis, A. (2006). Effect of ionic strength and pH on the adsorption of selected herbicides on amberlite. Int. J. Environ. Anal. Chem. 86, 207–214. doi:10.1080/03067310500247678
Lazo-Cannata, J. C., Nieto-Márquez, A., Jacoby, A., Paredes-Doig, A. L., Romero, A., Sun-Kou, M. R., et al. (2011). Adsorption of phenol and nitrophenols by carbon nanospheres: effect of pH and ionic strength. Sep. Purif. Technol. 80, 217–224. doi:10.1016/j.seppur.2011.04.029
Liu, L., Shang, D., Zhao, Y., Zhao, Q., Guo, Y., Zhang, F., et al. (2024). Preparation of chladophora-based biochar and its adsorption properties for antibiotics. ChemistrySelect 9. doi:10.1002/slct.202303598
Madakka, M., Jayaraju, N., and Rangaswamy, V. (2017). Changes in the metabolic activities of two agricultural soils as influenced by the pesticides and insecticides combination. Appl. Soil Ecol. 120, 169–178. doi:10.1016/j.apsoil.2017.07.037
Manjunath, S. V., Rakshitha, D., and Meghashree, M. (2024). Contemporaneous adsorption analysis for removal of dyes from multi-dye system. System, 171–181. doi:10.1007/978-981-97-0910-6_14
Mehdipour-Ataei, S., and Aram, E. (2022). Mesoporous carbon-based materials: a review of synthesis, modification, and applications. Catalysts 13, 2. doi:10.3390/catal13010002
Mubarak, S., Ashraf, B., and Asghar, A. (2024). Role of nano-magnetized citrus X sinensis (orange) peels for decontamination of pendimethalin from aqueous resources: a comparative study of untreated and carbonaceous Orange peels with nano-magnetized peels. Aqua Water Infrastructure, Ecosyst. Soc. 73, 355–368. doi:10.2166/aqua.2024.150
Murtaza, G., Usman, M., Iqbal, J., Hyder, S., Solangi, F., Iqbal, R., et al. (2024). Liming potential and characteristics of biochar produced from woody and non-woody biomass at different pyrolysis temperatures. Sci. Rep. 14, 11469. doi:10.1038/s41598-024-61974-8
Nyijime, T. A., Ayuba, A. M., and Chahul, H. F. (2021a). Experimental and computational studies on activated Bambara groundnut (Vigna subterranean) hulls for the adsorptive removal of herbicides from aqueous solution. Bull. Natl. Res. Cent. 45, 189. doi:10.1186/s42269-021-00648-1
Nyijime, T. A., Ayuba, A. M., and Chahul, H. F. (2021b). Removal of pendimethalin from aqueous solution by carbon prepared from Bambara groundnut (vigna subteranean) shells. Available online at: www.mocedes.org.$All$rights$reserved.
Omoriyekomwan, J. E., Tahmasebi, A., Dou, J., Wang, R., and Yu, J. (2021). A review on the recent advances in the production of carbon nanotubes and carbon nanofibers via microwave-assisted pyrolysis of biomass. Fuel Process. Technol. 214, 106686. doi:10.1016/J.FUPROC.2020.106686
Paranjape, P., and Sadgir, P. (2023). Linear and nonlinear regression methods for isotherm and kinetic modelling of iron ions bioadsorption using Ocimum sanctum linn. Leaves from aqueous solution. Water Pract. Technol. 18, 1807–1827. doi:10.2166/wpt.2023.110
Parveen, N., Da’na, E., and Taha, A. (2025). Sustainable fabrication of Fe2O3/C nanoparticles via Acacia nilotica extract for enhanced supercapacitor performance. Nanotechnology 36, 115704. doi:10.1088/1361-6528/ada44a
Patil, P., Jeppu, G., Vallabha, M. S., and Girish, C. R. (2024). Enhanced adsorption of phenolic compounds using biomass-derived high surface area activated carbon: isotherms, kinetics and thermodynamics. Environ. Sci. Pollut. Res. 31, 67442–67460. doi:10.1007/s11356-024-32971-1
Rani, L., Thapa, K., Kanojia, N., Sharma, N., Singh, S., Grewal, A. S., et al. (2021). An extensive review on the consequences of chemical pesticides on human health and environment. J. Clean. Prod. 283, 124657. doi:10.1016/j.jclepro.2020.124657
Raval, N. P., Priyadarshi, G. V., Mukherjee, S., Zala, H., Fatma, D., Bonilla-Petriciolet, A., et al. (2022). Statistical physics modeling and evaluation of adsorption properties of chitosan-zinc oxide nanocomposites for the removal of an anionic dye. J. Environ. Chem. Eng. 10, 108873. doi:10.1016/j.jece.2022.108873
Rohit, J. V., and Kailasa, S. K. (2017). Simple and selective detection of pendimethalin herbicide in water and food samples based on the aggregation of ractopamine-dithiocarbamate functionalized gold nanoparticles. Sens. Actuators B Chem. 245, 541–550. doi:10.1016/j.snb.2017.02.007
Saha, B., Das, S., Saikia, J., and Das, G. (2011). Preferential and enhanced adsorption of different dyes on iron oxide nanoparticles: a comparative study. J. Phys. Chem. C 115, 8024–8033. doi:10.1021/jp109258f
Saleh, M., Gul, A., Nasir, A., Moses, T. O., Nural, Y., and Yabalak, E. (2025). Comprehensive review of Carbon-based nanostructures: properties, synthesis, characterization, and cross-disciplinary applications. J. Industrial Eng. Chem. 146, 176–212. doi:10.1016/J.JIEC.2024.11.052
Sanjeev, N. O., Vallabha, M. S., and Valsan, A. E. (2024). Azadirachta indica leaf extract based green-synthesized ZnO nanoparticles coated on spent tea waste activated carbon for pharmaceuticals and personal care products removal. Environ. Res. 252, 119047. doi:10.1016/J.ENVRES.2024.119047
Satyam, S., and Patra, S. (2024). Innovations and challenges in adsorption-based wastewater remediation: a comprehensive review. Heliyon 10, e29573. doi:10.1016/j.heliyon.2024.e29573
Shah, N., Priyadarshi, G., Patel, B., Sahu, S. K., Joshi, M., Syed, R., et al. (2025). Green synthesis of ZnO nanoparticles using Microbacterium arborescens: a multifunctional approach in environment, health, and agriculture. Water Reuse 15, 215–229. doi:10.2166/wrd.2025.004
Swarcewicz, M. K., and Gregorczyk, A. (2012). The effects of pesticide mixtures on degradation of pendimethalin in soils. Environ. Monit. Assess. 184, 3077–3084. doi:10.1007/s10661-011-2172-x
Tabassum, H., Afjal, M. A., Khan, J., Raisuddin, S., and Parvez, S. (2015). Neurotoxicological assessment of pendimethalin in freshwater fish Channa punctata bloch. Ecol. Indic. 58, 411–417. doi:10.1016/j.ecolind.2015.06.008
Tay, S. Y., Wong, V. L., Lim, S. S., and Teo, I. L. R. (2021). Adsorption equilibrium, kinetics and thermodynamics studies of anionic methyl orange dye adsorption using chitosan-calcium chloride gel beads. Chem. Eng. Commun. 208, 708–726. doi:10.1080/00986445.2020.1722655
Thacker, B. V., Vadodaria, G. P., Priyadarshi, G. V., and Trivedi, M. H. (2023). Biopolymer-based fly ash-activated zeolite for the removal of chromium from acid mine drainage. Sci. Temper 14, 1217–1226. doi:10.58414/scientifictemper.2023.14.4.24
Ţucureanu, V., Matei, A., and Avram, A. M. (2016). FTIR spectroscopy for carbon family study. Crit. Rev. Anal. Chem. 46, 502–520. doi:10.1080/10408347.2016.1157013
Vallabha, M. S., Nagraj, P. C., Sanjeev, N. O., Mahadev, M., Devadas, R., and Govindappa, V. (2024). Valorization of Parthenium hysterophorus weed into biochar for adsorptive removal of industrial dyes from multi-pollutant aqueous systems. Biomass Convers. Biorefin 15, 24227–24241. doi:10.1007/s13399-024-05534-0
Vighi, M., Matthies, M., and Solomon, K. R. (2017). Critical assessment of pendimethalin in terms of persistence, bioaccumulation, toxicity, and potential for long-range transport. J. Toxicol. Environ. Health, Part B 20, 1–21. doi:10.1080/10937404.2016.1222320
Zhang, L., Lu, J., and Liu, B. (2024). Hierarchically ordered macroporous–mesoporous (HOM-m) MgFe2O4/MgO for highly efficient adsorption of Ce(III) and La(III): experimental study and DFT calculation analysis. Separations 11, 333. doi:10.3390/separations11120333
Keywords: adsorption, biochar, carbon nanosphere, microwave-assisted synthesis, kinetics
Citation: Vidhyarthi K, Priyadarshi G, Patel B, Sahu SK, Rami E, Sahoo DK and Patel A (2025) Green synthesis of carbon nanospheres from Vachellia nilotica for pendimethalin removal. Front. Environ. Sci. 13:1674858. doi: 10.3389/fenvs.2025.1674858
Received: 28 July 2025; Accepted: 20 October 2025;
Published: 11 November 2025.
Edited by:
Tariq Mehmood, Leibniz Institute for Agricultural Engineering and Bioeconomy (ATB), GermanyReviewed by:
Oscar Manuel Rodriguez Narvaez, Centro de Innovación Aplicada en Tecnologías Competitivas (CIATEC), MexicoManjunath S. V., BMS College of Engineering, India
Copyright © 2025 Vidhyarthi, Priyadarshi, Patel, Sahu, Rami, Sahoo and Patel. This is an open-access article distributed under the terms of the Creative Commons Attribution License (CC BY). The use, distribution or reproduction in other forums is permitted, provided the original author(s) and the copyright owner(s) are credited and that the original publication in this journal is cited, in accordance with accepted academic practice. No use, distribution or reproduction is permitted which does not comply with these terms.
*Correspondence: Esha Rami, ZXNoYS5yYW1pODIwMzZAcGFydWx1bml2ZXJzaXR5LmFjLmlu; Dipak Kumar Sahoo, ZHNhaG9vQGlhc3RhdGUuZWR1, ZGlwYWtzYWhvbzExQGdtYWlsLmNvbQ==; Ashish Patel, dW5pLmFzaGlzaEBnbWFpbC5jb20=, YWRwYXRlbEBuZ3UuYWMuaW4=
†These authors have contributed equally to this work and share first authorship.