 Ahmed Abdelaal1
 Basma A. El-Badry2
 Gehad M. Saleh3
 Mabrouk Sami4*Ghada A. Khouqeer2
 Ioan V. Sanislav5
 El Saeed R. Lasheen6*
- 1Environmental Sciences Department, Faculty of Science, Port Said University, Port Said, Egypt
- 2Physics Department, Faculty of Science, Imam Mohammad Ibn Saud Islamic University (IMSIU), Riyadh, Saudi Arabia
- 3Nuclear Materials Authority, Cairo, Egypt
- 4Geosciences Department College of Science, United Arab Emirates University, Al Ain, United Arab Emirates
- 5Economic Geology Research Centre (EGRU), College of Science and Engineering, James Cook University, Townsville, QLD, Australia
- 6Geology Department, Faculty of Science, Al-Azhar University, Cairo, Egypt
This study investigated the concentrations, spatial distribution, and associated ecological and health risks of nine metals in the sediments of the El Qulaan region along the Red Sea coast in southern Egypt. The levels of barium (Ba), lead (Pb), chromium (Cr), nickel (Ni), and vanadium (V) exceeded both the Canadian soil quality guidelines and the Earth’s average shale composition. Nickel concentrations surpassed the Effect Range Median (ERM), while Pb, Cr, and Ni levels exceeded the Probable Effect Level (PEL), suggesting potential adverse effects on local marine organisms. Factor analysis revealed three main factors: the first factor (F1), accounting for 24% of the variance, included Ba, Co, Cr, V, Fe, pH, and total organic matter (TOM%); the second (F2, 20%) comprised Cu, Ni, and Zn; and the third (F3, 19%) included Pb, Gravel%, Sand%, and Mud%. Contamination factor (CF) values indicated varying degrees of pollution: low for Co and Cu, moderate for Pb, Zn, and Fe, considerable for Cr, Ni, and V, and high for Ba. The geo-accumulation index classified all metals as contributing to extreme contamination. The potential ecological risk index (PERI) ranged from 49 to 81, indicating a low ecological risk (PERI <150). Other indices, including the mean effects range-median quotient, toxic risk index, and modified hazard quotient, pointed to moderate toxicity and contamination severity. Non-carcinogenic risk assessments revealed no long-term health concerns, and cancer risk values remained below internationally accepted safety thresholds. Natural radioactivity levels in the sediments were also mapped and analyzed. The mean activities of 232Th, 226Ra, and 40K were 25.43 ± 7.54, 19.99 ± 6.84, and 294.92 ± 77.86 Bq/kg, respectively, all falling below global safety limits. The findings highlight the pressing need for targeted mitigation efforts and policy measures to manage metal contamination in the region’s coastal environments.
1 Introduction
Coastal areas of the Red Sea are essential for developing a blue economy, encompassing industries such as mining, maritime transportation, fishing, and tourism. These regions are home to abundant mangrove populations, which serve critical ecological functions within productive marine ecosystems. Mangroves offer refuge, nourishment, and natural defense against shoreline erosion and severe weather conditions (Mohammed et al., 2024). Human activities, including agricultural practices, industrial operations, and urban expansion, have contributed to a worldwide increase in sediment and metal levels (Abdelaal et al., 2024; 2022; Lasheen et al., 2024a; Vaezi and Lak, 2023). These enduring contaminants present a considerable threat to organisms, as they can build up in both water- and land-based ecosystems, adversely affecting the environment and human wellbeing (Zhang et al., 2016; Zhao et al., 2023). Therefore, continuous monitoring is necessary to mitigate these effects. The coastal zones and islands of the Red Sea are shaped by erosion and deposition (Ardila et al., 2023; Wan et al., 2023).
The expanding tourism sector along Egypt’s Red Sea shoreline endangers the coral reef ecosystem (Abdelaal et al., 2024; Lasheen et al., 2024a). Numerous studies have examined metal pollution in coastal sediments of the Red Sea, emphasizing their chemical composition and spatial distribution (Abdelaal et al., 2024; Abdelaal et al., 2022; Al-Kahtany et al., 2023; Lasheen et al., 2024a). Identifying the origin of these pollutants is vital for effective management strategies. Recently, various ecological risk assessment methods have been employed to determine potential metal sources and evaluate sediment pollution levels, including integrated indices (e.g., pollution load index), single-element indices (e.g., contamination factor and geo-accumulation index), and Sediment Quality Guidelines (SQGs) (e.g., modified hazard quotient and toxic risk index) (Abdelaal et al., 2024; Lasheen et al., 2024a; Zhang et al., 2016). Furthermore, human health risk indices (e.g., hazard index and total cancer risk) have been utilized to estimate the potential harm of toxic substances to human wellbeing (Mohammadi et al., 2019; Hargalani et al., 2014) examined the dispersal of various elements in the bottom sediments of the Anzali wetland, southern Caspian Sea in Iran. The researchers employed an innovative pollution index to assess the total concentration and bioavailability of the heavy metals. In addition, they determined the human-induced contribution of these metals. Additionally (Vaezi et al., 2015), focused on examining trace metal contamination in Mahshahr Bay sediments in southern Iran. They employed a new pollution index to assess trace metal levels in bay sediments. Importantly, they observed that conventional assessment techniques might not be appropriate for regions with high geological backgrounds, such as Mahshahr Bay, due to the substantial influence of natural lithogenous materials.
The Red Sea’s significant economic influence has established it as one of the world’s most crucial trade routes. It serves as both a tourist destination and oil source (Al-Mur and Gad, 2022; Khaleal et al., 2023b). Coastal and marine resources of the Red Sea have contributed to Egypt’s requirements for sustenance, power, industry, and recreation. While some areas remain profitable and appealing for tourism, mining, manufacturing, and other activities, human intervention has degraded or damaged certain shorelines, particularly in regions such as Hurghada. The geo-and ecosystems of the Red Sea face ecological threats from activities such as fishing methods, land reclamation, recreational pursuits, water contamination, solid waste disposal, and radiation sources (Jameson et al., 1999; El Nemr and El-Said, 2014; Fine et al., 2019). The rapid expansion of hotels, resorts, and other amenities along Egypt’s coastline has endangered the region’s coral reef ecosystems. Sustainable tourism initiatives in the Red Sea must incorporate strategies to conserve coral reefs effectively (Lasheen et al., 2024b; Reeve et al., 1998). The study of radiation is intricately linked to environmental safety and the progression of Earth’s geological processes (Alharshan et al., 2022; Kumar et al., 2024; Zakaly et al., 2024). It enhances our comprehension of the natural world’s history, current geological changes, and their effects on public health and the environment. In recent decades, there has been an increased interest in mapping naturally occurring radioactivity in the environment.
Numerous studies have assessed the population’s baseline exposure to radiation levels (Al-Hamarneh and Awadallah, 2009; AlZahrani et al., 2011; Fathy et al., 2023; Lasheen et al., 2022a; Özden et al., 2023; Ramola et al., 2011; Ravisankar et al., 2015). Cosmic radiation intensity varies with latitude and altitude, whereas terrestrial radiation magnitude depends on topography, soil type, and the geological composition of the ground (Lasheen et al., 2023; Ravisankar et al., 2015; UNSCEAR, 2000). The sandy shores of the Red Sea region contain substantial deposits of economically valuable heavy minerals, including ilmenite, garnet, rutile, and radioactive minerals such as zircon. These ores may have been transported from the visible or hidden host rocks through erosion (Al-Mur and Gad, 2022; Ramola et al., 2011). Therefore, the enrichment of zircon and xenotime minerals may result in Red Sea sediments being weathered and transferred from uranium- and thorium-rich host rocks (Al-Mur and Gad, 2022; Fathy et al., 2023; Khaleal et al., 2023a; Lasheen et al., 2022b). To evaluate the impact of radiation on human organs, it is necessary to measure the activity concentrations in Red Sea sediments using various radiological hazard indices (Al-Mur and Gad, 2022; Fathy et al., 2023; Khaleal et al., 2023a; Lasheen et al., 2022b).
This study is the first to perform a thorough examination of metal pollution in sediments of the El Qulaan region on the Red Sea coast of South Egypt. Numerous analytical techniques were used in the study, such as correlation and geochemical analyses and ecological, radiological, and health risk assessment indices. The spatial pattern of metal content across the study sites was assessed and mapped using GIS techniques. Sediment Quality Guidelines (SQGs), ecological effects, and possible health hazards linked to adult and pediatric cutaneous exposure to contaminated sediments were also evaluated in this study. Another goal of the present study is to determine the radioactive potential of sediments along the Red Sea shoreline, which might be useful for several applications such as nuclear power, building, and tourism. For this type of evaluation, the penetrating radiation dosage (232Th, 226Ra, and 40K) emitted by radioactive elements present in these soils must be measured. Several radiological risk indices have been calculated to assess the effects of radiation on human organs in greater detail.
2 Materials and methods
2.1 Study area and geologic setting
The El Qulaan area, situated on Egypt’s Red Sea shore, 90 km south of Marsa Alam city, is part of the southeastern desert of the Egyptian Nubian (Lasheen et al., 2024a; 2024b; Rashwan et al., 2023; Saleh et al., 2024; Stern, 2018). The ED is an extremely northerly, isolated area within the Arabian Nubian Shield. Two prominent litho-structural zones divide the southern region from the northernmost and central portions (Hamdy et al., 2022; Lasheen et al., 2022c; Rashwan et al., 2023). Landsat-8 OLI satellite image (source: U.S. Geological Survey (USGS); website: https://earthexplorer.usgs.gov/; Path: 173; Row: 43; acquisition date: 27 July 2024) was employed to show sampling locations and distinctive land/water characteristics in El Qulaan area (Figure 1b). A composite bands tool was applied to the OLI image using true-color bands (4, 3, and 2) to outline the land use characteristics of the study area (Figure 1b) (Lasheen et al., 2024a; Saralioglu and Vatandaslar, 2022). The Quaternary Red Sea sediments are parallel to the Nubian crystalline rocks along the coastline. The El Qulann mangrove area’s sediments consist mainly of diverse texture classes, ranging from muddy sand to dunes, which dominate most coastal regions (Figure 2a). Mangrove wetlands are found all over the area; they are incredibly productive plants because they produce many leaves and other organic detritus (Figures 2b–d). Organic matter not only benefits the mangrove ecosystem but also spreads to surrounding areas. Various dune types can be distinguished by their outward forms, unique configurations, and orientations.
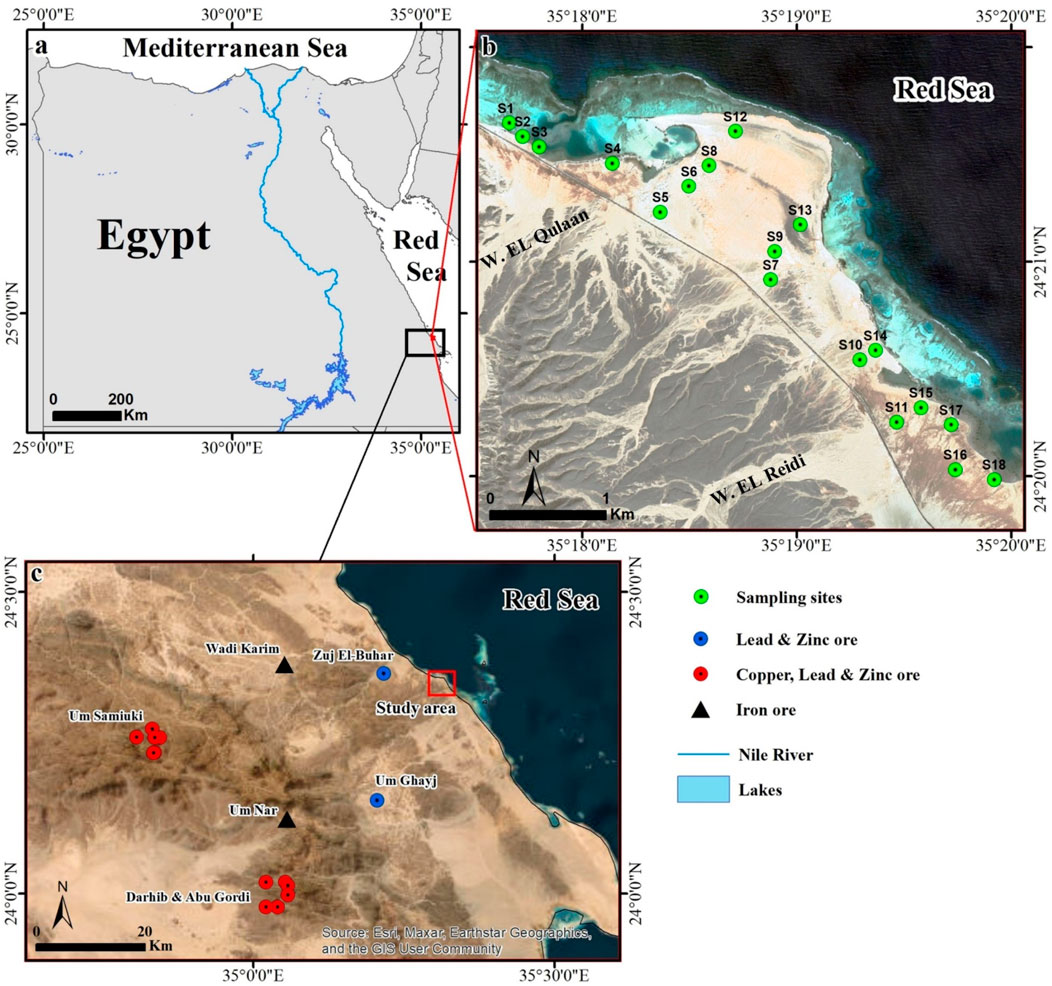
Figure 1. (a) El Qulaan area is located in the Red Sea region of South Egypt, approximately 90 km south of Marsa Alam. (b) Landsat-8 true color image (bands: 4, 3, 2) displaying the research area’s unique land/water features and coastal sediment sampling locations. (c) Showing location of the mining/ore and mineralization sites in the hilly basement rocks to the west of the study area.
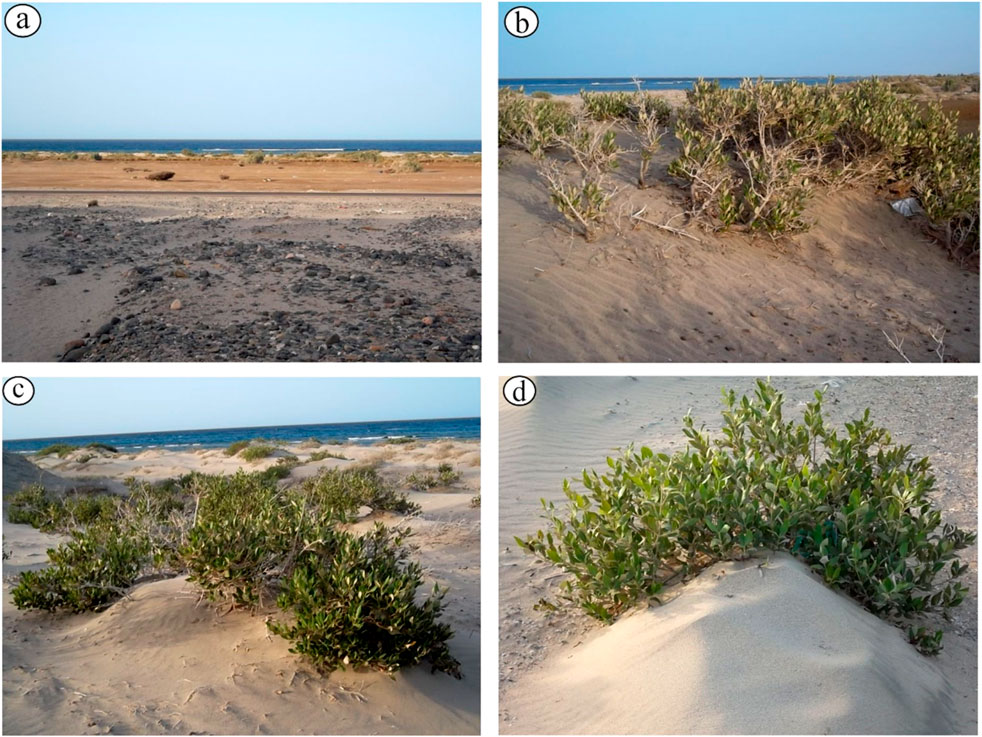
Figure 2. Field photographs: (a) Gravel and sandy mud sediments of El Qulann mangrove coastline, and (b–d) Wide mangrove swamps with sand dunes.
2.2 Sediment sampling and analysis
Sediment samples (S1-18) were extracted from the top layer (0–10 cm) of the Red Sea region of El Qulaan using a manual auger (Figure 1b). Clean 1-kg bags were used to carry the gathered samples to the lab for geochemical analysis. The pH and total organic matter (TOM) were also measured. A particle size of approximately 30 g was determined for each sediment sample. To remove carbonate and organic debris, each sample was treated with 15% H2O2 and diluted HCl (Song et al., 2023). Ternary diagrams were used to examine the textural classification of the sediments (Folk, 1980). This makes it possible to identify sediment based on the size of its grains, which can be gravel, sand, or mud (silt with clay) (Ardila et al., 2023). The particle size of the sediment sample was determined for sand and gravel fractions by wet sieving; for the mud fraction, the pipette method was utilized in compliance with the method of (Folk, 1980). The organic matter content of the sediment samples (2 g) was determined by sequentially losing weight and igniting in a furnace that was heated to 550 °C (Dean, 1974). The materials were weighed again following the procedure of (Dean, 1974), to determine the weight % without any organic elements. The smallest fractions (<63 µm) from the sediment samples were used to test for metals. These fractions were prepared using the method described by (Haluschak, 2006), which included grinding, screening, and air drying at room temperature. Sediment samples (1 g) were digested using nitric acid (HNO3), perchloric acid (HClO4), and hydrochloric acid (HCl). Subsequently, the samples were filtered to remove any residual material (Oregioni and Astone, 1984). Nine metals (Ba, Co, Pb, Cu, Cr, Ni, Zn, V, and Fe) were extracted from the sediments under study using ICP-OES at the National Research Centre (NRC), Giza, Egypt, in accordance with the methodology of (Oregioni and Astone, 1984). The limits of detection (LODs) for Ba, Co, Pb, Cu, Cr, Ni, Zn, V, and Fe are 0.2, 0.2, 1, 1, 0.5, 1, 3, 0.1, and 10 mg/kg, respectively. External reference standards were acquired from NIST (USA) and Merck Co. (Germany) to verify the precision and accuracy of the metal measurements. The recovery rate of the elements ranged from 93% to 102%. The ICP-OES operational parameters were meticulously optimized to ensure the maximum sensitivity of the elements being analyzed.
2.3 Ecological, SQGs and health risk assessment indices
This study involved the calculation and application of five ecological risk indices. Enrichment Factor (EF) (Zhang et al., 2016), calculated as EF = (Cs/Fes)/(Cb/Feb), where Cs is the sample’s analysed metal value, Cb is the metal crust background, and Feb is the Fe crust background (Supplementary Table S1). Background levels in the Earth’s crust for Cd, Co, Pb, Cu, Mn, Ni, Zn, and Fe are 0.58, 15, 25, 26, 1,058, 20, 66, and 50,000 mg/kg, respectively (Kabata-Pendias and Mukherjee, 2007). Contamination Factor (CF), calculated as CF = Cs/Cb (Hakanson, 1980), which is the result of dividing the detected metal concentration (Cs) in the sediments by local reference value (Cb) (Mahmoud et al., 2015). Index of Geo-accumulation (Igeo) calculated as
Potential Ecological Risk Index (PERI), calculated as PERI =
Additionally, three sediment quality guidelines (SQGs) were utilized, including the mean effects range median quotient (MERMQ), calculated as MERMQ =
2.4 Radioactivity assessment indices
In the Qulann Mangrove region along the Red Sea shoreline, eighteen sediment samples were analyzed for their radium (ppm), potassium (%), and thorium (ppm) content. The Nuclear Material Authority conducted these analyses using a 76 × 76 mm sodium iodide [NaI(Tl)] scintillation detector (Supplementary materials). Details regarding sample preparation and an explanation of the NaI detector’s abilities, constraints, and limitations can be found in the supplementary materials.
To understand the radiological consequences of the samples that were gathered, it is critical to estimate radiological parameters such as absorbed dose rates (Dair), radium equivalent activity (Raeq), internal and external indices (Hin and Hex), alpha and gamma indices (Iα and Iγ), and effective doses (AEDout and AEDin). The radionuclides 232Th, 226Ra, and 40K are represented by the formulas ATh, ARa, and AK, respectively. An overview of the formulas used to assess the various radiological risks and exposures is given in Table 1.
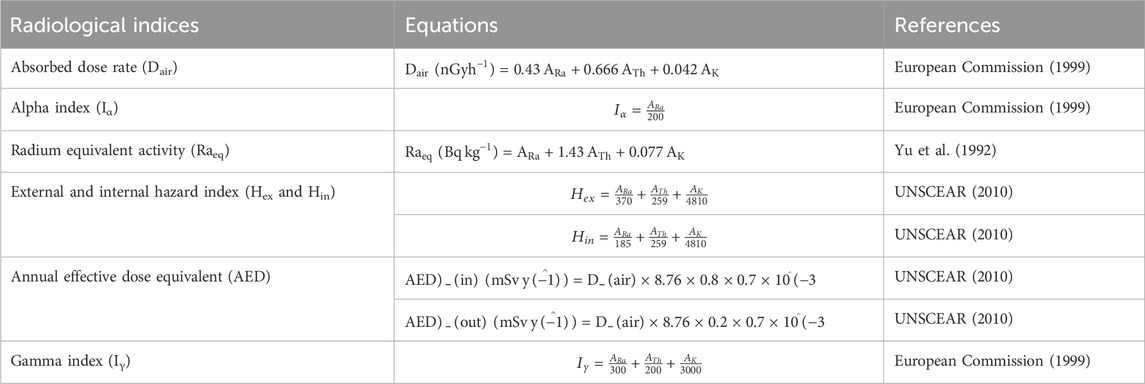
Table 1. The radioactive hazard equation indicators.
2.5 Metals separation
The sediment samples were separated into quarters after being given time to dry. The heavy minerals were then extracted from representative samples using the heavy liquid separation method, which involved bromoform. Following this, the samples underwent magnetic separation based on their magnetic susceptibility using a Frantz isodynamic separator. An Environmental Scanning Electron lens (ESEM, Phillips XL-30) was utilized to identify the heavy minerals, with verification performed using a binocular optic in the Nuclear Materials Authority laboratories.
2.6 Statistical analysis
To assess the sediments’ possible metal sources, statistical analyses comprising summary statistics, Pearson correlations, Factor analysis (FA), and cluster analysis were performed using Statgraphics software (Reimann et al., 2008). In this study, Kolmogorov-Smirnov normality test was performed to check the dataset’s normality of pH, organic matter and examined metals, while skewness and kurtosis was used for the grain size dataset. The test results showed that all datasets were within the predicted range of normal distribution (Table 2).
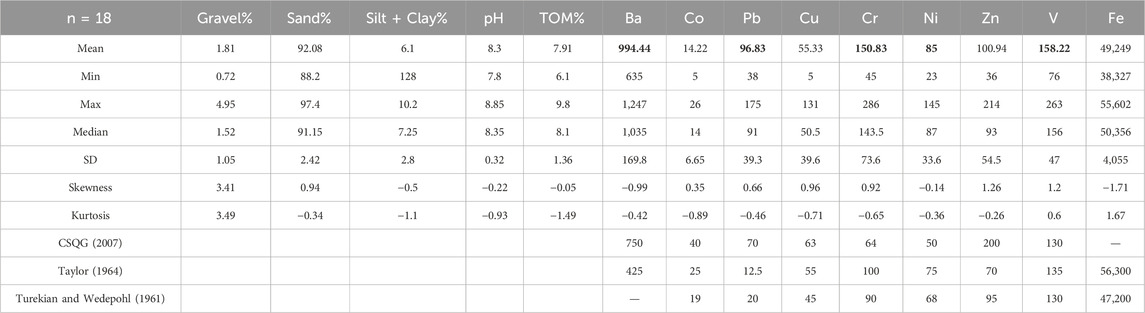
Table 2. Summary statistics of metals’ contents (mg/kg) in El Qulaan coastal sediments, Red Sea.
3 Results and discussion
3.1 Sediment’s composition and type
Supplementary Tables S3, S4 report the investigated values for sediment grain size and type, pH, and TOM, and Table 2 summarizes the results, and Figure 3 shows the spatially distributed values. The findings indicated that the coastal sediments in El Qulaan area had low to medium ratios of TOM (6.1%–9.8%) (Tyson, 1995; Ercegovac and Kostic, 2006) and were alkaline (pH = 8.3) (Table 2). This could be related to the mangrove swamps with many leaves and other organic debris that are scattered along the shoreline of El Qulaan area (Figure 2B). Furthermore, the lowest percentages of gravel (1.81%) and mud (silt + clay; 6.1%) were found in the El Qulaan strata, while the majority ratio (92%) was sand (Supplementary Table S3; Figure 3a). The analyzed sediment sites exhibited a zigzag pattern in terms of grain size%, pH, and organic matter values. pH values showed an increasing trend southward, while TOM showed the least ratios in the central sites (e.g., S5-12) (Figures 1B, 3B). The south sites (e.g., S10–11, S14-18) showed the highest ratios of sand, mud, pH and organic matter, where a significant amount of wadi discharge fluvial deposits are present, and where there was frequent flooding into the sea. In contrast, the central sites showed the highest ratios of gravel (Figures 1b, 2).
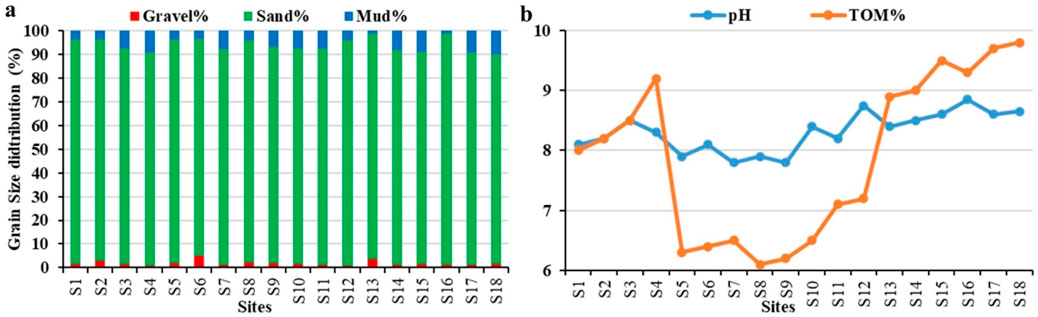
Figure 3. Spatial variations in sediment grain size (%) distribution (a) pH and total organic matter (TOM%; (b) in sediments of El Qulaan area, Red Sea.
3.2 Metal contents and spatial pattern
Supplementary Table S4 presents the metal concentrations found in coastal sediments of the Red Sea region of El Qulaan. A summary of these metals is provided in Table 2, with their spatial distribution across sampling sites (S1-18) illustrated in Figure 4. The metal concentrations observed were consistent with Canadian soil quality guidelines (CSQG, 2007) and Earth’s crust background levels (Taylor, 1964), as shown in Table 2. The metals analyzed, listed in descending order of concentration (mg/kg), were Fe (49,249) > Ba (994.44) > V (158.22) > Cr (150.83) > Zn (100.94) > Pb (96.83) > Ni (85) > Cu (55.33) > Co (14.22) (Table 2).
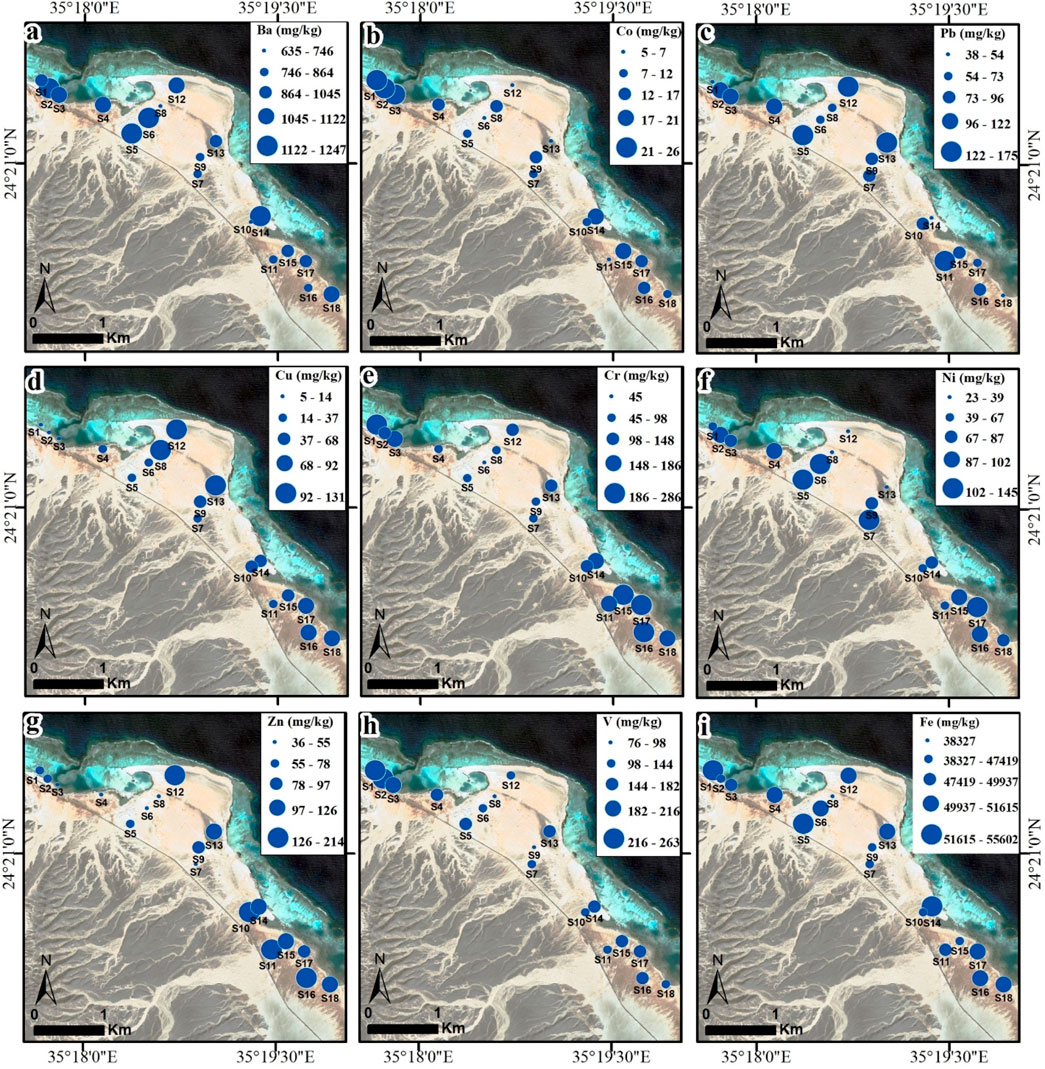
Figure 4. Spatial pattern of metal contents (mg/kg) in El Qulaan coastal sediments: Ba (a) Co (b) Pb (c) Cu (d) Cr (e) Ni (f) Zn (g) V (h) and Fe (i).
The contents of most metals (e.g., Pb, Cr, Ni, and V) in El Qulaan sediments exceeded those in Earth’s Crust in sedimentary rocks (average shales) (Turekian and Wedepohl, 1961), Earth’s crustal background (Taylor, 1964) and Canadian soil quality guidelines (CSQG, 2007). This enrichment is attributed to the location of El Qulaan mangrove sites at the terminus of Wadis that traverse alteration zones containing various mineral deposits (e.g., copper, lead, zinc, gold, and iron) (Figure 1c). During flooding episodes, these wadies act as channels for minerals that are swept from upstream rocks to the downstream outflow where mangroves are found, causing mineral deposition (Mohammed et al., 2024). Additional factors contributing to metal enrichment include basement rocks, mining operations (Figure 1c), and tourism activities along the Red Sea’s shoreline (Figure 1b) (Abdelaal et al., 2024; Al-Kahtany et al., 2023; Lasheen et al., 2024a). In contrast, Co, Cu, Zn, and Fe concentrations were below the levels recommended by Canadian guidelines (CSQG, 2007).
The spatial distribution of examined metals in sediments of El Qulaan area revealed that northern sediment sites (S1-4) exhibited the highest levels of Co (Figure 4b) and V (Figure 4h), which may be related to the tourism activities near El Qulaan mangrove beach to the north of the study area. Central locations (S5-9, 12–13) showed peak concentrations for most metals, including Ba (Figure 4a), Pb (Figure 4c), Cu (Figure 4d), Ni (Figure 4f), and Fe (Figure 4i). This metal enrichment could originate from the wadi-rich materials discharged from mining/mineralization sites to the west (Figure 1c) into Wadi El Qulaan, which is passing within the study area to the Red Sea coast (Figure 1b) (Mohammed et al., 2024). Furthermore, the southern sediment sites (S10-11, 14–18) displayed elevated levels of Cr (Figure 4e) and Zn (Figure 4g), which could relate to the mining materials discharged from W. El Reidi to the south of the study area (Figures 1b,c).
Table 3 compares the mean metal contents in sediments of El Qulaan area with global data on marine pollution in Egypt and worldwide. The average contents of Ba, Pb, Cr, Ni, and V in El Qulaan area exceeded those that are present in coastal sediments of Red Sea coastline (Badawy et al., 2018), W. El-Gemal outlet (Al-Kahtany et al., 2023), W. El-Gemal Island (Lasheen et al., 2024a), Abu Minqar Island, Hurghada (Abdelaal et al., 2024), Marsa Alam (Farhat et al., 2022), Gulf of Suez, Egypt (Nour et al., 2022), and in marine sediments of Ras Abu Ai Island and Aqaba coast, Saudi Arabia (Al-Kahtany and El-Sorogy et al., 2023; El-Sorogy et al., 2020), Mahshahr Bay and Northeast coast, Iran (Vaezi et al., 2015; Vaezi and Lak, 2023), and in lagoon-lake sediments, Turkey (Yüksel and Fikret, 2025 (Table 3). In contrast, the average Co, Cu, Zn, and Fe contents in El Qulaan area were lower compared to coastal sediments in China, India, and Taiwan (Fang and Chang, 2023; Gopal et al., 2023; Zhao et al., 2023) (Table 3).
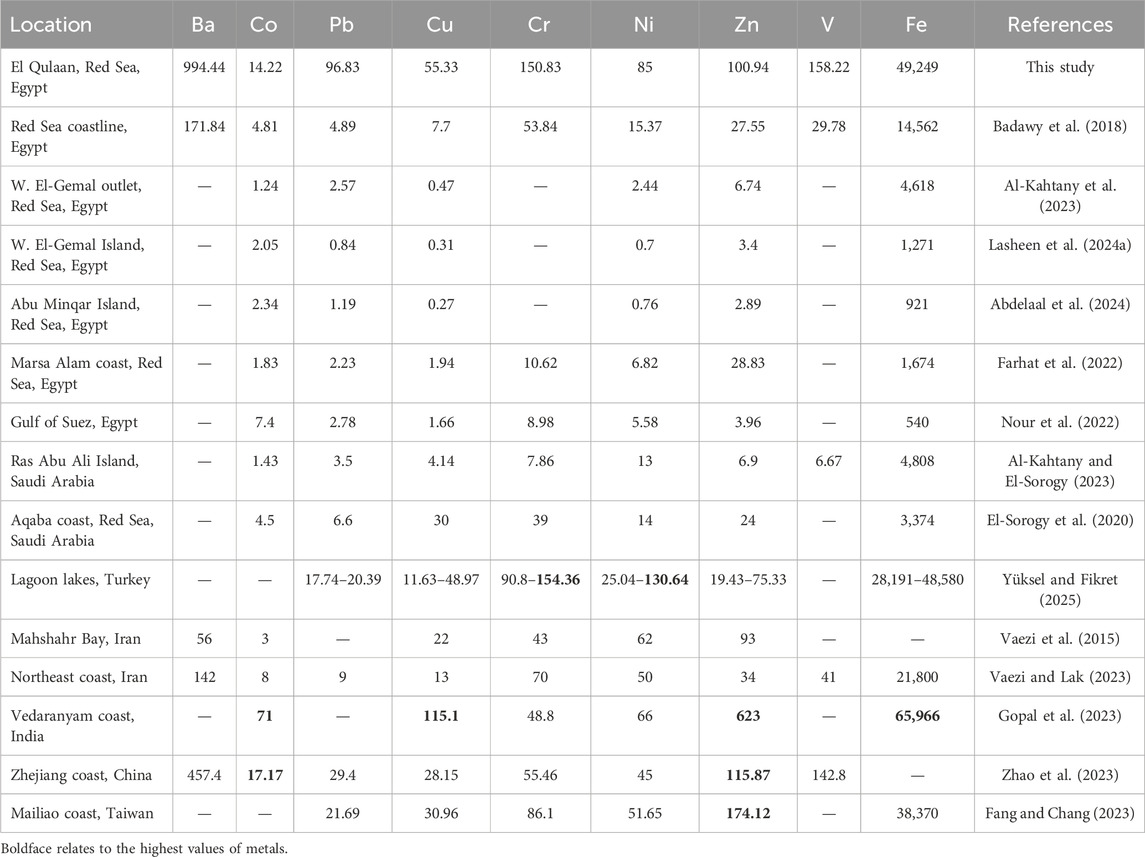
Table 3. The average metal’ contents (mg/kg) in El Qulaan sediments were compared to those found in Egyptian and global coastal sediments.
3.3 Source identification of metals pollution
Examination of eighteen sediment samples from the Red Sea coast’s El Qulaan area revealed strong Pearson’s correlations between metals and various factors including organic matter, pH, and particle size (Table 4; Figure 5). Significant negative relationships were observed between Mud% and Sand% (r = −0.92; p < 0.01), as well as with Gravel% (r = −0.52; p < 0.05) (Table 4). Additionally, Cu and Ni showed a negative correlation (r = −0.57; p < 0.05) (Figure 5f). Conversely, several positive correlations were identified: pH with TOM% (r = 0.74; p < 0.01) (Figure 5a) and Cr (r = 0.68; p < 0.01) (Figure 5c), Cr with TOM% (r = 0.73; p < 0.01) (Figure 5b), Ba with Fe (r = 0.66; p < 0.01) (Figure 5d), and Co with V (r = 0.56; p < 0.01) (Figure 5e). Moderate positive correlations were also found between pH and Zn (r = 0.48; p < 0.05), and V and TOM% (r = 0.47; p < 0.05) (Table 4). Notably, Pb exhibited no correlation with other parameters or metals in the examined sediments (Table 4).
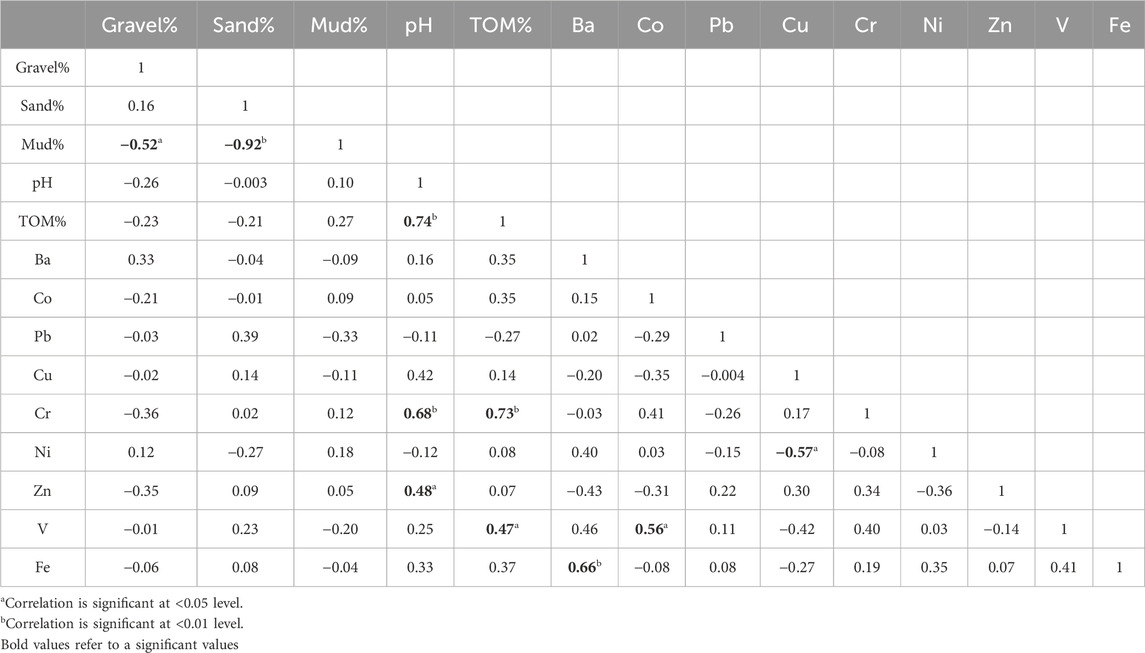
Table 4. Pearson correlations within sediment grain size, pH, organic matter, and the metals in coastal sediments of El Qulaan area, Red Sea.
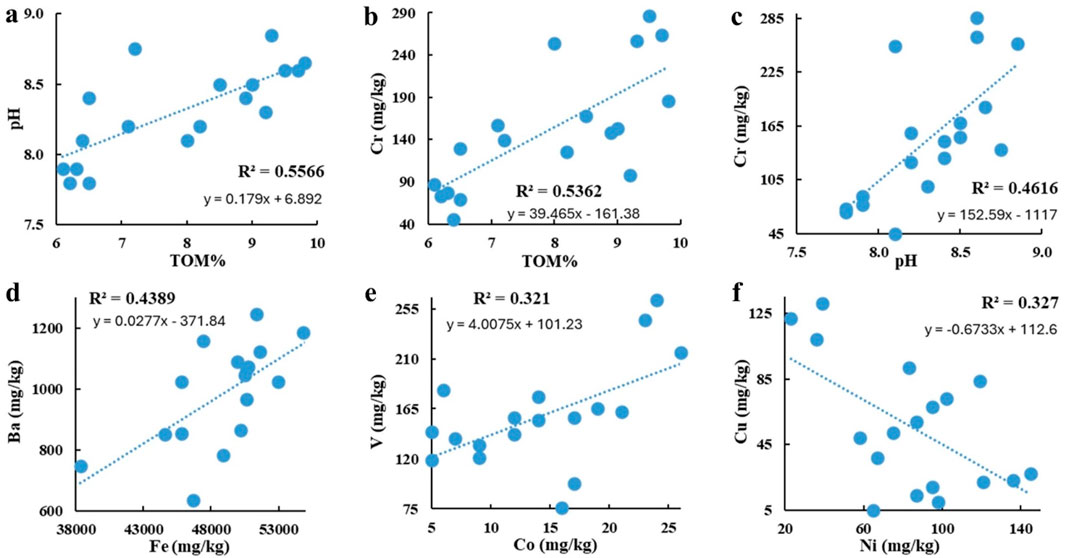
Figure 5. Significant bivariate relationships between pH, organic matter (TOM), and the examined metals (mg/kg): TOM% vs. pH (a) and Cr (b) pH vs. Cr (c) Ba vs. Fe (d) V vs. Co (e) and Cu vs. Ni (f) in El Qulaan coastal sediments, Red Sea.
Factor analysis (FA) was employed to identify hidden relationships among variables and provide a more detailed description of the multidimensional system. FA attempts to discover underlying factors that account for the observed correlations between variables. The FA of metals in El Qulaan sediments identified three factors (Table 5). The first factor (F1) accounted for 24% of the overall data variance, showing positive significant loads for Ba, Co, Cr, V, Fe, pH, and TOM% (Figure 6a). A potential common source for this could be mining sites and human activities related to tourism. The second factor (F2) explained 20% of data variance with significant loadings of Cu, Ni, and Zn (Figure 6a), potentially originating from the influx of debris from western wadis into El Qulaan’s shoreline (Figure 1b). Additionally, the third factor (F3) accounted for 19% of the overall data variation, with significant loading of Pb, Gravel%, Sand%, and Mud% (Figure 6A), suggesting a possible shared source from wadi discharge from western mineralization mining sites (e.g., Zuj El-Buhar; Figure 1c). Previous research indicates that certain metals exhibit positive correlations, implying similar sources (Liang et al., 2018).
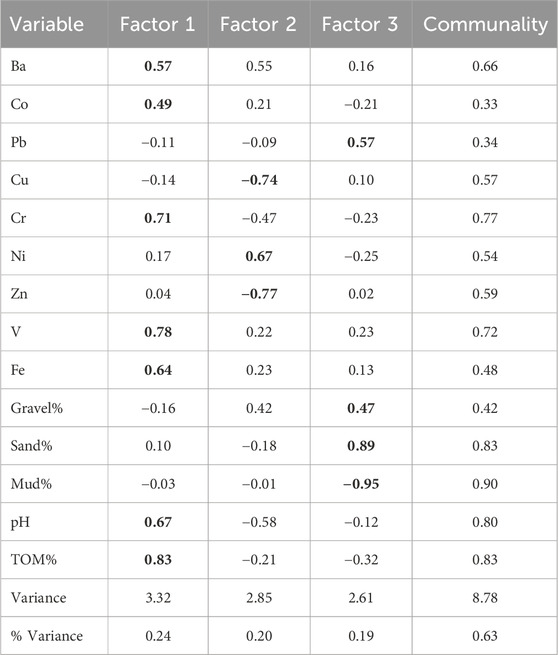
Table 5. Factor analysis with loading and variance (%) in sediment grain size, pH, organic matter, and the metals in coastal sediments of El Qulaan area, Red Sea.
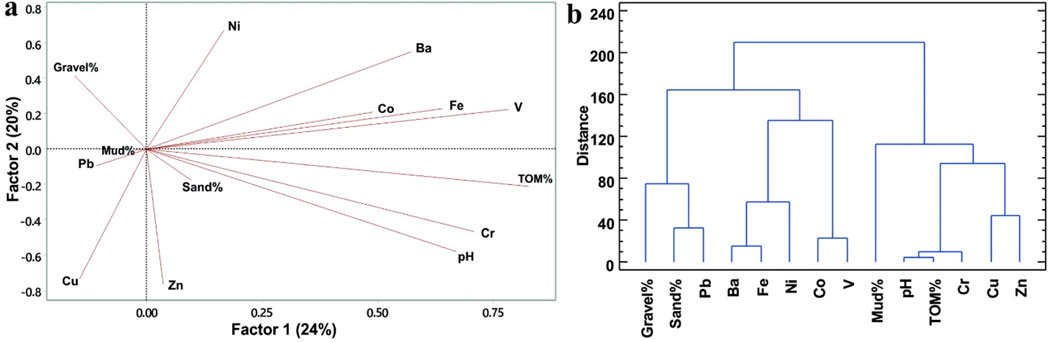
Figure 6. (a) Factor analysis (FA) plot of metals, grain size, pH, and organic matter in El Qulaan sediments. (b) Dendrogram of the investigated metals using Ward’s-Squared Euclidean Method.
Using the Ward-Squared Euclidean method for cluster analysis, the sediment characteristics and metal content in El Qulaan area were categorized into four distinct groups (Figure 6b). The first group comprises pH, TOM%, Cr, and Mud%, while the second group consists of Ba, Fe, Ni, Co, and V (Figure 6b). The third group includes Pb, Sand%, and Gravel%, and the fourth group is made up of Cu and Zn (Figure 6b). The results displayed in Figure 6 demonstrate that the cluster analysis corroborated the findings obtained from the FA analysis.
3.4 Ecological risk assessment indices
Supplementary Table S5 and Figure 7a present the ecological enrichment factor (EF) of the metals that were examined in the sediments of El Qulaan. Supplementary Table S5 and Figure 7a show that the average EF in all metals was 2.35, with a range of 0.18–7.42. According to Figure 7a, Ni had the largest mean EFs (4.3), indicating a significant enrichment (EF = 5–20). While Co, Cr, Zn, and V showed minimal enrichment (EF = 1–2), the average EFs of Ba, Pb, and Cu indicated moderate enrichment (EF = 2–5) (Figure 7a) (Abdelaal et al., 2024; Lasheen et al., 2024a; Wan et al., 2023) (Figure 7a).
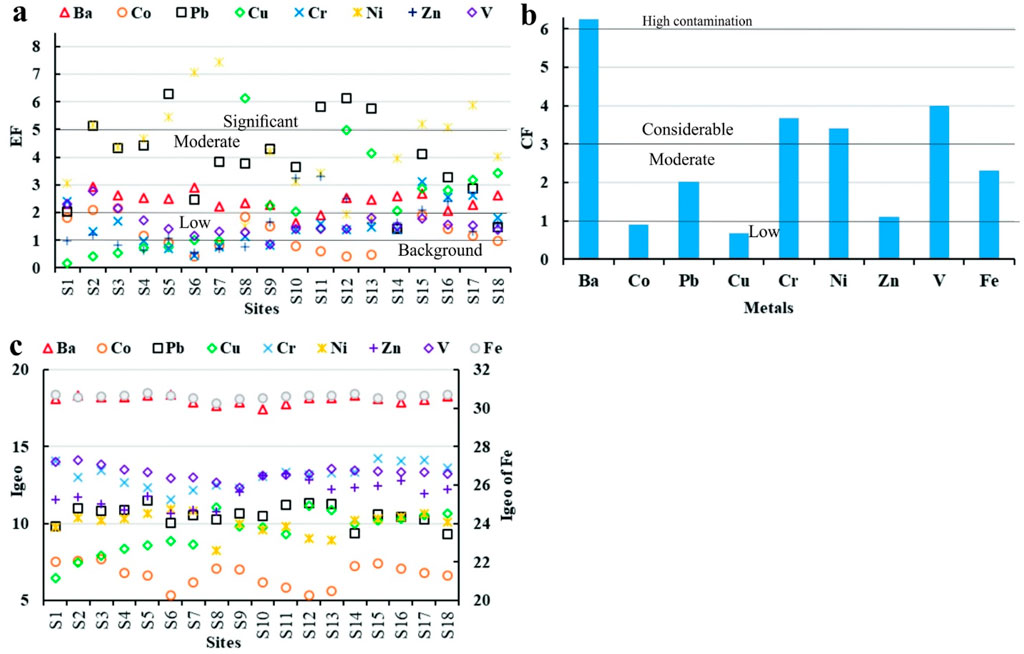
Figure 7. The calculated enrichment factor (EF: (a) contamination factor (CF: (b) and geo-accumulation index (Igeo: (c) of the investigated metals in El Qulaan coastal sediments, Red Sea.
The estimated ecological contamination factor (CF) for metals in El Qulaan sediments is presented in Supplementary Table S6 and Figure 7b. The CF value for each element which represents the whole investigated area had a decreasing order as follows: Ba (6.25) > V (3.99) > Cr (3.68) > Ni (3.42) > Fe (2.3) > Pb (2.02) > Zn (1.1) > Co (0.9) > Cu (0.67). Ba showed the highest CF value, suggesting high contamination (CF ≥ 6), This indicates that Ba is abundant in sediments—likely due to natural geological inputs—rather than strongly enriched by anthropogenic sources. While V, Cr, and Ni exhibited considerable contamination (3 ≤ CF < 6). This metal enrichment in coastal sediments may be linked to lead and zinc ore/mining sites (e.g., Zuj El-Buhar) in basement rocks west of the study area (Figure 1c). Additionally, the moderate contamination (1 ≤ CF < 3) of Pb, Zn, and Fe (Figure 7b) indicates that, besides mining sites, tourism along El Qulaan’s beachfront could contribute to metal contamination. In contrast, Co and Cu CFs demonstrated low contamination (CF < 1) (Figure 7b) (Abdelaal et al., 2024; Hakanson, 1980; Lasheen et al., 2024a) (Figure 7b).
Figure 7c and Supplementary Table S7 display the calculated ecological geo-accumulation index (Igeo) for various metals in El Qulaan’s coastal sediments. The Igeo values for these metals follow a descending sequence: Fe (30.61) > Ba (18.05) > V (13.3) > Cr (13.12) > Zn (11.91) > Pb (10.53) > Ni (10.01) > Cu (9.44) > Co (6.65). The Igeo readings for all examined metals ranged from 5.32 to 30.79, with an average of 13.74 (Figure 7c). This average indicates that the analyzed sediments are extremely contaminated, falling into class 7 (Igeo > 5) according to (Mueller, 1981) (Figure 7c).
Supplementary Table S6 illustrates the ecological pollution load index (PLI) values for the metals studied in the coastal sediments of the El Qulaan region. The calculated metal PLI value (2.15), indicates progressive contamination (PLI > 1) (Abdelaal et al., 2022; Hakanson, 1980). The PLI data suggests that the discharge of mining materials from wadies (e.g., W. El Qulaan, and W. El Reidi) to the west of the study area (Figures 1b,c) has led to severely polluted sediments (Mohammed et al., 2024).
To assess metal concentrations in El Qulaan’s coastal sediments, researchers employed the potential ecological risk index (PERI) and Eri (Hakanson, 1980). The findings are displayed in Supplementary Table S6. The Eri values for the metals under investigation were ranked in descending order: Ni (17.08) > Pb (10.11) > V (7.97) > Cr (7.36) > Co (4.5) > Cu (3.53) > Fe (2.3) > Zn (1.1) (Supplementary Table S6). Each of the analyzed metals showed low risk (Eri <40) (Supplementary Table S6). The PERI value for all metals (53.77), indicates low risk (PERI < 150) (Supplementary Table S6) (Abdelaal et al., 2024; Zhao et al., 2023).
3.5 Sediment quality guidelines (SQGs)
The estimated mean effects range median quotient (MERMQ) values for the metals examined in El Qulaan coastal sediments are presented in Supplementary Table S8 and Figure 8A, based on the effects range-low (ERL) and effects range-median (ERM) criteria (Long et al., 2000; 1995). Table 6 displays the comparison results of the SQGs ERL, ERM, threshold effect level (TEL), probable effect level (PEL) (Long et al., 2000; 1995), and Pb, Cu, Cr, Ni, and Zn contents in El Qulaan sediments. Table 6 shows that the lead PEL level of 91.3 mg/kg is exceeded by 50% (9 sites). Interestingly, 15 sites, or 83% of the total, exceed the Ni ERM limit (51.6 mg/kg), while 17 sites (94% of the total) exceed the Ni PEL level (36 mg/kg). Similarly, 72% of the sites are above the PEL value of Cr (90 mg/kg). Additionally, Table 6 indicates that the contents of Cu and Zn were below their respective ERM and PEL values. The computed MERMQ values of Pb, Cu, Cr, Ni, and Zn ranged from 0.43 to 1.08, with an average value of 0.83, representing medium-high priority risk levels (0.51< MERMQ ≤ 1.5) (Supplementary Table S8; Figure 8A).
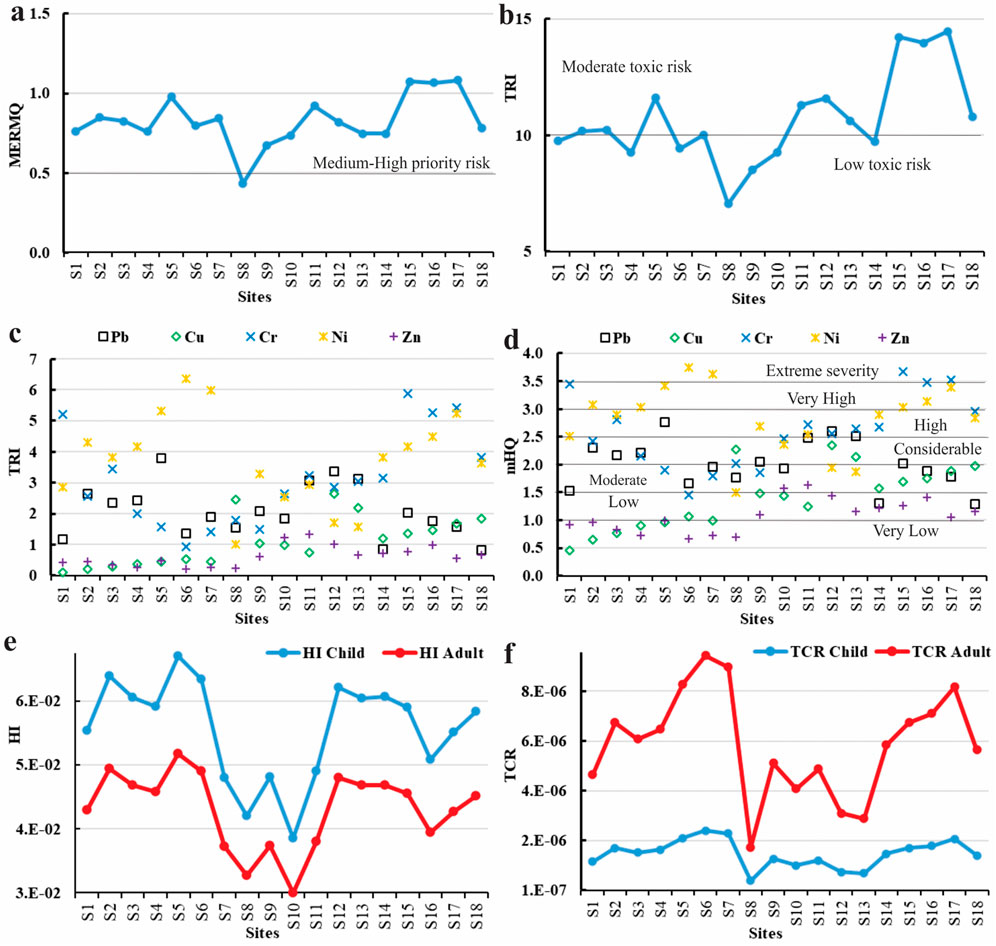
Figure 8. The values of SQG mean effects range median quotient (MERMQ: (a) toxic risk index (TRI: (b,c) modified hazard quotient (mHQ: (d) human health non-carcinogenic risk index (HI: (e) and human health carcinogenic risk index (TCR: (f) of the investigated metals in El Qulaan coastal sediments, Red Sea.
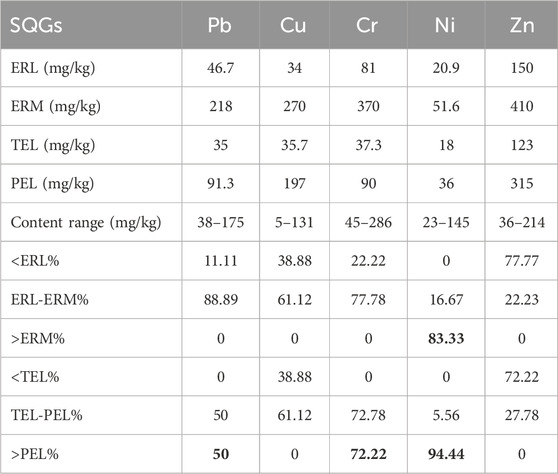
Table 6. Metal values in El Qulaan coastal sediments, compared to the SQGs ERL, ERM, TEL, and PEL levels (Long et al., 2000; Long et al., 1995; Macdonald et al., 1996).
Supplementary Table S9 and Figures 8B,C present the calculated Toxic risk index (TRI) values for Pb, Cu, Cr, Ni, and Zn in El Qulaan area sediments, derived from the SQGs TEL and PEL (Long et al., 2000; Long et al., 1995). The multi-element TRI value average (Figure 8B) across sediment sites varied between 7.05 and 14.46, with a 10.66 mean value (Figure 8B), indicating a moderate toxic risk (10 < TRI ≤ 15). Additionally, Ni (3.47) and Cr (3.1) exhibited the highest average TRI values, while Pb (2.1), Cu (1.11), and Zn (0.62) showed the lowest TRI values (TRI ≤ 5) (Zhang et al., 2016) (Figure 8C).
The calculated modified hazard quotient (mHQ) values for the metals examined in El Qulaan sediments are presented in Supplementary Table S10 and Figure 8D, based on the SQGs TEL, PEL, and severe effect level (SEL) (Benson et al., 2018; Long et al., 2000; 1995). The mean mHQ levels of the metals varied from 0.46 to 3.74, with an average of 1.98, suggesting a moderate severity of contamination (1.5 ≤ mHQ < 2.0) (Figure 8D). The average mHQ values for the metals followed a descending order: Ni (2.81) > Cr (2.59) > Pb (2.01) > Cu (1.42) > Zn (1.09) (Figure 8D). Furthermore, Pb exhibited considerable contamination severity (2.0 ≤ mHQ < 2.5), Cu and Zn demonstrated low contamination severity (1.0 ≤ mHQ < 1.5), while Cr and Ni showed high contamination severity (2.5 ≤ mHQ < 3.0) (Figure 8D).
3.6 Human health risk assessment
Supplementary Table S11 and Figure 8E present the calculated non-carcinogenic hazard index (HI) values for the metals that were analyzed in El Qulaan sediments, Red Sea. The HI risk levels for adults and children were estimated using the hazard quotient (HQ), reference dose (RfD), and chronic daily intake (CDIDermal) (Supplementary Table S2) of examined metals. (RAIS, 2017; U.S. EPA, 2002; 1989). Supplementary Table S11 indicates that the highest values of HQChild and HQAdult in sediments were found in Ba (5.47 × 10⁻² and 4.17 × 10⁻², respectively), and the HQ values of most metals are below the allowable limit (HQ < 1). Additionally, HIAdult values were slightly lower, ranging from 2.75 × 10⁻² to 4.92 × 10⁻² with a mean level of 4.06 × 10⁻², whereas HIChild levels varied from 3.6 × 10⁻² to 6.45 × 10⁻² with a mean value of 5.32 × 10⁻² (Figure 8E). There was no chronic non-carcinogenic risk indicated by the HI values of the metals in the sediments of El Qulaan (HI < 1) (Abdelaal et al., 2024; Emenike et al., 2020; Jalali et al., 2023; Lasheen et al., 2024a).
Total cancer risk (TCR) estimates for adults and children in the coastal sediments of El Qulaan are displayed in Supplementary Table S12 and Figure 8F. The TCR for Cd, Pb, and Ni was estimated using the cancer risk (CR), cancer slope factor (CSF), and chronic daily intake (CDIDermal) (U.S. EPA, 2007; U.S. EPA, 2005; U.S. EPA, 2002). Ni had the highest CR level (3.43 × 10⁻⁶), however none of the CR values for the metals being investigated exceed the 1 × 10⁻⁶ acceptable level given by (RAIS, 2017; U.S. EPA, 2002) (Supplementary Table S12). Additionally, TCRChild levels of Pb, Cr, and Ni in the sediments under study ranged from 4.8 × 10⁻⁷ to 2.5 × 10⁻⁶ with a mean level of 1.57 × 10⁻⁶ (Figure 8F). In contrast, TCRAdult values were higher, ranging from 1.83 × 10⁻⁶ to 9.54 × 10⁻⁶ with a mean value of 5.98 × 10⁻⁶ (Figure 8F). Supplementary Table S13 and Figure 8F show that the TCR values of Pb, Cr, and Ni in the sediments of El Qulaan were determined to be within the allowable limit, which is 1 × 10⁻⁶ for single elements and 1 × 10⁻⁴ for multi-elements (RAIS, 2017; U.S. EPA, 2002). To assess the cancer risk in sediments, TCR is crucial. Numerous cancers can also result from long-term exposure to traces of dangerous metals like Pb, Cr, and Ni (Abdelaal et al., 2024; Emenike et al., 2020; Lasheen et al., 2024a; Xu et al., 2022).
3.7 Radionuclide activity concentrations
For 18 sediments that were taken from El Qulann area of the Red Sea shoreline, the activity levels of radionuclides 226Ra, 232Th, and 40K, along with their statistical values, were evaluated (Table 7) and are spatially distributed in Figure 9. Notably, the value of 40K varies from 134.59 to 413.16 with a mean value 294.92 ± 77.86 Bq/kg (Figure 9c), which is below the global limit (412 Bq/kg) (UNSCEAR, 2010). 226Ra has an average ±SD of 19.99 ± 6.84 and varied from 11.1 to 33.3 Bq/kg (Figure 9b), with an aa average of 19.99 Bq/kg, which is below the overall mean of 33 Bq/kg (Al-Hamarneh and Awadallah, 2009; UNSCEAR, 2010; Zakaly et al., 2024). Furthermore, the 232Th activity in all representative ranges from 14.02 to 40.4 Bq/kg (Figure 9A), with a mean of 25.43 ± 7.54. This is below the global mean of 45 Bq/kg (Lasheen et al., 2023; UNSCEAR, 2010). In the samples that were gathered, the activity level order was 40K > 232Th > 226Ra (Table 6). The concentration of released K-bearing minerals, such as feldspar and muscovite, from the host rocks, granitic rocks (with high SiO2 content), can be attributed to the increased 40K activity in these samples (Abbasi et al., 2020; Kamar et al., 2022; Büyükuslu et al., 2018; Shahrokhi et al., 2020). The current 232Th, 40K, and 226Ra activity data were compared with the values from the previous worldwide review, which are indicated in Table 8. It is evident that the current activity level is lower than the overall limit of (UNSCEAR, 2010), and other regions such as those of Kumaun Himalaya, India (Ramola et al., 2011), Dois Rios beach, Brazil, (Freitas and Alencar, 2004), the Red Sea coast, Egypt (Harb, 2008); the Aegean coast, Greece (Shahrokhi et al., 2020); Corbu beach, Romania; (Margineanu et al., 2013); West Coast, Thailand (Malain et al., 2010); and Wadi El-Gemal Island, Red Sea, Egypt (Khaleal et al., 2023c).
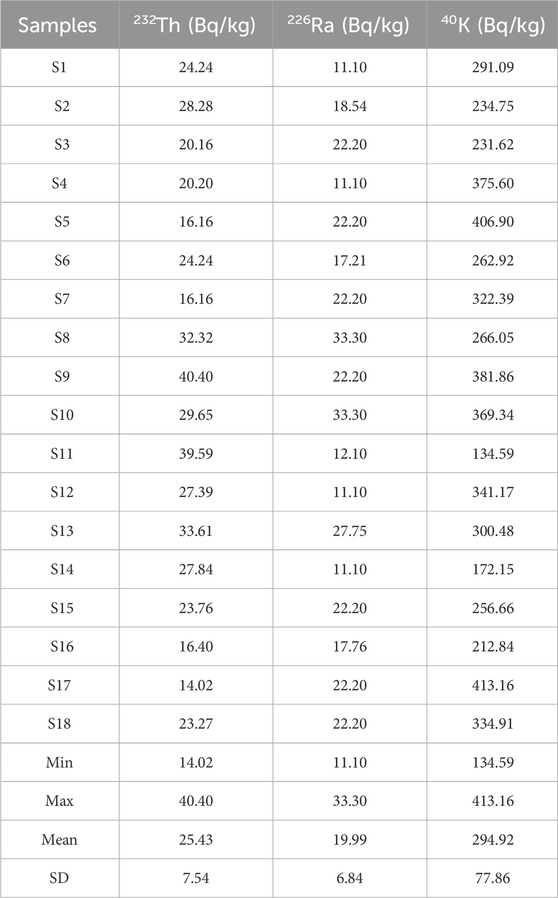
Table 7. Activity of226Ra,232Th, and40K levels of the beach sediments, El Qulaan area, Red Sea.
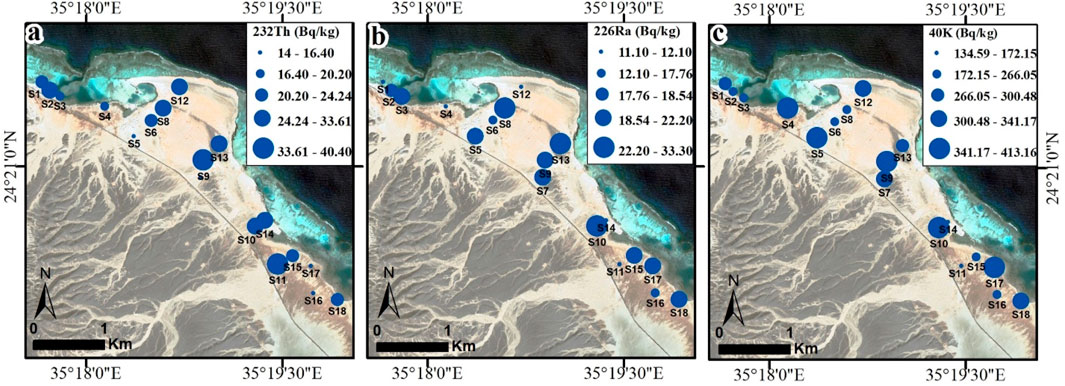
Figure 9. Spatial distribution of the radionuclide’s concentrations (Bq/kg) of 232Th (a) 226Ra (b) and 40K (c) in El Qulaan coastal sediments, Red Sea.
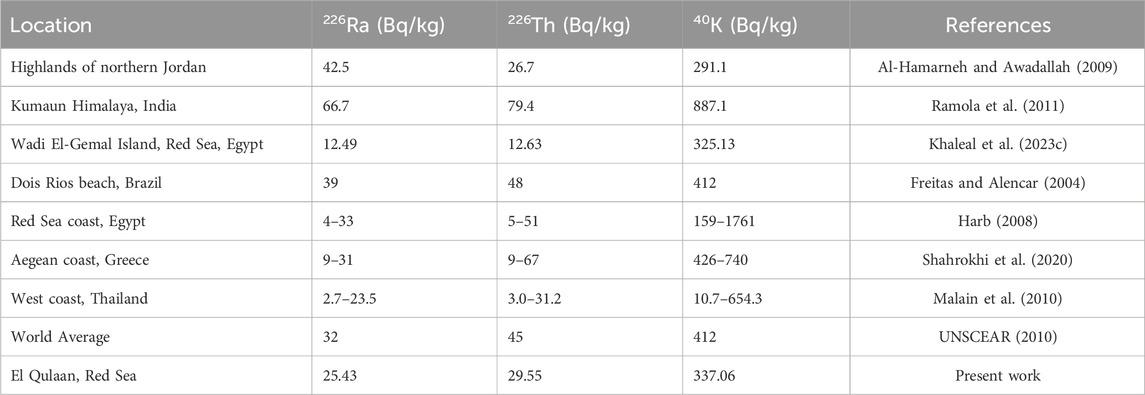
Table 8. Comparison of226Ra,232Th, and40K concentrations of El Qulaan area with different areas in Egypt and worldwide.
3.8 Radiological risk indices
The evaluation of the radioactivity level in the sediments gathered along the Red Sea shoreline at El Qulann area was conducted using various indices, including radium equivalent activity, absorbed gamma dose, annual effective doses for both indoor and outdoor environments, alpha and gamma index, internal and external indices, and effective dose for tissues in humans (Table 9). The absorbance dose rate (Dair) index is employed to evaluate gamma rays emitted over a meter from the surface of the Earth (Kumar et al., 2024; UNSCEAR, 2000). With a mean of 37.92 ± 6.58 nGy h-1, it ranges from 27.5 to 52.49 and is within the global safety threshold of 59 nGy h-1 (UNSCEAR, 2010). The gamma ray exposition dose and internal and external alpha particles are responsible for the radium equivalent (Raeq). The computed values of Raeq are within the advised range (370 Bq/kg) of (UNSCEAR, 2010), which range from 57.6 to 109.38 Bq/kg with a mean value of 93.64 ± 15.83 Bq/kg (Table 9).
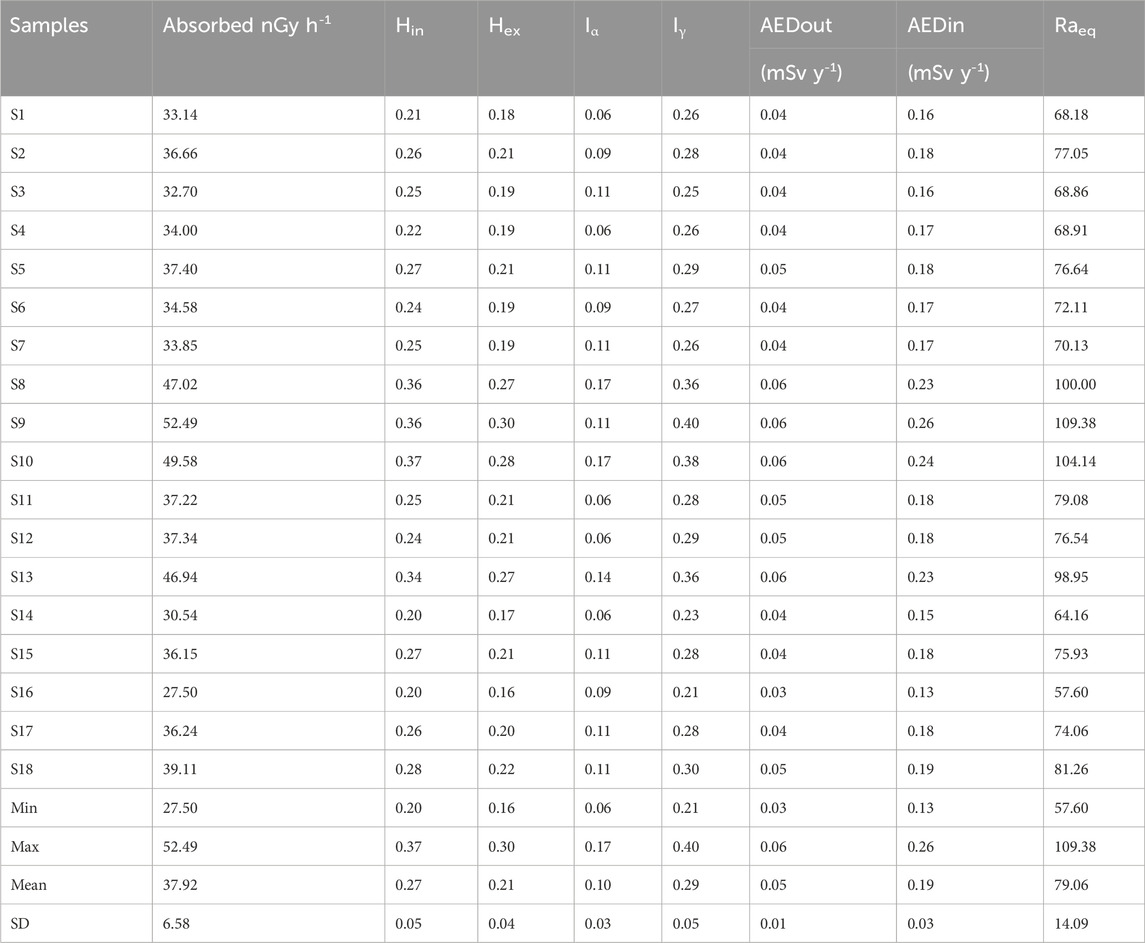
Table 9. Radiological parameters of El Qulaan coastal sediments, Red Sea.
The absorbed dose (Dair) results, conversion factor of 0.7 Sv Gy-1, and both indoor and outdoor occupant factors of 0.8 and 0.2, respectively, are employed to determine the effective doses annually with outdoor and interior inputs (O’brien and Sanna, 1976; UNSCEAR, 2000). The mean estimated annual outdoor effective dose (AEDout) value (0.03–0.06) is 0.05 ± 0.01 mSv y-1, which is within the global safety threshold (0.07 mSv y-1) of (UNSCEAR, 2010). Moreover, the mean annual indoor effective dose value (0.13–0.26) (AEDin) is 0.19 ± 0.03 mSv y-1, which is lower than the permissible level (0.41 mSv y-1) of (UNSCEAR, 2010).The detrimental impact of radiation on human tissues can be estimated by measuring the internal and exterior radiation indices (Hin & Hex) (Abbasi et al., 2020; El Saeed R. Lasheen et al., 2022; UNSCEAR, 2010). The values of Hin (0.2–0.37) and Hex (0.16–0.3) for each gathered samples are below unity with mean corresponding values 0.27 ± 0.05, and 0.21 ± 0.04, respectively, showing that the obtained samples do not pose any serious health risks (Attallah et al., 2018; European Commission, 1999).
The alpha index (Iα) has low levels varied from 0.06 to 0.17 with a mean 0.1 ± 0.03, which is below 1, suggesting negligible any serious health risks associated these samples. Moreover, the gamma index (Iγ) has varied from 0.21 to 0.04 with an average of 0.29 ± 0.05, which is below unity. It indicates that there is very little radioactive health concerns associated with El Qulaan sediments (Table 9).
3.9 Mineralization
Heavy minerals detected using a binocular microscope and identified using ESEM are summarized in Figure 10. The main separate minerals are garnet and rutile (Figure 10). Garnet is deployed as grinding material, water filter, water jet cutting process material, and abrasive powder manufacturer. It can also be used to partially substitute fine aggregate in concrete, which has an impact on the strength, flexibility, and water absorption capabilities of the composite material (Ruslan et al., 2024). The garnet grains under examination have ESEM data indicating that they are rich in almandine (Al = 10.9%, Fe = 25.1%, Mn = 3.9%, Mg = 3%, and Ca = 1%) (Figure 10a).
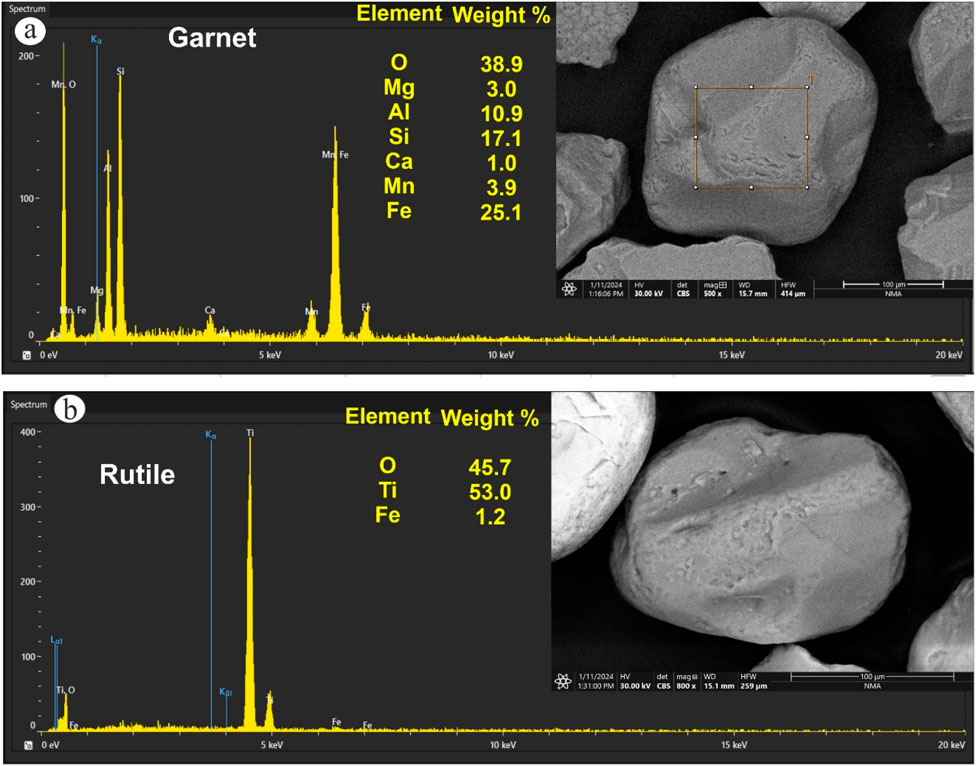
Figure 10. ESEM analysis of separated heavy minerals: (a) Garnet; and (b) R.utile.
Among various types of rocks, rutile is a frequent accessory mineral that represents a stable polymorph during chemical and mechanical weathering at all temperatures (Lueder et al., 2024). Therefore, rutile is a common heavy mineral found in sedimentary rocks. Likewise, rutile (TiO2) can withstand numerous sedimentary cycles because of its basic chemical makeup, which protects it from reactions even during burial and diagenesis. Because rutile can comprise a wide range of minor elements, depending in part on the host rock or formation conditions, it can be utilized as a petrogenetic identifier. The ESEM data for the rutile grains show that they are composed mainly of 1.2% Fe, and 53% Ti (Figure 10b).
3.10 Strengths and limitations
This study has significant strengths. It represents the first assessment of metal contamination levels and their corresponding ecological and health risks to humans in coastal sediments near El Qulaan, along the Red Sea shoreline in southern Egypt. Nevertheless, the study’s approach has limitations that should be addressed in future research. The fieldwork and sample collection (at about 10 cm) were limited to a single expedition in June 2023. Sediment sampling was restricted to the coastline of the study area. The researchers were unable to collect samples from the beach sediments and the eastern section of the region that extends into the open sea. Furthermore, future studies should provide a more detailed examination of core and source sampling, isotope geochemistry (e.g., Pb), seasonal changes in hydrodynamics, biological activity, and potential remediation strategies and policy implications.
4 Conclusion
An investigation was conducted to assess nine metals’ concentrations, their geographical distribution, and associated ecological and health risks in 18 surface sediment samples from El Qulaan area, Red Sea coastline. The research included analysis of pH levels, organic matter content, and sediment grain characteristics. The findings revealed that the examined sediments were alkaline (pH = 8.3) and predominantly sandy (92%), with moderate organic matter ratios (7.91%), which might be attributed to the abundance of mangrove swamps in the area. The metal contents (mg/kg) were found to decrease in the following order: Fe (49,249) > Ba (994.44) > V (158.22) > Cr (150.83) > Zn (100.94) > Pb (96.83) > Ni (85) > Cu (55.33) > Co (14.22). These findings were then compared to similar metal concentrations observed in coastal sediments from both Egyptian and global locations. The sediments in El Qulaan contained higher levels of Ba, Pb, Cr, Ni, and V, surpassing the Canadian soil quality guidelines and the Earth’s crust background. The average levels of Ba, Pb, Cr, Ni, and V in El Qulaan surpassed those discovered in Egyptian and global coastal sediments. However, those of Co, Cu, Zn, and Fe were lower compared to coastal sediments in China, India, and Taiwan. Regarding spatial patterns, the highest concentrations of most examined metals (Ba, Pb, Cu, Ni, and Fe) were found in the central locations (S5-9, 12–13).
Statistical analysis using Pearson correlations showed significant negative associations between Mud% and Sand%, and Cu and Ni. Significant positive correlations were found between pH and TOM%, Ba and Fe, and Co and V. Notably, Pb exhibited no correlation with other parameters or metals in the examined sediments. Factor analysis (FA) results for metals, grain size, pH, and organic matter revealed three factors. F1 exhibited 24% variance with loads of Ba, Co, Cr, V, Fe, pH, and TOM%. A potential common source for this could be mining sites and human activities related to tourism. F2 explained 20% of the data variance with loads of Cu, Ni, and Zn, potentially originating from potentially originating from wadi debris west to El Qulaan’s shoreline. F3 explained 19% of the variance with loads of Pb, Gravel%, Sand%, and Mud%. The cluster analysis showed four groups: pH, Cr, TOM%, and Mud% (first); Ba, Fe, Ni, Co, and V (second); Pb, Sand%, Gravel% (third); Cu and Zn (fourth).
The enrichment factor (EF) showed background (Ba), minimal (Co, Cr, Zn and V), moderate (Ba, Pb, and Cu), and significant (Ni) metal enrichment. The contamination factor (CF) values indicated low (Co and Cu), moderate (Pb, Zn, and Fe), and considerable (Cr, Ni, and V), and high contamination (Ba). The geo-accumulation index (Igeo) of all the examined metals indicated extremely contaminated sediments (class 7: Igeo > 5). Pollution load index (PLI) of examined metals in El Qulaan sediments showed progressive contamination (PLI > 1). The potential ecological risk index (PERI) and Eri of all the metals showed low risk (Eri <40 and PERI <150), and Ni was the highest in Eri, followed by Pb. The mean effects range median quotient (MERMQ) in sediments showed medium-high priority risk (0.51< MERMQ ≤1.5), and Pb, Cr and Ni contents exceeded their respective SQGs ERM and PEL. Toxic risk index (TRI) of metals showed moderate toxicity risk (10 < TRI ≤15), and modified hazard quotient (mHQ) of metals showed moderate severity of contamination (1.5 ≤ mHQ < 2.0). Furthermore, Ba had the highest levels of HIChild and HIAdult, whereas Ni had the highest levels of TCRChild and TCRAdult. Overall, there was no chronic non-carcinogenic risk (HI < 1) in El Qulaan sediments, and total cancer risk (TCR) values were less than the allowable limit specified by the U.S. EPA.
The distribution of naturally occurring radioactive elements along the sediment sites in the Red Sea coastline’s El Qulaan area was investigated in this study. The mean 40K, 232Th, and 226Ra activity of the gathered samples are 294.92 ± 77.86, 19.99 ± 6.84, and 25.43 ± 7.54, respectively, which is within the global safety threshold. Numerous radiological indicators, such as the radium equivalent activity, absorbed dose rate, effective dosage yearly, and other health indices (Hγ, Hin, Hex, and Hα), are determined to the sediments along the shoreline. These metrics’ values are below the median global value, indicating little effects from naturally occurring gamma radiation emissions. The identified heavy minerals are garnet and rutile.
Data availability statement
The original contributions presented in the study are included in the article/Supplementary Material, further inquiries can be directed to the corresponding authors.
Author contributions
AA: Supervision, Investigation, Software, Writing – original draft, Methodology, Writing – review and editing. BE-B: Writing – review and editing, Formal Analysis, Supervision. GS: Formal Analysis, Validation, Resources, Writing – review and editing, Methodology, Conceptualization. MS: Writing – review and editing, Data curation, Supervision. GK: Writing – review and editing, Formal Analysis, Visualization. IS: Resources, Data curation, Writing – review and editing, Validation. EL: Supervision, Writing – original draft, Software, Investigation, Writing – review and editing, Conceptualization, Visualization.
Funding
This work was supported and funded by the Deanship of Scientific Research at Imam Mohammad Ibn Saud Islamic University (IMSIU) (grant number IMSIU-DDRSP2502).
Conflict of interest
The authors declare that the research was conducted in the absence of any commercial or financial relationships that could be construed as a potential conflict of interest.
Generative AI statement
The author(s) declare that no Generative AI was used in the creation of this manuscript.
Any alternative text (alt text) provided alongside figures in this article has been generated by Frontiers with the support of artificial intelligence and reasonable efforts have been made to ensure accuracy, including review by the authors wherever possible. If you identify any issues, please contact us.
Publisher’s note
All claims expressed in this article are solely those of the authors and do not necessarily represent those of their affiliated organizations, or those of the publisher, the editors and the reviewers. Any product that may be evaluated in this article, or claim that may be made by its manufacturer, is not guaranteed or endorsed by the publisher.
References
Abbasi, A., Zakaly, H. M. H., and Mirekhtiary, F. (2020). Baseline levels of natural radionuclides concentration in sediments east coastline of north Cyprus. Mar. Pollut. Bull. 161, 111793. doi:10.1016/J.MARPOLBUL.2020.111793
Abdelaal, A., Abdelkader, A. I., Alshehri, F., Elatiar, A., and Almadani, S. A. (2022). Assessment and spatiotemporal variability of heavy metals pollution in water and sediments of a coastal landscape at the nile Delta. WaterSwitzerl. 14, 3981. doi:10.3390/w14233981
Abdelaal, A., Lasheen, E. S. R., Mansour, A. M., Mohamed, A. W., Osman, M. R., Khaleal, F. M., et al. (2024). Assessing the ecological and health risks associated with heavy metal pollution levels in sediments of big giftun and abu minqar islands, east hurghada, Red Sea, Egypt. Mar. Pollut. Bull. 198, 115930. doi:10.1016/J.MARPOLBUL.2023.115930
Al-Hamarneh, I. F., and Awadallah, M. I. (2009). Soil radioactivity levels and radiation hazard assessment in the highlands of northern Jordan. Radiat. Meas. 44, 102–110. doi:10.1016/J.RADMEAS.2008.11.005
Al-Kahtany, K., and El-Sorogy, A. S. (2023). Contamination and health risk assessment of surface sediments along ras abu ali island, Saudi Arabia. J. King Saud. Univ. Sci. 35, 102509. doi:10.1016/j.jksus.2022.102509
Al-Kahtany, K., Nour, H. E., El-Sorogy, A. S., and Alharbi, T. (2023). Ecological and health risk assessment of heavy metals contamination in mangrove sediments, Red Sea Coast. Mar. Pollut. Bull. 192, 115000. doi:10.1016/j.marpolbul.2023.115000
Al-Mur, B. A., and Gad, A. (2022). Radiation hazard from natural radioactivity in the marine sediment of jeddah Coast, Red Sea, Saudi Arabia. J. Mar. Sci. Eng. 10, 1145. doi:10.3390/jmse10081145
Alharshan, G. A., Kamar, M. S., Lasheen, E. S. R., Ene, A., Uosif, M. A. M., Awad, H. A., et al. (2022). Distribution of radionuclides and radiological health assessment in Seih-Sidri area, Southwestern sinai. Int. J. Environ. Res. Public Health 19, 10717. doi:10.3390/IJERPH191710717
AlZahrani, J. H., Alharbi, W. R., and Abbady, A. G. E. (2011). Radiological impacts of natural radioactivity and heat generation by radioactive decay of phosphorite deposits from northwestern Saudi Arabia. Aust. J. Basic Appl. Sci. 5.
Ardila, P. A. R., Alonso, R. Á., Valsero, J. J. D., García, R. M., Cabrera, F. Á., Cosío, E. L., et al. (2023). Assessment of heavy metal pollution in marine sediments from southwest of mallorca island, Spain. Environ. Sci. Pollut. Res. 30, 16852–16866. doi:10.1007/s11356-022-25014-0
Attallah, M. F., Hilal, M. A., and Mohamed, Y. T. (2018). Preliminary investigations on reducing the high radiation risk level of TENORM scale waste from petroleum industry. Radiochim. Acta 106, 793–800. doi:10.1515/ract-2017-2904
Badawy, W. M., El-Taher, A., Frontasyeva, M. V., Madkour, H. A., and Khater, A. E. M. (2018). Assessment of anthropogenic and geogenic impacts on marine sediments along the coastal areas of Egyptian Red Sea. Appl. Radiat. Isotopes 140, 314–326. doi:10.1016/j.apradiso.2018.07.034
Benson, N. U., Adedapo, A. E., Fred-Ahmadu, O. H., Williams, A. B., Udosen, E. D., Ayejuyo, O. O., et al. (2018). A new method for assessment of sediment-associated contamination risks using multivariate statistical approach. MethodsX 5, 268–276. doi:10.1016/j.mex.2018.03.005
Büyükuslu, H., Özdemir, F. B., Öge, T. O., and Gökce, H. (2018). Indoor and tap water radon (222Rn) concentration measurements at Giresun university campus areas. Appl. Radiat. Isotopes 139, 285–291. doi:10.1016/j.apradiso.2018.05.027
CSQG (2007). “Canadian soil quality guidelines (CSQG) for the protection of environmental and human health: summary tables,”. Winnipeg, MB, Canada: Canadian Council of Ministers of the Environment CCME. doi:10.1177/004947559702700223
Dean, W. E. (1974). Determination of carbonate and organic matter in calcareous sediments and sedimentary rocks by loss on ignition: Comparison with other methods. SEPM J. Sediment. Res. 44. doi:10.1306/74d729d2-2b21-11d7-8648000102c1865d
El Nemr, A., and El-Said, G. F. (2014). The pollution status along the Red Sea: a review. Blue Biotechnol. J. 3 (4), 403–446.
El-Sorogy, A. S., Youssef, M., Al-Kahtany, K., and Saleh, M. M. (2020). Distribution, source, contamination, and ecological risk status of heavy metals in the red sea-gulf of Aqaba coastal sediments, Saudi Arabia. Mar. Pollut. Bull. 158, 111411. doi:10.1016/j.marpolbul.2020.111411
Emenike, P. G. C., Tenebe, I. T., Neris, J. B., Omole, D. O., Afolayan, O., Okeke, C. U., et al. (2020). An integrated assessment of land-use change impact, seasonal variation of pollution indices and human health risk of selected toxic elements in sediments of river atuwara, Nigeria. Environ. Pollut. 265, 114795. doi:10.1016/j.envpol.2020.114795
Ercegovac, M., and Kostic, A. (2006). Organic facies and palynofacies: nomenclature, classification and applicability for petroleum source rock evaluation. Int. J. Coal Geol. 68, 70–78. doi:10.1016/j.coal.2005.11.009
European Commission (1999). Radiation protection 112: radiological protection principles concerning the natural radioactivity of building materials. Luxembourg: Office for Official Publications of the European Communities.
Fang, T. H., and Chang, J. R. (2023). The geochemical and environmental characteristics of trace metals in coastal sediment discharge off the mailiao industrial zone of central Western Taiwan. WaterSwitzerl. 15, 250. doi:10.3390/w15020250
Farhat, H. I., Gad, A., Saleh, A., and Abd El Bakey, S. M. (2022). Risks assessment of potentially toxic elements’ contamination in the Egyptian Red Sea surficial sediments. Land (Basel) 11, 1560–21. doi:10.3390/land11091560
Fathy, D., Zakaly, H. M. H., Lasheen, E. S. R., Elsaman, R., Alarifi, S. S., Sami, M., et al. (2023). Assessing geochemical and natural radioactivity impacts of hamadat phosphatic mine through radiological indices. PLoS One 18, e0287422. doi:10.1371/JOURNAL.PONE.0287422
Fine, M., Cinar, M., Voolstra, C. R., Safa, A., Rinkevich, B., Laffoley, D., et al. (2019). Coral reefs of the Red Sea — challenges and potential solutions. Regional Stud. Mar. Sci. 25, 100498. doi:10.1016/j.rsma.2018.100498
Freitas, A. C., and Alencar, A. S. (2004). Gamma dose rates and distribution of natural radionuclides in sand beaches—Ilha grande, southeastern Brazil. J. Environ. Radioact. 75, 211–223. doi:10.1016/J.JENVRAD.2004.01.002
Gopal, V., Krishnamurthy, R. R., Vignesh, R., Sabari Nathan, C., Anshu, R., Kalaivanan, R., et al. (2023). Assessment of heavy metal contamination in the surface sediments of the vedaranyam Coast, southern India. Reg. Stud. Mar. Sci. 65, 103081. doi:10.1016/j.rsma.2023.103081
Hakanson, L. (1980). An ecological risk index for aquatic pollution control.a sedimentological approach. Water Res. 14, 975–1001. doi:10.1016/0043-1354(80)90143-8
Hamdy, M. M., Lasheen, E. S. R., and Abdelwahab, W. (2022). Gold-bearing listwaenites in ophiolitic ultramafics from the eastern desert of Egypt: subduction zone-related alteration of Neoproterozoic mantle? J. Afr. Earth Sci. 193, 104574. doi:10.1016/j.jafrearsci.2022.104574
Harb, S. (2008). Natural radioactivity and external gamma radiation exposure at the coastal Red Sea in Egypt. Radiat. Prot. Dosim. 130, 376–384. doi:10.1093/RPD/NCN064
Hargalani, Z. F., Karbassi, A., Monavari, S. M., and Abroomand Azar, P. (2014). A novel pollution index based on the bioavailability of elements: a study on anzali wetland bed sediments. Environ. Monit. Assess. 186, 2329–2348. doi:10.1007/s10661-013-3541-4
Jalali, M., Moradi, F., Jalali, M., and Wang, J. (2023). Risk assessment of available and total heavy metals contents in various land use in calcareous soils. Environ. Earth Sci. 82, 298–19. doi:10.1007/s12665-023-10949-5
Jameson, S. C., Ammar, M. S. A., Saadalla, E., Mostafa, H. M., and Riegl, B. (1999). A coral damage index and its application to diving sites in the Egyptian Red Sea. Coral Reefs 18, 333–339. doi:10.1007/s003380050208
Kamar, M. S., Salem, I. A., El-Aassy, I. E., El-Sayed, A. A., Zakaly, H. M. H., Alzahrani, A. M., et al. (2022). An extended investigation of high-level natural radioactivity and geochemistry of Neoproterozoic dokhan volcanics: a case study of wadi gebeiy, Southwestern sinai, Egypt. Sustainability 14, 9291–14. doi:10.3390/SU14159291
Kabata-Pendias, A., and Mukherjee, A. B. (2007). Trace elements from soil to human. Berlin, Heidelberg: Springer Berlin Heidelberg.
Khaleal, F. M., El-Bialy, M. Z., Saleh, G. M., Abdelaal, A., Kamar, M. S., Omar, M. M., et al. (2023a). Environmental risk assessment of naturally radioactive beryl-bearing rocks, sinai and eastern desert, Egypt. J. Radioanal. Nucl. Chem. 332, 3991–4008. doi:10.1007/s10967-023-09092-z
Khaleal, F. M., El-Bialy, M. Z., Saleh, G. M., Lasheen, E. R., Kamar, M. S., Omar, M. M., et al. (2023b). Assessing environmental and radiological impacts and lithological mapping of beryl-bearing rocks in Egypt using high-resolution sentinel-2 remote sensing images. Sci. Rep. 13 (1 13), 11497–20. doi:10.1038/s41598-023-38298-0
Khaleal, F. M., Tahoon, M. A., Saleh, G. M., Kamar, M. S., Zakaly, H. M. H., Zidan, I. H., et al. (2023c). Dolphin-shaped island: exploring the natural resources and radiological hazards of wadi El gemal island. Mar. Pollut. Bull. 194, 115367. doi:10.1016/j.marpolbul.2023.115367
Kumar, N., Khyalia, B., Yadav, J., Singh, B., Gupta, V., Singh, P. P., et al. (2024). Assessment of natural radioactivity in soil around khetri copper belt of Rajasthan, India. J. Radioanalytical Nucl. Chem. 333, 3185–3194. doi:10.1007/s10967-023-09301-9
Lasheen, E. R., Azer, M. K., Ene, A., Abdelwahab, W., Zakaly, H. M. H., Awad, H. A., et al. (2022a). Radiological hazards and natural radionuclide distribution in granitic rocks of homrit waggat area, central eastern desert, Egypt. Materials 15, 4069–15. doi:10.3390/MA15124069
Lasheen, E. R., Zakaly, H. M. H., Alotaibi, B. M., Saadawi, D. A., Ene, A., Fathy, D., et al. (2022b). Radiological risk parameters of the phosphorite deposits, gebel qulu El sabaya: natural radioactivity and geochemical characteristics. Minerals 12, 1385–12. doi:10.3390/MIN12111385
Lasheen, E. R., Mohamed, W. H., Ene, A., Awad, H. A., and Azer, M. K. (2022c). Implementation of petrographical and aeromagnetic data to determine depth and structural trend of homrit waggat area, central eastern desert, Egypt. Appl. Sci. 12, 8782–12. doi:10.3390/APP12178782
Lasheen, E. S. R., Awad, H. A., Ene, A., Alarifi, S. S., Rashwan, M. A., Kawady, N. A., et al. (2023). Mineralogical constituents and radioactivity analysis of commercial granitic ornamental stones: assessing suitability and radiation safety. J. Radiat. Res. Appl. Sci. 16, 100618. doi:10.1016/J.JRRAS.2023.100618
Lasheen, E. R., Mansour, A. M., Mohamed, A. W., Osman, M. R., Khaleal, F. M., Tahoon, M. A., et al. (2024a). Assessing the heavy metals in surface sediments of wadi El-Gemal Island, Red Sea, Egypt: pollution levels, sources, and associated risks. Water Air Soil Pollut. 235, 461–22. doi:10.1007/s11270-024-07273-4
Lasheen, E. R., Elyaseer, M. H., Mohamed, W. H., Azer, M. K., Rashwan, M. A., and Thabet, I. A. (2024b). Economic feasibility of Gabal Um Takha leucogranitic intrusion, South Sinai, Egypt: integrated remote sensing, geochemical, aeromagnetic, and geotechnical approach. Phys. Chem. Earth 133, 103531. doi:10.1016/j.pce.2023.103531
Liang, B., Qian, X., Peng, S., Liu, X., Bai, L., Cui, B., et al. (2018). Speciation variation and comprehensive risk assessment of metal(loid)s in surface sediments of intertidal zones. Int. J. Environ. Res. Public Health 15, 2125. doi:10.3390/ijerph15102125
Long, E. R., and MacDonald, D. D. (1998). Human and ecological risk assessment: recommended uses of Empirically derived, sediment quality guidelines for marine and estuarine ecosystems PERSPECTIVE: recommended uses of empirically derived, sediment quality guidelines for marine and. Hum. Ecol. Risk Assess. 4, 1019–1039. doi:10.1080/10807039891284956
Long, E. R., Macdonald, D. D., Smith, S. L., and Calder, F. D. (1995). Incidence of adverse biological effects within ranges of chemical concentrations in marine and estuarine sediments. Environ. Manage 19, 81–97. doi:10.1007/BF02472006
Long, E. R., MacDonald, D. D., Severn, C. G., and Hong, C. B. (2000). Classifying probabilities of acute toxicity in marine sediments with empirically derived sediment quality guidelines. Environ. Toxicol. Chem. 19, 2598–2601. doi:10.1002/etc.5620191028
Lueder, M., Tamblyn, R., Rubatto, D., and Hermann, J. (2024). H2O-rich rutile as an indicator for modern-style cold subduction. Contributions Mineralogy Petrology 179, 26–24. doi:10.1007/s00410-024-02107-2
Macdonald, D. D., Carr, R. S., Calder, F. D., Long, E. R., and Ingersoll, C. G. (1996). Development and evaluation of sediment quality guidelines for Florida coastal waters. Ecotoxicology 5, 253–278. doi:10.1007/BF00118995
MacDonald, D. D., Ingersoll, C. G., and Berger, T. A. (2000). Development and evaluation of consensus-based sediment quality guidelines for freshwater ecosystems. Arch. Environ. Contam. Toxicol. 39, 20–31. doi:10.1007/s002440010075
Mahmoud, M. A. M., Kamar, M. S., and Hussein, K. H. (2015). Mineralogy and geochemistry of stream sediments of southeast wadi ghadir, south eastern desert, Egypt. Al-Azhar Bull. Sci. 26, 33–50. doi:10.21608/absb.2015.22615
Malain, D., Regan, P. H., Bradley, D. A., Matthews, M., Santawamaitre, T., and Al-Sulaiti, H. A. (2010). Measurements of NORM in beach sand samples along the andaman coast of Thailand after the 2004 tsunami. Nucl. Instrum. Methods Phys. Res. A 619, 441–445. doi:10.1016/J.NIMA.2009.11.047
Margineanu, R. M., Duliu, O. G., Blebea-Apostu, A. M., Gomoiu, C., and Bercea, S. (2013). Environmental dose rate distribution along the Romanian black Sea Shore. J. Radioanal. Nucl. Chem. 298, 1191–1196. doi:10.1007/s10967-013-2545-4
Miletić, A., Lučić, M., and Onjia, A. (2023). Exposure factors in health risk assessment of heavy metal(loid)s in soil and sediment. Met. (Basel) 13, 1266. doi:10.3390/met13071266
Mohammadi, A. A., Zarei, A., Majidi, S., Ghaderpoury, A., Hashempour, Y., Saghi, M. H., et al. (2019). Carcinogenic and non-carcinogenic health risk assessment of heavy metals in drinking water of khorramabad, Iran. MethodsX 6, 1642–1651. doi:10.1016/j.mex.2019.07.017
Mohammed, A. H., Khalifa, A. M., Mohamed, H. M., Abd El-Wahid, K. H., and Hanafy, M. H. (2024). Assessment of heavy metals at mangrove ecosystem, applying multiple approaches using in-situ and remote sensing techniques, Red Sea, Egypt. Environ. Sci. Pollut. Res. 31, 8118–8133. doi:10.1007/s11356-023-31625-y
Mueller, G. (1981). Die Schwermetallbelastung der sedimente des Neckars und seiner Nebenflusse: eine Bestandsaufnahme. Chem. ZTG 105, 157–164.
Nour, H. E., Alshehri, F., Sahour, H., El-Sorogy, A. S., and Tawfik, M. (2022). Assessment of heavy metal contamination and health risk in the coastal sediments of Suez Bay, gulf of Suez, Egypt. J. Afr. Earth Sci. 195, 104663. doi:10.1016/j.jafrearsci.2022.104663
Oregioni, B., and Astone, S. (1984). The determination of selected trace metals in marine sediments by flameless/flame-atomic absorption spectrophotometry. Monaco Laboratory: IAEA.
Özden, S., Pehlivanoğlu, S. A., and Günay, O. (2023). Evaluation of natural radioactivity in soils of Konya (Turkey) and estimation of radiological health hazards. Environ. Monit. Assess. 195, 1–13. doi:10.1007/S10661-023-12162-0/METRICS
O’brien, R., and Sanna, R. (1976). The distribution of absorbed dose-rates in humans from exposure to environmental gamma rays. Health Phys. 30, 71–78. doi:10.1097/00004032-197601000-00007
RAIS (2017). Risk assessment information system in the risk Exposure models for chemicals User’s guide. Available online at: https://rais.ornl.gov/tools/rais_chemical_risk_guide.html.
Ramola, R. C., Choubey, V. M., Prasad, G., Gusain, G. S., Tosheva, Z., and Kies, A. (2011). Radionuclide analysis in the soil of kumaun himalaya, India, using gamma ray spectrometry. Curr. Sci. 100.
Rashwan, M. A., Lasheen, E. R., and Azer, M. K. (2023). Thermal and physico-mechanical evaluation of some magmatic rocks at homrit waggat area, eastern desert, Egypt: petrography and geochemistry. Bull. Eng. Geol. Environ. 82, 199–22. doi:10.1007/s10064-023-03208-1
Ravisankar, R., Chandramohan, J., Chandrasekaran, A., Prince Prakash Jebakumar, J., Vijayalakshmi, I., Vijayagopal, P., et al. (2015). Assessments of radioactivity concentration of natural radionuclides and radiological hazard indices in sediment samples from the east coast of Tamilnadu, India with statistical approach. Mar. Pollut. Bull. 97, 419–430. doi:10.1016/J.MARPOLBUL.2015.05.058
Reeve, S. M., Jameson, S. C., Abdel-Fattah, R. S., Riegl, B., Hassan, R., and Newman, A. P. (1998). “Best practices for tourism center development along the Red Sea Coast,”Tour. Dev. Auth.
Reimann, C., Filzmoser, P., Garrett, R. G., and Dutter, R. (2008). Statistical data analysis explained: applied environmental statistics with R. Statistical data analysis explained. Appl. Environ. Statistics R, 1–343. doi:10.1002/9780470987605
Ruslan, H. N., Muthusamy, K., Muzafar Shah, M. H., Mat Yahaya, F., and Zulkarnain, F. (2024). Properties of concrete containing spent garnet as fine aggregate replacement. IOP Conf. Ser. Earth Environ. Sci. 1369, 012039. doi:10.1088/1755-1315/1369/1/012039
Saleh, G. M., Kamh, S. Z., Abdalla, F., Kilias, A., and Lasheen, E. S. R. (2024). ِA new occurrence of rift-related damtjernite (ultramafic) lamprophyre, gebel anweiyib area, Arabian Nubian shield: insights from bulk rock geochemistry and remote sensing data analysis. Phys. Chem. Earth 133, 103530. doi:10.1016/J.PCE.2023.103530
Saralioglu, E., and Vatandaslar, C. (2022). Land use/land cover classification with Landsat-8 and Landsat-9 satellite images: a comparative analysis between forest- and agriculture-dominated landscapes using different machine learning methods. Acta Geod. Geophys. 57, 695–716. doi:10.1007/s40328-022-00400-9
Shahrokhi, A., Adelikhah, M., Chalupnik, S., Kocsis, E., Toth-Bodrogi, E., and Kovács, T. (2020). Radioactivity of building materials in mahallat, Iran – an area exposed to a high level of natural background radiation – attenuation of external radiation doses. Mater. Construcción 70, e233. doi:10.3989/MC.2020.03820
Song, X., Dong, J., Wang, H., Xie, H., Yu, Y., Geng, L., et al. (2023). Factors influencing the distribution of organic carbon in four different coastal sedimentary environments. J. Soils Sediments 23, 1539–1551. doi:10.1007/s11368-022-03423-5
Stern, R. J. (2018). Neoproterozoic formation and evolution of eastern desert continental crust – the importance of the infrastructure-superstructure transition. J. Afr. Earth Sci. 146, 15–27. doi:10.1016/J.JAFREARSCI.2017.01.001
Taylor, S. R. (1964). Abundance of chemical elements in the Continental crust: a new table. Geochim. Cosmochim. Acta 28, 1273–1285. doi:10.1016/0016-7037(64)90129-2
Tomlinson, D. L., Wilson, J. G., Harris, C. R., and Jeffrey, D. W. (1980). Problems in the assessment of heavy metal levels in estuaries and the formation of a pollution index. Helgoländer Meeresunters. 33, 566–575. doi:10.1007/BF02414780
Turekian, K. K., and Wedepohl, K. H. (1961). Distribution of the elements in some major units of the earth’s crust. Geol. Soc. Am. Bull. 72, 175–192. doi:10.1130/0016-7606(1961)72[175:DOTEIS]2.0.CO;2
Tyson, R. V. (1995). Sedimentary organic matter, organic fancies and palynofacies. London: Chapman & Hall, 615.
UNSCEAR (2000). Sources and effects of ionizing radiation. New York: United Nations: Report to the general assembly, with scientific annexes.
U.S. EPA (1989). Risk assessment guidance for superfund volume 1 human health evaluation manual (part A). EPA/540/1–89/002, office of emergency and remedial response. Washington, DC: U.S. Environmental Protection Agency.
U.S. EPA (2002). “Supplemental guidance for developing soil screening levels for superfund sites,” in Office of solid waste and emergency response, OSWER 9355.4-24. Washington, DC: U.S. Environmental Protection Agency.
U.S. EPA (2005). Guidelines for carcinogen risk assessment. Risk assessment forum. Washington, DC: U.S. Environmental Protection Agency.
U.S. EPA (2007). Framework for metals risk assessment. Office of the science advisor, risk assessment forum. Washington, DC: U.S. Environmental Protection Agency.
Vaezi, A., and Lak, R. (2023). Sediment texture, geochemical variation, and ecological risk assessment of major elements and trace metals in the sediments of the northeast Persian gulf. Minerals 13, 850. doi:10.3390/min13070850
Vaezi, A. R., Karbassi, A. R., and Fakhraee, M. (2015). Assessing the trace metal pollution in the sediments of mahshahr Bay, Persian Gulf, via a novel pollution index. Environ. Monit. Assess. 187, 613–12. doi:10.1007/s10661-015-4833-7
Wan, D., Gao, J., Song, R., Song, L., and Ning, D. (2023). Uncertainties in pollution and risk assessments of heavy metals in Lake sediments using regional background soils in China. Toxics 11, 613. doi:10.3390/toxics11070613
Xu, Z., Shi, M., Yu, X., and Liu, M. (2022). Heavy metal pollution and health risk assessment of vegetable–soil systems of facilities irrigated with wastewater in Northern China. Int. J. Environ. Res. Public Health 19, 9835. doi:10.3390/ijerph19169835
Yu, K. N., Young, E. C. M., Stokes, M. J., Luo, D. L., and Zhang, C. X. (1992). Indoor radon and environmental gamma radiation in Hong Kong. Radiat. Prot. Dosim. 40, 259–263. doi:10.1093/oxfordjournals.rpd.a081212
Yüksel, B., and Fikret, U. (2025). Pollution analysis of metals in the sediments of lagoon Lakes in Türkiye: toxicological risk assessment and source insights. Process Saf. Environ. Prot. 193, 665–682. doi:10.1016/j.psep.2024.11.085
Zakaly, H. M. H., Awad, H. A., Lasheen, E. R., Issa, S. A. M., Elsaman, R., Khandaker, M. U., et al. (2024). Radiometric and petrographic characterization of El-Yatima granite: evaluating radiological risks and mineralogical features. Radiat. Phys. Chem. 224, 111992. doi:10.1016/J.RADPHYSCHEM.2024.111992
Zhang, Z., Juying, L., Mamat, Z., and QingFu, Y. (2016). Sources identification and pollution evaluation of heavy metals in the surface sediments of bortala river, northwest China. Ecotoxicol. Environ. Saf. 126, 94–101. doi:10.1016/j.ecoenv.2015.12.025
Keywords: metal pollution, spatial pattern, pollution risk assessment indices, radioactivity, sediment, red sea coastline
Citation: Abdelaal A, El-Badry BA, Saleh GM, Sami M, Khouqeer GA, Sanislav IV and Lasheen ESR (2025) Heavy metal contamination and assessment of radioactivity in coastal sediments: a case study from the El Qulaan area, southern Red Sea, Egypt. Front. Environ. Sci. 13:1676645. doi: 10.3389/fenvs.2025.1676645
Received: 30 July 2025; Accepted: 29 September 2025;
Published: 15 October 2025.
Edited by:
Qi Liao, Central South University, ChinaCopyright © 2025 Abdelaal, El-Badry, Saleh, Sami, Khouqeer, Sanislav and Lasheen. This is an open-access article distributed under the terms of the Creative Commons Attribution License (CC BY). The use, distribution or reproduction in other forums is permitted, provided the original author(s) and the copyright owner(s) are credited and that the original publication in this journal is cited, in accordance with accepted academic practice. No use, distribution or reproduction is permitted which does not comply with these terms.
*Correspondence: Mabrouk Sami, bWFicm91a3NhbWlAdWFldS5hYy5hZQ==; El Saeed R. Lasheen, ZWxzYWVlZGxhc2hlZW5AYXpoYXIuZWR1LmVn