 Wenwen Lv*
 Jun Li*
- Logistics Department of Wuhan Fourth Hospital, Wuhan Fourth Hospital, Wuhan, China
Introduction: Subsidy policies and carbon tax policies are effective means of encouraging the development of low-carbon residential buildings. However, how to utilize these two policy tools of carbon tax and subsidies to more efficiently incentivize the development of low-carbon residential buildings remains a topic worthy of further exploration. This paper explores the mechanisms by which carbon tax and subsidies incentivize the implementation of low-carbon residential buildings and clarifies the boundary conditions for the effectiveness of these two policy tools.
Methods: We built a stochastic evolutionary game that couples three agent groups—government, real-estate developers, and homebuyers—and explicitly incorporates policy shocks (carbon tax vs. subsidy) and environmental noise. A series of Monte-Carlo simulations was run to trace the share of low-carbon developers and buyers over time; critical thresholds and noise boundaries separating qualitatively different regimes were identified with bifurcation analysis.
Results and discussion: The evolutionary process of low-carbon housing development, whether under a carbon tax policy or a low-carbon subsidy policy, includes three stages: (1) the initial stage, where relying solely on government subsidies or carbon taxes is insufficient to effectively implement low-carbon housing under various noise intensities; (2) the development stage, where as the proportions of real estate developers adopting low-carbon strategies and homebuyers purchasing low-carbon housing increase, a chaotic relationship emerges between the implementation of carbon taxes, subsidies, and low-carbon housing under certain noise intensities; and (3) the stable stage, where low-carbon housing can be successfully implemented and a qualitative leap is achieved when a certain threshold proportion of real estate developers and homebuyers adopt low-carbon strategies.
1 Introduction
The carbon emissions from China’s construction industry are the largest single source of national carbon emissions. In 2023, electricity consumption in building construction alone consumed 9.0 × 10⁸ tons of standard coal equivalents. However, the promotion of low-carbon housing can effectively reduce carbon emissions from the construction sector Yao and Shao (2025). “Low-carbon housing” refer to residential buildings that minimize greenhouse gas emissions throughout their entire life cycle while maintaining or even exceeding the standard level of indoor comfort (Yao et al., 2023a). Subsidy policies and carbon tax policies are effective means of encouraging the development of low-carbon residential buildings (Liu Y. et al., 2024; Wang et al., 2025; Yu, 2020). However, how to utilize these two policy tools of carbon tax and subsidies to more efficiently incentivize the development of low-carbon residential buildings remains a topic worthy of further exploration. This paper explores the mechanisms by which carbon tax and subsidies incentivize the implementation of low-carbon residential buildings and clarifies the boundary conditions for the effectiveness of these two policy tools.
1.1 Advantages of carbon tax and subsidies
1.1.1 The scope of application for carbon taxes and subsidies is broader
Carbon tax, subsidies, and carbon trading are three common low-carbon incentive policies (Yang et al., 2024). However, compared with carbon emissions trading, the scope of application for carbon taxes and subsidies is broader (Hu and Tian, 2024; Ouyang et al., 2024). Given the complex trading mechanisms and high implementation costs, carbon trading has been primarily implemented in large-scale enterprises within specific industries. For instance, the power industry is currently the only sector included in the national carbon trading market. This selective inclusion is justified by two main factors: firstly, the carbon emission data from the power industry are more transparent and credible compared to other sectors; secondly, the power industry contributes significantly to the nation’s overall carbon emissions. In contrast, subsidies offer a more flexible and inclusive approach, as they can be widely applied across various industries, particularly benefiting enterprises with low carbon emissions and even individual citizens.
For residential products, significant carbon emissions arise during both the construction and use phases. These emissions are generated by construction firms and individual residents, respectively. Although real estate developers are key stakeholders in the residential sector, they do not directly emit carbon and thus cannot engage in carbon market transactions. While natural persons can theoretically participate in carbon market transactions, carbon emission exchanges have established stringent criteria for their involvement. Undoubtedly, these stringent criteria effectively preclude the majority of residents from participating in the carbon trading market, thereby undermining the fairness of the carbon trading mechanism. In contrast, carbon taxes and subsidies offer greater flexibility and can more effectively embody the principle of fairness.
1.1.2 The implementation costs of carbon taxes and subsidies are lower
Compared with carbon taxes and subsidies, the process of carbon trading is more complex (Luo et al., 2024; Xian et al., 2024; Yao and Shao, 2022). Carbon trading encompasses a variety of legal relationships across different stages, including total amount setting, quota allocation, and carbon emissions trading, and involves multiple entities such as governments, carbon trading platform institutions, emitters, carbon fixers, financial institutions, and approval institutions. The effective implementation of carbon trading relies on accurate carbon emissions data, stringent government regulation, efficient trading platforms, and extensive oversight from all sectors of society. In contrast, carbon taxes and subsidies are characterized by their directness and simplicity. Low-carbon subsidies represent direct financial support provided by the government to low-carbon projects or technologies, eliminating the need for complex market mechanisms or regulatory frameworks, and are relatively easy to implement and manage. Moreover, unlike carbon trading, carbon taxes and subsidies do not require detailed carbon emissions data and incur lower management costs.
1.2 Corporate decision-making under carbon tax and subsidy constraints
Existing research indicates that carbon taxes influence corporate low-carbon strategies through price signals, yet the magnitude of this effect hinges on factors such as the tax rate level, policy credibility, and the method of revenue recycling (Wu et al., 2024). A stable and gradually increasing carbon tax can prompt energy-intensive firms to accelerate the phase-out of carbon-intensive assets. Conversely, fluctuations or instability in the tax rate can undermine firms’ willingness to adopt low-carbon strategies (Xu and Liu, 2024). Moreover, firm heterogeneity—specifically size, financing structure, and absorptive capacity—further amplifies differences in responses: Companies with superior Environmental, Social, and Governance (ESG) performance are more sensitive in their emission reduction and Research and Development (R&D) responses to carbon taxes. Studies suggest that recycling tax revenues to firms in the form of reduced social security contributions can effectively alleviate competitiveness concerns and reinforce long-term emission reduction incentives, whereas one-off transfers to households may generate substitution effects. Overall, when implemented in conjunction with complementary policies such as R&D subsidies and green finance, carbon taxes can more effectively drive corporate decarbonization.
To spur innovation in certain fields, subsidies have been widely applied in areas such as agriculture, new energy vehicles, clean energy generation, high-tech, pharmaceuticals, and transportation. Depending on the target of the subsidy, the methods can include subsidies to manufacturers, retailers, or consumers (Lin and Zhang, 2024; Lyu et al., 2024; Yao et al., 2023b). The vast majority of scholars concur that government subsidies exert substantial incentive effects and effectively bolster firms’ innovation capabilities. Low-carbon subsidies, which are typically disbursed in the form of rewards, are utilized to spur the development of low-carbon industries. Empirical studies have examined the impact of subsidy policies on low-carbon development and have revealed that low-carbon subsidies not only foster the growth of low-carbon industries and clean energy but also significantly enhance the sales of low-carbon products. any researchers (Liu D. et al., 2024; Yu et al., 2024; Zhang and Yu, 2024), using game theory, have constructed models of emission reduction strategies for firms and consumers and explored the optimal subsidy strategies for low-carbon subsidies, providing valuable references for governments to formulate effective subsidy policies.
1.3 Optimization of carbon tax and subsidy policies
On the one hand, the government can reduce the economic costs incurred by enterprises in the process of low-carbon transition through subsidies, thereby improving the ecological environment (Lyu et al., 2024). On the other hand, subsidies mean that the government has to bear a higher fiscal burden, and the possibility of corporate subsidy fraud may also lead to the failure of the subsidy policy (Long et al., 2024). Although carbon taxes can motivate low-carbon behavior of enterprises, excessive taxes will increase the burden on enterprises, thereby curbing low-carbon innovation.
Low-carbon subsidies are a form of government-led, non-repayable financial payments to the recipients. The emphasis on optimizing subsidies is closely related to their mechanism of action: subsidies have both substitution and income effects, which increase the nominal income of the subsidized entities and affect the relative price system of enterprise products and input-output behavior. Existing research shows that different subsidy measures, targets, and intensities will affect the actual effect of subsidies (Cheng et al., 2024; Li et al., 2024). Therefore, although different subsidy measures have the common mechanism of incentive effect, they still show complex effects.
Overall, carbon taxes show regional differences in motivating corporate green behavior (Chai et al., 2025; Xia et al., 2024). In regions with high carbon intensity, carbon taxes exert a substantial inhibitory effect on carbon emissions. However, in areas with medium and low carbon intensity, such an inhibitory effect has yet to materialize. The academic community has reached a consensus on this perspective: although the imposition of carbon taxes facilitates industrial structure transformation, it exerts a significant negative impact on economic growth, resident consumption, and corporate income. As a result, carbon taxes fail to achieve the dual dividend effect of carbon reduction and economic growth in the short term. A carbon tax rate that is too low will be insufficient to meet carbon reduction targets, while an excessively high rate can have a pronounced adverse impact on the economy and lead to a decline in policy effectiveness. Therefore, exploring the appropriate tax rate and method of taxation is crucial for motivating corporate green behavior.
1.4 The contributions of this paper
Existing research has achieved relatively rich results in the impact mechanisms of carbon taxes and subsidies. However, these studies still have some shortcomings. In terms of research methods, even though many papers have conducted detailed analyses using evolutionary game models, they have failed to take into account the persistent stochastic disturbances existing in real life. That is to say, there are also stochastic disturbances in the process of strategy adjustment for both sides of the game. At this time, using only the general evolutionary game model will hardly reflect the real world. In addition, the incentive mechanisms of carbon taxes and subsidies for low-carbon residential buildings have not yet been clarified, especially the boundary conditions for the effectiveness of carbon taxes and subsidies are still unclear. This also to a great extent restricts the full play of the efficiency of environmental policies.
In response to the limitations of existing research, this thesis makes the following contributions:
A stochastic evolutionary game model that considers the impact of noise factors has been established by introducing Gaussian white noise. This improvement overcomes the shortcoming of existing models that fail to account for the uncertainty of a noisy environment, making the model more realistic and enhancing the reliability of the research findings.
The thesis elucidates the boundary conditions for the effectiveness of carbon taxes and subsidies in promoting low-carbon residential buildings. This achievement provides a foundation for improving the incentive efficiency of carbon taxes and subsidies, aiding in the optimization of environmental policy design and enhancing the effectiveness of these policy instruments.
2 Evolutionary game model of government subsidies
It is evident that environmental noise, housing buyers, real estate developers, and government subsidies all exert significant influence on the adoption of low-carbon housing. Consequently, this paper constructs evolutionary game models under both deterministic and uncertain conditions to investigate the impact of government subsidies on the adoption of low-carbon housing within these distinct contexts.
2.1 Assumptions
Assumption 1. It is assumed that the selling price of low-carbon houses is
Assumption 2. For real estate developers, the cost per unit to construct conventional housing is
Assumption 3. There are two distinct groups of consumers on the market; one prefers to purchase conventional houses, and the other prefers low-carbon houses. Low-carbon housing has a utility value of
In this study, we categorize consumers in the market into two distinct groups: those who prefer to purchase traditional houses and those who prefer to purchase low-carbon houses. This binary classification is based on extensive empirical research and theoretical support.
Firstly, empirical studies have shown that consumer preferences for houses can be effectively divided into two major categories based on their environmental consciousness. For instance, the research by Vazquez and Hallack (2024) has found that consumers can be divided into a group that prioritizes environmental sustainability and a group that prioritizes traditional house attributes. This market segmentation is supported across various industries, including the housing sector, indicating that there are indeed significant preference differences among consumers when choosing houses.
Secondly, this classification reflects the different values and preferences for environmental sustainability among different consumer groups. Consumers who prefer low-carbon houses typically place greater emphasis on environmental benefits, energy efficiency, and long-term cost savings, while those who prefer traditional houses may prioritize other factors such as initial costs, location, and design (Du et al., 2023; Wang et al., 2023).
Moreover, research in behavioral economics has shown that consumers often rely on heuristic methods and bounded rationality in the decision-making process (Li et al., 2023; Zhang et al., 2023). This binary classification simplifies the decision-making process by focusing on the two main motives driving house selection—environmental sustainability and traditional preferences. This simplification not only makes the analysis more feasible but also captures the main differences in consumer behavior, thereby providing more targeted policy recommendations.
Assumption 4. The government’s low-carbon subsidies to property developers do not exceed the additional cost of low-carbon housing, and the subsidies to house buyers do not exceed the premium for low-carbon housing.
Assumption 5. The market demand for low-carbon housing depends on consumer surplus.
2.1.1 Government subsidies
The total subsidy provided by the government to real estate developers is given in Equation 1.
Where
Price subsidies and other types of subsidies are the two ways the government supports customers. Equation 2 gives the subsidy formula.
Where
2.1.2 Carbon tax
The government sets guidelines for low-carbon housing. Low-carbon housing is that which complies with the guidelines and ordinary housing is that which does not. The carbon tax rate is
2.1.3 Consumer surplus
The purchase strategy of house buyers has a certain degree of randomness, and it is not easy to gauge the true utility worth of housing purchases. This paper discusses consumer excess. The consumer surplus function introduced in this paper are shown as Equations 3, 4.
Whereas
2.2 Model construction and analysis under subsidy scenarios
A game payment matrix is created, as shown in Table 1, assuming that the government offers low-carbon subsidies to both homebuyers and real estate developers.
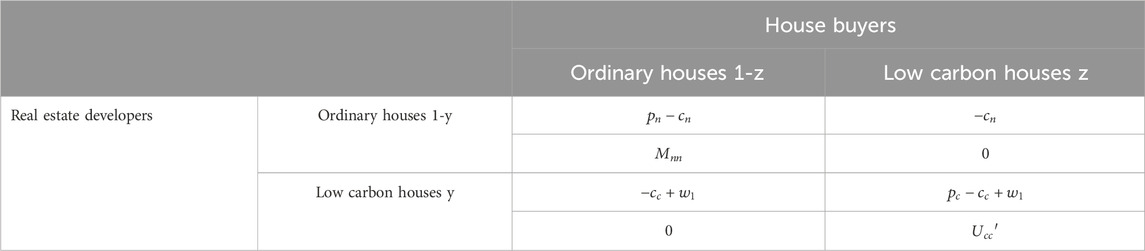
Table 1. Game Payment Matrix (Low carbon subsidies).
If at time
The profits made by real estate developers from building low-carbon housing is
The profits of house buyers purchasing low-carbon housing is
A continuous evolution process termed an evolutionary game is one in which organizations gain knowledge from one another. Changes are made to the replication dynamic equations of real estate developers and house buyers because
In reality, the strategies employed by homebuyers and real estate developers are fraught with uncertainty. On the one hand, the dynamic evolution of the complex system involving homebuyers and real estate developers remains to be fully understood. Both homebuyers and real estate developers utilize a variety of strategies, which are significantly influenced by uncertain factors such as risk, policy, and expected income. On the other hand, factors like income levels, environmental awareness, and societal perceptions of low-carbon housing substantially impact the behavior of homebuyers. Moreover, moral hazards and psychological shifts may affect the decision-making of both real estate developers and homebuyers due to their shared speculative psychology. Consequently, uncertainty also characterizes the evolutionary process of the behavior of real estate developers and homebuyers.
To address the inherent uncertainty in the decision-making processes of real estate developers and homebuyers, we introduced a stochastic element into the evolutionary game model. This stochastic element is incorporated into the replicator dynamics equations for real estate developers and homebuyers in the form of Gaussian white noise. The specific form of the stochastic element is described as follows:
Noise Type: We employ Gaussian white noise to simulate stochastic disturbances. Gaussian white noise is a widely accepted method for simulating random fluctuations in dynamic systems, characterized by a mean of zero and a constant power spectral density.
Distribution Assumption: It is assumed that the Gaussian white noise follows a normal distribution with a mean of zero. This assumption is based on the central limit theorem, which states that the sum of a large number of independent random variables will tend toward a normal distribution, regardless of the distribution of the individual variables.
Intensity Setting: The intensity of the noise is denoted by σ, which reflects the magnitude of the stochastic disturbances.
The modified replicator dynamics equations incorporating Gaussian white noise are presented in Equations 9, 10.
The standard one-dimensional Brownian motion, an irregular motion representing how the game subject changes in response to outside interference, is followed by
Lemma: For stochastic differential equations:
If
1. If the constant
2. If the constant
The following inferences can be made based on the aforementioned lemmas, and the evolutionary stability of real estate developer’ and house buyers’ strategies can be assessed.
Proposition 1. For Equation 3, if
Proof 1:
Since
When the zero instant of solution of Equation 9 is exponentially unstable, there is
This suggests that when the percentage of house buyers choosing low-carbon housing meets
Therefore, actively promoting low-carbon consciousness among house buyers during the early phases of low-carbon subsidies plays a positive guiding role in developing low-carbon housing strategies for real estate developers.
Proposition 2. For Equation 3, if
The proof process for Proposition 2 is similar to Proposition 1.
This suggests that when the proportion of low-carbon residential buildings reaches
In conclusion, three circumstances can be used to categorize the development of low-carbon behavior among property developers and house buyers:
1. When the proportion of real estate developers and homebuyers who use low-carbon strategies equals
2. Homebuyers and real estate developers will adopt low-carbon strategies as a result of the incentive provided by real estate subsidies when
3. The system’s direction of evolution is ambiguous when
Figure 1 displays the regional distribution of the three circumstances.
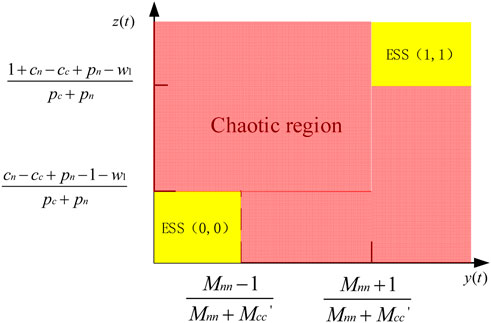
Figure 1. The regional distribution of the three circumstances (Carbon subsidies).
2.3 Model construction and analysis under the carbon tax scenario
Table 2 displays the game payment matrix for the carbon tax situation.
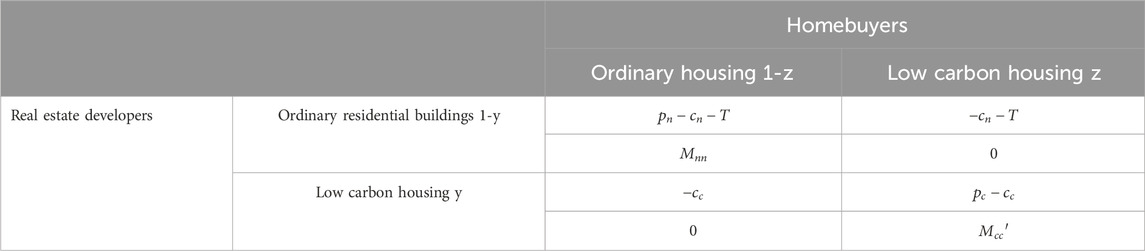
Table 2. Game payment matrix (carbon tax).
The profits made by real estate developers from building low-carbon housing is
The profits of house buyers purchasing low-carbon housing is
The modified replication dynamic equation is given in Equation 12:
Proposition 3. For Equation 3, if
The proof process for Proposition 3 is similar to Proposition 1.
The evolution of low-carbon behavior among real estate developers and homebuyers under carbon taxes can also be split into three categories, similar to low-carbon subsidies:
1. When the proportion of real estate developers and homebuyers who use low-carbon strategies equals
2. Homebuyers and real estate developers will adopt low-carbon strategies as a result of the incentive provided by real estate subsidies when
3. The system’s direction of evolution is ambiguous when
Figure 2 displays the regional distribution of the three circumstances under the carbon tax.
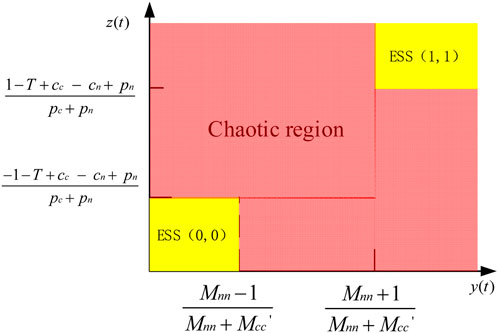
Figure 2. The regional distribution of the three circumstances (Carbon tax).
3 Simulation
The average selling price of business real estate in China in 2022 was 9,860 yuan/m2, and the profit for ordinary housing was 986 yuan/m2. Low-carbon housing may generate lesser earnings than conventional housing due to the rising costs and high selling price of such housing. Considering that the earnings of low-carbon housing are 5% less than that of ordinary housing, this comes to 936 yuan/m2.
Although carbon tax policies have been implemented in 29 countries and regions worldwide, China has not yet implemented a carbon tax. European countries with higher tax rates, such as Sweden’s carbon tax of $127/tCO2e. On the other hand, carbon taxes in developing countries are generally low, ranging from $4/tCO2e to $8/tCO2e. Based on the carbon tax rates of developing countries, China’s initial carbon tax rate was set at 40 yuan ($6.3). Because the carbon emissions of residential buildings in northern China are 2.25tCO2/m2 over their entire life cycle, the carbon tax can be set at 110 yuan/m2 (Yao et al., 2023a). Therefore, the relevant parameters are set to:
3.1 Evolutionary game simulation under subsidies
The following are the three evolutionary scenarios for implementing low-carbon subsidies on low-carbon housing:
Scenario 1:
Scenario 2:
Scenario 3:
MATLAB was used to simulate the implementation effect of low-carbon housing to validate the three evolutionary scenarios of implementing low-carbon subsidies on low-carbon housing in noisy environments. Two noise environments have been set:
3.1.1 Scenario 1
In this case, the replicated state equation’s initial solutions are as follows:
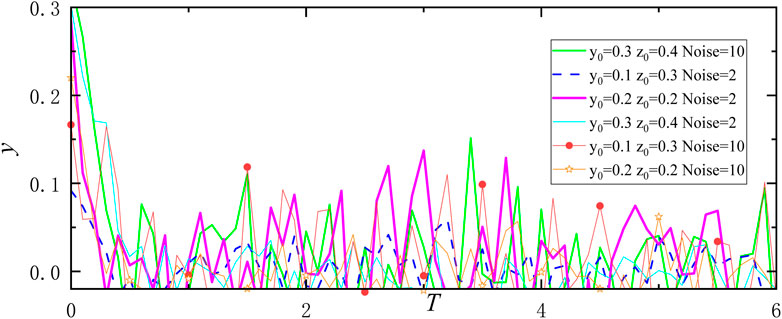
Figure 3. Evolution trend of real estate developers’ strategies in the context of low-carbon subsidies (Scenario 1).
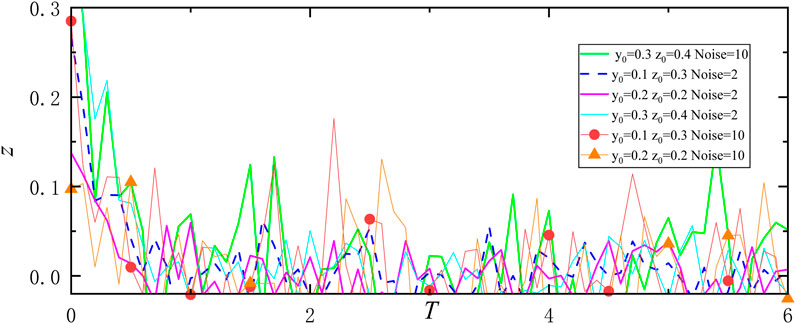
Figure 4. Evolution trend of homebuyers’ strategies in the context of low-carbon subsidies (Scenario 1).
Through the above simulation, it can be concluded that under the condition of
3.1.2 Scenario 2
In this case, the replicated state equation’s initial solutions are as follows:
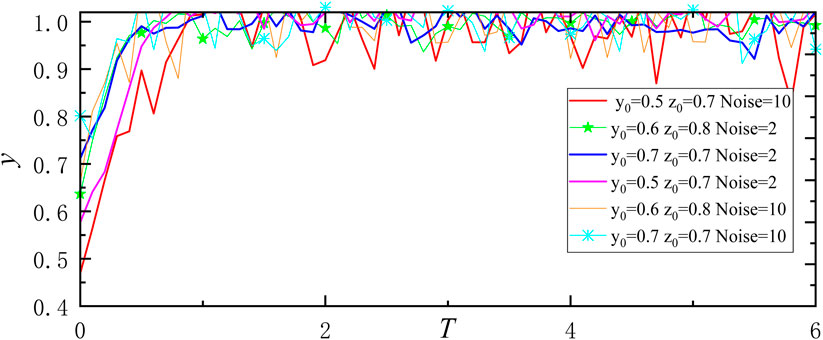
Figure 5. Evolution trend of real estate developers’ strategies in the context of low-carbon subsidies (Scenario 2).
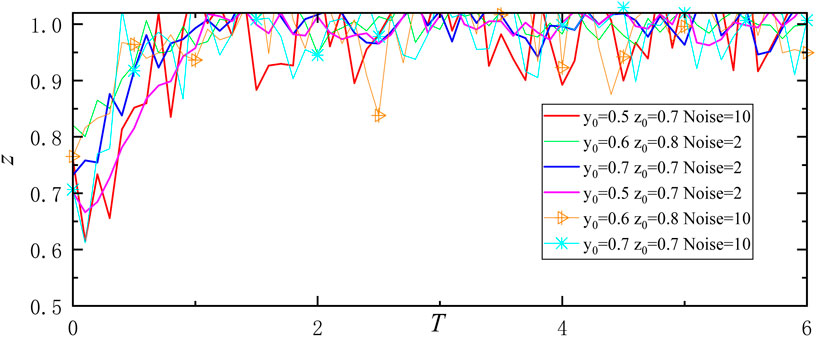
Figure 6. Evolution trend of homebuyers’ strategies in the context of low-carbon subsidies (Scenario 2).
Through the above simulation, it can be concluded that under the condition of
3.1.3 Scenario 3
In this case, the replicated state equation’s initial solutions are as follows:
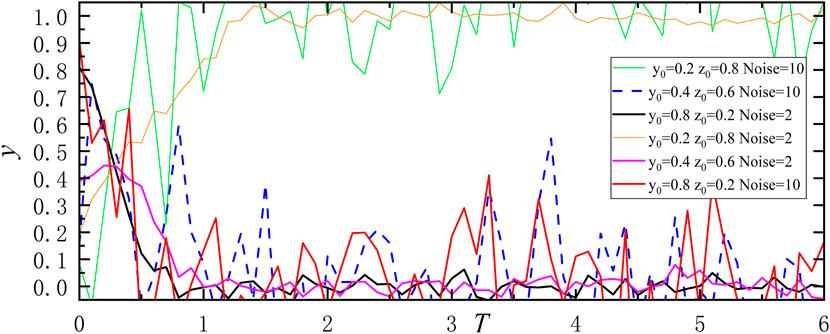
Figure 7. Evolution trend of real estate developers’ strategies in the context of low-carbon subsidies (Scenario 3).
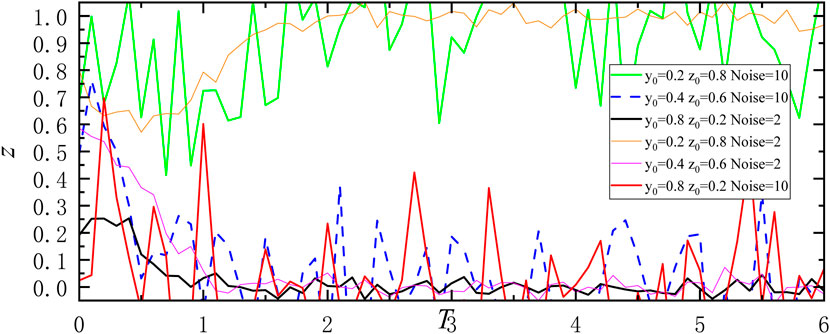
Figure 8. Evolution trend of homebuyers’ strategies in the context of low-carbon subsidies (Scenario 3).
The above simulation leads to the conclusion that when
The three low-carbon subsidy scenarios for the development and evolution of low-carbon housing have been proven.
3.2 Evolutionary game simulation under carbon taxes
The following are the three evolutionary scenarios for implementing carbon taxes on low-carbon housing:
Scenario 1:
Scenario 2:
Scenario 3:
3.2.1 Scenario 1
In this case, the replicated state equation’s initial solutions are as follows:
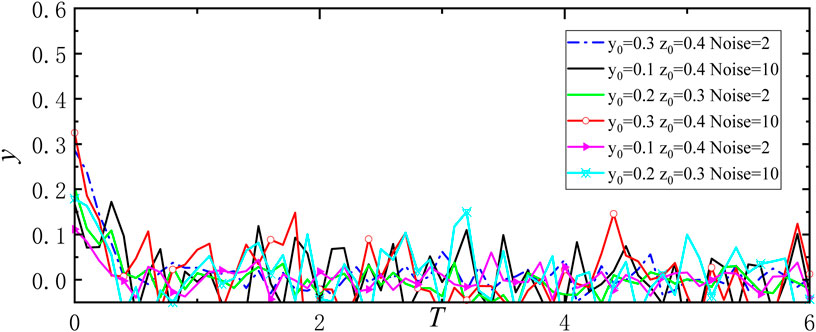
Figure 9. Evolution trend of real estate developers’ strategies in the context of carbon tax (Scenario 1).
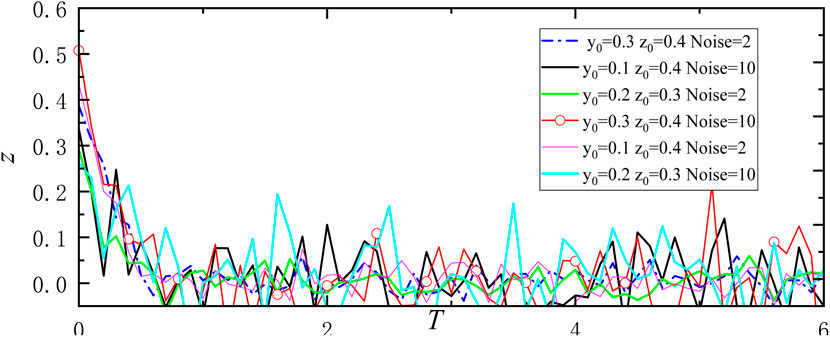
Figure 10. Evolution trend of homebuyers’ strategies in the context of carbon tax (Scenario 1).
Through the above simulation, it can be concluded that under the condition of
3.2.2 Scenario 2
In this case, the replicated state equation’s initial solutions are as follows:
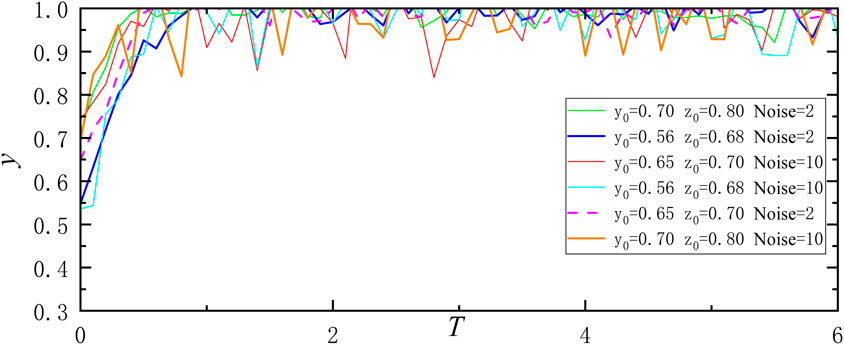
Figure 11. Evolution trend of real estate developers’ strategies under the carbon tax scenario (Scenario 2).
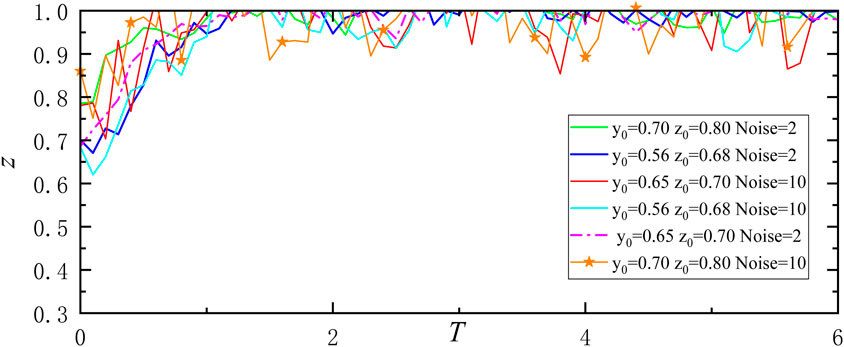
Figure 12. Evolution trend of homebuyers’ strategies under the carbon tax scenario (Scenario 2).
The above simulation shows that when
3.2.3 Scenario 3
In this case, the replicated state equation’s initial solutions are as follows:
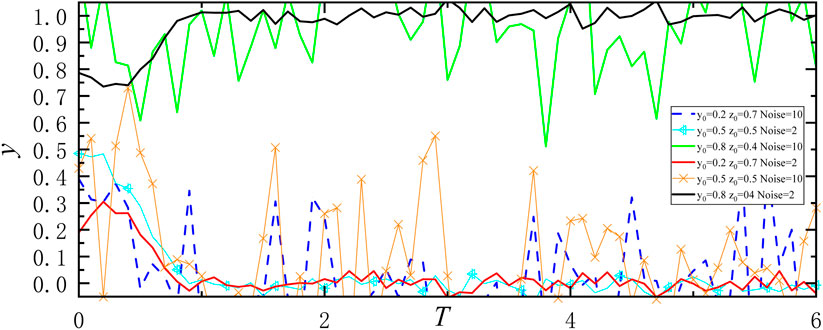
Figure 13. Evolution trend of real estate developers’ strategies under the carbon tax scenario (Scenario 3).
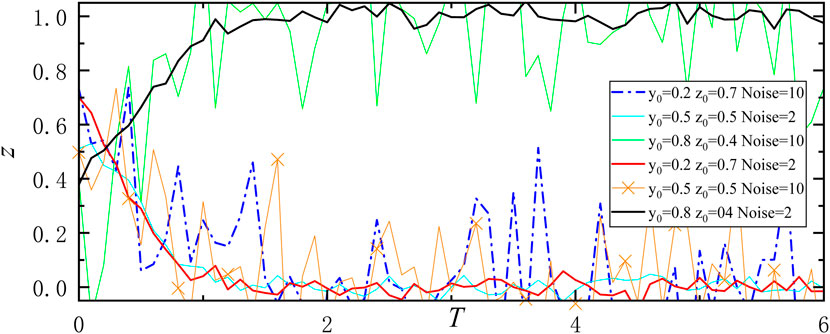
Figure 14. Evolution trend of homebuyers’ strategies under the carbon tax scenario (Scenario 3).
It is clear from the simulation above that, when
The three carbon taxes scenarios for the development and evolution of low-carbon housing have been proven.
4 Conclusion
We assessed the efficacy of carbon taxes and subsidies in fostering low-carbon housing development by juxtaposing these two environmental policies against carbon trading policies. To examine the impacts of carbon taxes and subsidies on the proliferation of low-carbon housing, stochastic evolutionary game models were constructed and analyzed. Irrespective of whether it is a carbon tax or a subsidy, the promotion of low-carbon housing can be categorized into three distinct phases: the initial stage, the development stage, and the stable stage of low-carbon housing development under the influence of either a carbon tax or a subsidy.
4.1 The initial stage
In the context of low-carbon subsidies, when real estate developers and homebuyers embrace low-carbon strategies in proportion,
4.2 The development stage
Even though homebuyers and real estate developers are more ready to adopt low-carbon strategies during the development stage, it is unclear how these groups will ultimately evolve. In the case of implementing low-carbon subsidies, when
4.3 The stable stage
The role of the carbon tax and subsidy policies in promoting the development of low-carbon housing is significant as real estate developers’ and homebuyers’ readiness to adopt low-carbon practices grows. Real estate developers and house buyers are moving towards low-carbon strategies, which is a stable stage of development. The stable stage in the situation of low-carbon subsidies occurs when
5 Limitations and future work
Although this study has thoroughly investigated the incentive mechanisms of carbon taxes and subsidies on the development of low-carbon housing, there are still some limitations. For example, the model fails to fully reveal nonlinear dynamic characteristics, such as tipping points and chaotic dynamics, which may be crucial in the actual implementation of policies. In addition, the simplification of model assumptions, such as the perfectly rational behavior of market participants, may limit the ability to explain actual market behavior. At the same time, the study has not fully considered the combined effects of carbon taxes and subsidies with other environmental policies, as well as the heterogeneity of different regions and industries.
Future research can further explore these nonlinear dynamic characteristics, integrate the theories of behavioral economics, analyze the combined effects of policy packages, and expand the scope of empirical data. These improvements will help to more comprehensively understand the impact of policies on the low-carbon housing market and provide a more scientific basis for policy-making.
Data availability statement
The original contributions presented in the study are included in the article/supplementary material, further inquiries can be directed to the corresponding authors.
Author contributions
WL: Methodology, Project administration, Supervision, Writing – original draft, Writing – review and editing, Data curation, Formal Analysis, Investigation, Visualization. JL: Conceptualization, Data curation, Formal Analysis, Software, Supervision, Validation, Visualization, Writing – original draft.
Funding
The author(s) declare that financial support was received for the research and/or publication of this article. We are grateful for the support from the Youth Talent Funding “Morning Star Program” of the Wuhan Municipal Health Commission [Wu Wei Fa (2023) No. 28].
Conflict of interest
The authors declare that the research was conducted in the absence of any commercial or financial relationships that could be construed as a potential conflict of interest.
Generative AI statement
The author(s) declare that no Generative AI was used in the creation of this manuscript.
Any alternative text (alt text) provided alongside figures in this article has been generated by Frontiers with the support of artificial intelligence and reasonable efforts have been made to ensure accuracy, including review by the authors wherever possible. If you identify any issues, please contact us.
Publisher’s note
All claims expressed in this article are solely those of the authors and do not necessarily represent those of their affiliated organizations, or those of the publisher, the editors and the reviewers. Any product that may be evaluated in this article, or claim that may be made by its manufacturer, is not guaranteed or endorsed by the publisher.
References
Chai, S., Huo, W., Li, Q., Ji, Q., and Shi, X. (2025). Effects of carbon tax on energy transition, emissions and economy amid technological progress. Appl. Energy 377, 124578. doi:10.1016/j.apenergy.2024.124578
Cheng, X., Wang, W., Chen, X., Zhang, W., and Song, M. (2024). Carbon tariffs and energy subsidies: synergy or antagonism? Energy 306, 132563. doi:10.1016/j.energy.2024.132563
Du, Q., Wang, Y., Pang, Q., Hao, T., and Zhou, Y. (2023). The dynamic analysis on low-carbon building adoption under emission trading scheme. Energy 263, 125946. doi:10.1016/j.energy.2022.125946
Hu, Y., and Tian, Y. (2024). The role of green reputation, carbon trading and government intervention in determining the green bond pricing: an externality perspective. Int. Rev. Econ. Finance 89, 46–62. doi:10.1016/j.iref.2023.10.007
Li, T., Li, W., Zhao, Y., and Ma, J. (2023). Rationality manipulation during consumer decision-making process: an analysis of Alibaba’s online shopping carnival. Electron. Commer. Res. 23 (1), 331–364. doi:10.1007/s10660-022-09567-3
Li, F., Guo, Y., and Liu, B. (2024). Impact of government subsidies and carbon inclusion mechanism on carbon emission reduction and consumption willingness in low-carbon supply chain. J. Clean. Prod. 449, 141783. doi:10.1016/j.jclepro.2024.141783
Lin, B., and Zhang, A. (2024). Impact of government subsidies on total factor productivity of energy storage enterprises under dual-carbon targets. Energy Policy 187, 114046. doi:10.1016/j.enpol.2024.114046
Liu, D., Feng, M., Liu, Y., Wang, L., Hu, J., Wang, G., et al. (2024a). A tripartite evolutionary game study of low-carbon innovation system from the perspective of dynamic subsidies and taxes. J. Environ. Manag. 356, 120651. doi:10.1016/j.jenvman.2024.120651
Liu, Y., Zhao, H., and Li, X. (2024b). Environmental policy effects of the carbon tax, subsidy, and policy combinations of China's textile industry: evidence from the DSGE model. J. Clean. Prod. 439, 140791. doi:10.1016/j.jclepro.2024.140791
Long, Y., Zhu, Z., Hong, Y., Gong, Z., Li, H., and Zhang, H. (2024). The effect of carbon taxes and subsidies on forest carbon sequestration in China. For. Policy Econ. 169, 103316. doi:10.1016/j.forpol.2024.103316
Luo, J., Zhuo, W., and Xu, B. (2024). A deep neural network-based assistive decision method for financial risk prediction in carbon trading market. J. Circuits, Syst. Comput. 33 (08), 2450153. doi:10.1142/s0218126624501536
Lyu, H., Ma, C., and Arash, F. (2024). Government innovation subsidies, green technology innovation and carbon intensity of industrial firms. J. Environ. Manag. 369, 122274. doi:10.1016/j.jenvman.2024.122274
Ouyang, T., Li, Y., Xie, S., Wang, C., and Mo, C. (2024). Low-carbon economic dispatch strategy for integrated power system based on the substitution effect of carbon tax and carbon trading. Energy 294, 130960. doi:10.1016/j.energy.2024.130960
Vazquez, M., and Hallack, M. (2024). Auctions to reveal consumers’ willingness to pay for low-carbon hydrogen projects: combining lessons from renewables and natural-gas industries. Energy 8 (4), 103–110. doi:10.1093/ce/zkae040
Wang, L., Shao, J., and Ma, Y. (2023). Does China's low-carbon city pilot policy improve energy efficiency? Energy 283, 129048. doi:10.1016/j.energy.2023.129048
Wang, D.-Y., Li, Y., and Hong, J. (2025). Tax or subsidy? The impact assessment of environmental policies on carbon allocation and emissions abatement of prefabricated construction supply chain. J. Environ. Manag. 373, 123451. doi:10.1016/j.jenvman.2024.123451
Wu, H., Yang, H., Hu, X., Zheng, L., Li, J., Li, Y., et al. (2024). Complementing carbon tax with renewable energy investment to decarbonize the energy system in China. Renew. Sustain. Energy Rev. 189, 113997. doi:10.1016/j.rser.2023.113997
Xia, X., Zeng, X., Wang, Z., Chen, J., and Cheng, Y. (2024). Carbon tax for energy-intensive enterprises: a study on carbon emission reduction strategies. Expert Syst. Appl. 257, 125011. doi:10.1016/j.eswa.2024.125011
Xian, B., Wang, Y., Xu, Y., Wang, J., and Li, X. (2024). Assessment of the co-benefits of China's carbon trading policy on carbon emissions reduction and air pollution control in multiple sectors. Econ. Analysis Policy 81, 1322–1335. doi:10.1016/j.eap.2024.01.011
Xu, Q., and Liu, K. (2024). Hero or Devil: a comparison of different carbon tax policies for China. Energy 306, 132340. doi:10.1016/j.energy.2024.132340
Yang, X., Xiong, C., Han, W., and Yang, Y. (2024). Analysis of the impacts of carbon neutral policy portfolios on the economy, environment, and residents' welfare based on computable general equilibrium models. J. Clean. Prod. 458, 142288. doi:10.1016/j.jclepro.2024.142288
Yao, Q., and Shao, L. (2022). Research on emission reduction strategies of building materials manufacturers and real estate developers in the context of carbon trading. Front. Environ. Sci. 10, 848260. doi:10.3389/fenvs.2022.848260
Yao, Q., and Shao, L. (2025). Selection of low-carbon contractors in a fuzzy multi-objective environment. Eng. Manag. J., 1–19. doi:10.1080/10429247.2025.2451906
Yao, Q., Shao, L., and Chen, Z. (2023a). Should low-carbon subsidies be given to real estate developers or homebuyers? An evolutionary game theory analysis on small-world networks. Energy Build. 301, 113709. doi:10.1016/j.enbuild.2023.113709
Yao, Q., Shao, L., Yin, Z., Wang, Z., and Chen, Z. (2023b). Strategies of property developers in the context of carbon tax. PloS One 18 (5), e0283527. doi:10.1371/journal.pone.0283527
Yu, P. (2020). Carbon tax/subsidy policy choice and its effects in the presence of interest groups. Energy Policy 147, 111886. doi:10.1016/j.enpol.2020.111886
Yu, L., Xu, H., and Zhang, Z. (2024). Tripartite evolutionary game analysis of supply chain low-carbon transformation considering the coupling of carbon tax and subsidy regulations. Manag. Decis. Econ. 45 (2), 702–725. doi:10.1002/mde.4026
Zhang, Z., and Yu, L. (2024). Differential game analysis of recycling mode and power structure in a low-carbon closed-loop supply chain considering altruism and government’s compound subsidy. Ann. Operations Res., 1–51. doi:10.1007/s10479-023-05786-5
Zhang, X., Li, Y., Dong, S., Di, C., and Ding, M. (2023). The influence of user cognition on consumption decision-making from the perspective of bounded rationality. Displays 77, 102392. doi:10.1016/j.displa.2023.102392
Keywords: low carbon subsidies, carbon tax, low carbon housing, evolutionary game, low-carbon economy
Citation: Lv W and Li J (2025) How carbon taxes and subsidies affect the implementation of low-carbon housing? An evolutionary game theory analysis. Front. Environ. Sci. 13:1679245. doi: 10.3389/fenvs.2025.1679245
Received: 04 August 2025; Accepted: 01 September 2025;
Published: 11 September 2025.
Edited by:
Delu Wang, China University of Mining and Technology, ChinaReviewed by:
Dongsheng Liao, Guangxi Minzu University, ChinaChenglong Wang, Chongqing University, China
Copyright © 2025 Lv and Li. This is an open-access article distributed under the terms of the Creative Commons Attribution License (CC BY). The use, distribution or reproduction in other forums is permitted, provided the original author(s) and the copyright owner(s) are credited and that the original publication in this journal is cited, in accordance with accepted academic practice. No use, distribution or reproduction is permitted which does not comply with these terms.
*Correspondence: Wenwen Lv, bHZ3ZW53ZW4wODRAMTYzLmNvbQ==; Jun Li, MzQ2OTk2MDUwQHFxLmNvbQ==