 Pengfei Hou
 Yue Wang3
 Jun Du
- 1Institute of Geographical Science, Henan Academy of Science, Zhengzhou, Henan, China
- 2Key Laboratory of Remote Sensing and Geographic Information Systems in Henan Province, Zhengzhou, China
- 3College of Geography and Environmental Science, Henan University, Kaifeng, China
- 4Chinese Academy of Surveying and Mapping, Bejing, China
- 5Forestry Survey and Planning Institute of Henan Province, Zhengzhou, China
The synergistic impacts of climate change and human activities have profoundly shaped vegetation dynamics, making the elucidation of their underlying driving mechanisms critical for regional ecological conservation and sustainable development. This study investigates these complex interactions in Henan Province, China, by integrating multi-source datasets from 2000 to 2020. We comprehensive analytical framework, which spans from traditional statistical methods to advanced machine learning models (Random Forest and Shapley Additive exPlanations), was employed to systematically decipher the spatiotemporal patterns of NDVI and its intricate driving forces. The results indicate: (1) During the past 2 decades, the NDVI in Henan Province exhibited a significant upward trend (an average increase of 0.049 per decade), which reflected the continuous improvement in ecological quality. Spatially, high NDVI values were mainly distributed in the mountainous areas in the west and south (Funiu Mountains and Tongbai Mountains), while the low-value areas were concentrated in the Central Plains urban agglomerations, which have shown signs of recovery. (2) Feature importance analysis based on machine learning precisely identified grassland, cropland, and barren land as the dominant drivers regulating the spatial pattern of NDVI, while impervious surfaces exerted the relatively weakest direct influence. (3) The SHAP model further revealed complex nonlinear relationships between key factors and NDVI. For instance, cropland exhibited a pronounced inverted U-shaped pattern, indicating that moderate agricultural activity positively contributes to vegetation cover, while excessive saturation may produce inhibitory effects. Although climatic factors establish the background conditions for vegetation growth, human activities are the primary drivers shaping the current spatiotemporal heterogeneity of NDVI.
1 Introduction
Against the backdrop of intensifying global climate change and increasing human activities, understanding the spatiotemporal dynamics of vegetation cover at regional scales and its response mechanisms to climatic factors has emerged as a pivotal focus in ecological and global change research (Satti et al., 2024). As a crucial component maintaining the normal functioning of terrestrial ecosystems, vegetation plays a indispensable role in regulating surface energy balance, hydrological cycles, and carbon fluxes. Moreover, it exhibits pronounced sensitivity to variations in climatic factors such as temperature and precipitation (Piao et al., 2006; Prăvălie et al., 2022). Owing to the synergistic effects of natural conditions and anthropogenic disturbances, vegetation demonstrates significant spatial and temporal heterogeneity in its distribution and evolution (Martínez et al., 2009). Consequently, identifying and quantifying vegetation responses to climate change holds not only substantial scientific value but also practical implications for ecosystem restoration, resource management, and regional sustainable development (Tian et al., 2015; Peng et al., 2019).
The Normalized Difference Vegetation Index (NDVI), a widely recognized indicator of vegetation growth, has been extensively utilized in vegetation monitoring, ecological assessment, and studies of environmental change (Wen et al., 2017). In recent years, with the development and refinement of long-term remote sensing datasets such as MODIS (Moderate Resolution Imaging Spectroradiometer) and GIMMS (Global Inventory Modeling and Mapping Studies), the analysis of NDVI trends and its climatic response mechanisms has become significantly more sophisticated (Lunetta et al., 2022; Huang et al., 2020). Research has demonstrated that NDVI is influenced by multiple climatic drivers, particularly temperature, precipitation, solar radiation, and aridity index, with marked spatial and seasonal variations in their effects (Zheng et al., 2018; Li et al., 2023). Earlier investigations predominantly concentrated on mid-to high-latitude regions in North America and Eurasia, employing long-term GIMMS and MODIS NDVI data to elucidate the spatiotemporal trends in vegetation greenness and its response to global warming (Detsch et al., 2016; Pesaresi et al., 2020). These studies revealed that rising temperatures and alterations in the spatial-temporal distribution of precipitation are the primary climatic factors driving global vegetation dynamics. Furthermore, NDVI responses exhibit substantial variability across different climatic zones in terms of sensitivity and lag effects (Jin et al., 2021). Recently, there has been increasing attention to nonlinear responses driven by multiple factors. Advanced multivariate statistical methods, including Principal Component Analysis (PCA), Structural Equation Modeling (SEM), and Redundancy Analysis (RDA), have been increasingly employed to decompose explanatory power and model response pathways, thereby enhancing our understanding of the complexity inherent in climate–vegetation systems (Shrestha et al., 2024).
Scholars have primarily concentrated on vegetation trends at global or continental scales, as well as their coupling relationships with climatic variables. In China, the extensive utilization of remote sensing datasets, such as GIMMS, MODIS, and AVHRR, has facilitated substantial progress in the investigation of NDVI trends and their driving mechanisms. This has resulted in the establishment of a multidisciplinary, multiscale, and regionally diverse research framework. Numerous studies indicate that the overall NDVI in China has increased, particularly in regions where ecological projects (e.g., the Three-North Shelterbelt and Grain-for-Green Program) have been implemented, reflecting significant vegetation recovery (Jin et al., 2021; Piao et al., 2005). Researchers have examined the responses of NDVI to various climatic variables such as temperature, precipitation, radiation, and soil moisture across different scales. These investigations reveal pronounced spatial heterogeneity in vegetation responses, with distinct climatic factors dominating in different ecological zones (Chu et al., 2019). Additionally, an increasing number of studies have integrated socioeconomic variables, such as land use, population density, and economic development, to assess the impacts of human activities on vegetation dynamics, thereby offering scientific support for evaluation of ecological policy (Yang L. et al., 2021). As a representative region characterized by dense farmland and ecological transition zones, Henan Province has garnered increasing attention in vegetation monitoring and climate response research. Existing studies suggest that since 2000, NDVI in Henan has exhibited an overall upward trend, with notable improvements observed in ecologically vulnerable areas, such as the Funiu and Taihang Mountains, while the plains have experienced greater variability (Zhu and Li, 2017). Most studies have utilized annual-scale NDVI data, applying trend analysis, correlation analysis, and regression models to identify temperature and precipitation as the primary climatic drivers of NDVI variation. Notable differences in responses across geomorphic units (Yin et al., 2021). While some scholars have attempted to introduce anthropogenic factors (e.g., urban expansion, ecological restoration projects) to explore non-climatic drivers, but detailed characterization of the spatiotemporal coupling mechanisms remains inadequate (Liu et al., 2020).
Despite these advancements, several critical gaps persist. First, research examining the monthly-scale relationship between NDVI and climatic variables has remained limited, with insufficient focus on dynamic characteristics and seasonal response patterns. Second, the interactive and combined effects among climatic variables have yet to be fully elucidated, and the synergistic or antagonistic interactions among multiple drivers remain to be systematically quantified. Third, few studies have employed advanced multivariate statistical techniques such as RDA to decompose and rank the explanatory power of climatic and geographic variables, which impedes the identification of dominant driving factors. Fourth, the coupling mechanisms between human activities and vegetation changes remain underexplored, lacking comprehensive quantitative analyses that assess the intensity, spatial distribution, and influence of anthropogenic factors on NDVI dynamics. Consequently, under the dual pressures of climate change and human activity, conducting monthly-scale analyses of NDVI dynamics in conjunction with multivariate statistical methods to quantify the integrated effects of climatic and anthropogenic drivers represents a critical direction and emerging trend in current research.
2 Data sources and methods
2.1 Study area
Henan Province, situated in central-eastern China (31°23′–36°22′N, 110°21′–116°39′E), encompasses a total area of approximately 167,000 km2 in the middle and lower reaches of the Yellow River Basin Figure 1. The province exhibits a topography that gradually slopes from west to east, featuring a variety of landforms such as mountains, hills, plains, and basins (Wei et al., 2023). The Huang-Huai Plain, which accounts for over 60% of the province’s territory, serves as a critical agricultural production base in China. Henan experiences a climate ranging from warm-temperate to subtropical monsoon, with average annual temperatures between 12 °C and 16 °C and annual precipitation varying from 600 mm to 1,200 mm. Precipitation is unevenly distributed both spatially and temporally, with higher levels in the southern regions compared to the northern areas, and the rainy season predominantly occurring during summer (Duan et al., 2023). In recent years, global climate change has led to an increase in extreme weather events, including droughts and floods, which have substantially impacted regional vegetation cover and ecosystem stability. The predominant vegetation types consist of cropland, deciduous broadleaf forests, and shrublands. The NDVI, a critical indicator of vegetation cover and growth status, demonstrates significant spatial and temporal heterogeneity in this region (Zhu and Li, 2017). Located in the transitional climate zone between northern and southern China, Henan’s vegetation is highly sensitive to climate change, making it an ideal region for studying the spatiotemporal evolution of NDVI and its climatic driving mechanisms.
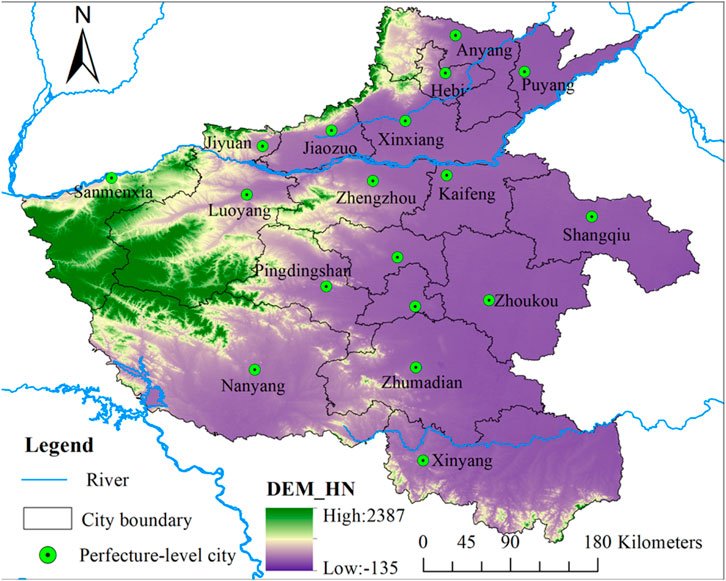
Figure 1. The location and climate background of Henan Province.
2.2 Data sources
Temperature and precipitation data for the period 2000 to 2020 were retrieved from the China Surface Climate Data Daily Dataset (V3.0), provided by the China Meteorological Data Service Center (http://cdc.cma.gov.cn/home.do). This dataset includes key climate variables such as temperature and precipitation. Vegetation index data were derived from the China 30 m Annual Maximum NDVI Dataset, which has a spatial resolution of 30 m (Yang et al., 2019). Land use data were obtained from the National Land Use/Cover Dataset, provided by the Resource and Environmental Science Data Center of the Chinese Academy of Sciences, also at a 30 m spatial resolution. To quantify the impact of human activities, annual dynamic human footprint data were generated based on the methodology proposed by Sanderson and Venter, incorporating eight variables reflecting various aspects of human pressure: built environment, population density, nighttime lighting, cropland, pasture, roads, railways, and navigable waterways (Mu et al., 2022). Furthermore, water consumption data, encompassing usage for agriculture, forestry, fisheries, industry, domestic purposes, and environmental needs, were sourced from the Henan Water Resources Statistical Yearbook (https://slt.henan.gov.cn/).
About how to handle missing data: (1) Nonzero missing value processing. Since the original meteorological data are daily data and their sample size was large, to avoid the influence of missing values on the prediction results, linear interpolation was used to deal with the missing values. (2) Removal of outliers. In the statistical test method, due to the sensor work process is inevitable due to the interference of external environmental factors resulting in data anomalies, so this paper selects the t-test method for the removal of outliers. (3) Original data standardization. To eliminate the impact of different quantitative outlines and large differences in values, the original variables are standardized.
2.3 Methods
2.3.1 Maximum value composite (MVC) method
The Maximum Value Composite (MVC) method was utilized to generate high-quality NDVI time series data by mitigating the impacts of cloud cover, atmospheric interference, and sensor angle variation (van Leeuwen et al., 1999). Based on the Google Earth Engine cloud computing platform, this dataset uses all Landsat remote sensing data from the entire year and, through data preprocessing and smoothing, obtains the maximum annual NDVI value for each pixel from 2000 to 2020. The spatial resolution of this dataset is 30 m, and the temporal resolution is annual. This process enabled the construction of a monthly NDVI dataset to Henan Province. Subsequently, the annual average NDVI was derived from monthly data and employed for further spatiotemporal analyses.
Where i denotes the year (ranging from 1 to 15), j denotes the month (ranging from 1 to 12), and EVIij is the maximum EVI value for the jth month of the ith year.
2.3.2 Trend analysis
To reveal the spatiotemporal evolution of NDVI, a univariate linear regression method was used to analyze the trend of the annual mean NDVI time series for each pixel from 2000 to 2020 (Fensholt et al., 2009). The regression slope (Slope) indicates the direction and rate of NDVI change, calculated as follows:
In the equation, n represents the total number of years, NDVIi denotes the NDVI value for the ith year, and i is the year index. A Slope >0 indicates an increasing trend in NDVI, while a Slope <0 indicates a decreasing trend. The significance of the trend was evaluated using a t-test (p < 0.05).
2.3.3 Pearson correlation analysis
The pearson correlation coefficient was employed to quantify the degree of linear correlation between two random variables, assuming both variables followed a normal distribution. This coefficient assigns a value ranging from −1 to 1, where 0 indicates no correlation, one signifies perfect positive correlation, and −1 denotes perfect negative correlation. A stronger absolute value of the coefficient suggests a more significant linear relationship between two sets of data (Benesty et al., 2009). The Pearson correlation coefficient is appropriate for analyzing two sets of continuous data that exhibit a linear relationship, provided that their overall distribution conforms to a normal distribution and each pair of measured values is independent. The formula is as follows:
Here, R represents the Pearson correlation coefficient of two sets of variables, X and Y, where Xi and Yi are the sample values of two sets of variables and
2.3.4 Non-parametric Mann-Kendall test
Mann-Kendall mutation test, also known as the Mann-Kendall rank test, is widely used in long-term hydrological, vegetation, and other data for mutation tests (Yue et al., 2002). For time series X1, X2, X3., Xn with n sample sizes, an order sequence was constructed using the following formula:
The rank sequence Sk is the cumulative number of times the value of i at the moment i is greater than the number of values at time j. Under the assumption of random independence of time series, define statistics:
Where UF1 = 0; E(Sk) and Var(Sk) are the mean and variance of the cumulative number Sk, respectively. This value is calculated when x1, x2, … , xn are independent and have the same continuous distribution as:
In the formula, UFi is a standard normal distribution, which is a sequence calculated according to time series x order x1, x2, … , xn. Given a significance level a, in comparison with the data in the known normal distribution table and if UFi > Ua, then significant changes exist in the trend. This method can also be applied to the inverse sequence of the time series, and the above procedure can be repeated by xn, xn−1, … , x1, thus making UFk = −UBk, k = n, n-1, …, UB = 0. If the UFk and UBk curves intersect at an intersection point and the intersection point is between the critical line, then the intersection point corresponds to the time the mutation begins.
2.3.5 Shapley additive explanations (SHAP)
In this study, we have combined SHA methods to explore the complex relationships between NDVI and climate change factors, as well as human activity factors. While SHAP was employed to interpret model outputs and reveal each feature’s contribution to prediction results. SHAP dependency plots were utilized to visualize how SHAP values for specific features vary with their own numerical changes and to uncover interaction effects between features.
Where g represents the selected variable,
3 Spatiotemporal characteristics of vegetation NDVI
3.1 Temporal and spatial variation trends of NDVI
3.1.1 Temporal variations of vegetation NDVI
From 2000 to 2020, the NDVI in Henan Province demonstrated a significant upward trend at both annual and monthly scales, while maintaining stable seasonal periodicity. This trend indicates continuous enhancement of regional ecological conditions and an overall increase in vegetation coverage. At the annual scale, NDVI values increased steadily from 0.413 in 2000 to 0.531 in 2020, resulting in a total increment of 0.118 over 2 decades, equivalent to an approximate growth of 28.6% (Equations 1, 2). Linear regression analysis confirmed a statistically significant upward trend, with an average annual increase of 0.0049, reflecting consistent improvement in vegetation conditions across the province during the study period (Figure 2a). The temporal evolution of NDVI in Henan can be characterized by two distinct phases. In the first phase (2000–2010), NDVI exhibited stable growth, increasing from 0.413 to 0.476 with minimal interannual variability. In the second phase (2010–2020), NDVI showed accelerated growth, surpassing 0.52 in 2015 and reaching a historical peak of 0.531 by 2020. Despite the overall positive trend, short-term declines were observed during 2008–2010 and 2012–2013, when NDVI temporarily dropped to 0.475 and 0.479, respectively, likely due to extreme climatic events. However, these fluctuations did not alter the long-term trend, underscoring the region’s robust ecological resilience and the adaptability of its vegetation to climatic stress.
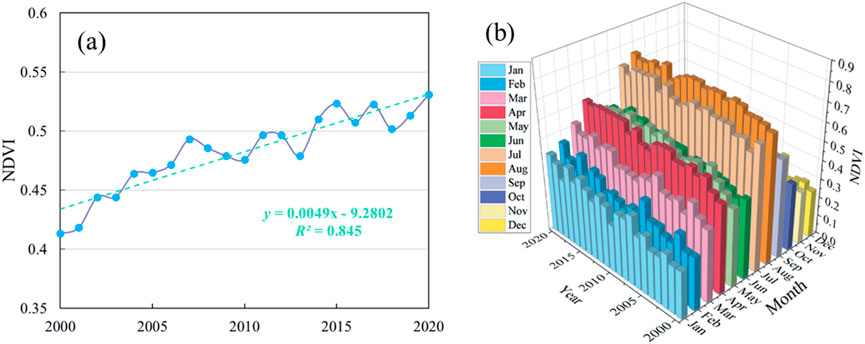
Figure 2. The temporal trend of NDVI in Henan Province from 2000 to 2020. (a) Year average, (b) Monthly average.
On the monthly scale, the NDVI demonstrated distinct seasonal dynamics. Peak values were recorded during the summer months, followed by spring, autumn, and winter (Figure 2b). January and February corresponded to the vegetation dormancy period, with NDVI values reaching their annual minimum, typically ranging between 0.25 and 0.35. As temperatures increased in spring, NDVI values exhibited a sharp rise starting in March, peaking at 0.59 in April. This increase is indicative of favorable climatic conditions and aligns with the jointing and heading stages of winter wheat growth. A notable decline was observed in June (NDVI = 0.54), primarily due to the harvesting of winter wheat and the early planting of summer maize. Subsequently, as environmental conditions continued to improve, vegetation such as forests, grasslands, and broad-leaved trees flourished, resulting in a secondary NDVI peak of 0.73 in August. Thereafter, senescence and leaf fall led to a gradual decline in NDVI values, which returned to their annual lows in November and December, thereby completing the full annual vegetation cycle.
3.1.2 Spatial variation characteristics of vegetation NDVI
From 2000 to 2020, the NDVI in Henan Province demonstrated a consistently upward trend with minor fluctuations, revealing distinct spatial distribution patterns. Higher NDVI values were predominantly observed in the western, eastern, and southeastern regions, while lower values were concentrated in the central and northern areas. Notably, mountainous regions exhibited significantly higher NDVI values compared to the plains (Figure 3). Spatially, regions with elevated NDVI were primarily located in the mountainous zones of the west and south, particularly in the Funiu and Tongbai Mountains. These areas, characterized by dense vegetation cover and NDVI values approaching 1.0, serve as the ecological core zones of the province, indicating regions of high environmental quality. Over the two-decade period, these mountainous ecosystems displayed remarkable stability, with minimal NDVI variation, suggesting limited anthropogenic disturbance and robust natural ecosystem resilience.
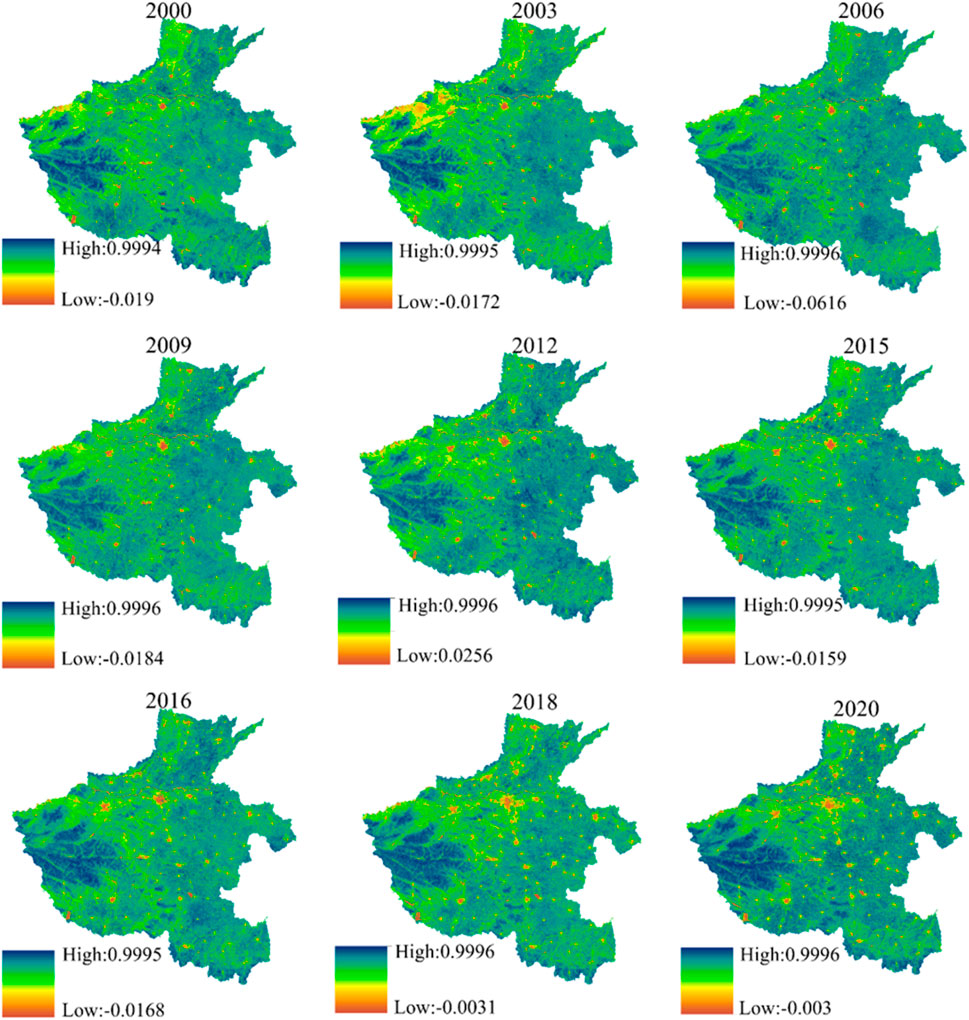
Figure 3. The temporal trend of NDVI in Henan Province from 2000 to 2020.
In contrast, areas characterized by consistently low NDVI values were concentrated in the central and northeastern plains, particularly within the urban agglomeration centered around Zhengzhou, which includes cities such as Kaifeng, Xinxiang, and Xuchang. These regions underwent rapid urbanization and significant land-use transformation, resulting in the conversion of farmland and vegetated land into urbanized areas, with NDVI values remaining below 0.4. Nevertheless, recent years have seen witnessed signs of ecological improvement, largely attributed to the implementation of ecological restoration policies, such as urban greening programs and the “Three Lines and One List” planning framework. These efforts have facilitated a partial recovery in NDVI values, thereby demonstrating the efficacy of national ecological strategies and green development policies in enhancing urban vegetation coverage, optimizing land use, and promoting environmental sustainability.
Overall, the spatial variation of NDVI in Henan Province from 2000 to 2020 demonstrates distinct regional differentiation, the western mountainous areas exhibit consistently high ecological quality; the central plains show a transition from low to moderately high NDVI values; and previously degraded urbanized zones are gradually recovering These patterns not only highlight the inherent natural geographic heterogeneity but also underscore the significant impact of human activities and targeted policy interventions on regional ecological conditions.
3.2 Characteristics of climate change
3.2.1 Spatiotemporal characteristics of air temperature
From 2000 to 2020, the average annual temperature in Henan Province showed a significant upward trend, about 0.03 °C per decade (Figure 4a). Over this two-decade period, the mean annual temperature was 14.49 °C, ranging from a minimum of 13.73 °C in 2003 to a maximum of 15.17 °C in 2013 t, indicating a relatively narrow fluctuation range of 1.44 °C. Since 2010, annual mean temperatures have consistently exceeded 15 °C, reaching a historical peak of 18.09 °C in 2016, further corroborating the regional warming trend. In contrast, temperature variability was more pronounced between 2001 and 2009, whereas after 2010, interannual fluctuations decreased while the frequency of high-temperature years increased significantly. At the monthly scale, Henan’s temperature exhibited a typical unimodal seasonal distribution, peaking in July at approximately 27.1 °C and reaching its lowest values in winter, strongly influenced by both latitude and the monsoonal climate. Over the 2 decades, temperatures demonstrated a consistent upward trend, with the most pronounced warming occurring in winter (0.06 °C per year), followed by spring and autumn. These changes were accompanied by phenological shifts, such as earlier onset of spring and delayed onset of autumn (Figure 4b). Although summer temperatures remained relatively high, their increases were less marked and showed greater interannual variability. Notably, NDVI exhibited a distinct bimodal pattern at the monthly scale, closely correlated with temperature fluctuations.
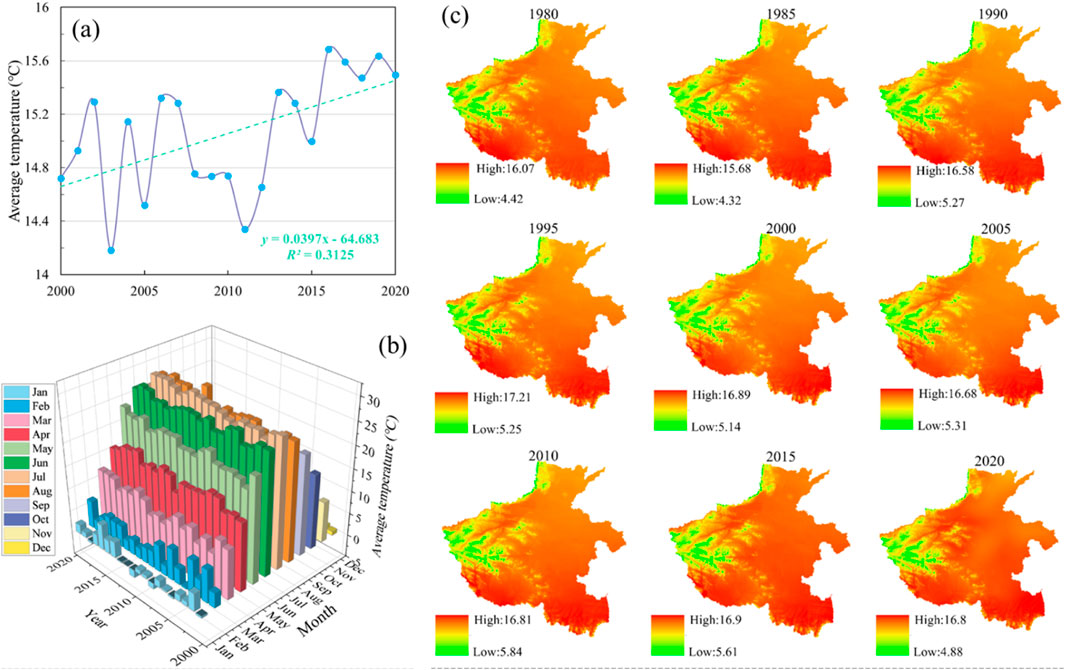
Figure 4. Temporal and spatial temperature trends in Henan Province from 2000 to 2020. (a) Annual average; (b) monthly average; (c) trends in spatial variability.
Spatially, the temperatures gradient in Henan Province exhibited an increase from the western mountainous regions toward the eastern and southern plains. Cooler temperatures, generally below 10 °C, were recorded in higher-elevation areas such as the Funiu and Taihang Mountains in the west and northwest, whereas warmer conditions dominated in the southeastern and central plains, particularly in the eastern Henan Plain, where annual mean temperatures consistently exceeded 15 °C. Over the period from 2000 to 2020, Henan’s annual mean temperature demonstrated a persistent upward trend. Spatial temperature patterns become more homogeneous, with regional disparities gradually diminishing. These changes are likely attributable to global climate warming, intensified urban heat island effects, and alterations in land use (Figure 4c). Future studies should incorporate multi-source remote sensing data alongside meteorological station observations to investigate the potential implications of this warming trend on regional ecosystems, agricultural production, and urban environments, thereby offering scientific underpinnings for climate-resilient regional development strategies.
3.2.2 Spatiotemporal characteristics of precipitation
From 2000 to 2020, the annual mean precipitation in Henan Province was 754.29 mm, exhibiting significant interannual variability. The highest annual precipitation was recorded in 2003 at 1080.4 mm, whereas the lowest occurred in 2001 at 543.57 mm. This represents an interannual range nearly doubling the minimum value, with a standard deviation of 124.01 mm, indicating substantial instability in precipitation patterns (Figure 5a). The period from 2001 to 2010 was relatively wet, with 2003 marking the peak precipitation. Conversely, the year 2011–2019 were characterized by drier conditions, particularly in 2019, which experienced exceptionally low precipitation and highly uneven intra-annual distribution. In 2020, precipitation rebounded to 874.3 mm, suggesting a cyclical fluctuation pattern in regional precipitation. At the monthly scale, precipitation displayed distinct seasonal characteristics. Summer months (June to August) constituted the primary precipitation period, accounting for 60%–70% of the annual total, predominantly driven by convective rainfall (Figure 5b). Winter months (November to February) had the least precipitation, influenced by cold, dry continental air masses, with monthly averages often below 30 mm and occasionally dropping to single digits (e.g., 0.74 mm in January 2007), thereby increasing the likelihood of meteorological drought. Spring and autumn served as transitional periods, with monthly precipitation varying between 6.8 and 123.3 mm. Overall, precipitation in Henan during the 2000–2020 period demonstrated pronounced spatiotemporal heterogeneity, strongly influenced by monsoon climate, with increasing cyclical and extreme characteristics.
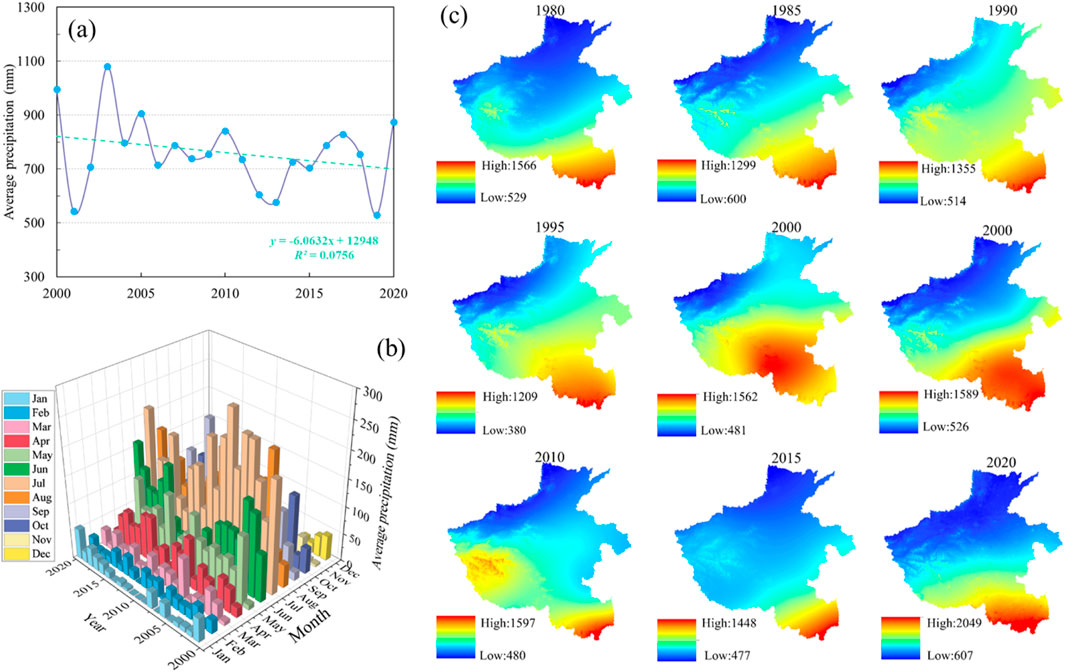
Figure 5. The Temporal and spatial precipitation trends in Henan Province from 2000 to 2020. (a) Annual average; (b) monthly average; (c) trends in spatial variability.
Spatially, the distribution of precipitation in Henan Province exhibited significant regional differentiation and phased trends. Overall, precipitation decreased progressively from south to north. Specifically, southern regions, such as the Funiu and Dabie Mountains, demonstrated markedly higher multi-year average precipitation compared to northern and northwestern areas, including the Loess Plateau and North China Plain (Figure 5c). The provincial mean annual precipitation was 772 mm, with the highest value of 1357.85 mm recorded in Shangcheng County, Xinyang, and the lowest of 478.3 mm observed in Sanmenxia, western Henan. The higher precipitation in the southern part of province can primarily be attributed to its subtropical climate, which enhances the influence of the summer monsoon and provides favorable solar radiation conditions. Additionally, orographic lifting effects associated with complex mountainous and hilly terrain in western Henan contribute to abundant precipitation in this region. Conversely, the lower precipitation in Sanmenxia is a result of the blocking effect of western mountains, which reduces the influence of the monsoon. Furthermore, northern Henan, located in a warm temperate zone at higher latitudes, received less precipitation due to its geographical position.
3.3 Characterization of anthropogenic changes
3.3.1 Characterization of changes in land use types
From 1985 to 2020, land use types in Henan Province underwent significant changes, marked by a spatial succession process characterized by the predominance of stable cropland, rapid expansion of urbanized areas, and gradual restoration of ecological land (Figure 6). The total area of cropland area decreased substantially, contracting from approximately 120,701 km2 in 1985 to 108,429 km2 in 2020, resulting in a net loss exceeding 12,000 km2. Notably the rate of decline accelerating after 2010. This reduction can primarily be attributed to rapid processes of urbanization and industrialization, during which considerable portions of cropland were repurposed as built-up land (impervious surfaces), forestland, and water bodies. Specifically, approximately 10,264 km2 of cropland was converted into impervious surfaces, indicative of extensive urban expansion, infrastructure development, and the establishment of industrial park. Meanwhile, the area of forestland expanded steadily by nearly 2,000 km2, facilitated by proactive ecological conservation initiatives such as the Grain for Green Project and reforestation efforts on barren hills. This expansion contributed positively to enhancing regional ecosystem services and improving environmental quality. Conversely, the grassland area exhibited a significant decline, decreasing from approximately 3,444 km2 in 1985 to less than 2,000 km2 in 2020. This reduction was primarily attributed to the conversion of grasslands into built-up land, to a lesser extent, forestland, likely driven by suburban expansion and ecological restoration initiatives aimed at grassland-to-forest conversion. The water body area demonstrated a slight increase, expanding from 1,732.47 km2 to 2,048.32 km2, representing a net gain of 315.85 km2 (18.2%). This growth may be associated with water conservancy projects, lake and wetland restoration efforts, as well as enhanced water storage capacity, thereby reflecting improved regional ecological functions. The impervious surface area experienced a dramatic surge, increasing from 11,861 km2 in 1985 to 23,589 km2 in 2020, resulting in a net increase of 11,728.45 km2 (98.9%). This substantial rise underscores intensified land use due to rapid urbanization, which has profound implications for regional water cycles and urban heat island effects. Lastly, the barren land area showed a marked decline, decreasing from 16.94 km2 to 2.43 km2, corresponding to a net reduction of 14.51 km2 (85.7%). This trend indicates the transformation of previously unused land into economically and ecologically valuable types, highlighting enhanced land resource utilization efficiency.
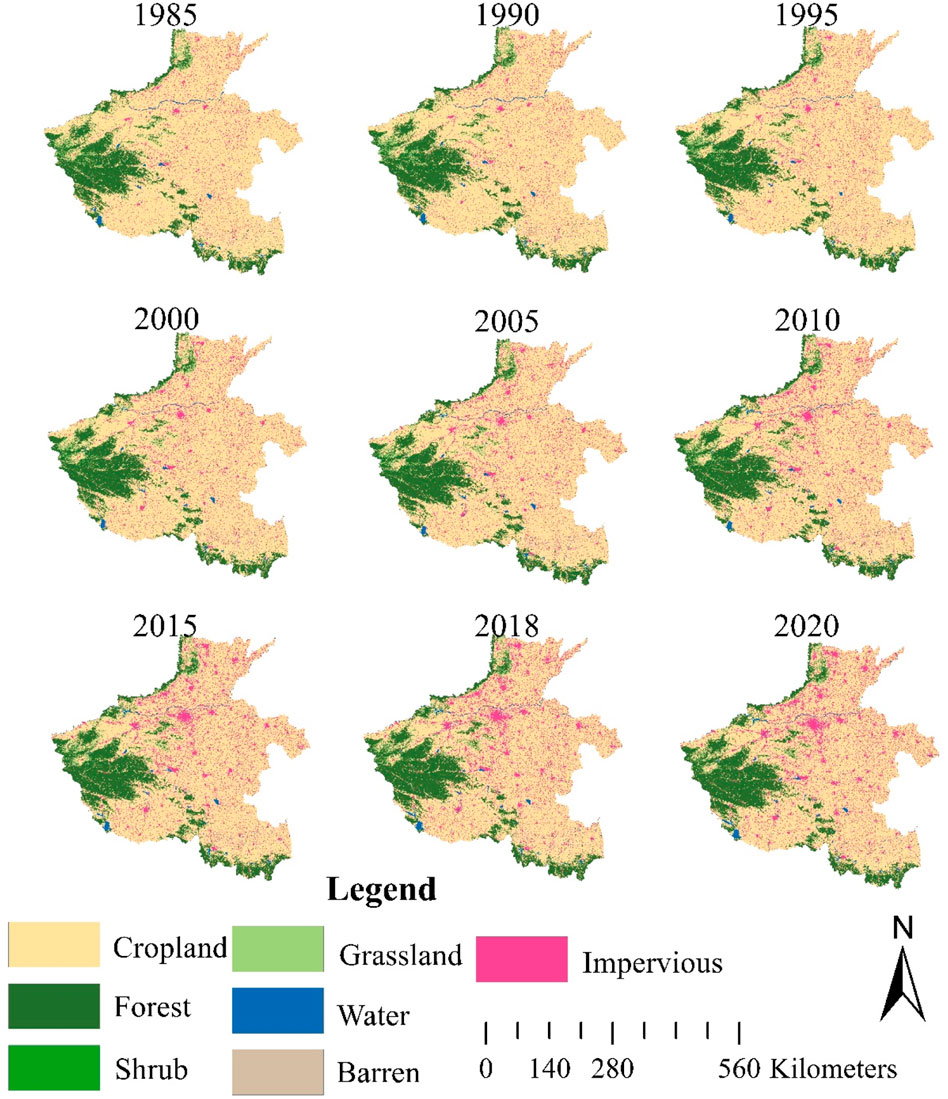
Figure 6. The change trend of land use types in Henan Province from 2000 to 2020.
Spatially, in 1985, cropland was primarily concentrated in the central and eastern plains of Henan, serving as the predominant land use type. By 2020, built-up areas exhibited a concentric outward expansion, particularly surrounding major cities such as Zhengzhou, Luoyang, and Kaifeng, resulting in the formation of extensive artificial surface zones. Simultaneously, forestland in the western mountainous regions continued to expand, thereby reinforcing ecological boundaries. The distribution of water body remained relatively stable, whereas grassland and barren land experienced consistent contraction. Overall, the land use changes in Henan Province reflect the dual influences of socio-economic development and ecological conservation efforts. Under mounting pressure to safeguard cropland resources, the expansion of ecological spaces alongside controlled urban growth signifies a shift toward more intensive, efficient, and ecologically sustainable land management practices.
3.3.2 Spatiotemporal dynamics of human activity footprint
From 2000 to 2020, the intensity of human activity footprint in Henan Province increased markedly, shifting from localized “point-like aggregation” to extensive “area-wide sprawl” (Figure 7). In 2000, high-intensity human activity was predominantly concentrated in Zhengzhou and its surrounding cities, such as Luoyang and Kaifeng, forming an “isolated island” pattern of distribution. (1) Following Zhengzhou’s designation as a national central city and the rapid development of its metropolitan area, by 2020, high-intensity zones (marked as red areas) had expanded significantly and become highly concentrated, forming a contiguous region of high-intensity human activity centered on Zhengzhou and extending to neighboring cities like Xuchang, Kaifeng, and Xinxiang. This evolution underscores Zhengzhou’s role as a core driver of intensified human activity and urbanization, driven by increasing industrial agglomeration, population influx, and land-use development. (2) Analysis of annual data reveals that, since 2000, regions along major transportation corridors, such as the Beijing-Guangzhou Railway, Lianhuo Expressway, and Zhengmin Expressway, have experienced periodic intensification of human activity. Between 2005 and 2015, these areas rapidly merged into continuous high-intensity zones, forming prominent belt-like regions characterized by intense human activity. This transformation underscores the pivotal role of transportation infrastructure in guiding regional spatial development and promoting an urbanization pattern marked by “axis-led growth and nodal reinforcement”. Consequently, this process has facilitated the integration of urban and rural spaces and accelerated the concentration of population and resources along these corridors. (3) The western Funiu Mountains and southern Dabie Mountains have remained largely untouched by human activity. Nevertheless, emerging zones with intensified human footprints have appeared at the edges of these regions, signifying a transition from pristine natural areas to development buffer zones. While core ecological areas have not yet undergone significant large-scale disturbance, the escalating human activity in their peripheries zones indicates that ecological barriers are increasingly subject to external pressures.
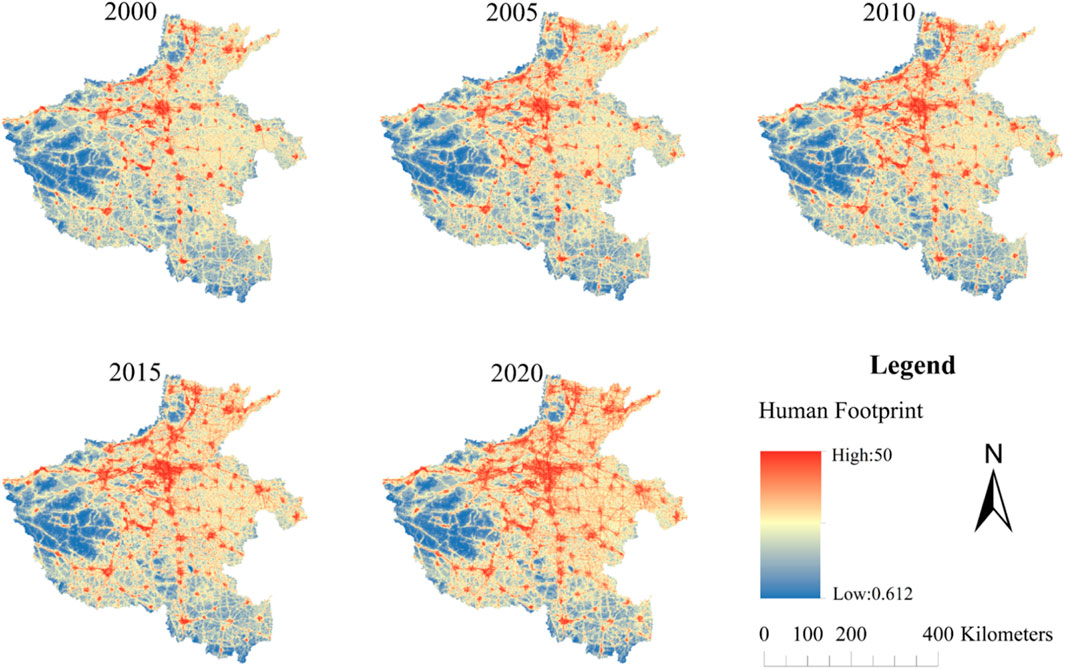
Figure 7. The change trend of human activity footprint in Henan Province from 2000 to 2020.
Overall, between 2000 and 2020, the human activity footprint in Henan Province exhibited a spatial expansion pattern characterized by “central agglomeration, axis-led development, and peripheral encroachment.” The high-intensity expansion of the Zhengzhou-centered urban agglomeration, rapid development along transportation corridors, and gradual encroachment upon ecological boundaries highlight the inherent tension between urbanization and ecological conservation.
3.3.3 Characteristics of water use change
From 2000 to 2023, water consumption in Henan Province exhibited overall stability, phased fluctuations, and a continuous optimization of water use structure. Total annual water consumption ranged from 18.762 billion m3 to 24.057 billion m3, with an average of approximately 22.3 billion m3. In recent years, total water consumption has stabilized and shown a slight decline, reaching 20.878 billion m3 in 2023, which is near the historical low (Figure 8).
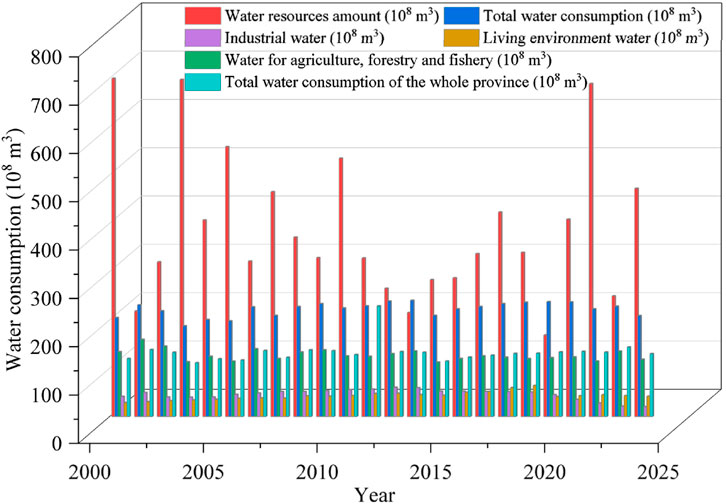
Figure 8. The trend of water consumption in Henan Province from 2000 to 2020.
The evolution of water consumption can be categorized into three distinct phases: (1) 2000–2009: Total water use exhibited significant fluctuations, increasing from 20.487 billion m3 in 2000 to 23.371 billion m3 in 2009, with a marked low point in 2003 at 18.762 billion m3. These variations were predominantly influenced by interannual changes in meteorological conditions and irrigation requirements impacting agricultural water use. (2) 2010–2019: Total water consumption stabilized within the range of 22.0 and 24.0 billion m3, reaching its peak in 2013 at 24.057 billion m3. During this phase, improvement in water allocation efficiency was observed, along with a gradual shift in the water use structure. (3) 2020–2023: Total water use demonstrated a downward trend, decreasing by approximately 12% from 23.714 billion m3 in 2020 to 20.878 billion m3 in 2023. This reduction is likely attributed to advancements in water-saving technologies, optimization of industrial structures, and an enhanced focus on ecological water use.
Agricultural water use (encompassing agriculture, forestry, and fisheries) remained the dominant component of total water consumption, accounting for 50%–70%. In 2000, agricultural water use was 13.420 billion m3 (65.5% of the total), decreasing to 11.860 billion m3 (56.8%) by 2023. Despite this reduction, agriculture continued to dominate water use, reflecting Henan’s strong reliance on water resources for agricultural production. The decline in agricultural water use can likely be attributed to the widespread adoption of water-saving technologies, such as drip irrigation, and improved irrigation efficiency.
Industrial water use exhibited a significant decline, decreasing from 4.173 billion m3 (20.4%) in 2000 to 2.070 billion m3 (9.9%) in 2023, representing a reduction of over 50%. Between 2000 and 2010, industrial water uses experienced modest growth, reaching its peak at 5.557 billion m3. However, it subsequently underwent a rapid decline, particularly during the period of 2020–2023, went it fell from 3.559 billion m3 to 2.070 billion m3. This trend can be attributed to industrial restructuring and implementation of advanced water efficiency measures.
Domestic and ecological water use showed a steady increase, primarily attributed to urbanization and enhancement of living standards. In 2000, this category accounted for 2.894 billion m3 (14.1%), which increased to 4.211 billion m3 (20.2%) by 2023. The highest recorded value was 6.43 billion m3 in 2018, followed by stabilization. This growth pattern underscores the significant impacts of rapid urbanization, improved quality of life and heightened demand for ecological restoration efforts.
In summary, from 2000 to 2023, Henan’s total water consumption has remained relatively stable, with a downward trend observed in recent years. The water use structure has undergone substantia optimization, characterized by a declining proportion of agricultural water, a significant reduction in industrial water use, and a steady increase in domestic and ecological water use. These changes reflect the impacts of regional economic restructuring and social development. However, considerable interannual fluctuations in water resources and supply-demand imbalances in certain periods underscore the persistent challenges in water resource management.
4 Discussion
4.1 Spatiotemporal trends of NDVI in henan province
From 2000 to 2020, the NDVI in Henan Province showed an overall upward trend over the past 2 decades, and the ecological conditions improved (He et al., 2021; Yan et al., 2020). We discovered a significant positive correlation between NDVI and temperature (R = 0.37, p < 0.05) as Henan’s annual mean temperature rose markedly (Equations 3–8). An increase in temperature effectively extends the growing season in temperate regions, advancing spring phenology and delaying autumn phenology, thereby providing a longer time window for vegetation photosynthesis. Meanwhile, in relatively sufficient moisture plains, moderate warming directly enhances photosynthetic enzyme activity, thereby boosting net primary productivity and ultimately manifesting as increased NDVI values. However, unlike the direct driving effect of temperature, precipitation influences are more complex. Precipitation in the study area showed fluctuating declines, yet its interannual correlation with NDVI was weak. In line with previous studies, this upward NDVI trend is particularly pronounced in ecologically sensitive areas, such as western mountainous regions and the hilly areas along the Yellow River, including the Funiu and Taihang Mountains (Zhu et al., 2019; Duo et al., 2016). This enhancement is attributed to both climatic and anthropogenic factors. Specifically, regional warming, particularly during winter and spring, has extended the growing season, thereby enhancing vegetation productivity (Zhang L. et al., 2022). Additionally, national and provincial ecological restoration policies have played a crucial role in driving this positive change. Henan Province has proactively implemented a series of major initiatives, including the Grain for Green Program, the Three-North Shelterbelt Forest Program, and ecological redline zoning. These efforts have led to extensive afforestation and reforestation activities, particularly in mountainous areas, where forest and grassland ecosystems have exhibited substantial recovery (Liu and Lei, 2015; Chen et al., 2024). Moreover, agricultural transformation in Henan has facilitated land-use optimization through measures such as expanding silage maize cultivation and promoting high-quality forage production. These strategies have not only advanced agricultural modernization but also improved land cover quality and vegetation density (Chen et al., 2022). Remote sensing data further demonstrate that such land-use restructuring efforts have substantially increased NDVI in previously degraded rural landscapes, highlighting the potential of well-designed agricultural policies to deliver co-benefits for food security and ecosystem integrity.
Despite the generally positive trend in NDVI, significant spatial heterogeneity remains evident. Regions undergoing rapid urbanization, particularly the Zhengzhou-Luoyang industrial corridor and the northeastern plains, exhibit stagnant or slightly declining NDVI values. These declines are predominantly attributed to the transformation of cropland and green spaces into impervious urban surfaces, which disrupts ecological connectivity and reduces vegetation cover (Xiao et al., 2024; Ren et al., 2022). Urbanization further intensifies the urban heat island effect, altering microclimates conditions and potentially inhibiting vegetation growth in urbanized areas (Yang et al., 2022). Moreover, the analysis highlights that spatial and temporal patterns of NDVI are scale dependent. High-resolution satellite data reveal localized patches of vegetation degradation or greening that may be overlooked by coarser-scale assessments. This emphasizes the necessity of employing multi-scale approaches to accurately evaluate ecological conditions in regions undergoing complex socio-environmental transformations (Jia et al., 2023; Guo et al., 2022).
4.2 Analysis of factors influencing NDVI in henan province
The spatiotemporal variations in the Normalized Difference Vegetation Index (NDVI) are influenced by multiple factors, with climate change (notably temperature and precipitation) and human activities being the predominant drivers. Between 2000 and 2020, Henan Province experienced a substantial increase in annual mean temperature, rising by approximately 1.55 °C at an average rate of 0.03 °C per year. This warming trend was most pronounced in eastern and northern Henan, largely attributed to rapid urbanization, industrialization, and increased greenhouse gas emissions (Liu et al., 2022). Statistical analysis revealed a significant positive correlation between NDVI and temperature (R = 0.32, p < 0.05), suggesting that moderate warming prolongs the growing season and enhances photosynthetic efficiency, thereby promoting vegetation growth and greenness. Spatially, the positive impact of temperature on NDVI was more evident in the plains, such as the eastern Henan Plain and the northern Huang-Huai Plain. Conversely, complex relationships, including localized negative correlations, were observed in the western mountainous and southern hilly regions, likely due to limited heat accumulation, reduced sunlight, or localized temperature inversions. These findings indicate that the beneficial effects of warming on vegetation growth are constrained in areas with topographically complex. Our statistical analysis reveals a significant positive correlation between NDVI and temperature (R = 0.32, p < 0.05), a finding that is highly consistent with an extensive body of previous research. Moderate climate warming is widely recognized as a key driver of vegetation activity, operating through primary mechanisms such as an extended effective growing season (Shen et al., 2015). For instance, studies have shown that rising temperatures significantly advance spring phenology in high-altitude regions like the Tibetan Plateau, providing a longer temporal window for vegetation growth. Concurrently, where hydrothermal conditions are favorable, elevated temperatures can directly enhance photosynthetic efficiency and Net Primary Production (NPP), thereby promote biomass accumulation and increase vegetation greenness (Shen et al., 2016).
In contrast, the influence of precipitation changes on NDVI is more complex and indirect. Between 2000 and 2020, annual mean precipitation in Henan Province exhibited a fluctuating downward trend, with a cumulative decrease of approximately 121 mm, equivalent to a 12.2% reduction, predominantly in central and eastern Henan. Despite the weak correlation between NDVI and precipitation at the interannual scale, this partially reflects the mitigating effects of widespread irrigation systems and advanced agricultural water management, which diminish vegetation’s reliance on natural precipitation (Jian et al., 2022). For instance, in 2018, despite lower precipitation levels (504.19 mm), NDVI remained relatively high (0.5017), underscoring the pivotal role of irrigation in sustaining vegetation growth.
4.3 Human activities impact on NDVI change
4.3.1 Impacts of land use change on NDVI
From 1985 to 2020, Henan Province underwent a three-phase transformation in land use patterns, characterized by cropland reduction, expansion of impervious built-up areas, and ecological land restoration (Zhao et al., 2024). This trajectory highlights the complex interplay between rapid urbanization and ecological restoration initiatives. Statistical analysis demonstrated a robust positive correlation between the NDVI and cropland area (R = −0.76, p < 0.01), emphasizing the critical role of agricultural land in maintaining vegetation cover (Figure 9). Over the 35-year period, cropland area decreased by over 12,000 km2, predominantly converted into impervious built-up land, which expanded by 11,728.45 km2, thereby suppressing local NDVI due to diminished vegetation cover (Yan et al., 2020). In contrast, forestland increased by approximately 2,000 km2, particularly in the western mountainous regions, driven by ecological initiatives such as the Grain for Green Project and afforestation of barren hills. These efforts significantly enhanced NDVI, with areas of forest expansion closely corresponding to regions exhibiting significant NDVI improvement (Qin et al., 2024).
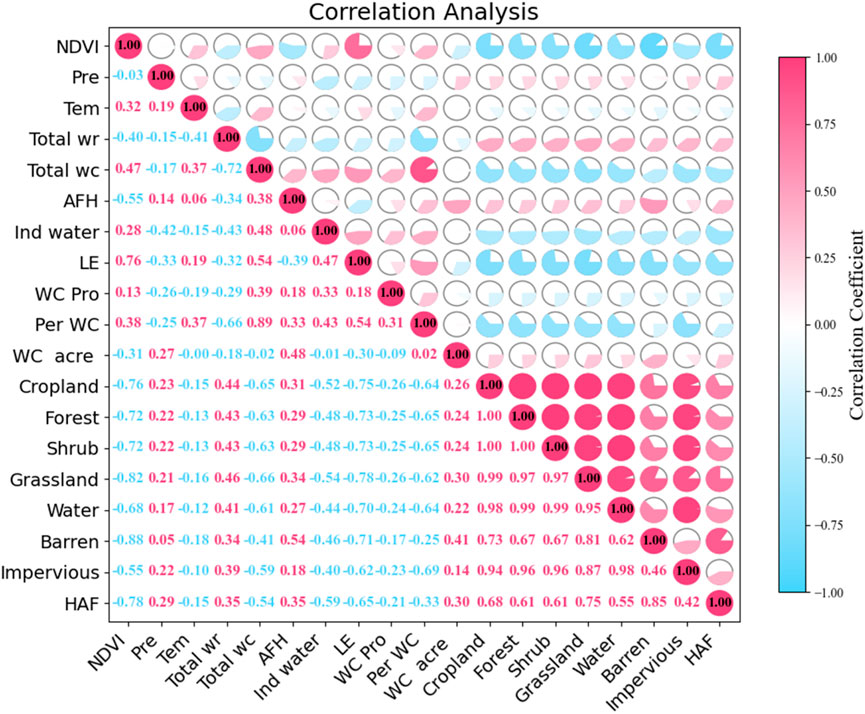
Figure 9. The trend of water consumption in Henan Province from 2000 to 2020.
NDVI demonstrated significant positive correlations with grassland (R = −0.82, p < 0.01) and water areas (R = −0.67, p < 0.01). Despite the reduction in grassland, partly due to their conversion into forestland or built-up areas, which caused temporary disruptions NDVI, the long-term optimization of vegetation composition and the balanced configurations of forest and grassland ecosystems contribute to an overall increase in surface greenness. Additionally, the controlled expansion of water bodies ensured stable water availability, thereby supporting the enhancement of NDVI in adjacent areas.
We employed the SHAP method to evaluate the contribution of the drivers to NDVI changes in Henan Province. The results of the feature importance analysis (Figure 11) indicated that Grassland, Cropland, and Barren were the dominant drivers influencing the spatial distribution of NDVI in this region, with their average absolute SHAP values significantly higher than other variables. This indicates that the model is most sensitive to changes in these three land cover types when predicting NDVI (Equation 9). Other factors, such as HAF, Shrub, Water, and Forest, also demonstrate certain predictive capabilities, while Impervious surfaces exhibit the weakest overall influence. The SHAP dependence plots (Figures 11b–g) further reveal the complex nonlinear relationships and marginal effects between key factors and NDVI. In particular: Grassland exhibits a consistent positive contribution to NDVI, with its SHAP value increasing as grassland area expands (Figure 11b). Barren land and water bodies exhibit strong monotonically negative effects (Figures 11d,g). Barren land, due to its lack of vegetation cover, and water bodies, owing to their strong absorption of near-infrared spectra, both lead to a significant decrease in the model-predicted NDVI values as their areas increase. More significantly, cropland exhibits a pronounced inverted U-shaped nonlinear pattern (Figure 10c). Within a certain range, increasing cropland area strongly drives NDVI upward, consistent with Henan Province’s status as a major agricultural region featuring dense, healthy vegetation during crop growing seasons. However, this positive effect begins to diminish and even turns negative once Cropland reaches a threshold. This may reflect factors such as fallow periods, dense agricultural infrastructure, or landscape fragmentation in areas with extremely saturated cropland coverage, collectively exerting a suppressing effect on the overall regional NDVI. The effects of HAF (Human Activity Factor) and Shrub also exhibit nonlinearity. HAF displays an inverted U-shaped relationship similar to cultivated land (Figure 11e), indicating that moderate human activity (e.g., urban green spaces, ecological corridors) enhances vegetation cover, while excessively low or high activity levels (e.g., wastelands or highly urbanized areas) produce negative impacts. Shrub cover exhibits a unique U-shaped relationship (Figure 11f), with negative contributions at medium densities and positive contributions at low and high densities. This may reveal the complex influence of shrubs on remote sensing vegetation indices across different succession stages or community structures.
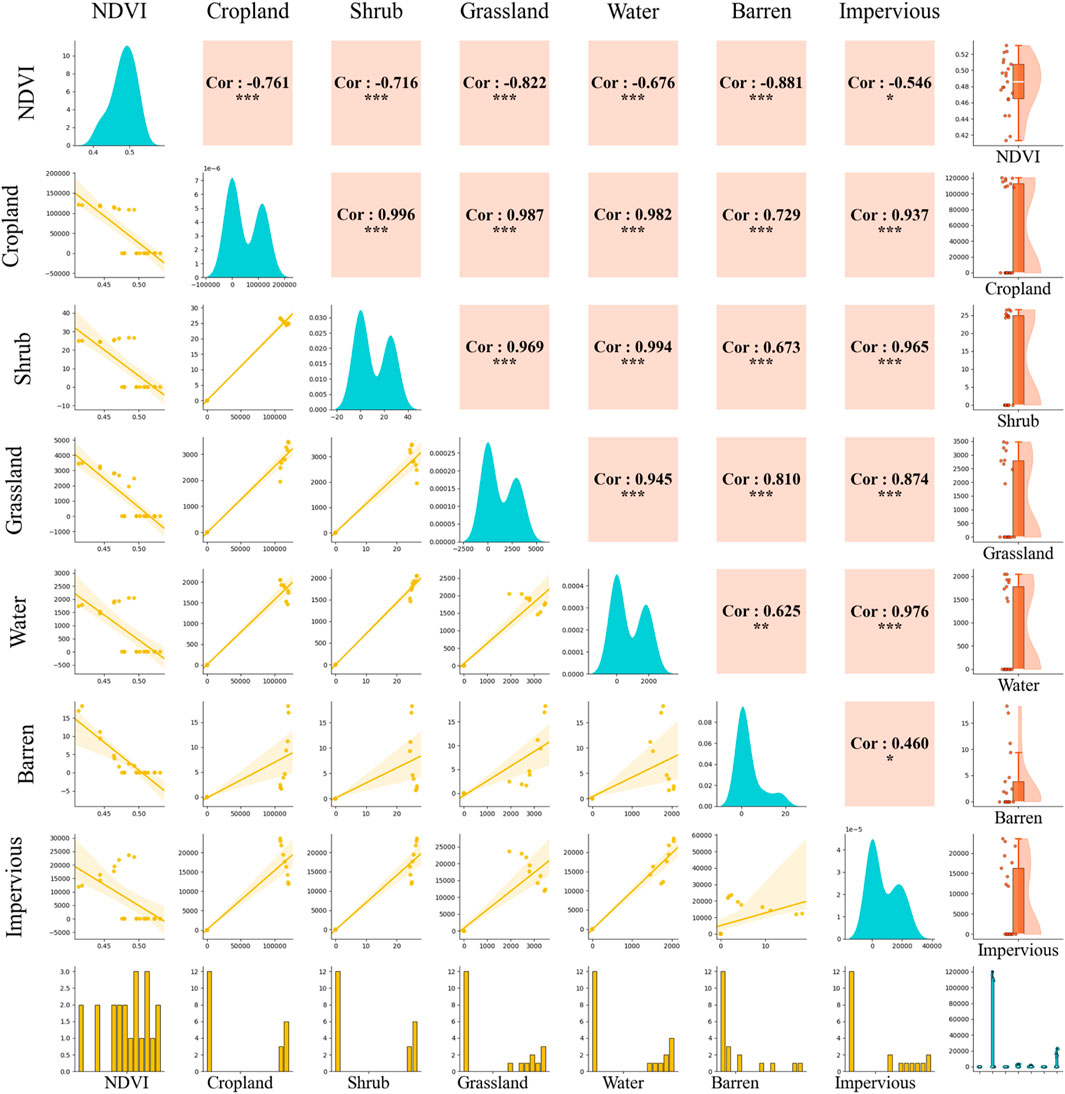
Figure 10. Correlation between NDVI and human activity factors.
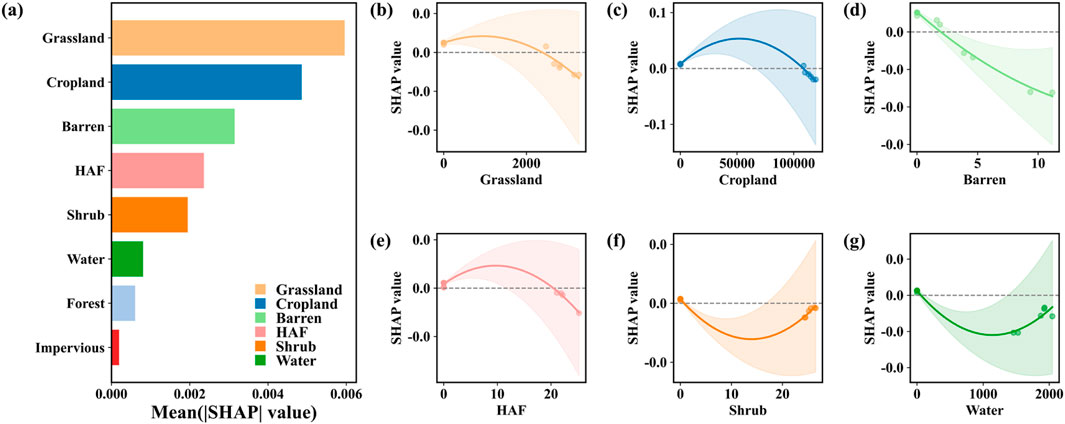
Figure 11. Mean Contribution of Each Factor to NDVI Prediction (a) and SHAP Dependence Plots (b–g).
4.3.2 Evolution of human activity spatial patterns and NDVI response
Between 2000 and 2020, Henan Province demonstrated a pronounced spatial expansion pattern characterized by central agglomeration around the Zhengzhou urban cluster, corridor-guided development along transportation networks, and peripheral extension into ecologically sensitive areas. High-intensity human activities transitioned from isolated “point-like islands” to extensive “surface sprawl,” spreading outward from Zhengzhou to neighboring cities such as Xuchang, Kaifeng, and Xinxiang. These activities, accompanied by an increase impervious surface and intensified urban heat island effects, exerted pressure on NDVI through modifications to surface albedo (Zhang Y. et al., 2022). Nevertheless, urban greening initiatives and ecological planning alleviated these impacts, leading to a significant positive correlation between urban pixel count and NDVI (R = 0.95, p < 0.01), thereby underscoring the efficacy of strategic green space allocation in mitigating the ecological consequences of urbanization.
Ecological measures, including the establishment of greenway networks and forested buffer zones along transportation corridors, have significantly enhanced local NDVI levels and strengthened regional ecological connectivity. Nevertheless, peripheral areas of key ecological barrier zones, such as the Funiu Mountains in the west and the Dabie Mountains in the south, are experiencing increasing anthropogenic pressures. These regions are gradually transitioning from protected to developed zones, which poses a significant threat to the long-term stability of NDVI in these ecologically sensitive areas. Therefore, it is imperative to implement robust management and protection mechanisms to safeguard against future vegetation degradation.
4.3.3 Water use structure optimization and NDVI response
From 2000 to 2023, total water uses in Henan Province exhibited a pattern characterized by overall stability, periodic fluctuations, and structural optimization. In 2023, it stabilized at 20.878 billion cubic meters, which is close to a historical low. This trend highlights enhanced water resource efficiency driven by the adoption of water-saving technologies, optimized water uses structures, and an ecological priority strategy, all contributing to the recovery of vegetation ecosystem (Wei et al., 2022). Although agricultural water use remains dominant, its proportion decreased from 65.5% of total water use in 2000 to 56.8% in 2023. The implementation of advanced water-saving irrigation techniques, such as drip and sprinkler systems, significantly improved water use efficiency, thereby enhancing the drought resilience of crops and natural vegetation and thereby positively influencing the NDVI. Correlation analysis revealed statistically significant positive relationships between NDVI and total water use (R = 0.51, p < 0.01), agricultural, forestry, and fishery water use (R = 0.44, p < 0.05), and farmland irrigation water use (R = 0.61, p < 0.01). These findings emphasize the pivotal role of efficient water allocation in maintaining regional vegetation cover.
4.4 Comprehensive assessment and mechanism synthesis
From 2000 to 2023, Henan Province demonstrated a sustained upward trend in the NDVI, attributable to the synergistic interplay of human activities, ecological engineering projects, and optimized resource management. The expansion of urban areas and the transformation of cropland into impervious built-up areas exerted localized pressure on NDVI, particularly in regions with high-intensity human activity zones and along transportation corridors (Chen et al., 2023; Yang K. et al., 2021). Conversely, large-scale ecological restoration programs, such as the Grain for Green Project, alongside optimized water resource allocation and intensified urban greening policies, significantly bolstered vegetation resilience against climatic stressors and anthropogenic disturbances (Weng, 2001). Collectively, these initiatives facilitated consistent NDVI improvements and ensured spatial equilibrium amidst increasing human activity intensity.
Mechanistically, the enhancement of NDVI reflects a pronounced “structural regulation” effect, which is primarily driven by strategic adjustments in land use, water resource allocation, and spatial development patterns. The processes of urbanization and industrialization have accelerated the expansion of central cities, particularly Zhengzhou, leading to the conversion of cropland into built-up areas and imposing structural constraints on vegetation cover. However, guided by the principles of ecological civilization, Henan Province has implemented large-scale afforestation programs, adopted advanced water-saving irrigation technologies (e.g., drip and sprinkler systems), and optimized water resource management structures. These initiatives have bolstered the adaptive capacity of both urban and agricultural systems to cope with drought and anthropogenic pressures, thereby contributing to positive NDVI responses. For instance, the stabilization of total water uses at 20.878 billion cubic meters in 2023, along with the transition toward more efficient agricultural water use (from 65.5% in 2000 to 56.8% in 2023), underscores the role of resource optimization in sustaining vegetation cover.
4.5 Limitations and future research directions
This study employed correlation analysis, feature importance analysis (SHAP), random forest models, and relevant mathematical statistical methods to analyze the spatiotemporal variation characteristics of NDVI in Henan Province from 2000 to 2020 and discussed the contributions of climatic and human driven factors which still present certain limitations. Firstly, the reliance on correlation analysis and feature importance analysis, while effective in identifying dominant factors, fails to fully unravel the feedback mechanisms between NDVI and various factors. Future research should adopt more advanced causal inference models, such as Structural Equation Modeling (SEM), to clarify these intricate relationships, thereby transcending attribution analysis and achieving a deeper mechanistic understanding. Secondly, this research should investigate the nonlinear responses and interactions between climate change and human activities more thoroughly. Future studies should focus on quantifying these interactive effects, utilizing machine learning and other nonlinear models to identify critical thresholds. Finally, addressing scale-dependent effects is crucial. The impacts of climate change and human activities on NDVI dynamics may vary significantly across different spatial and temporal scales. Future studies should adopt multi-scale analytical frameworks (geowarranted regression or wavelet analysis) to explicitly examine how the strength and direction of drivers vary with scale, thereby providing spatially precise insights for developing more targeted policies.
5 Conclusion
This study systematically investigated the spatiotemporal dynamics of the Normalized Difference Vegetation Index (NDVI) in Henan Province from 2000 to 2020 and quantified the contributions of its driving factors. Our findings reveal a significant and robust greening trend across the province, with an average annual NDVI increase of 0.0049. Spatially, vegetation cover exhibited significant heterogeneity, forming a distinct pattern of high NDVI values in the mountainous regions of the southwest (Funiu and Tongbai Mountains) and lower values in the highly urbanized Central Plains urban agglomeration, particularly around the Zhengzhou metropolitan area.
More importantly, our quantitative attribution analysis demonstrates that human activities were the dominant force shaping this vegetation trajectory, contributing to 92.6% of the observed NDVI variance. Specifically, the SHAP model results elucidated the nuanced impacts of different land cover types: the expansion of Grassland consistently exerted a positive influence on NDVI, whereas Barren land and Water bodies showed strong, monotonic negative effects. These results suggest that while rapid urbanization imposed significant pressure on regional ecosystems, its negative impacts were effectively counteracted and outweighed by large-scale ecological engineering initiatives. Policies promoting afforestation, grassland restoration, efficient water resource management, and urban green infrastructure have been pivotal in enhancing vegetation cover and overall ecological quality.
Data availability statement
The datasets presented in this study can be found in online repositories. The names of the repository/repositories and accession number(s) can be found in the article/supplementary material.
Author contributions
PH: Writing – review and editing, Methodology, Formal Analysis, Validation, Writing – original draft, Investigation, Software, Conceptualization. YW: Investigation, Resources, Writing – original draft. SQ: Writing – original draft, Resources, Investigation. JW: Visualization, Writing – original draft, Software, Investigation. SL: Investigation, Resources, Writing – review and editing. HW: Methodology, Formal Analysis, Writing – review and editing, Investigation. SY: Investigation, Writing – review and editing, Resources. JD: Formal Analysis, Data curation, Writing – review and editing, Software, Funding acquisition, Supervision, Writing – original draft, Conceptualization.
Funding
The author(s) declare that financial support was received for the research and/or publication of this article. This work was supported by the Innovation Team Project of Henan Academy of Sciences (Project No. 20230107), Joint Fund of Henan Province Science and Technology R&D Program (225200810057, 235200810024) and the National Natural Science Foundation of China (4230144).
Conflict of interest
The authors declare that the research was conducted in the absence of any commercial or financial relationships that could be construed as a potential conflict of interest.
Generative AI statement
The author(s) declare that no Generative AI was used in the creation of this manuscript.
Any alternative text (alt text) provided alongside figures in this article has been generated by Frontiers with the support of artificial intelligence and reasonable efforts have been made to ensure accuracy, including review by the authors wherever possible. If you identify any issues, please contact us.
Publisher’s note
All claims expressed in this article are solely those of the authors and do not necessarily represent those of their affiliated organizations, or those of the publisher, the editors and the reviewers. Any product that may be evaluated in this article, or claim that may be made by its manufacturer, is not guaranteed or endorsed by the publisher.
References
Benesty, J., Chen, J., Huang, Y., and Cohen, I. (2009). “Pearson correlation coefficient,” in Noise reduction in speech processing (Berlin, Heidelberg: Springer), 1–4.
Chen, X., Yu, L., Du, Z., Xu, Y., Zhao, J., Zhao, H., et al. (2022). Distribution of ecological restoration projects associated with land use and land cover change in China and their ecological impacts. Sci. Total Environ. 825, 153938. doi:10.1016/j.scitotenv.2022.153938
Chen, S., Wang, X., and Yao, S. (2023). National water-saving city and its impact on agricultural total factor productivity: a case study of nine provinces along the yellow river, China. J. Clean. Prod. 417, 138019. doi:10.1016/j.jclepro.2023.138019
Chen, W., Gu, T., Xiang, J., Luo, T., Zeng, J., and Yuan, Y. (2024). Ecological restoration zoning of territorial space in China: an ecosystem health perspective. J. Environ. Manag. 364, 121371. doi:10.1016/j.jenvman.2024.121371
Chu, H., Venevsky, S., Wu, C., and Wang, M. (2019). NDVI-Based vegetation dynamics and its response to climate changes at Amur-Heilongjiang river basin from 1982 to 2015. Sci. Total Environ. 650, 2051–2062. doi:10.1016/j.scitotenv.2018.09.115
Detsch, F., Otte, I., Appelhans, T., Hemp, A., and Nauss, T. (2016). Seasonal and long-term vegetation dynamics from 1-km GIMMS-Based NDVI time series at mt. Kilimanjaro, Tanzania. Remote Sens. Environ. 178, 70–83. doi:10.1016/j.rse.2016.03.007
Duan, R., Huang, G., Zhou, X., Lu, C., and Tian, C. (2023). Record-breaking heavy rainfall around Henan Province in 2021 and future projection of extreme conditions under climate change. J. Hydrology 625, 130102. doi:10.1016/j.jhydrol.2023.130102
Duo, A., Zhao, W., Qu, X., Jing, R., and Xiong, K. (2016). Spatio-temporal variation of vegetation coverage and its response to climate change in north China Plain in the last 33 years. Int. J. Appl. Earth Observation Geoinformation 53, 103–117. doi:10.1016/j.jag.2016.08.008
Fensholt, R., Rasmussen, K., Nielsen, T. T., and Mbow, C. (2009). Evaluation of Earth observation based long term vegetation trends—Intercomparing NDVI time series trend analysis consistency of Sahel from AVHRR GIMMS, terra MODIS and SPOT VGT data. Remote Sens. Environ. 113 (9), 1886–1898. doi:10.1016/j.rse.2009.04.004
Guo, S., Wu, C., Wang, Y., Qiu, G., Zhu, D., Niu, Q., et al. (2022). Threshold effect of ecosystem services in response to climate change, human activity and landscape pattern in the upper and middle yellow river of China. Ecol. Indic. 136, 108603. doi:10.1016/j.ecolind.2022.108603
He, P., Xu, L., Liu, Z., Jing, Y., and Zhu, W. (2021). Dynamics of NDVI and its influencing factors in the Chinese loess Plateau during 2002–2018. Reg. Sustain. 2 (1), 36–46. doi:10.1016/j.regsus.2021.01.002
Huang, S., Zheng, X., Ma, L., Wang, H., Huang, Q., Leng, G., et al. (2020). Quantitative contribution of climate change and human activities to vegetation cover variations based on GA-SVM model. J. Hydrology 584, 124687. doi:10.1016/j.jhydrol.2020.124687
Jia, X., Han, H., Feng, Y., Song, P., He, R., Liu, Y., et al. (2023). Scale-dependent and driving relationships between spatial features and carbon storage and sequestration in an urban park of zhengzhou, China. Sci. Total Environ. 894, 164916. doi:10.1016/j.scitotenv.2023.164916
Jian, S., Zhang, Q., and Wang, H. (2022). Spatial–temporal trends in and attribution analysis of vegetation change in the yellow river basin, China. Remote Sens. 14 (18), 4607. doi:10.3390/rs14184607
Jin, H., Chen, X., Wang, Y., Zhong, R., Zhao, T., Liu, Z., et al. (2021). Spatio-temporal distribution of NDVI and its influencing factors in China. J. Hydrology 603, 127129. doi:10.1016/j.jhydrol.2021.127129
Li, M., Cao, S., Zhu, Z., Wang, Z., Myneni, R. B., and Piao, S. (2023). Spatiotemporally consistent global dataset of the GIMMS normalized difference vegetation index (PKU GIMMS NDVI) from 1982 to 2022. Earth system science data. Earth Syst. Sci. Data 15 (9), 4181–4203. doi:10.5194/essd-15-4181-2023
Liu, Y., and Lei, H. (2015). Responses of natural vegetation dynamics to climate drivers in China from 1982 to 2011. Remote Sens. 7 (8), 10243–10268. doi:10.3390/rs70810243
Liu, Y., Jing, W., Wang, Q., and Xia, X. (2020). Generating high-resolution daily soil moisture by using spatial downscaling techniques: a comparison of six machine learning algorithms. Adv. Water Resour. 141, 103601. doi:10.1016/j.advwatres.2020.103601
Liu, Y., Liu, H., Chen, Y., Gang, C., and Shen, Y. (2022). Quantifying the contributions of climate change and human activities to vegetation dynamic in China based on multiple indices. Sci. Total Environ. 838, 156553. doi:10.1016/j.scitotenv.2022.156553
Lunetta, R. S., Knight, J. F., Ediriwickrema, J., Lyon, J. G., and Worthy, L. D. (2022). In Geospatial information handbook for water resources and watershed management (Boca Raton, FL, United States: CRC Press), Vol. 2, 65–88.
Martínez, B., and Gilabert, M. A. (2009). Vegetation dynamics from NDVI time series analysis using the wavelet transform. Remote Sens. Environ. 113 (9), 1823–1842. doi:10.1016/j.rse.2009.04.016
Mu, H. W., Li, X., Wen, Y. N., Huang, J. X., Du, P. J., Su, W., et al. (2022). A global record of annual terrestrial human footprint dataset from 2000 to 2018. Sci. Data 9, 176. doi:10.1038/s41597-022-01284-8
Peng, W., Kuang, T., and Tao, S. (2019). Quantifying influences of natural factors on vegetation NDVI changes based on geographical detector in sichuan, Western China. J. Clean. Prod. 233, 353–367. doi:10.1016/j.jclepro.2019.05.355
Pesaresi, S., Mancini, A., Quattrini, G., and Casavecchia, S. (2020). Mapping mediterranean forest plant associations and habitats with functional principal component analysis using landsat 8 NDVI time series. Remote Sens. 12 (7), 1132. doi:10.3390/rs12071132
Piao, S., Fang, J., Liu, H., and Zhu, B. (2005). NDVI-indicated decline in desertification in China in the past two decades. Geophys. Res. Lett. 32 (6). doi:10.1029/2004gl021764
Piao, S., Mohammat, A., Fang, J., Cai, Q., and Feng, J. (2006). NDVI-Based increase in growth of temperate grasslands and its responses to climate changes in China. Glob. Environ. Change 16 (4), 340–348. doi:10.1016/j.gloenvcha.2006.02.002
Prăvălie, R., Sirodoev, I., Nita, I. A., Patriche, C., Dumitraşcu, M., Roşca, B., et al. (2022). NDVI-Based ecological dynamics of forest vegetation and its relationship to climate change in Romania during 1987–2018. Ecol. Indic. 136, 108629. doi:10.1016/j.ecolind.2022.108629
Qin, G., Wang, N., Wu, Y., Zhang, Z., Meng, Z., and Zhang, Y. (2024). Spatiotemporal variations in eco-environmental quality and responses to drought and human activities in the middle reaches of the yellow river basin, China from 1990 to 2022. Ecol. Inf. 81, 102641. doi:10.1016/j.ecoinf.2024.102641
Ren, Z., Tian, Z., Wei, H., Liu, Y., and Yu, Y. (2022). Spatiotemporal evolution and driving mechanisms of vegetation in the yellow river basin, China during 2000–2020. Ecol. Indic. 138, 108832. doi:10.1016/j.ecolind.2022.108832
Satti, Z., Naveed, M., Shafeeque, M., and Li, L. (2024). Investigating the impact of climate change on trend shifts of vegetation growth in gilgit baltistan. Glob. Planet. Change 232, 104341. doi:10.1016/j.gloplacha.2023.104341
Shen, M., Piao, S., Jeong, S. J., Zhou, L., Zeng, Z., Ciais, P., et al. (2015). Evaporative cooling over the Tibetan Plateau induced by vegetation growth. Proc. Natl. Acad. Sci. 112 (30), 9299–9304. doi:10.1073/pnas.1504418112
Shen, M., Zhang, G., Cong, N., Wang, S., Kong, W., and Piao, S. (2016). Increasing altitudinal gradient of spring vegetation phenology during the last decade on the Qinghai–Tibetan Plateau. Agric. For. Meteorology 222, 226–231. doi:10.1016/j.agrformet.2014.01.003
Shrestha, N., Kolarik, N. E., and Brandt, J. S. (2024). Mesic vegetation persistence: a new approach for monitoring spatial and temporal changes in water availability in dryland regions using cloud computing and the sentinel and landsat constellations. Sci. Total Environ. 917, 170491. doi:10.1016/j.scitotenv.2024.170491
Tian, F., Fensholt, R., Verbesselt, J., Grogan, K., Horion, S., and Wang, Y. (2015). Evaluating temporal consistency of long-term global NDVI datasets for trend analysis. Remote Sens. Environ. 163, 326–340. doi:10.1016/j.rse.2015.03.031
van Leeuwen, W. J., Huete, A. R., and Laing, T. W. (1999). MODIS vegetation index compositing approach: a prototype with AVHRR data. Remote Sens. Environ. 69 (3), 264–280. doi:10.1016/s0034-4257(99)00022-x
Wei, H., Xue, D., Huang, J., Liu, M., and Li, L. (2022). Identification of coupling relationship between ecosystem services and urbanization for supporting ecological management: a case study on areas along the yellow river of Henan Province. Remote Sens. 14 (9), 2277. doi:10.3390/rs14092277
Wei, H., Wang, Y., Liu, J., Zhang, J., and Cao, Y. (2023). Coordinated development of cultivated land use and ecological protection in cities along the main stream of the yellow river in Henan Province, China. Ecol. Indic. 156, 111143. doi:10.1016/j.ecolind.2023.111143
Wen, Z., Wu, S., Chen, J., and Lü, M. (2017). NDVI indicated long-term interannual changes in vegetation activities and their responses to climatic and anthropogenic factors in the three gorges reservoir region, China. Sci. Total Environ. 574, 947–959. doi:10.1016/j.scitotenv.2016.09.049
Weng, Q. (2001). A remote sensing? GIS evaluation of urban expansion and its impact on surface temperature in the zhujiang Delta, China. Int. J. Remote Sens. 22 (10), 1999–2014. doi:10.1080/01431160152043676
Xiao, J., Qiao, J., Han, D., Ma, Y., Zhu, Q., and Wang, W. (2024). Spatial distribution and transformation mechanism of specialized villages in typical agricultural areas: case study of Henan Province, China. Habitat Int. 146, 103034. doi:10.1016/j.habitatint.2024.103034
Yang, H., Xi, C., Zhao, X., Mao, P., Wang, Z., Shi, Y., et al. (2020). Measuring the urban land surface temperature variations under zhengzhou city expansion using landsat-like data. Remote Sens. 12 (5), 801. doi:10.3390/rs12050801
Yang, J., Dong, J., Xiangming, X., Dai, J., Wu, C., Xia, J., et al. (2019). Divergent shifts in peak photosynthesis timing of temperate and alpine grasslands in China. Remote Sens. Environ. 233, 111395. doi:10.1016/j.rse.2019.111395
Yang, L., Shen, F., Zhang, L., Cai, Y., Yi, F., and Zhou, C. (2021a). Quantifying influences of natural and anthropogenic factors on vegetation changes using structural equation modeling: a case study in Jiangsu Province, China. J. Clean. Prod. 280, 124330. doi:10.1016/j.jclepro.2020.124330
Yang, K., Sun, W., Luo, Y., and Zhao, L. (2021b). Impact of urban expansion on vegetation: the case of China (2000–2018). J. Environ. Manag. 291, 112598. doi:10.1016/j.jenvman.2021.112598
Yang, Y., Song, F., Ma, J., Wei, Z., Song, L., and Cao, W. (2022). Spatial and temporal variation of heat islands in the main urban area of zhengzhou under the two-way influence of urbanization and urban forestry. Plos one 17 (8), e0272626. doi:10.1371/journal.pone.0272626
Yin, L., Tao, F., Chen, Y., Liu, F., and Hu, J. (2021). Improving terrestrial evapotranspiration estimation across China during 2000–2018 with machine learning methods. J. Hydrology 600, 126538. doi:10.1016/j.jhydrol.2021.126538
Yue, S., Pilon, P., and Cavadias, G. (2002). Power of the mann–kendall and Spearman's rho tests for detecting monotonic trends in hydrological series. J. Hydrology 259 (1-4), 254–271. doi:10.1016/s0022-1694(01)00594-7
Zhang, L., Wang, F., Song, H., Zhang, T., Wang, D., Xia, H., et al. (2022a). Effects of projected climate change on winter wheat yield in Henan, China. J. Clean. Prod. 379, 134734. doi:10.1016/j.jclepro.2022.134734
Zhang, Y., Jiang, X., Lei, Y., and Gao, S. (2022b). The contributions of natural and anthropogenic factors to NDVI variations on the loess Plateau in China during 2000–2020. Ecol. Indic. 143, 109342. doi:10.1016/j.ecolind.2022.109342
Zhao, Y., Zhang, X., Wu, Q., Huang, J., Ling, F., and Wang, L. (2024). Characteristics of spatial and temporal changes in ecosystem service value and threshold effect in Henan along the yellow river, China. Ecol. Indic. 166, 112531. doi:10.1016/j.ecolind.2024.112531
Zheng, Y., Han, J., Huang, Y., Fassnacht, S. R., Xie, S., Lv, E., et al. (2018). Vegetation response to climate conditions based on NDVI simulations using stepwise cluster analysis for the three-river headwaters region of China. Ecol. Indic. 92, 18–29. doi:10.1016/j.ecolind.2017.06.040
Zhu, W., and Li, S. (2017). The dynamic response of forest vegetation to hydrothermal conditions in the funiu Mountains of Western Henan Province. J. Geogr. Sci. 27, 565–578. doi:10.1007/s11442-017-1393-5
Keywords: NDVI, climate change, human activities, spatiotemporal variation, henan province
Citation: Hou P, Wang Y, Qiu S, Wang J, Li S, Wang H, Yin S and Du J (2025) Impacts of climate change and human activities on vegetation NDVI changes in henan province from 2000 to 2020. Front. Environ. Sci. 13:1682187. doi: 10.3389/fenvs.2025.1682187
Received: 08 August 2025; Accepted: 23 September 2025;
Published: 02 October 2025.
Edited by:
Pedro Cabral, Nanjing University of Information Science and Technology, ChinaReviewed by:
Xiangjin Shen, Chinese Academy of Sciences (CAS), ChinaIsaac Kipkemoi, University of Embu, Kenya
Copyright © 2025 Hou, Wang, Qiu, Wang, Li, Wang, Yin and Du. This is an open-access article distributed under the terms of the Creative Commons Attribution License (CC BY). The use, distribution or reproduction in other forums is permitted, provided the original author(s) and the copyright owner(s) are credited and that the original publication in this journal is cited, in accordance with accepted academic practice. No use, distribution or reproduction is permitted which does not comply with these terms.
*Correspondence: Jun Du, ZHVqdW5AaWdzLWhhcy5jbg==