 Nicole Reynolds
 Bernardo Mota
- National Physical Laboratory, London, United Kingdom
This paper presents a literature review of satellite remote sensing approaches for monitoring northern peatland condition indicators. First, a set of key climate regulation indicators related to hydrology, vegetation, and terrain changes is identified and evidenced. Second, satellite remote sensing methods to measure and monitor each indicator are summarized and assessed. Finally, recommendations on the utility of open-access satellite data to monitor peatland condition indicators of northern peatlands in an operational context are provided. Results of this study demonstrate that a combination of data from both radar and optical satellites, reinforced by robust ground and aerial measurements for calibration and validation, is able to track temporal and spatial changes of the key indicators. Operational monitoring of peatland condition and change resulting from restoration activities can underpin carbon crediting mechanisms. Satellite data enables systematic, national-scale monitoring of peatland restoration over extended timeframes. However, challenges such as obtaining cloud-free optical imagery remain. Future satellite missions will allow for further development of remote sensing methods to improve peatland condition monitoring.
1 Introduction
Peatlands are wetland ecosystems that form due to long-term accumulation of partially decomposed organic material under waterlogged conditions. They are highly diverse and are globally distributed across various climates and landscapes, supporting a rich variety of plant species and distinct vegetation community compositions (Bonn et al., 2016). Peatlands can generally be classified as northern or tropical. This paper focuses on northern peatlands, which are found in temperate, boreal, and subarctic climates, and are primarily dominated by mosses, sedges, and shrubs (UNEP, 2022). Pristine peatlands provide key ecosystem services, including supporting unique biodiversity (Bonn et al., 2016), water regulation, and climate control (Kimmel and Mander, 2010). Although peatlands only cover approximately 3% (4 million km2) of Earth’s land (Xu et al., 2018), it is estimated they store up to 30% of global terrestrial carbon, twice as much as the world’s forests (Yu et al., 2010; UNEP, 2022). Active (i.e., peat-forming) pristine peatlands serve as long-term carbon stores and net annual carbon sinks (Yu, 2012). However, anthropogenic activities like drainage, grazing, and forestry have degraded many peatlands globally, threatening their carbon stores and potentially turning them into net carbon sources (Leifeld and Menichetti, 2018; Regan et al., 2020). An estimated 500,000 km2 of drained peatlands worldwide release up to 2 Gt CO2 y-1 (Joosten, 2010). Therefore, protecting healthy peatlands and restoring degraded areas are crucial priorities for meeting global biodiversity and climate change mitigation targets (Bain et al., 2011).
Peatlands cover about 12% of the United Kingdom's (UK) land, around 30,000 km2 (3 million hectares) (Bain et al., 2011) – with approximately 80% considered degraded (Evans et al., 2017). Peatland degradation in the UK is driven by land use pressures and historic attempts to make peatlands profitable. Activities like cattle grazing, controlled burning to promote heather growth for grouse shooting, urbanization, and recreational activities (through trampling) harm peat-forming vegetation and escalate drainage (Lunt et al., 2010; Regan et al., 2020). In the late 20th century, driven by government tax incentives, commercial afforestation led to the draining and planting of around 9% of the UK’s deep peat bogs. This practice ended with the abolishment of the incentives in 1988 (Sloan et al., 2018). Additionally, atmospheric pollution and fertilizer runoff from nearby farms have also contributed to peatland degradation (JNCC, 2011). Peat is extracted in the UK for horticulture and fuel, destroying the ecosystem (Joosten and Clarke, 2002). This has prompted a phase-out plan banning peat in retail gardening products by the end of 2025 to significantly reduce peat extraction (Holmes and Bain, 2021).
Degraded peatlands systematically release stored carbon into the atmosphere; preventing this is a major motivation for peatland restoration (Lunt et al., 2010). In line with this, the International Union for Conservation of Nature’s (IUCN) UK Peatland Strategy 2018–2040 aims to have 2 million hectares of peatland in good condition, under restoration, or sustainably managed by 2040 (IUCN, 2018). To support this goal, numerous projects across the United Kingdom are actively conducting, funding, and advising on peatland restoration. One example is the Nature for Climate Peatland Grant Scheme, a government-funded program on track to restore 35,000 ha of peatland by the end of 2025 (Field et al., 2024). There are also voluntary nature market schemes, such as the United Kingdom Peatland Code launched in 2015, and schemes funded by other organizations, such as the Moors for the Future Partnership, founded by the Heritage Lottery Fund in 2003, which support private and public peatland restoration projects. These schemes operate independently, led by different organizations with varied goals, funding sources, and regional priorities. Some focus primarily on climate change mitigation by maximizing carbon sequestration, while others prioritize biodiversity or water quality. Restoration techniques also differ based on the project goals, ranging from rewetting and reintroducing Sphagnum moss, to blocking drainage ditches or managing vegetation through grazing or controlled burning. As a result, differences in scale, monitoring techniques, restoration criteria, and reporting standards make it difficult to directly compare their outcomes and assess the collective impact at a national level.
This variability becomes particularly important in the context of peatland carbon credits, which monetize the climate benefits of peatland restoration by selling credits based on emissions reductions (abatement units), not future carbon sequestration. The carbon credit payment amount is calculated by estimating how much carbon would have been released over a period if the area had not been restored (Moxey et al., 2021; Tribe et al., 2022). Validation of project outcomes prior to carbon credit payout is essential to ensure credibility. The IUCN’s Peatland Code is a voluntary standard offering a standardized, independently validated method for quantifying emission reductions to provide buyers and stakeholders with assurance on the carbon credits they purchase (IUCN, 2023). There are eligibility criteria for projects, such as minimum peat depth and proof that no new drainage or vegetation removal has occurred since November 2015, to prevent intentional degradation. Carbon credit payments to the sellers (usually the landowners) depend on the initial peatland condition, project area, and management duration (minimum 30 years), being proportional to projected emissions reductions (IUCN, 2023). It is important to note that, regardless of project duration, payments are made only once and do not account for ongoing maintenance activities.
While the Code provides a credible foundation for validating carbon credits, the current monitoring approach detailed by the IUCN’s Field Protocol (IUCN, 2017) exhibits significant limitations. Primarily based on manual field surveys, it is resource-intensive and limits spatial and temporal data collection. Additionally, broad condition categories may fail to capture the nuanced progress of peatland recovery. A robust monitoring framework must be established to continually evaluate the impact of restoration activities and underpin carbon credits, also allowing for accurate reporting of greenhouse gas (GHG) sources and sinks. To be effective, such a framework would need to rely on systematic, long-term measurements of key peatland condition indicators. Remote sensing satellites provide substantial advantages over traditional monitoring methods, offering wide coverage of remote and inaccessible areas, delivering consistent and objective data over time, enabling timely detection of changes in peatland condition, and doing so in a cost-effective manner–thereby improving monitoring efficiency and supporting adaptive management. Because of this, there is a growing trend of using remote sensing satellites to monitor aspects of peatland condition (Guo et al., 2017; Czapiewski and Szumińska, 2021), which will only accelerate with continuing advances in satellite data availability and technology. This paper identifies a set of key indicators of peatland condition that are relevant for such a monitoring framework and presents a comprehensive review and synthesis of the feasibility of currently available open-access remote sensing satellites to measure and monitor these indicators operationally.
1.1 Literature review method
This literature review analyses, compares, and assesses currently available satellite remote sensing data for their utility in monitoring peatland condition indicators. It is distinguished from previous reviews (Guo et al., 2017; Lees et al., 2018; Minasny et al., 2019; 2023; Czapiewski and Szumińska, 2021; Dronova et al., 2021; Mirmazloumi et al., 2021; Abdelmajeed et al., 2023; Abdelmajeed and Juszczak, 2024) in both approach and scope. It takes an indicator-based approach to assessing the utility of satellite measurements for monitoring peatland condition, specifically regarding condition change throughout restoration activities. It encompasses peer-reviewed articles published between 1 January 2009 and 1 June 2024 to capture recent developments following the launch of key open-access satellite missions, conducted over northern hemisphere peatlands or peatlands which are comparable (in vegetation or characteristics) to those found in the United Kingdom. This review focuses on non-commercial remote sensing satellite missions, as their open-access data is freely available, regularly updated, and globally consistent–crucial for developing a scalable, cost-effective, and reliable national peatland monitoring framework.
2 Peatland condition
2.1 Peatland condition indicators
Throughout this paper, the term indicator is used to refer to a measurable variable that reflects or represents a specific aspect of peatland condition. In this context a metric that can be used to designate the condition of a peatland. Existing research identifies the usefulness of indicators as proxies for peatland “condition” or “health” (Lees et al., 2018; Artz et al., 2023). There is no clear consensus on these terms as they vary according to the functional definition of condition, such as biodiversity, climate regulation, and water regulation. This paper focuses on climate regulation and thus defines condition indicators as factors influencing carbon loss, accumulation, and storage in peatlands. Together, these indicators help classify peatland condition along a continuum from fully degraded to near-natural, allowing for an improvement on the limiting condition categories currently used in the Peatland Code and in UK GHG emission inventories (Brown et al., 2023; IUCN, 2023). In accordance with the IUCN UK Peatland Strategy, this paper considers near-natural condition as the optimal state for United Kingdom peatlands and the most practical target for restoration projects (IUCN, 2018). NatureScot’s Peatland ACTION project (NatureScot, 2016), defines near-natural condition peatlands as having the following key features:
• Sphagnum dominated,
• Dominance of peat-forming moss and sedge species,
• No known fires (either prescribed or wild) within living memory,
• Evidence of grazing and trampling is rare or absent,
• Little or no bare peat surface,
• Heather (Calluna vulgaris) is not dominant,
• Pool systems may be present (areas of inundation on the site) in the wetter north and west of the UK,
• The surface will be undulating with Sphagnum hummocks and hollows.
Collectively, these features are used to identify and assess the condition of peatlands; hence, corresponding key peatland condition indicators can be defined.
The climate regulation indicators of peatland condition that need to be measured to determine restoration activity success can be grouped into three functional categories: 1) Hydrology: Water Table Depth and Soil Moisture; 2) Vegetation: Bare Peat, Vegetation Type, and Plant Health; 3) Terrain Changes: Surface Motion, Surface Degradation, and Fire Incidence.
2.2 Peatland restoration and condition monitoring
Ecological restoration is defined as “the process of assisting the recovery of an ecosystem that has been degraded, damaged, or destroyed” (SER, 2004). Restoration is a progressive and long-term process seeking to incrementally improve ecosystem condition over time. In peatlands, full recovery may take up to 20 years of sustained restoration management; however, improvements in condition often begin shortly after interventions are implemented (Lucchese et al., 2010; Lunt et al., 2010). Repeatable, regular, and automated monitoring enables tracking of these improvements throughout the restoration process. A variety of established techniques are used in peatland restoration, including drain and gully blocking, removal of woodland and scrub, revegetation with key peatland species such as Sphagnum, and cessation of burning practices (Lunt et al., 2010; Alderson et al., 2019). Despite these efforts, full recovery of biodiversity, hydrology, and peat soil structure is not always achievable (Loisel and Gallego-Sala, 2022). Factors such as land-use pressures, grazing, and agricultural run-off can limit the effectiveness of peatland restoration. To resolve land use conflicts, a catchment-based approach to the restoration of peatlands should be employed. The catchment approach manages land and water across the entire river catchment (and ownership boundaries) as a connected system. For peatlands, this means considering how their condition both affects and is influenced by wider processes such as water flow, erosion, land use, and biodiversity, leading to more effective and permanent outcomes and increased return on investment (Menberu et al., 2018).
National-scale attempts at classifying the condition of UK peatlands include a range of region-specific and UK-wide initiatives. In Scotland, NatureScot’s Peatland ACTION program uses a structured framework for assessing peatland condition, while England applies the Common Standards Monitoring approach alongside tools such as remote sensing. In Wales, the Phase 1 Habitat Survey provides baseline ecological data, which is used to inform peatland assessments. Additionally, the United Kingdom Government’s Sustainable Farming Incentive scheme includes specific guidance for assessing moorland condition, aiming to support consistent monitoring and restoration efforts. While not all moorland is peatland, many United Kingdom moorlands contain extensive areas of upland peat soils, making this guidance highly relevant to peatland monitoring and management. Despite regional methodological differences, these national-scale initiatives collectively contribute to a more harmonized, landscape-scale understanding of peatland health and restoration needs, reflecting a growing consensus on the importance of consistent condition classifications to guide restoration, inform land-use decisions, and support national climate change mitigation targets.
The IUCN’s Peatland Code Field Protocol (IUCN, 2017) provides a standardized method for assessing baseline peatland condition and tracking changes for carbon credit projects. Initially, aerial imagery (such as Google Earth) is used to create a map of assessment units and identify peatland features (e.g., drainage ditches, hagg/gully systems) as well as non-peatland features (e.g., rocks, forests, watercourses). This map is used to calculate the area of each assessment unit and as the basis for the initial and ongoing field surveys. Fixed monitoring plots are established at the baseline survey and revisited after 5 years, and every 10 years after that for the agreed duration of the project. Surveys assess key indicators such as vegetation composition (e.g., Sphagnum cover), peat surface condition (e.g., bare peat or erosion), and hydrological features (e.g., water table depth and pooling) through site visits. The site’s condition is then classified into one of seven condition categories, from near-natural to severely degraded, allowing for change monitoring and adaptive management. The protocol also highlights the use, where available, of georeferenced data and photographic records to ensure long-term consistency.
The Peatland Code currently relies on time and labor-intensive site visits to conduct surveys. Remote sensing is being pursued as part of the solution to the mapping and monitoring needs of restoration projects (JNCC, 2011; Trippier et al., 2020; Abdelmajeed and Juszczak, 2024). Sensors mounted on Uncrewed Aerial Vehicles (UAV) are becoming an increasingly popular data collection approach, ensuring cost-effective, widespread geographic coverage, especially in challenging and hard-to-access locations. Initiatives such as the Yorkshire Peat Partnership and Peatland ACTION have demonstrated the effectiveness of UAVs in mapping vegetation, hydrological features, and degradation indicators. Advances in UAV technology and lower costs now allow landowners, with basic training and regulatory awareness, to use UAVs for monitoring peatland condition. Aerial photographs can serve as evidence under the Peatland Code. NatureScot provides guidance on the use of optical and Light Detection and Ranging (LiDAR) UAVs for peatland monitoring, helping landowners and organizations effectively collect and use this data (NatureScot, 2022). A key limitation of UAVs for monitoring peatland condition is the restricted spatial and temporal coverage they can achieve.
In contrast, sensors mounted on crewed aircraft can capture high-resolution data over much larger areas in a single survey. Both LiDAR and optical monitoring have been successfully conducted using aircraft. Increasingly, national and regional programs rely on aerial photography and LiDAR data from aircraft to assess peatland extent, condition, and restoration outcomes. Organizations such as Bluesky International supply these datasets for large-scale initiatives, including projects funded under Peatland ACTION and the UK’s Nature for Climate Peatland Grant Scheme. Aerial LiDAR surveys are particularly valuable for producing digital terrain models, mapping terrain features (e.g., drainage ditches and hagg/gully systems), and detecting surface changes over time. Moreover, the Peatland Code encourages the use of aerial photography to define baseline conditions and support long-term verification. However, the high cost of aerial surveys remains a key barrier to their widespread use.
While aircraft provide broader coverage than UAVs, satellite-based remote sensing offers even greater spatial and temporal reach, making it an invaluable tool (Czapiewski and Szumińska, 2021; Abdelmajeed and Juszczak, 2024). Synthetic Aperture Radar (SAR) and optical remote sensing satellite data are both highlighted in this paper for their roles in supporting long-term, regular, and national-scale monitoring of peatlands. A key advantage of both data types is their ability to provide consistent, repeatable observations over large areas, which is essential for tracking gradual environmental changes. SAR is particularly beneficial due to its capacity to operate regardless of weather or illumination conditions, as it can penetrate cloud cover and collect data with every satellite overpass. This makes it especially valuable in persistently cloudy regions such as the United Kingdom, where optical data acquisition is often limited by cloud obscuration. Meanwhile optical sensors utility is reduced by frequent cloud cover, which can create significant gaps in time series data. Both commercial and open-access satellite systems are now widely used for peatland mapping and monitoring. Commercial satellites can offer higher spatial resolution data with more frequent revisit times, but the cost, licensing restrictions, and limited accessibility of this data can be prohibitive. Open-access satellite data enables frequent and consistent local-to-national-scale mapping without the cost and access restrictions of commercial sources, making it well-suited for integration into peatland monitoring efforts. The following sections outline the current capabilities of open-access remote sensing satellites for identifying and monitoring the peatland condition indicators discussed.
3 Hydrological indicators
Hydrological conditions have overriding control over the health, biogeochemical processes, and GHG exchanges of a peatland (Evans et al., 2021; Labadz et al., 2010). Shallow water table depth (WTD) (i.e., a high-water table) and saturated soils are a crucial characteristic of near-natural peatlands. The waterlogged conditions lead to the partial decomposition of organic material and drive the plant communities present, notably the cornerstone Sphagnum moss species, promoting peat formation and accumulation (JNCC, 2011). Many peatlands are in a degraded condition as they have been drained. The reinstatement of a high-water table and wet soil, a process known as rewetting, is often the first and most crucial stage of the restoration process (Lucchese et al., 2010; Andersen et al., 2017; Minayeva et al., 2017; Lees et al., 2019). Rewetting is often achieved by blocking the artificial drainage ditches (Section 5.2) (Holden et al., 2004). Monitoring the success of rewetting throughout the restoration process is crucial, as all subsequent steps depend on maintaining wet conditions, and ditch blocking can easily fail. Another hydrological characteristic that is indicative of peatland condition is the presence of pools or surface inundation (Holden et al., 2018). If peat becomes severely degraded and loses its natural absorbency, large-scale surface inundation can occur during periods of heavy or prolonged rainfall. In such cases, water collects on the surface and remains until the peat eventually dries out again, indicating a compromised hydrological function (Holden et al., 2018). While surface pools can also occur on near-natural peatlands, these are typically smaller in scale and more common in the wetter northern and western regions of the United Kingdom (NatureScot, 2016). The bulk of the literature monitoring peatland hydrology measures either water table depth or soil moisture; hence, these are the two hydrological indicators addressed in this review.
3.1 Water table depth
WTD is defined as the vertical distance between the soil surface and the top of the water table, commonly defined as the level at which the pore-water pressure equals atmospheric pressure (Baird and Low, 2022). Because peat has a high specific yield (the proportion of water that drains freely under gravity relative to its total volume), near-saturated conditions can occur above the water table within the capillary fringe (Price et al., 2002; Bourgault et al., 2017).
Near-natural peatlands have a more stable and shallow water table depth (Lees et al., 2021a), whereas degraded peatlands have, as a result of drainage, an increased WTD that can often be unstable. Deeper WTD increases the thickness of the aerated layer in the peatland, accelerating decomposition rates of vegetation, hence increasing CO2 emissions and preventing further peat accumulation (Tiemeyer et al., 2016). In situ methods measure the distance between bedrock and the top of the water table, i.e., not relative to the soil surface. This is commonly done using monitoring wells or dip-wells. These are point measurements which, while invaluable, cannot provide spatially explicit WTD information.
3.2 Soil moisture
Soil moisture refers to the percentage of water content in the unsaturated zone of the soil layers. WTD drives the soil moisture in the aerated/unsaturated peat layer through capillary action; therefore, a shallow WTD generally means high soil moisture (Dettmann and Bechtold, 2016). This makes these indicators intrinsically linked; hence, they can be used to estimate one another. High soil moisture is a characteristic of a near-natural peatland, whilst surface soils that are drier with lower soil moisture are an indicator of damage, likely as a consequence of drainage and vegetation loss, which drives further degradation (Dabrowska-Zielinska et al., 2018). Another visible sign that soils are too dry is large-scale surface water inundation (see above). Similarly to WTD, in situ methods to monitor soil moisture involve point measurements (with soil moisture sensors), which can also lead to unrepresentative estimates as a result of point measurement interpolation (Millard et al., 2018).
3.3 Satellite methods for monitoring hydrological indicators
A summary of satellite-based methods to monitor hydrological indicators of northern peatlands is presented in Table 1. In peatlands, soil moisture is tightly coupled with WTD, hence, soil moisture and WTD are used interchangeably throughout this section.
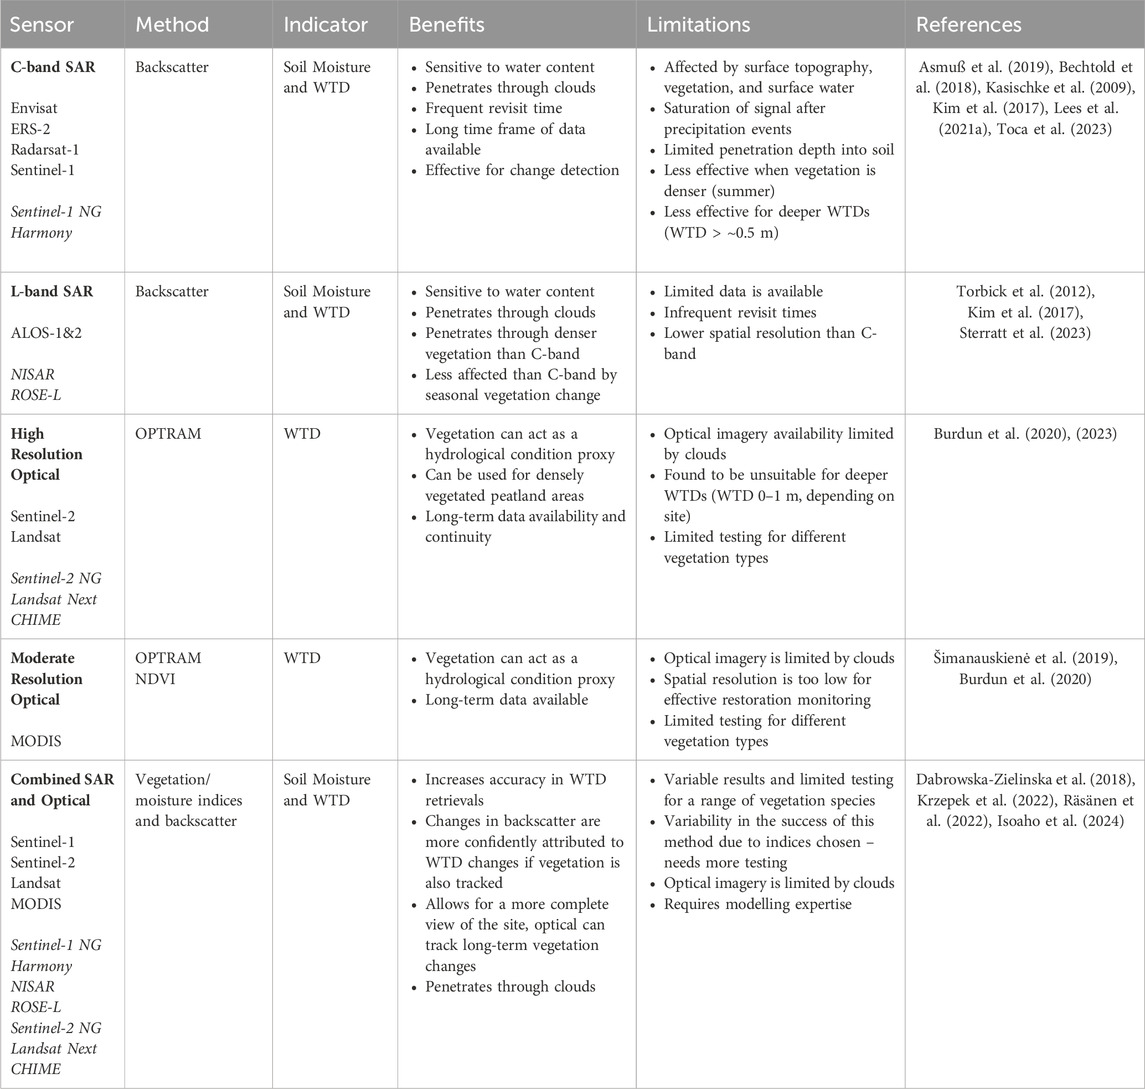
Table 1. Summary of satellite sensors and methods for remote sensing of hydrological indicators. Italics show future open-access sensors.
The most prevalent and promising method for monitoring the WTD of northern hemisphere peatlands is using SAR backscatter. Backscatter (σ0) is sensitive to the dielectric constant (permittivity) of the target, making it ideal to track the large differences between the dielectric constants of water and soil particles (Asmuß et al., 2019; Bechtold et al., 2018; Torbick et al., 2012). Water has a very high dielectric constant; therefore, wetter soil surfaces produce a stronger SAR response than drier soils (Millard et al., 2018). Both C-band and L-band SAR, as well as a combination of SAR and optical data, have shown potential to monitor the hydrological condition of peatlands (Torbick et al., 2012; Kim et al., 2017; Asmuß et al., 2019).
The European Space Agency’s (ESA) Sentinel-1 missions (1A launched in 2014 and 1B launched in 2016) have made C-band SAR data widely accessible. Building on previous C-band SAR missions like ESA’s ENVISAT-ASAR (ENVIironmental monitoring SATellite - Advanced Synthetic Aperture Radar, operational 1 March 2002 to 8 April 2012 with a 35-day repeat cycle, and a spatial resolution ∼30 m or ∼150 m, depending on imaging mode), ESA’s ERS-2 (European Remote-Sensing Satellite-2, operational 21 April 1995 to September 2011 with a 35-day repeat cycle, and a spatial resolution of ∼26 m), and Canada’s Radarsat-1 (operational 4 November 1995 to 29 March 2013 with a 24-day repeat cycle, and a spatial resolution ∼25 m), which provided data for the proof of concept for the approach, Sentinel-1 has significantly advanced the method. Its finer spatial resolution (approximately 5 × 5 m, 5 × 20 m, and 20 × 40 m depending on imaging mode), higher radiometric accuracy, and more frequent revisit time (6 days) have allowed for an enhanced usability of this method. However, there are a few issues that limit the application of SAR backscatter as a proxy for peatland hydrology. Rainfall events and surface water can significantly affect the backscatter signal. Further research is needed to explore and account for these effects to successfully monitor WTD (Kasischke et al., 2009; Lees et al., 2021a). Similarly, over forested, near-natural, and drained areas (with WTD deeper than ∼0.5 m), further information such as the type and abundance of vegetation present is required before any hydrological assessment can be conducted, as it can be unclear what is shaping the signal reaching the satellite sensor (Kim et al., 2017). Restoration of peatlands is a long, ongoing process, SAR has been shown to have many benefits for monitoring hydrology (Section 2.2). ESA’s current and future (Next-Generation or NG) Sentinel-1 missions, along with previous SAR missions and future generations, such as ESA’s Harmony A and B (Earth Explorer 10A and 10B) planned for launch in 2029, will provide abundant SAR data over the required decades-long timescales.
L-band SAR backscatter data, collected from the PALSAR (Phased Array L-band Synthetic Aperture Radar) instrument on board Japan Aerospace Exploration Agency (JAXA) ALOS (Advanced Land Observing Satellite) and ALOS-2 satellites, has also been used for monitoring peatland hydrology (Torbick et al., 2012; Kim et al., 2017; Sterratt et al., 2023). ALOS-1 was operational 24 January 2006 to 12 May 2011, had a 46-day repeat cycle, and a spatial resolution of 10 m–100 m depending on imaging mode, and ALOS-2 launched 24 May 2014 and is currently operational, it has a 14-day repeat cycle, and a spatial resolution of 3 m (in Ultrafine mode) to 100 m depending on imaging mode. L-band is currently less useful than C-band for monitoring peatland WTD dynamics; this is partly due to data availability (fewer operational satellites with open access data), but also due to the coarser spatial resolution (Aoki et al., 2021). L-band data is also affected by non-WTD characteristics such as surface roughness, topography, vegetation, and recent rainfall events (Sterratt et al., 2023). Without further study to determine and correct for these, L-band data has limited relevance for large-scale peatland WTD monitoring. To minimize the effects of topographical features on PALSAR backscatter, Torbick et al. (2012) integrated a Digital Elevation Model (DEM) derived by LiDAR to effectively map the hydrological characteristics of a Swedish mire; however, the lack of available high-resolution DEM data of UK peatland sites limits this method. L-band is still promising for long-term monitoring, as the backscatter signals generally maintain higher temporal coherence (i.e., higher consistency of radar signals across multiple acquisitions) than other SAR bands, especially when considering vegetated areas (Aoki et al., 2021).
The recently launched NISAR (NASA (National Aeronautics and Space Administration) - ISRO (Indian Space Research Organization) SAR) mission, which has a repeat cycle of 12 days and a spatial resolution of 3–48 m depending on imaging mode, and ESA’s ROSE-L (Radar Observing System for Europe in L-band) mission (planned to launch in 2028) will provide L-band data coverage over United Kingdom peatlands, giving the opportunity to further research its use for peatland WTD monitoring. NISAR will also have an S-band SAR instrument onboard, designed to penetrate through light vegetation, which may also have application for peatland hydrological monitoring. Pre-launch research on NISAR has demonstrated the feasibility of retrieving high-resolution soil moisture products at 200 m using a multi-scale algorithm (Lal et al., 2024; 2025). These studies also provide analytical approaches to quantify uncertainties from input data and algorithm parameters, reinforcing the robustness of the method. Such advances are highly relevant for peatland hydrology, where soil moisture dynamics are closely linked to WTD, and integrating these validated products into multi-sensor frameworks offers significant potential to improve monitoring across diverse conditions.
SAR data primarily responds to near-surface water content and the backscatter signal is governed by the dielectric contrast between water and dry matter. As established above in near-saturated conditions, fully saturated soils can occur above the water table due to strong capillary action and the high specific yield of peat soils. This can lead to inaccurate WTD measurements from SAR data as the backscatter may indicate the WTD is at the surface, when in fact the soils are fully saturated. This decoupling is a limitation of the ability of SAR to directly infer WTD, consequently, empirical models that link SAR backscatter to WTD can be dependent upon site, condition, and season.
Optical data has also been used to monitor peatland hydrological conditions using vegetation activity as a proxy. The OPTRAM (OPtical TRApezoid Model) method (Burdun et al., 2020; 2023) represents one of the few existing approaches utilizing Sentinel-2 multispectral data, but this approach has undergone limited testing. Sentinel-2A was launched on 23 June 2015, and Sentinel-2B was launched on 1 March 2017, the multispectral instrument onboard captures 13 spectral bands, with four bands at 10 m resolution, six bands at 20 m resolution, and three bands at 60 m resolution, and the mission has a 5-day repeat cycle. Papers using OPTRAM highlight hyperspectral data as a key area for future research, as its high spectral resolution enables the detection of vegetation responses to water stress through subtle changes pigment composition, water content, and other biochemical properties (Burdun et al., 2023). Šimanauskienė et al. (2019) found strong positive correlations between peatland WTD (measured in situ) and satellite-derived Normalized Difference Vegetation Index (NDVI), concluding that NDVI could be an appropriate indicator for peatland hydrology. However, the study was restricted to near-natural peatlands dominated by Sphagnum, leaving a gap in understanding how the method performs for degraded peatlands with altered vegetation and surface conditions.
Finally, a promising pathway for monitoring the hydrological condition of peatlands is the combination of optical and radar data. There is evidence that incorporating optical-based vegetation information can help limit some of the issues associated with vegetation structure impacting the SAR backscatter signal (Dabrowska-Zielinska et al., 2018; Krzepek et al., 2022; Räsänen et al., 2022; Isoaho et al., 2024). Dabrowska-Zielinska et al. (2018) looked at the effects of vegetation on backscatter, using NDVI derived from optical imagery. The authors demonstrated the relationship between NDVI and SAR backscatter indices, such as those derived from the difference in SAR polarization states (vertical transmit and horizontal receive vs. vertical transmit and vertical receive), under an extreme range of soil moisture conditions and different vegetation abundances. This allowed for improved soil moisture retrievals (10 vol% accuracy), showing the benefits of this combined approach. As for WTD, Isoaho et al. (2024) and Räsänen et al. (2022) successfully used optical satellite imagery and C-band SAR to track temporal changes. Krzepek et al. (2022) studied the correlation between WTD and the remote sensing data backscatter as well as Normalized Difference Water Index (NDWI), but found a wide range of correlations, both positive and negative, from moderate to low values. Overall, this multi-sensor approach needs to be extended to sites of different dominant vegetation types before widespread implementation.
4 Vegetation indicators
Peat is formed by the partial decay of plant material under waterlogged conditions; hence, for a peatland to be in good condition and accumulating peat, healthy peat-forming vegetation needs to be present. In addition, the type of vegetation present can also provide information on site characteristics. For example, Sphagnum mosses can only be present where the soil is wet enough to support it (Harris et al., 2006).
4.1 Bare peat
Bare peat, the exposed surface of peat soil where vegetation has been lost due to extraction, erosion, drying, or overgrazing, is a visual indicator of poor peatland condition (Trippier et al., 2020). Without vegetation, peat cannot accumulate and, because nothing is holding it in place, bare peat is not permanently fixed. This leaves it vulnerable to erosion, further degradation, and hence carbon loss (NatureScot, 2016; IUCN, 2017; Trippier et al., 2020). Near-natural peatland will have minimal bare peat, whereas an actively eroding peatland will be characterized by extensive areas of bare peat within hagg/gully systems (haggs are isolated mounds of vegetated peat between gullies) (NatureScot, 2016). For condition monitoring, in situ surveys rely on visual inspections of the area for the extent, location, and characteristics of bare peat. Within the IUCN’s Peatland Code Field Protocol (Section 2.2), areas of bare peat are recommended to be monitored through aerial photographs, which have limited acquisition abilities and can be very costly (IUCN, 2017). Bare peat areas can assume the form of interconnected small patches, larger expanses, and hagg/gully systems. During the restoration process, the initial stage is usually to prevent erosion and fix the bare peat in place by reintroducing vegetation. This is achieved by covering the area with cut heather “brash”, creating the necessary stable conditions to sow seeds of fast-growing grasses and dwarf shrubs. These create root systems that further fix the peat. Once stabilized, the cornerstone Sphagnum moss species are introduced. As restoration progresses, the bare peat area should decline; remote sensing has the potential to be an effective tool for monitoring this change over time.
A summary of satellite-based methods for monitoring of bare peat is presented in Table 2. Current satellite-based approaches to monitor bare peat are based on vegetation indices, mainly derived from Short-wave Infrared (SWIR) and Near Infrared (NIR) spectral information, to distinguish between the various vegetated classes. High spatial resolution satellites such as Landsat (30 m) and Sentinel-2 (10 m) are suitable for bare peat mapping, using NDVI to differentiate between bare and vegetated areas (Torabi Haghighi et al., 2018; Sirin et al., 2020), Landsat is the longest running earth observation satellite program with the first satellite being launched 23 July 1972 and Landsat 8 and 9 still currently operational. Difficulties arise when discriminating between bare peat and burned peat areas, but can be mitigated with knowledge of fire occurrences (Sirin et al., 2020). Sentinel-2 is suitable for ongoing bare peat monitoring, with the added benefit of the long mission timeline, extending into the 2030s with the Sentinel-2 NG, further supporting the long-term tracking aligned with peatland restoration efforts. It is worth noting the Joint Nature Conservation Committee (JNCC) report by Trippier et al. (2020), who present a framework for mapping bare peat using a range of remote sensing data. The authors used aerial photography and very high-resolution commercial optical data from Pleiades-1 (2 m spatial resolution) to identify spectral differences between vegetated and non-vegetated peat. Thresholds derived from this analysis were then applied to 10 m Sentinel-2 data, enabling the upscaling of the classification to produce high-resolution national bare peat maps.
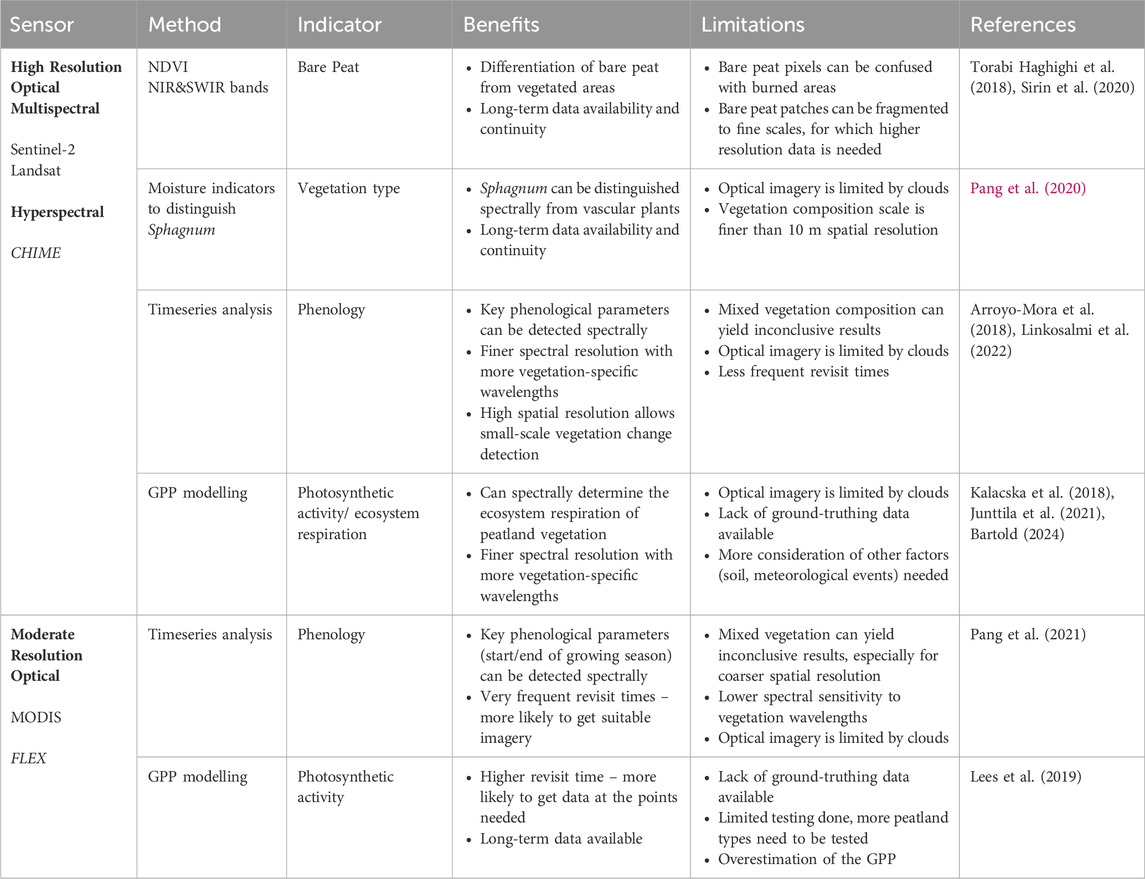
Table 2. Summary of satellite sensors and methods for remote sensing of vegetation indicators.
4.2 Vegetation
Peat formation requires both waterlogged conditions and the presence of peat-forming vegetation, primarily Sphagnum moss and some sedges such as cotton grass. Sphagnum is a cornerstone species, responsible for most of the carbon accumulation and for maintaining the wet, acidic conditions of near-natural peatlands (Lindsay, 2010; Laine et al., 2021). It relies on high WTD to survive and is extremely sensitive to changes in the water table, as it gets water through capillary action (Harris et al., 2006; Lees et al., 2020; Stuart et al., 2022). Therefore, Sphagnum mosses are important indicators of peatland surface and near-surface moisture variation. In situ methods for determining plant communities involve habitat surveys using classifications such as the JNCC National Vegetation Classification (Rodwell, 2006), which are time-consuming and impractical to achieve on a national scale.
The identification of plant communities, diversity, and abundances can be used to assess peatland condition. The presence of tree species such as birch and pine, heather (C. vulgaris) or rhododendron, and purple moor grass (Molinia caerulea) indicates that conditions on the site are too dry to be considered healthy (Bonnett et al., 2009). Near-natural peatlands will be dominated by Sphagnum in hummock and hollow formations with little heather, whereas degraded peatlands will have extensive heather or purple moor grass (NatureScot, 2016). Vegetation will change in many ways throughout the restoration process, and it is dependent on the starting condition of the area. For example, plant communities like heather and grasses used for the fixation of bare peat are a necessary first step in the initial phase of the restoration, but are not indicative of a healthy peatland. Once the peat is fixed, gradual revegetation with Sphagnum moss communities and removal of heather can take place.
Further to this, information on plant health provides vital information on a site’s ecological function. Plant health can be inferred through monitoring the phenology (seasonality) or above-ground Gross Primary Productivity (GPP) of the vegetation. GPP can be used to estimate the rate of peat and carbon accumulation and associated GHG fluxes (Frolking et al., 1998; Junttila et al., 2021), whilst phenology monitoring is important to characterize the “active” phase period (when plants grow and sequester carbon), and may also aid in identifying which plant types are present.
A summary of satellite-based methods for monitoring of peatland vegetation is presented in Table 2. There are limited studies that specifically look at discriminating between different vegetation types over peatlands using open-source satellite data. Pang et al. (2020) utilized Sentinel-2 data to successfully identify Sphagnum in a peatland in China. This was achieved using the high-water content of the moss, which aids in distinguishing it from other plants in the NIR and SWIR regions of the reflectance spectrum, particularly in the water absorption bands at 980 nm and 1,150 nm. Whilst no other vegetation species are specifically mentioned, vascular plants are named, so it is likely that this method would enable discrimination between Sphagnum and heather and purple-moor grass. Pang et al. (2020) noted that further testing of the method is needed and recommended using sensors with greater infrared capability, such as Sentinel-2. They also suggested relying on vegetation indices that incorporate NIR and SWIR bands, such as the Moisture Stress Index (MSI) and the Normalized Difference Infrared Index (NDII), to improve detection accuracy.
This aligns with findings from other studies showing strong potential for hyperspectral data to distinguish between vegetation categories, though, to date, this has only been demonstrated using in situ measurements, UAV-based sensors, or airborne platforms (Cole et al., 2014a; Erudel et al., 2017; McPartland et al., 2019). Both Agenzia Spaziale Italiana's (ASI) PRISMA (PRecursore IperSpettrale della Missione Applicativa) launched on 22 March 2019, and Germany’s EnMAP (Environmental Mapping and Analysis Program), launched 1 April 2022, satellites offer hyperspectral data at a 30 m spatial resolution, making them suitable for exploring peatland vegetation monitoring, however, as they operate with a tasking acquisition model, meaning they collect data only when specifically requested to observe a given area, the data availability is restricted. For peatland applications, spectral resolution is more critical than spatial resolution, as identifying key vegetation groups, such as Sphagnum species, sedges, and shrubs, requires narrowband spectral detail, particularly in the visible to shortwave infrared range. While higher spatial resolution aids in detecting fine-scale features, hyperspectral data provide greater diagnostic power for vegetation species classification. Therefore, despite their coarser spatial resolution, PRISMA and EnMAP are generally preferable to multispectral sensors like Sentinel-2’s multispectral imager when the aim is to monitor vegetation composition or functional change. The limited, on-demand coverage has constrained their current use in peatland research. ESA’s CHIME (Copernicus Hyperspectral Imaging Mission for the Environment) mission is a notable upcoming (planned launch 2028) hyperspectral satellite for this application. CHIME will have a spatial resolution of 30 m and over 200 spectral bands in the wavelength range 400–2,500 nm, making it suitable for discrimination of vegetation types and other vegetation health indicators.
An understanding of how vegetation spectral responses vary throughout the phenological cycle is imperative to be able to interpret remotely sensed data correctly (Cole et al., 2014b), not only as a direct indicator of plant health, but also to disentangle effects such as attenuation of SAR backscatter in vegetation (Section 3.3) from the condition change associated with restoration (Cole et al., 2014b). Phenology has been shown to be able to be monitored using high and medium-spatial resolution satellites (Sentinel-2, NASA and the United States Geological Survey's Landsat, and NASA’s MODIS (Moderate Resolution Imaging Spectroradiometer)); however, there are unavoidable limitations (Section 2.2). Pang et al. (2021) used the moderate resolution MODIS, which provides data at three spatial resolutions 250 m, 500 m, and 1 km, launched 18 December 1999 for Terra and 4 May 2002 for Aqua and has a repeat cycle of 16 days, Enhanced Vegetation Index (EVI) product to map key phenological parameters, but determined that a higher temporal resolution than MODIS datasets is required for characterizing peatland phenological cycles.
Chlorophyll fluorescence can be used as an indicator of a plant’s photosynthetic activity and growth. The chlorophyll fluorescence parameter (Fv/Fm) represents the maximum quantum yield of photosystem II and is a ratio commonly used to assess the efficiency of photosynthesis in plants (Meroni et al., 2009; Bartold, 2024). Bartold, (2024) used Sentinel-2 imagery to map Fv/Fm, demonstrating its potential to monitor the fluorescence of chlorophyll across peatlands for plant health information.
GPP, the total carbon fixed by vegetation photosynthesis, is the largest component of the global carbon cycle and is tightly related to many ecosystem functions, including ecosystem and soil respiration, vegetation growth, and water loss through transpiration. In peatlands, satellite-based estimation of GPP typically relies on variables such as vegetation indices (e.g., NDVI, EVI), land surface temperature, and incident radiation, which serve as proxies for plant activity and environmental conditions. Specifically, methods like the light use efficiency model, which considers factors like Photosynthetically Active Radiation (PAR), absorbed PAR, and conversion efficiency, can be used to estimate GPP (Monteith, 1972). Junttila et al. (2021) developed three empirical models to estimate Net Ecosystem Exchange (NEE), GPP, and Ecosystem Respiration (ER) based on vegetation indices from Sentinel-2 imagery and land surface temperature from MODIS data. Their findings demonstrated the feasibility of upscaling GPP and ER estimates over northern peatlands in combination with thermal data. Kalacska et al. (2018) modelled NEE from Landsat 5 and 8 imagery and although estimates derived from airborne hyperspectral imagery showed a stronger correlation with eddy covariance tower measurements, the satellite-based approach still demonstrated potential for broader-scale monitoring. These results suggest that for NEE, remote sensing data can be useful, but its implementation in satellite platforms is restricted to finer spectral, spatial, and radiometric resolutions, not achieved with Landsat or Sentinel 2 imagery. Lees et al. (2019) modelled GPP using a temperature and greenness (TG) model derived from MODIS data vegetation indices. Initially, they tested the MOD17A2H GPP product but found that this overestimated GPP compared with in situ eddy covariance measurements and, due to the model’s overall poor performance, deemed it unsuitable. The TG model, however, was found to have better agreement with the eddy covariance data, with potential application for wider modelling of GPP over peatlands, once the model has been calibrated across different northern peatlands. Sentinel-3 (3A launched 13 February 2016, and 3B launched 25 April 2018, and a revisit time of ∼2 days) data should be investigated for input into TG models as it has a high-accuracy land surface temperature product and shares the same spatial resolution as MODIS (1 km).
Despite the lack of studies that fulfil the criteria for review in this paper, it is important to consider the possibilities of Solar-Induced Fluorescence (SIF), which is another way to measure chlorophyll fluorescence. SIF is excess energy emitted by chlorophyll after sunlight absorption, directly linked to photosynthetic activity (Antala et al., 2024), making it useful for monitoring peatland vegetation health, productivity, and carbon dynamics. Antala et al. (2024), Bandopadhyay et al. (2019), and Rastogi et al. (2022) performed studies on peatlands at ground level with hyperspectral airborne data, outlining the benefits of using SIF. ESA’s FLEX (Fluorescence Explorer), scheduled for launch in 2026, is designed to produce global maps of vegetation fluorescence, potentially enabling the monitoring of SIF over peatlands. However, its relatively coarse spatial resolution of 300 m likely limits its suitability for detailed peatland applications. Regarding the currently applied indices, such as the widely used Fv/Fm, for monitoring the photosynthetic activity of peatland vegetation, Sentinel-2 was identified as having good capabilities. However, before this can be implemented, more research is needed to calibrate indices and perform validation based on ground data.
5 Terrain change indicators
Indicators not directly associated with ecological processes have also been shown to be useful to assess the condition of peatlands, especially in tracking the disturbances that can impact the ecological succession that characterizes a restoration process.
5.1 Surface motion
Peatlands are dynamic landscapes. Healthy peatlands exhibit two forms of vertical surface motion: a short-term seasonal effect known as “bog-breathing” where the peat expands and contracts in response to changes in the volumes of water and gas (Kennedy and Price, 2005; Marshall et al., 2022; Morton and Heinemeyer, 2019); and the long-term effect of a net uplift in the peatland due to peat accumulation (and hence carbon sequestration) (Alshammari et al., 2020). In degraded peatlands, the long-term (multi-annual to decadal) surface motion is attributable to subsidence due to drainage, compression, disturbances (such as fire), and peat decay, indicating carbon loss and poor condition (Kennedy and Price, 2005; Alshammari et al., 2018), and the short-term bog breathing effect will not be present. In the United Kingdom, sites in good condition, dominated by Sphagnum, display long-term stability or growth, and a seasonal cycle with maximum uplift and subsidence in August–November and April–June, respectively (Alshammari et al., 2020). Drier and partially drained sites dominated by shrubs display long-term subsidence with maximum uplift and subsidence in July–October and February–June, respectively. (Alshammari et al., 2020). In situ data on surface motion are spatially and temporally sparse. Ground data for capturing the “bog level” is based on measurements using a metal rod embedded in the substrate (the presence of rust on the rod indicates the lowest depth to which the water table regularly falls) for precise levelling (Marshall et al., 2022). Field measurements are limited in terms of spatial representativeness and are not suitable for large-scale monitoring. As such, remote sensing-based approaches are being explored to monitor surface motion for peatland condition monitoring (Alshammari et al., 2018; Bradley et al., 2022; Khodaei et al., 2023).
A summary of satellite-based methods for monitoring of peatland surface motion is presented in Table 3. Surface motion monitoring is conducted using C-Band SAR data with Interferometric SAR (InSAR) methods. InSAR uses two or more SAR images of the same area, taken at different times. By comparing the phase differences between these images, changes in the distance between the satellite and the surface, which indicate ground deformation, can be determined. Fiaschi et al. (2019) used the Permanent Scatter InSAR (PS-InSAR) processing approach to create an InSAR time series of ground motion with Sentinel-1 data and found it enabled the detection of millimeter-scale ground motion over small areas (103–106 m2), making it suitable for use in monitoring peatland subsidence or uplift. However, Alshammari et al. (2018) found that PS-InSAR can have limited application over peat, as it worked better in areas of high coherence (i.e., hard, non-vegetated surfaces). Khodaei et al. (2023) implemented the Stanford Method for Persistent Scatterers (StaMPS) and Multi-Temporal InSAR (MTI) to study a highly vegetated peatland site over 3.5 years. They found that the technique could effectively detect vertical displacements of ∼40 mm y−1 and hence has the potential to monitor peatland surface motion.
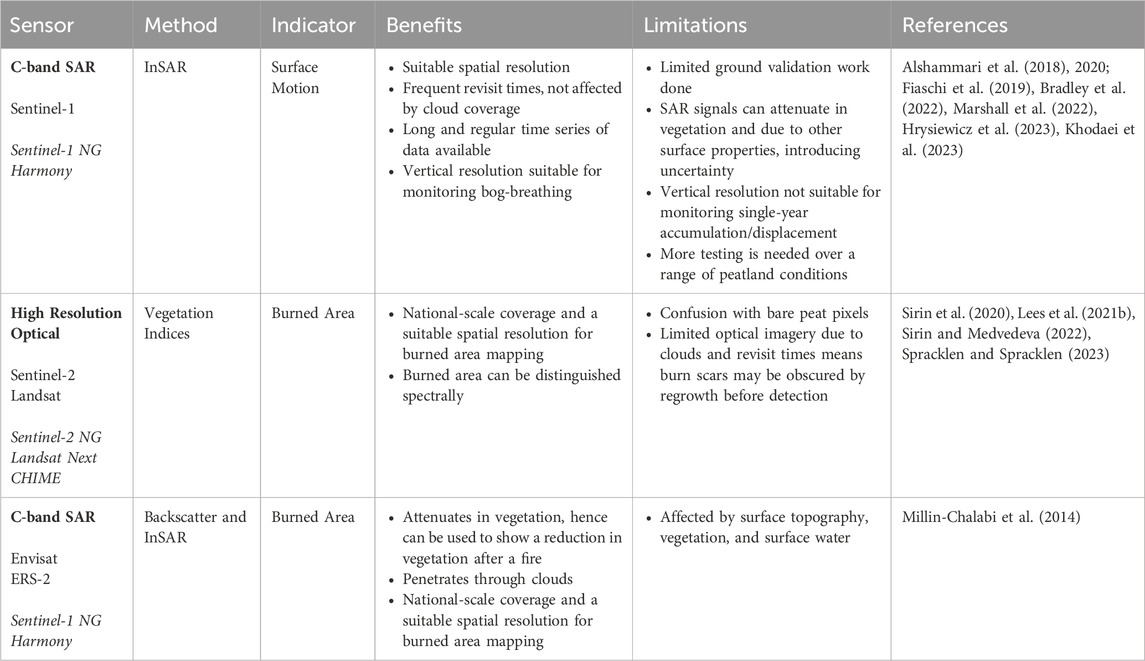
Table 3. Summary of satellite sensors and methods for remote sensing of terrain change indicators.
Four of the reviewed studies used the Advanced Pixel System using the Intermittent Small Baseline Subset (APSIS) method (Alshammari et al., 2018; 2020; Bradley et al., 2022; Marshall et al., 2022). The APSIS method eliminates the need for consistent phase stability required by most other InSAR techniques, enabling more measurements in vegetated areas where traditional methods often struggle due to incoherence (Alshammari et al., 2020; Bradley et al., 2022). In addition, Alshammari et al. (2020) and Bradley et al. (2022) were able to discriminate between the changes that occur due to the bog’s breathing (seasonal) cycle and the changes between near-natural and drained peatlands, showing good potential for national-scale monitoring of surface motion.
There is still a lack of clarity about how surface motion gradually changes throughout the restoration process. It is therefore important to conduct further research to characterize the different stages of surface motion throughout restoration before it can be fully implemented. While the consensus is that Sentinel-1 C-band SAR is suitable for monitoring peatland surface motion, its ability to detect very small-scale vertical displacements, such as annual peat accumulation, remains a key consideration. Although Sentinel-1 offers high temporal resolution, its vertical sensitivity may be limited when detecting millimeter-scale variation. As such this must be underpinned with field measurements for algorithm calibration and result validation. In addition, to ensure its widespread applicability, other monitoring sites with different conditions and across different areas of the UK need to be tested.
5.2 Surface degradation features
Extensive drainage of the UK’s peatlands was done using artificial ditches, with the commercial intent to use the land for agriculture or afforestation. As identified in the IUCN’s Peatland Code Field Protocol (IUCN, 2017), drainage ditches represent the main degradation feature, taking the form of active artificial drains (grips) and degradation features (hagg/gully systems). Drainage system gullies are channels cut through the peatland; the continual flow of water through them can result in the formation of hagg/gully features, which indicates significant degradation. Peatland condition categories are determined by the distance to these drainage features. Any peatland area within 30 m of a drainage ditch is categorized as drained according to the Peatland Code’s guidance (NatureScot, 2016; IUCN, 2017). Near-natural peatlands will not have any hagg/gully systems or drainage ditches present on the site (NatureScot, 2016).
In the United Kingdom, the lack of records on drainage systems means that creating accurate maps of peatland drainage ditches is the first step required to be able to begin the restoration process. Remote sensing has the potential to be an effective tool for mapping the location of these drainage systems and may also be used to monitor change in the drainage ditch activity, i.e., if they become less detectable over time as they have filled in, or filled up with water, and become vegetated, indicating that restoration work has been successful.
A summary of satellite-based methods for monitoring surface degradation features is presented in Table 3. There are currently no published papers on the mapping of drainage features that meet the criteria of this review. However, worth noting are the studies by Aitkenhead et al. (2016) and Artz et al. (2017) who used fine resolution satellite imagery from Landsat 8 and moderate resolution satellite imagery from MODIS to map drainage ditches in Scotland with somewhat limited success, concluding that more ground data was needed for the fitting of more robust models. Results have shown that airborne LiDAR and/or aerial imagery can be used to map drainage systems with an accuracy of 70%–94% (Carless et al., 2019; Robb et al., 2023). The commercial, very high-resolution satellite Geoeye-1 has also been used to map drainage ditches in Ireland (Connolly and Holden, 2017), showing the potential of this method. Another case study worthy of note, despite the fact it does not use satellite data, is the study by Habib et al. (2024). This study used 0.25 m spatial resolution BlueSky International Limited aerial imagery to map the spatial extend of artificial drains on raised bogs across Ireland. The overall accuracy of the model used in this study was 80%, based on an independent testing dataset. This is an area of ongoing research and as more very high spatial resolution data satellite data becomes available, research should be done into assessing and implementing this method over the United Kingdom.
LiDAR data is adequate to potentially map drainage systems; however, this is dependent on factors such as point density, and the availability of LiDAR is still limited in many parts of the UK and beyond (Robb et al., 2023). Future LiDAR satellite missions could further explore its applicability for drainage feature mapping; however, no suitable missions are currently planned. LiDAR capabilities onboard the International Space Station (ISS), currently the Global Ecosystem Dynamics Investigation (GEDI) and in the future Multi-footprint Observation LiDAR and Imager (MOLI), would be suitable for testing for this application, however due to the ISS’s orbit data is only collected between 51.6° North to 51.6° South hence missing out most of the UK. Given the limitations of satellite-based LiDAR, exploring the use of UAV and aircraft-mounted LiDAR for drainage feature mapping is essential. To make this technology operationally viable, extensive testing is needed to evaluate different LiDAR systems, optimize data collection methods, and develop automated workflows for processing large datasets, with a focus on integrating these tools into peatland restoration projects where precise knowledge of ditch locations is essential. The UK’s Environment Agency National LiDAR Programme provides an open-access database of elevation data at 1 m spatial resolution for all of England, this could be used for validation if suitable satellite data did become available.
5.3 Fire Incidence
UK peatlands experience two types of fires, prescribed burning for management and wildfires. Frequent or severe fires can remove the moss layer and significantly alter or remove the vegetation on a peatland, and intense fires can also penetrate and consume the peat, leading to further erosion, peat, and carbon loss (NatureScot, 2016). Under restoration, prescribed burning practices are stopped and, for susceptible peatlands, work is undertaken to reduce the risk and severity of wildfires. This is done through conservation actions (e.g., drain blocking for rewetting) and educating the public about fire prevention (Titterton and Hunt, 2021). It is not only important to map the occurrence of burned areas on peatlands to measure restoration success and account for carbon emissions from both above-ground vegetation and underground peat burning, but also to detect and map active fires to enable timely intervention and prevent further damage. Burned area mapping is currently done in the field by walking along the burned area perimeter with a GPS. However, this approach is not practical over large scales or fragmented areas due to its labor-intensive nature. Remote sensing is being looked at as a large-scale peatland burning monitoring solution (Lees et al., 2021b; Sirin and Medvedeva, 2022).
A summary of satellite-based methods for monitoring fire incidents is presented in Table 3. Four of the studies reviewed make use of vegetation indices derived from optical imagery to detect burned areas of peatland. Sentinel-2 (10 m) and Landsat 5/7/8 (30 m) imagery have been utilized to both detect burned area and monitor vegetation recovery. However, the lack of cloud-free imagery around the burn season (October to April) resulted in known burn patches not being captured. A further challenge is the inability to discriminate spectrally between bare peat and burned area. To overcome this limitation Sirin and Medvedeva, (2022) used hotspot data retrieved from MODIS imagery to improve the classification of burned peatlands but found that, due to low intensity of radiance emitted by peatland fires and frequent cloud coverage, hotspot datasets are characterized by omission errors. Millin-Chalabi et al. (2014) investigated the potential of SAR intensity and InSAR coherence to detect peatland fire scars, and while they outlined that this approach would need further work to disentangle the effects of fire size, topography, and less generalized land-cover classes on SAR intensity and InSAR coherence, they showed good initial results of SAR intensity detecting burned peat. One of the most important things to note from the use of SAR data to detect fire scars is the potential for this method to be combined with optical methods to distinguish between bare and burned peat areas.
Burned area mapping can be achieved using the standard NIR and SWIR multi-sensor spectral bands. Due to its suitable spatial resolution, Sentinel-2 can be used for this application, but with limitations (Section 2.2). This limited cloud-free data can significantly impact burn scar detectability due to the short-lived spectral signal of burned vegetation. Additional spectral information, such as that provided by hyperspectral sensors, could potentially improve burned area detectability. In particular, sensors with bands around 1,200 nm can target absorption features linked to fire-affected vegetation, which may help extend the detection window (McMorrow et al., 2005). In addition, the optical data could be combined with SAR data to further improve on the current burned area classification algorithms, by complementing the loss of vegetation with information on terrain changes (Millin-Chalabi et al., 2014). Continual land cover mapping could also be incorporated, as it offers a temporal context for distinguishing burned areas from bare peat in peatlands. While bare peat shows stable spectral and backscatter signatures, burned areas are marked by sudden changes from vegetated to bare states; hence, tracking these transitions can help identify fire events. These different temporal dynamics between bare peat and burned peat are critical for discrimination between the two. To enable this discrimination, an integrated workflow combining optical data for monitoring vegetation loss, SAR coherence data for monitoring structural change, and hotspot data to confirm thermal anomalies could be developed; hence, this is an avenue requiring further research.
6 Conclusion
A robust framework for monitoring peatland condition is essential for ensuring restoration projects across the United Kingdom are effective, credible, and aligned with environmental and socio-economic goals. Regular, standardized monitoring enables benchmarking and tracks progress over time, allowing for assessment of the restoration effort. It allows early detection of problems and quick intervention to avoid restoration failure and prevent further degradation. A monitoring framework will also underpin national targets for net zero and peatland restoration, by providing the evidence base for voluntary carbon and biodiversity initiatives to demonstrate outcomes and provide accountability to build trust among stakeholders. Ultimately, restoring peatlands to a good condition has a multitude of benefits including capturing and storing carbon, regulation of local hydrology, supporting rare biodiversity, and a reduction in land degradation (such as less risk of wildfires occurring), which is why a robust monitoring framework is essential to track progress, ensure restoration is effective, and safeguard these long-term environmental and climate benefits.
Open-access remote sensing satellites offer the advantage of providing systematic spatially explicit data, on a large scale, at an adequate temporal frequency, over difficult-to-access terrain. This review has evaluated the current and upcoming capabilities of these missions to monitor peatland restoration across key ecological and environmental indicators. The results of this are presented in Table 4 and summarized below. It has been demonstrated that, while no single satellite platform can comprehensively capture all aspects of peatland condition, combining multiple sensor types significantly enhances monitoring capabilities.
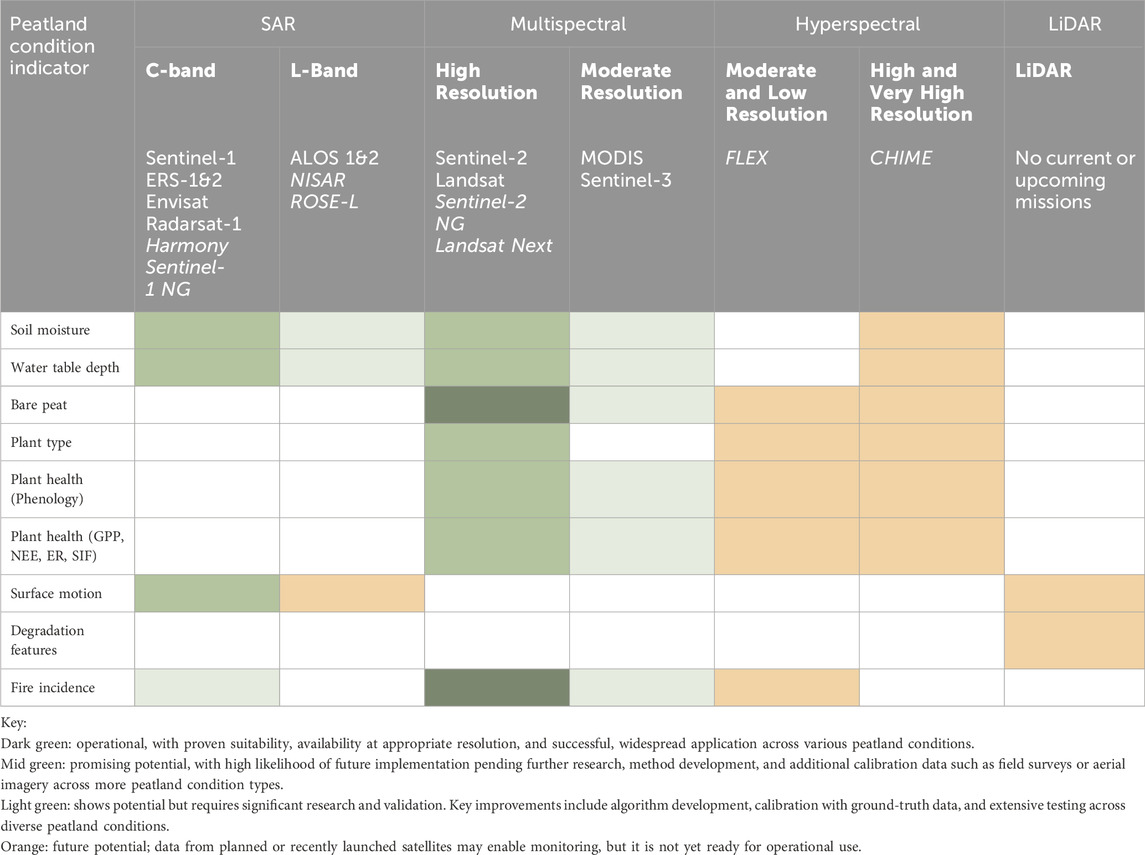
Table 4. Matrix summarizing remote sensing satellite data suitability to monitor each peatland condition indicator based on the literature review, future satellites are shown in Italics.
Hydrological indicators (water table depth and soil moisture) can be effectively monitored using C-band SAR backscatter data, such as from Sentinel-1, which offers frequent revisit times (6 days), cloud penetration, and suitable spatial resolution. This approach enables spatially explicit upscaling of in situ WTD measurements but cannot be used alone; ground stations remain essential for algorithm calibration and validation. Site-specific factors like surface inundation, vegetation type, and seasonal variation must be considered when developing retrieval models. Upcoming L-band missions like NISAR and ROSE-L should be investigated to further enhance monitoring capabilities with frequent, all-weather imaging, as L-band SAR has different penetration through vegetation properties. Regular short-term monitoring (weekly to monthly) is crucial to capture dynamic hydrological fluctuations critical for peatland restoration.
Bare peat presence is best detected using medium to fine spatial resolution multispectral satellites like Sentinel-2 and Landsat, which provide spectral bands sensitive to exposed soil. Seasonal to annual monitoring is recommended, as changes typically occur over months and help assess restoration progress and erosion risk. This approach is currently ready for implementation across the UK; however, the main drawback is confusion with burnt peat, which should be resolved with temporal analysis.
Vegetation indicators, including type and health, benefit from multispectral and will benefit from hyperspectral sensors. Identifying spectral signatures of key peatland species (e.g., Sphagnum, heather) and matching them to satellite bands requires further research for operational monitoring. Airborne studies on plant health can guide future satellite applications once hyperspectral missions, notably CHIME, are available. Vegetation activity is already well-monitored using Sentinel-2 and Landsat data; however, upcoming hyperspectral missions and the planned FLEX mission offer the potential to further improve monitoring capabilities. Monthly observations during the growing season are recommended to track recovery and stress, alongside annual assessments for long-term ecosystem trends. However, the effectiveness of optical satellite monitoring over northern peatlands is inherently limited by the availability of cloud-free overpass days, which can restrict data acquisition during critical periods.
Surface motion, including subsidence or uplift related to water table changes or degradation, is measurable with InSAR techniques using Sentinel-1. However, ground-based validation remains essential to ensure algorithm accuracy, and understanding surface motion dynamics throughout restoration stages requires further field research. Monitoring on a seasonal to annual basis is appropriate to detect gradual ground deformation processes relevant to peatland stability. Long-term (5 years+) monitoring of surface motion should also be done to monitor long-term carbon accumulation.
Degradation features (drainage ditches) cannot currently be detected using satellite remote sensing due to their small size and low contrast with the surrounding landscape, which exceeds the resolution and sensitivity of existing sensors. Instead, field measurements and UAV or airborne LiDAR and hyperspectral surveys are required. LiDAR mapping should be conducted at the start of restoration projects to identify drains that need blocking and repeated if WTD monitoring indicates unsuccessful reestablishment, enabling timely intervention.
Fire occurrences demand rapid, short-term (weekly or even daily) detection capabilities, which optical satellites with thermal bands (e.g., Sentinel-3, MODIS) provide. Timely identification is crucial for assessing immediate fire impacts and guiding emergency response and post-fire restoration. National-scale peatland burned area mapping can be achieved using spectral change detection techniques in the form of vegetation indices that can be derived from medium-resolution optical satellites, such as Sentinel-2. Areas undergoing restoration should be monitored for fire occurrence and vegetation recovery.
Overall, data retrieved by the European Copernicus satellite missions, Sentinel-1 and Sentinel-2, have been shown to be the most and most successfully used for monitoring northern peatland condition. Future efforts should prioritize the integration of satellite data with UAV and ground-based observations for calibration and validation, improving accuracy and operational feasibility. In addition, future research should focus on the integration of optical and SAR satellite data to better capture both surface and structural peatland characteristics under varying environmental conditions. As new open-access satellite missions with enhanced spatial, spectral, and temporal capabilities launch, the potential for comprehensive, cost-effective peatland monitoring will continue to grow, supporting informed restoration and conservation management.
Author contributions
NR: Conceptualization, Funding acquisition, Investigation, Methodology, Visualization, Writing – original draft. BM: Conceptualization, Supervision, Writing – review and editing. JN: Conceptualization, Supervision, Writing – review and editing.
Funding
The author(s) declare that financial support was received for the research and/or publication of this article. This work was funded by the National Physical Laboratory’s Director’s Science and Engineering Fund.
Acknowledgments
The authors would like to thank Olivier Burggraaff for the useful discussions.
Conflict of interest
The authors declare that the research was conducted in the absence of any commercial or financial relationships that could be construed as a potential conflict of interest.
Generative AI statement
The author(s) declare that no Generative AI was used in the creation of this manuscript.
Any alternative text (alt text) provided alongside figures in this article has been generated by Frontiers with the support of artificial intelligence and reasonable efforts have been made to ensure accuracy, including review by the authors wherever possible. If you identify any issues, please contact us.
Publisher’s note
All claims expressed in this article are solely those of the authors and do not necessarily represent those of their affiliated organizations, or those of the publisher, the editors and the reviewers. Any product that may be evaluated in this article, or claim that may be made by its manufacturer, is not guaranteed or endorsed by the publisher.
References
Abdelmajeed, A. Y. A., and Juszczak, R. (2024). Challenges and limitations of remote sensing applications in northern peatlands: present and future prospects. Remote Sens. 16, 591. doi:10.3390/rs16030591
Abdelmajeed, A. Y. A., Albert-Saiz, M., Rastogi, A., and Juszczak, R. (2023). Cloud-Based remote sensing for wetland Monitoring—A review. Remote Sens. 15, 1660. doi:10.3390/rs15061660
Aitkenhead, M., Poggio, L., Donaldson-Selby, G., Gimona, A., and Artz, R. (2016). Detection of peatland drainage with remote sensing – a scoping study. The James Hutton Institute.
Alderson, D. M., Evans, M. G., Shuttleworth, E. L., Pilkington, M., Spencer, T., Walker, J., et al. (2019). Trajectories of ecosystem change in restored blanket peatlands. Sci. Total Environ. 665, 785–796. doi:10.1016/j.scitotenv.2019.02.095
Alshammari, L., Large, D., Boyd, D., Sowter, A., Anderson, R., Andersen, R., et al. (2018). Long-Term peatland condition assessment via surface motion monitoring using the ISBAS DInSAR technique over the flow country, Scotland. Remote Sens. 10, 1103. doi:10.3390/rs10071103
Alshammari, L., Boyd, D. S., Sowter, A., Marshall, C., Andersen, R., Gilbert, P., et al. (2020). Use of surface motion characteristics determined by InSAR to assess peatland condition. J. Geophys. Res. Biogeosciences 125, e2018JG004953. doi:10.1029/2018JG004953
Andersen, R., Farrell, C., Graf, M., Muller, F., Calvar, E., Frankard, P., et al. (2017). An overview of the progress and challenges of peatland restoration in Western Europe. Restor. Ecol. 25, 271–282. doi:10.1111/rec.12415
Antala, M., Rastogi, A., Cogliati, S., Stróżecki, M., Colombo, R., and Juszczak, R. (2024). Sun-induced fluorescence spectrum as a tool for assessing peatland vegetation productivity in the framework of warming and reduced precipitation experiment. Remote Sens. Environ. 301, 113921. doi:10.1016/j.rse.2023.113921
Aoki, Y., Furuya, M., De Zan, F., Doin, M.-P., Eineder, M., Ohki, M., et al. (2021). L-band Synthetic Aperture Radar: Current and future applications to Earth sciences. Earth Planets Space 73 56, s40623-021-01363–x. doi:10.1186/s40623-021-01363-x
Arroyo-Mora, J. P., Kalacska, M., Soffer, R., Ifimov, G., Leblanc, G., Schaaf, E. S., et al. (2018). Evaluation of phenospectral dynamics with Sentinel-2A using a bottom-up approach in a northern ombrotrophic peatland. Remote Sens. Environ. 216, 544–560. doi:10.1016/j.rse.2018.07.021
Artz, R. R. E., Donaldson-Selby, G., Poggio, L., Donnelly, D., and Aitkenhead, M. J. (2017). Comparison of remote sensing approaches for detection of peatland drainage in Scotland. James Hutt. Inst.
Artz, R., Coyle, M., Donaldson-Selby, G., Cooksley, S., Gimona, A., Pakeman, R., et al. (2023). Scoping a national peatland monitoring framework. doi:10.7488/ERA/3167
Asmuß, T., Bechtold, M., and Tiemeyer, B. (2019). On the potential of Sentinel-1 for high resolution monitoring of water table dynamics in grasslands on organic soils. Remote Sens. 11, 1659. doi:10.3390/rs11141659
Bain, C. G., Bonn, A., Stoneman, R., Chapman, S., Coupar, A., Evans, M., et al. (2011). IUCN UK Commission of inquiry on peatlands. Edinburgh: IUCN.
Baird, A. J., and Low, R. G. (2022). The water table: its conceptual basis, its measurement and its usefulness as a hydrological variable. Hydrol. Process. 36, e14622. doi:10.1002/hyp.14622
Bandopadhyay, S., Rastogi, A., Rascher, U., Rademske, P., Schickling, A., Cogliati, S., et al. (2019). Hyplant-Derived sun-induced Fluorescence—A new opportunity to disentangle complex vegetation signals from diverse vegetation types. Remote Sens. 11, 1691. doi:10.3390/rs11141691
Bartold, M., and Kluczek, M. (2024). Estimating of chlorophyll fluorescence parameter Fv/Fm for plant stress detection at peatlands under Ramsar Convention with Sentinel-2 satellite imagery. Ecol. Inf. 81, 102603. doi:10.1016/j.ecoinf.2024.102603
Bechtold, M., Schlaffer, S., Tiemeyer, B., and De Lannoy, G. (2018). Inferring water table depth dynamics from ENVISAT-ASAR C-Band backscatter over a range of peatlands from deeply-drained to natural conditions. Remote Sens. 10, 536. doi:10.3390/rs10040536
Bonn, A., Allot, T., Evans, M., Joosten, H., and Stoneman, R. (2016). Peatland restoration and ecosystem services: science, Policy and practice. 1st Edn. Cambridge University Press.
Bonnett, S. A. F., Ross, S., Linstead, C., and Maltby, E. (2009). A review of techniques for monitoring the success of peatland restoration. University of Liverpool. Natural England Commissioned Reports, Number 086.
Bourgault, M., Larocque, M., and Garneau, M. (2017). Quantification of peatland water storage capacity using the water table fluctuation method. Hydrol. Process. 31, 1184–1195. doi:10.1002/hyp.11116
Bradley, A. V., Andersen, R., Marshall, C., Sowter, A., and Large, D. J. (2022). Identification of typical ecohydrological behaviours using InSAR allows landscape-scale mapping of peatland condition. Earth Surf. Dyn. 10, 261–277. doi:10.5194/esurf-10-261-2022
Brown, P., Cardenas, L., Del Vento, S., Karagianni, E., MacCarthy, J., Mullen, P., et al. (2023). UK Greenhouse Gas Inventory 1990 to 2021: annual Report for submission under the Framework Convention on Climate change. Harwell: Department for Energy Security and Net Zero.
Burdun, I., Bechtold, M., Sagris, V., Komisarenko, V., De Lannoy, G., and Mander, Ü. (2020). A comparison of three trapezoid models using optical and thermal satellite imagery for water table depth monitoring in Estonian bogs. Remote Sens. 12, 1980. doi:10.3390/rs12121980
Burdun, I., Bechtold, M., Aurela, M., De Lannoy, G., Desai, A. R., Humphreys, E., et al. (2023). Hidden becomes clear: optical remote sensing of vegetation reveals water table dynamics in northern peatlands. Remote Sens. Environ. 296, 113736. doi:10.1016/j.rse.2023.113736
Carless, D., Luscombe, D. J., Gatis, N., Anderson, K., and Brazier, R. E. (2019). Mapping landscape-scale peatland degradation using airborne lidar and multispectral data. Landsc. Ecol. 34, 1329–1345. doi:10.1007/s10980-019-00844-5
Cole, B., McMorrow, J., and Evans, M. (2014a). Empirical modelling of vegetation abundance from airborne hyperspectral data for Upland Peatland restoration monitoring. Remote Sens. 6, 716–739. doi:10.3390/rs6010716
Cole, B., McMorrow, J., and Evans, M. (2014b). Spectral monitoring of moorland plant phenology to identify a temporal window for hyperspectral remote sensing of peatland. ISPRS J. Photogramm. Remote Sens. 90, 49–58. doi:10.1016/j.isprsjprs.2014.01.010
Connolly, J., and Holden, N. M. (2017). Detecting peatland drains with Object Based Image Analysis and Geoeye-1 imagery. Carbon Balance Manag. 12, 7. doi:10.1186/s13021-017-0075-z
Czapiewski, S., and Szumińska, D. (2021). An overview of remote sensing data applications in Peatland research based on works from the period 2010–2021. Land 11, 24. doi:10.3390/land11010024
Dabrowska-Zielinska, K., Musial, J., Malinska, A., Budzynska, M., Gurdak, R., Kiryla, W., et al. (2018). Soil moisture in the biebrza wetlands retrieved from Sentinel-1 imagery. Remote Sens. 10, 1979. doi:10.3390/rs10121979
Dettmann, U., and Bechtold, M. (2016). Deriving effective soil water retention characteristics from shallow water table fluctuations in peatlands. Vadose Zone J. 15, 1–13. doi:10.2136/vzj2016.04.0029
Dronova, I., Kislik, C., Dinh, Z., and Kelly, M. (2021). A review of unoccupied aerial vehicle use in wetland applications: emerging opportunities in approach, technology, and data. Drones 5, 45. doi:10.3390/drones5020045
Erudel, T., Fabre, S., Houet, T., Mazier, F., and Briottet, X. (2017). Criteria comparison for classifying peatland vegetation types using in situ hyperspectral measurements. Remote Sens. 9, 748. doi:10.3390/rs9070748
Evans, C., Artz, R., Moxley, J., Taylor, E., Archer, N., Burden, A., et al. (2017). Implementation of an emissions inventory for UK peatlands.
Evans, C. D., Peacock, M., Baird, A. J., Artz, R. R. E., Burden, A., Callaghan, N., et al. (2021). Overriding water table control on managed peatland greenhouse gas emissions. Nature 593, 548–552. doi:10.1038/s41586-021-03523-1
Fiaschi, S., Holohan, E., Sheehy, M., and Floris, M. (2019). PS-InSAR analysis of Sentinel-1 data for detecting ground motion in temperate Oceanic climate zones: a case Study in the Republic of Ireland. Remote Sens. 11, 348. doi:10.3390/rs11030348
Field, G., Thornton-Lee, R., Rayment, M., and Bassford, M. (2024). Nature for Climate Peatland Grant Scheme Process Evaluation - Interim Evaluation - Final Report. NECR546. Natural England.
Frolking, S. E., Bubier, J. L., Moore, T. R., Ball, T., Bellisario, L. M., Bhardwaj, A., et al. (1998). Relationship between ecosystem productivity and photosynthetically active radiation for northern peatlands. Glob. Biogeochem. Cycles 12, 115–126. doi:10.1029/97GB03367
Guo, M., Li, J., Sheng, C., Xu, J., and Wu, L. (2017). A review of wetland remote sensing. Sensors 17, 777. doi:10.3390/s17040777
Habib, W., Cresson, R., McGuinness, K., and Connolly, J. (2024). Mapping artificial drains in peatlands—A national-scale assessment of Irish raised bogs using sub-meter aerial imagery and deep learning methods. Remote Sens. Ecol. Conserv. 10, 551–562. doi:10.1002/rse2.387
Harris, A., Bryant, R. G., and Baird, A. J. (2006). Mapping the effects of water stress on Sphagnum: preliminary observations using airborne remote sensing. Remote Sens. Environ. 100, 363–378. doi:10.1016/j.rse.2005.10.024
Holden, J., Chapman, P. J., and Labadz, J. C. (2004). Artificial drainage of peatlands: hydrological and hydrochemical process and wetland restoration. Prog. Phys. Geogr. Earth Environ. 28, 95–123. doi:10.1191/0309133304pp403ra
Holden, J., Moody, C. S., Edward Turner, T., McKenzie, R., Baird, A. J., Billett, M. F., et al. (2018). Water-level dynamics in natural and artificial pools in blanket peatlands. Hydrol. Process. 32, 550–561. doi:10.1002/hyp.11438
Hrysiewicz, A., Holohan, E. P., Donohue, S., and Cushnan, H. (2023). SAR and InSAR data linked to soil moisture changes on a temperate raised peatland subjected to a wildfire. Remote Sens. Environ. 291, 113516. doi:10.1016/j.rse.2023.113516
Isoaho, A., Ikkala, L., Päkkilä, L., Marttila, H., Kareksela, S., and Räsänen, A. (2024). Multi-sensor satellite imagery reveals spatiotemporal changes in peatland water table after restoration. Remote Sens. Environ. 306, 114144. doi:10.1016/j.rse.2024.114144
IUCN (2017). Field protocol: assessing eligibility, determining baseline condition category and monitoring change.
Joosten, H. (2010). The Global Peatland CO2 Picture: Peatland status and drainage related emissions in all countries of the world. Ede: Wetlands International.
Joosten, H., and Clarke, D. (2002). Wise use of mires and peatlands: background and principles including a framework for decision-making. Totnes Intern. Mire Conserv. Group [u.a.].
Junttila, S., Kelly, J., Kljun, N., Aurela, M., Klemedtsson, L., Lohila, A., et al. (2021). Upscaling Northern peatland CO2 fluxes using satellite remote sensing data. Remote Sens. 13, 818. doi:10.3390/rs13040818
Kalacska, M., Arroyo-Mora, J., Soffer, R., Roulet, N., Moore, T., Humphreys, E., et al. (2018). Estimating peatland water table depth and net ecosystem exchange: a comparison between satellite and airborne imagery. Remote Sens. 10, 687. doi:10.3390/rs10050687
Kasischke, E. S., Bourgeau-Chavez, L. L., Rober, A. R., Wyatt, K. H., Waddington, J. M., and Turetsky, M. R. (2009). Effects of soil moisture and water depth on ERS SAR backscatter measurements from an Alaskan wetland complex. Remote Sens. Environ. 113, 1868–1873. doi:10.1016/j.rse.2009.04.006
Kennedy, G. W., and Price, J. S. (2005). A conceptual model of volume-change controls on the hydrology of cutover peats. J. Hydrol. 302, 13–27. doi:10.1016/j.jhydrol.2004.06.024
Khodaei, B., Hashemi, H., Salimi, S., and Berndtsson, R. (2023). Substantial carbon sequestration by peatlands in temperate areas revealed by InSAR. Environ. Res. Lett. 18, 044012. doi:10.1088/1748-9326/acc194
Kim, J.-W., Lu, Z., Gutenberg, L., and Zhu, Z. (2017). Characterizing hydrologic changes of the Great Dismal Swamp using SAR/InSAR. Remote Sens. Environ. 198, 187–202. doi:10.1016/j.rse.2017.06.009
Kimmel, K., and Mander, Ü. (2010). Ecosystem services of peatlands: implications for restoration. Prog. Phys. Geogr. Earth Environ. 34, 491–514. doi:10.1177/0309133310365595
Krzepek, K., Schmidt, J., and Iwaszczuk, D. (2022). Fusion of SAR and multi-spectral time series for determination of water table depth and Lake Area in peatlands. PFG – J. Photogramm. Remote Sens. Geoinformation Sci. 90, 561–575. doi:10.1007/s41064-022-00216-w
Labadz, J., Allott, T., Evans, M., Butcher, D., Billett, M., Yallop, A., et al. (2010). Peatland hydrology.
Laine, A. M., Lindholm, T., Nilsson, M., Kutznetsov, O., Jassey, V. E. J., and Tuittila, E. (2021). Functional diversity and trait composition of vascular plant and Sphagnum moss communities during peatland succession across land uplift regions. J. Ecol. 109, 1774–1789. doi:10.1111/1365-2745.13601
Lal, P., Singh, G., Das, N. N., Entekhabi, D., Lohman, R. B., and Colliander, A. (2024). Uncertainty estimates in the NISAR high-resolution soil moisture retrievals from multi-scale algorithm. Remote Sens. Environ. 311, 114288. doi:10.1016/j.rse.2024.114288
Lal, P., Singh, G., Das, N. N., and Lohman, R. B. (2025). Validation of the NISAR multi-scale soil moisture Retrieval Algorithm across various spatial resolutions and landcovers using the ALOS-2 SAR data. J. Remote Sens. 5, 0729. doi:10.34133/remotesensing.0729
Lees, K. J., Quaife, T., Artz, R. R. E., Khomik, M., and Clark, J. M. (2018). Potential for using remote sensing to estimate carbon fluxes across northern peatlands - a review. Sci. Total Environ. 615, 857–874. doi:10.1016/j.scitotenv.2017.09.103
Lees, K. J., Quaife, T., Artz, R. R. E., Khomik, M., Sottocornola, M., Kiely, G., et al. (2019). A model of gross primary productivity based on satellite data suggests formerly afforested peatlands undergoing restoration regain full photosynthesis capacity after five to ten years. J. Environ. Manage. 246, 594–604. doi:10.1016/j.jenvman.2019.03.040
Lees, K. J., Artz, R. R. E., Khomik, M., Clark, J. M., Ritson, J., Hancock, M. H., et al. (2020). Using spectral indices to estimate water content and GPP in sphagnum moss and other peatland vegetation. IEEE Trans. Geosci. Remote Sens. 58, 4547–4557. doi:10.1109/TGRS.2019.2961479
Lees, K. J., Artz, R. R. E., Chandler, D., Aspinall, T., Boulton, C. A., Buxton, J., et al. (2021a). Using remote sensing to assess peatland resilience by estimating soil surface moisture and drought recovery. Sci. Total Environ. 761, 143312. doi:10.1016/j.scitotenv.2020.143312
Lees, K. J., Buxton, J., Boulton, C. A., Abrams, J. F., and Lenton, T. M. (2021b). Using satellite data to assess management frequency and rate of regeneration on heather moorlands in England as a resilience indicator. Environ. Res. Commun. 3, 085003. doi:10.1088/2515-7620/ac1a5f
Leifeld, J., and Menichetti, L. (2018). The underappreciated potential of peatlands in global climate change mitigation strategies. Nat. Commun. 9, 1071. doi:10.1038/s41467-018-03406-6
Lindsay, R. (2010). Peatbogs and carbon: a critical synthesis to inform policy development in oceanic peat bog conservation and restoration in the context of climate change.
Linkosalmi, M., Tuovinen, J.-P., Nevalainen, O., Peltoniemi, M., Taniş, C. M., Arslan, A. N., et al. (2022). Tracking vegetation phenology of pristine northern boreal peatlands by combining digital photography with CO2 flux and remote sensing data. Biogeosciences 19, 4747–4765. doi:10.5194/bg-19-4747-2022
Loisel, J., and Gallego-Sala, A. (2022). Ecological resilience of restored peatlands to climate change. Commun. Earth Environ. 3, 208. doi:10.1038/s43247-022-00547-x
Lucchese, M., Waddington, J. M., Poulin, M., Pouliot, R., Rochefort, L., and Strack, M. (2010). Organic matter accumulation in a restored peatland: evaluating restoration success. Ecol. Eng. 36, 482–488. doi:10.1016/j.ecoleng.2009.11.017
Lunt, P., Allot, T., Anderson, P., Buckler, M., Coupar, A., Jones, P., et al. (2010). Impacts of peatland restoration.
Marshall, C., Sterk, H. P., Gilbert, P. J., Andersen, R., Bradley, A. V., Sowter, A., et al. (2022). Multiscale variability and the comparison of ground and satellite radar based measures of Peatland surface motion for Peatland monitoring. Remote Sens. 14, 336. doi:10.3390/rs14020336
McMorrow, J., Cutler, M., Al-Roichi, A., and Evans, M. (2005). Hyperspectral remote sensing of peat humification.
McPartland, M., Falkowski, M., Reinhardt, J., Kane, E., Kolka, R., Turetsky, M., et al. (2019). Characterizing boreal peatland plant composition and species diversity with hyperspectral remote sensing. Remote Sens. 11, 1685. doi:10.3390/rs11141685
Menberu, M. W., Haghighi, A. T., Ronkanen, A., Marttila, H., and Kløve, B. (2018). Effects of drainage and subsequent restoration on Peatland hydrological processes at Catchment Scale. Water Resour. Res. 54, 4479–4497. doi:10.1029/2017WR022362
Meroni, M., Rossini, M., Guanter, L., Alonso, L., Rascher, U., Colombo, R., et al. (2009). Remote sensing of solar-induced chlorophyll fluorescence: review of methods and applications. Remote Sens. Environ. 113, 2037–2051. doi:10.1016/j.rse.2009.05.003
Millard, K., Thompson, D., Parisien, M.-A., and Richardson, M. (2018). Soil moisture monitoring in a temperate peatland using multi-sensor remote sensing and Linear mixed effects. Remote Sens. 10, 903. doi:10.3390/rs10060903
Millin-Chalabi, G., McMorrow, J., and Agnew, C. (2014). Detecting a moorland wildfire scar in the Peak District, UK, using synthetic aperture radar from ERS-2 and Envisat ASAR. Int. J. Remote Sens. 35, 54–69. doi:10.1080/01431161.2013.860658
Minasny, B., Berglund, Ö., Connolly, J., Hedley, C., De Vries, F., Gimona, A., et al. (2019). Digital mapping of peatlands – a critical review. Earth-Sci. Rev. 196, 102870. doi:10.1016/j.earscirev.2019.05.014
Minasny, B., Adetsu, D. V., Aitkenhead, M., Artz, R. R. E., Baggaley, N., Barthelmes, A., et al. (2023). Mapping and monitoring peatland conditions from global to field scale. Biogeochemistry 167, 383–425. doi:10.1007/s10533-023-01084-1
Minayeva, T.Yu., Bragg, O. M., and Sirin, A. A. (2017). Towards ecosystem-based restoration of peatland biodiversity. Mires Peat, 1–36. doi:10.19189/MaP.2013.OMB.150
Mirmazloumi, S. M., Moghimi, A., Ranjgar, B., Mohseni, F., Ghorbanian, A., Ahmadi, S. A., et al. (2021). Status and trends of wetland studies in Canada using remote sensing technology with a focus on wetland classification: a bibliographic analysis. Remote Sens. 13, 4025. doi:10.3390/rs13204025
Monteith, J. L. (1972). Solar radiation and productivity in tropical ecosystems. J. Appl. Ecol. 9, 747–766. doi:10.2307/2401901
Morton, P. A., and Heinemeyer, A. (). Bog breathing: the extent of peat shrinkage and expansion on blanket bogs in relation to water table, heather management and dominant vegetation and its implications for carbon stock assessments. Wetlands Ecol. Manage. 27, 467–482. doi:10.1007/s11273-019-09672-5
Moxey, A., Smyth, M.-A., Taylor, E., and Williams, A. P. (2021). Barriers and opportunities facing the UK Peatland Code: a case-study of blended green finance. Land Use Policy 108, 105594. doi:10.1016/j.landusepol.2021.105594
NatureScot (2016). Peatland condition assessment. Available online at: https://www.nature.scot/sites/default/files/2023-02/Guidance-Peatland-Action-Peatland-Condition-Assessment-Guide-A1916874.pdf (Accessed July 1, 2024).
NatureScot (2022). Unoccupied Aerial Vehicle (UAV) deployment and data guidance. Unoccupied Aer. Veh. UAV Deploy. Data Guid. Available online at: https://www.nature.scot/doc/unoccupied-aerial-vehicle-uav-deployment-and-data-guidance.
Pang, Y., Huang, Y., Zhou, Y., Xu, J., and Wu, Y. (2020). Identifying spectral features of characteristics of Sphagnum to assess the remote sensing potential of peatlands: a case study in China. Mires Peat 26, 1–19. doi:10.19189/MaP.2019.OMB.StA.1834
Pang, Y., Huang, Y., He, L., Zhou, Y., Sui, J., and Xu, J. (2021). Remote sensing phenology of two Chinese northern Sphagnum bogs under climate drivers during 2001 and 2018. Ecol. Indic. 129, 107968. doi:10.1016/j.ecolind.2021.107968
Price, J. S., Heathwaite, A. L., and Baird, A. J. (2002). Hydrological processes in abandoned and restored peatlands: an overview of management approaches.
Räsänen, A., Tolvanen, A., and Kareksela, S. (2022). Monitoring peatland water table depth with optical and radar satellite imagery. Int. J. Appl. Earth Obs. Geoinformation 112, 102866. doi:10.1016/j.jag.2022.102866
Rastogi, A., Antala, M., Prikaziuk, E., Yang, P., Van Der Tol, C., and Juszczak, R. (2022). Exploring the potential of SCOPE model for detection of leaf area index and sun-induced fluorescence of Peatland Canopy. Remote Sens. 14, 4010. doi:10.3390/rs14164010
Regan, S., Swenson, M., O’Connor, M., and Gill, L. (2020). Ecohydrology, greenhouse Gas dynamics and restoration guidelines for degraded raised bogs. doi:10.13140/RG.2.2.15865.70248
Robb, C., Pickard, A., Williamson, J. L., Fitch, A., and Evans, C. (2023). Peat drainage ditch mapping from aerial imagery using a convolutional neural network. Remote Sens. 15, 499. doi:10.3390/rs15020499
SER (2004). “The SER international primer on ecological restoration,” in Society for ecological restoration international, science and policy working group (Washington DC).
Šimanauskienė, R., Linkevičienė, R., Bartold, M., Dąbrowska-Zielińska, K., Slavinskienė, G., Veteikis, D., et al. (2019). Peatland degradation: the relationship between raised bog hydrology and normalized difference vegetation index. Ecohydrology 12, e2159. doi:10.1002/eco.2159
Sirin, A., and Medvedeva, M. (2022). Remote sensing mapping of peat-fire-burnt areas: identification among other wildfires. Remote Sens. 14, 194. doi:10.3390/rs14010194
Sirin, A. A., Medvedeva, M. A., Makarov, D. A., Maslov, A. A., and Joosten, H. (2020). Multispectral satellite based monitoring of land cover change and associated fire reduction after large-scale peatland rewetting following the 2010 peat fires in Moscow Region (Russia). Ecol. Eng. 158, 106044. doi:10.1016/j.ecoleng.2020.106044
Sloan, T. J., Payne, R. J., Anderson, A. R., Bain, C., Chapman, S., Cowie, N., et al. (2018). Peatland afforestation in the UK and consequences for carbon storage. Mires Peat, 1–17. doi:10.19189/MaP.2017.OMB.315
Spracklen, B. D., and Spracklen, D. V. (2023). Assessment of peatland burning in Scotland during 1985–2022 using Landsat imagery. Ecol. Solut. Evid. 4, e12296. doi:10.1002/2688-8319.12296
Sterratt, B., Marino, A., Silva-Perez, C., Page, G., Hunter, P., and Subke, J.-A. (2023). “Peatland water table depth monitoring using quad-pol L-Band sar,” in Igarss 2023 - 2023 IEEE international geoscience and remote sensing symposium (Pasadena, CA, USA: IEEE), 1469–1472. doi:10.1109/IGARSS52108.2023.10281800
Stuart, M. B., Davies, M., Hobbs, M. J., McGonigle, A. J. S., and Willmott, J. R. (2022). Peatland plant spectral response as a proxy for peat health, analysis using low-cost hyperspectral imaging techniques. Remote Sens. 14, 3846. doi:10.3390/rs14163846
Tiemeyer, B., Albiac Borraz, E., Augustin, J., Bechtold, M., Beetz, S., Beyer, C., et al. (2016). High emissions of greenhouse gases from grasslands on peat and other organic soils. Glob. Change Biol. 22, 4134–4149. doi:10.1111/gcb.13303
Titterton, P., Hunt, M., Crouch, T., and Pilkington, T. (2021). A case study into the estimated amount of carbon released as a result of the wildfire that occurred on Marsden in April 2019. Edale: Moors for the Future Partnership.
Toca, L., Artz, R. R. E., Smart, C., Quaife, T., Morrison, K., Gimona, A., et al. (2023). Potential for Peatland water table depth monitoring using Sentinel-1 SAR backscatter: case Study of forsinard flows, Scotland, UK. Remote Sens. 15, 1900. doi:10.3390/rs15071900
Torabi Haghighi, A., Menberu, M. W., Darabi, H., Akanegbu, J., and Kløve, B. (2018). Use of remote sensing to analyse peatland changes after drainage for peat extraction. Land Degrad. Dev. 29, 3479–3488. doi:10.1002/ldr.3122
Torbick, N., Persson, A., Olefeldt, D., Frolking, S., Salas, W., Hagen, S., et al. (2012). High resolution mapping of Peatland hydroperiod at a high-latitude Swedish mire. Remote Sens. 4, 1974–1994. doi:10.3390/rs4071974
Tribe, N., Drake, D., Issac, D., Scholz, E.-M., and Worfolk, C. (2022). Peatland carbon finance scoping study.
Trippier, B., Robinson, P., Colson, D., and Hutchison, J. (2020). Developing a framework for using Earth Observation imagery to monitor peatland condition.
UNEP (2022). Global Peatlands Assessment – the State of the World’s Peatlands: evidence for action toward the conservation, restoration, and sustainable management of peatlands.
Xu, J., Morris, P. J., Liu, J., and Holden, J. (2018). PEATMAP: refining estimates of global peatland distribution based on a meta-analysis. CATENA 160, 134–140. doi:10.1016/j.catena.2017.09.010
Yu, Z. C. (2012). Northern peatland carbon stocks and dynamics: a review. Biogeosciences 9, 4071–4085. doi:10.5194/bg-9-4071-2012
Keywords: peatland, remote sensing, peatland condition, restoration monitoring, hydrological indicators, vegetation indicators, carbon credits
Citation: Reynolds N, Mota B and Nightingale JM (2025) Open-access satellite data for peatland condition and restoration monitoring in the UK: a review. Front. Environ. Sci. 13:1685165. doi: 10.3389/fenvs.2025.1685165
Received: 13 August 2025; Accepted: 09 October 2025;
Published: 14 November 2025.
Edited by:
Susan Page, University of Leicester, United KingdomReviewed by:
Preet Lal, University of Maryland, United StatesDave O'Leary, University of Galway, Ireland
Copyright © 2025 Reynolds, Mota and Nightingale. This is an open-access article distributed under the terms of the Creative Commons Attribution License (CC BY). The use, distribution or reproduction in other forums is permitted, provided the original author(s) and the copyright owner(s) are credited and that the original publication in this journal is cited, in accordance with accepted academic practice. No use, distribution or reproduction is permitted which does not comply with these terms.
*Correspondence: Nicole Reynolds, bmljb2xlLnJleW5vbGRzQG5wbC5jby51aw==