 Raul Sampaio De Lima
 Kalev Sepp
- Chair of Environmental Protection and Landscape Management, Institute of Agricultural and Environmental Sciences, Estonian University of Life Sciences, Tartu, Estonia
Introduction: This study introduces novel spectral indices specifically designed for drone-based data to identify and differentiate between varying levels of fire damage. Their application was demonstrated in an Estonian peatland, where its effectiveness was compared with that of traditional vegetation indices.
Methods: Four drone surveys were conducted at different post-fire intervals, and biophysical variables, including surface and soil temperatures, soil moisture, and aboveground biomass, were measured. The proposed triangular-area indices (TAI) were derived from reflectance maps obtained using a multispectral sensor. Damage classes were defined using binary and multi-level classification approaches, and decision trees were trained and evaluated for accuracy.
Results: The TAI1 index achieved classification accuracies between 80.6% and 90.9%, comparable to those of more complex machine learning techniques. TAI1 exhibited strong correlations with biophysical variables, highlighting its potential for post-fire assessment. Although TAI1 showed some limitations in distinguishing moderate damage levels, it demonstrated improved capability in detecting severely damaged areas.
Discussion: TAI1 can provide ecologically relevant insights, enhance the interpretation of fire damage, and support rapid, high-resolution assessments of vegetation health. Further research is required to validate its interchangeability with other indices across different scales, sensors, and environmental contexts.
1 Introduction
Wildfires play a fundamental role in carbon dynamics as they cause substantial carbon fluxes within ecosystems and release large amounts of carbon into the atmosphere (Ostroukhov et al., 2022). These events may contribute to an increase in air pollution levels, harm human health, and promote climate change (Manisalidis et al., 2020). In European countries, the increasing occurrence of wildfires is influenced by various agricultural burning practices and recreational activities, both of which result in economic losses and environmental challenges (Fernandez-Anez et al., 2021). Research indicates global trends towards larger burnt areas and more frequent fire incidents (Flannigan et al., 2009). Jolly et al. (2015) demonstrated an 18.7% expansion in the fire weather season length between 1979 and 2013, which consequently led to an increase in burnt areas. Furthermore, bogs, forests, and upland areas are particularly vulnerable to wildfires, especially because of potential harm to biodiversity, property, and natural resources in these environments (Palm et al., 2022; Turetsky et al., 2015).
Changes in vegetation, soil, and fauna resulting from wildfires serve as indicators of the severity and ecological impact of wildfire-induced damage (Keeley, 2009). Thus, these indicators are essential for assessing the evolution of the affected environment after a fire, especially in terms of vegetation dynamics, seed source availability, and long-term ecosystem recovery (Fraser et al., 2017). Assessing fire intensity is crucial for facilitating improvements in fire management practices and highlighting recovery priorities (Pérez-Rodríguez et al., 2019). Given that in situ evaluations of fire damage are often costly, time-consuming, and constrained by limited accessibility in remote areas (Fornacca et al., 2018; De Simone et al., 2020), remote sensing has become an efficient alternative for assessing fire and burn severity (Carvajal-Ramírez et al., 2019). The use of remote sensing for fire assessment rapidly evolved, especially during the 2000s (Szpakowski and Jensen, 2019; Chuvieco et al., 2020). Many of these applications focus on calculating spectral indices obtained from satellite images to generate algorithms that could be used to identify and map fire damage (see Tran et al., 2019; Lasaponara et al., 2018; Nolè et al., 2022; Leblon et al., 2022; Bastarrika et al., 2024). Developing new spectral indices is essential for improving the identification of vegetation damage (Simes et al., 2024). The indices commonly used for vegetation monitoring rely on the spectral response of light reflection driven by variances in photosynthetic activity of plant tissues and can reveal the actual structure and health status of such tissues (Carvajal-Ramírez et al., 2019; Szpakowski and Jensen, 2019). Moreover, the red-edge (REG) portion of the spectrum was shown to improve the discrimination of burn severity over a wider range of canopy densities (Colson et al., 2018; Fernández-Manso et al., 2016; Delegido et al., 2013; Szpakowski et al., 2023).
The efficiency of satellite products is restricted by the real-time weather conditions that are present during image collection. The 5-day interval provided by Sentinel-2 led to improvements in temporal resolution, but its capabilities for observing land surface and burnt areas depend on clear skies (Chuvieco et al., 2019). Furthermore, satellite data may lack the appropriate spatial resolution to allow the observation of fires on a small scale (Pádua et al., 2020), thus impairing the analysis and interpretation of fine-scale patterns. Unoccupied aerial vehicles, commonly known as drones, have been increasingly utilized in multiple fire management efforts due to the capabilities of such vehicles to provide data at the centimeter levels of spatial resolution and offer more adaptable and systematic acquisition schedules in addition to presenting the potential for integration with multiple sensors (Colomina and Molina, 2014; Toth and Józków, 2016; McKenna et al., 2017; Fernández-Guisuraga et al., 2018). Recent studies have shown that when drones are compared with satellites, the drones are more suitable for mapping small-scale fires with better accuracy (see Simes et al., 2024; Arkin et al., 2023; Pérez-Rodríguez et al., 2019) and also offer a cost-effective alternative compared to other platforms (De Swaef et al., 2021; Hunt Jr et al., 2013).
While several spectral indices have demonstrated efficacy in classifying fire damage (see Fornacca et al., 2018; Tran et al., 2019; Carvajal-Ramírez et al., 2019), the necessity to develop indices focusing on drone-borne sensors that are capable of directly describing the impacts of fire on vegetation and surface characteristics, similar to the Normalized Burn Ratio ([NBR] García and Caselles, 1991), exists. A few variants, such as the Differenced NBR ([dNBR]; Veraverbeke et al., 2010) and the Relative differenced NBR ([RdNBR]; Miller and Thode, 2007), utilize temporal differences between pre- and post-fire conditions to reduce misclassifications (Carvajal-Ramírez et al., 2019). However, using satellite images in multi-temporal approaches requires the availability of pairs of images within a given time period that allows the contrasting pre- and post-fire surfaces to be observed. The need for image pairs usually limits this type of approach in locations or periods with infrequent image availability (Veraverbeke et al., 2010; Weber et al., 2009). For drones, a multi-temporal approach can only be applied to prescribed fires (Pérez-Rodríguez et al., 2019) or used at locations with long-term monitoring programs (Arroyo-Vargas et al., 2019) at which pre-fire conditions have been previously monitored. Another limitation of employing drones for fire assessment is sensor specification, which is usually designed for monitoring vegetation in agricultural environments. Visible, near-infrared (NIR) and red-edge (REG) wavelengths are the most commonly available bands on these sensors (Deng et al., 2018). Previous studies argue that REG and NIR data should lead to improvements in the performance of such indices (Fernández-Manso et al., 2016; Hamilton et al., 2023). Therefore, employing these bands and identifying patterns and features from their relationships in the spectral space is essential for developing target-oriented indices (Salas and Henebry, 2013).
In this context, there is a clear need for a drone-based index that enables rapid fire damage assessment using standard spectral bands and mono-temporal surveys focused on single post-fire scenes (Veraverbeke et al., 2012; Picotte et al., 2020). Such developments would enable quicker post-fire evaluations and produce more interpretable results and valuable information for decision-makers, thereby optimizing resource allocation (Cruz et al., 2016; Restas, 2015). This study developed and tested a novel spectral index that addresses these requirements for mapping fire damage. Our study demonstrates its application in an Estonian peatland while comparing its performance with other traditionally used indices. Additionally, correlations with biophysical variables, such as surface temperature, soil moisture, and aboveground biomass (AGB), were examined to provide ecological validation and demonstrate their usefulness for post-fire assessments.
2 Methods
2.1 Study sites
The study was conducted at two sites within the Lavassaare Nature Reserve in Pärnu County, West Estonia (Figure 1). It included an area affected by a fire on 31 May 2020, which had spread from a peat extraction field towards Lake Lavassaare and caused damage to approximately 87 ha of the reserve, of which 53.4 ha (61% of the total burnt area) were surveyed. In total, the surveyed area covered by these two sites amounted to 95 ha.
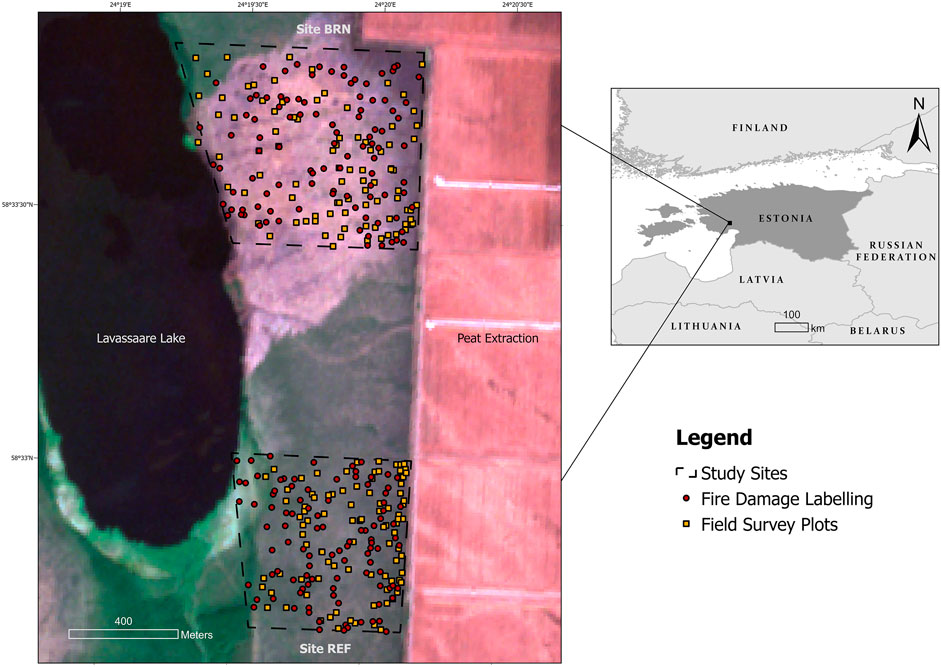
Figure 1. Locations of field survey plots and points for labelling fire damage within the study sites; site BRN = the area damaged by the fire, and REF = the undamaged area. The background true-color imagery was created using a cloud-free composite from Sentinel-2, covering the period from June to October 2020.
The sites were separated from the peat extraction site by a peat embankment 10–15 m wide. The terrain in the study sites is mostly flat with a height variation of approximately 4 m. The peat layer in the area is reported to be between 0.5 and 1.4 m thick and is primarily composed of Sphagnum angustifolium (Russ.) C. Jens., S. magellanicum Bridel., and S. rubellum Wilson. The height of the water table varies seasonally; during the dry season, it ranges from 5 to 15 cm below the surface, while in the rainy and snowmelt seasons, it can be 5–20 cm above ground level (Paal, 2011).
Vegetation in the area consists primarily of low-moss habitats with sparse trees and shrubs. A preliminary assessment indicated that the vegetation primarily includes the following plant species: Calluna vulgaris (L.) Hull, Rhynchospora alba (L.) Vahl, Andromeda polifolia L.,Rhododendron tomentosum, Betula nana L., B. pubescens Ehrh., and Pinus sylvestris L.
According to weather data from the Estonian Meteorological and Hydrological Institute (Estonian Weather Service, 2021), the long-term average annual temperature in Pärnu County is 6.3 °C with fluctuations ranging from −4.5 °C to 18 °C. The average yearly precipitation is 746 mm, with monthly values varying between 37 mm and 83 mm. Previous studies of Estonian wetlands have reported average soil moisture values around 60%–98% (Burnside et al., 2007; Ward et al., 2016).
2.2 Drone surveys
Five drone surveys were carried out over each site: an exploratory survey on 3 June 2020 over a fraction of the fire-damaged site (BRN), on 16 July 2020 over both sites, on 25 September 2020 over the undamaged site (used as the reference), on 2 October 2020 over the site BRN, and on 16 May 2021 over both sites. Thus, data collection occurred 3, 46, 117, 124, and 350 days after the fire.
A fixed-wing eBee X equipped with a Sensor Optimized for Drone Applications (S.O.D.A.) camera and a Parrot Sequoia multispectral sensor were used to conduct the surveys. The S.O.D.A. camera, which was designed for photogrammetric analysis, has a resolution of 20 megapixels and specific settings for exposure and ISO. The Parrot Sequoia captures images at 1.2 megapixels in four spectral bands: green (530–570 nm), red (640–680 nm), REG (730–740 nm), and NIR (770–810 nm).
Flight planning and post-processing were conducted using eMotion Release 3.16.0, which ensured autonomous flight missions with expected spatial resolutions of 3.5 cm/pixel resolution for S.O.D.A. and 10 cm/pixel for Parrot Sequoia. Specifically, flights utilizing S.O.D.A. were conducted with the following parameters: a flying altitude of 154.6 m above ground level (AGL), 80% lateral overlap, and 90% longitudinal overlap. For multispectral flights using the Parrot Sequoia, the parameters were set to a flying altitude of 106.1 m AGL, with 65% lateral overlap and 80% longitudinal overlap. Flights were designed along parallel lines with adjustments for wind direction to ensure image capture consistency. An onboard Global Navigation Satellite System receiver with Real-Time and Post-Processed Kinematics capabilities ensured data accuracy. Post-processing was conducted using differential correction data from the Estonian Land Board’s virtual reference stations (Metsar et al., 2018) based on methodologies that have demonstrated improved accuracy over traditional ground control points (Tomaštík et al., 2019).
2.3 Field surveys of biophysical variables
In each of the last four drone surveys, biophysical variables (such as Surface Soil Moisture, Surface Soil Temperature, Surface Temperature, and AGB) were measured within 30 quadrats with dimensions of 30 × 30 cm2 for a total of 90 measurements. These data were collected immediately after the drone flights on the same days. This sampling followed an unsystematic design (Figure 1) due to site remoteness and difficulties in accessing some regions. For Surface Soil Moisture and Temperature, three measurements using a Delta-T WET Sensor within each quadrat were recorded, and the averages of these records were considered a sample. Specifically for moisture measurements, the WET sensor calculates the volumetric water content in the soil, which is the ratio between the weight of water and the solids in a given mass of soil sample, and therefore retrieves measurements of soil moisture as a percentage (Burnside et al., 2007; Berg et al., 2012; Ward et al., 2016). The manufacturer’s suggested parameters for organic soil were used for the measurements since they return similar values to using media-specific calibration (Kargas et al., 2011). Surface Temperature was measured using a handheld infrared laser thermometer (Fluke 62), similar to one used by Martínez et al. (2017). The authors suggest this indicator may also be a surrogate for describing leaf surface temperature when used in vegetated areas. For each sample, three measurements were recorded and averaged within a quadrat. The AGB samples were collected within the quadrat and used to describe the amount of dry matter of vascular plants expressed as g/m2. The collected plant material was dried for 48 h at 80 °C in an oven and weighed with a regular scale (Monreal et al., 2005). Finally, the XYZ coordinates were recorded within all quadrats using a Trimble R10 dGPS (Trimble, Sunnyvale, CA, United States of America).
2.4 Drone image processing
Distinct workflows for processing the drone images were implemented using the software Pix4D Mapper v. 4.3.27 (Pix4D, Lausanne, Switzerland). To process the S.O.D.A dataset and generate the true-color orthomosaics, we set a full tie-point image scale for initial processing, high point density, a minimum of three tie-points per processed image, and point densification based on half of the image scale. The high-density option for this task was chosen to minimize the occurrence of occlusions in scene reconstruction (Dandois et al., 2015; Fraser and Congalton, 2018). To process the Parrot Sequoia images and generate reflectance maps, we set a full tie-point image scale, a target for 10,000 key points and geometrical verification of matches for initial processing, an optimal point density, a minimum of three tie-points per processed image, and radiometric correction was performed using an Airinov white-balance target recorded before each multispectral flight.
2.5 Development of the triangular-area indices (TAI) and calculation of spectral indices
The spectral indices were calculated based on data from reflectance maps generated from the radiometrically corrected Parrot Sequoia imagery. Each monochromatic band allows describing distinct features related to vegetation structural and physiological alterations caused by fire. For example, the red and green bands are affected by changes in photosynthetic activity after fire events (Rogan and Yool, 2001). The REG band exhibits high sensitivity to changes in vegetation structure and pigment concentration (Imran et al., 2020), effectively capturing the physiological responses of vegetation to stress induced by fire events (Eitel et al., 2011). Lastly, the NIR band reflects changes in leaf cellular structure and water content (Fernández-Manso et al., 2016; Imran et al., 2020), which is particularly meaningful for determining severely burned areas and estimating biomass consumption (Hamilton et al., 2023). In addition, their combined use allows the index to capture a broader range of fire damage effects than single-band or two-band indices. Bi-dimensional relationships between spectral bands enable the correction for the effects of illumination and soil properties, thereby increasing sensitivity to specific parameters (Sripada et al., 2006). For instance, the red–NIR dimension describes plant fractional cover under varying soil conditions and vegetation densities (Veraverbeke et al., 2012), while the difference between NIR and green bands has shown higher sensitivity to chlorophyll than single-band indices (Sripada et al., 2006). For this reason, these bands were considered for the TAI formulation due to their complementary sensitivities to fire-induced changes in vegetation physiology and structure.
The triangular-area indices (TAI) proposed in this study should be useful for exploring the variability of the area enclosed between three given coordinates in the spectral signature, capturing the geometric relationships between reflectance values that reflect distinct physiological responses to fire. Thus, this method allows for integrating multiple vegetation traits into a single metric and hence the identification of patterns or features from the shape of the reflectance curve that are not identifiable from other types of spectral indices (Salas and Henebry, 2013). The TAI was chosen as it allows for more information inclusion than those indices using normalized difference or soil-line adjustments while simplifying its interpretability (Xing et al., 2019; Salas and Henebry, 2013), which is particularly relevant in post-fire environments, where vegetation responses are complex and heterogeneous. From this perspective, the proposed TAIs are similar to the Transformed Triangular Vegetation Index (TTVI) developed by Xing et al. (2019). In Xing and colleagues’ investigation, the TTVI focused on estimating leaf area index (LAI) in wheat crops using information based on the infrared and red-edge reflectance from Sentinel-2, which aimed to minimize the influence of confounding factors in their application. Therefore, the use of TAIs is expected to enhance the interpretability of fire damage by linking spectral geometry to ecological processes, supporting a more meaningful classification and assessment of fire damage.
The four combinations of TAI are displayed in Table 1, which lists all the spectral indices used in this study. This set of used indices was selected after considering previous applications and their relevance in describing biophysical gradients (Joiner et al., 2018; Mutanga and Skidmore, 2004; Villoslada et al., 2022; Vincini and Frazzi, 2011). These products were generated at a spatial resolution of 15 cm. In such a way, we used both reflectance maps of the spectral bands (namely, ρRED, ρNIR, ρGREEN, and ρREG) and the spectral indices as explanatory variables for the classification of fire-damage levels.
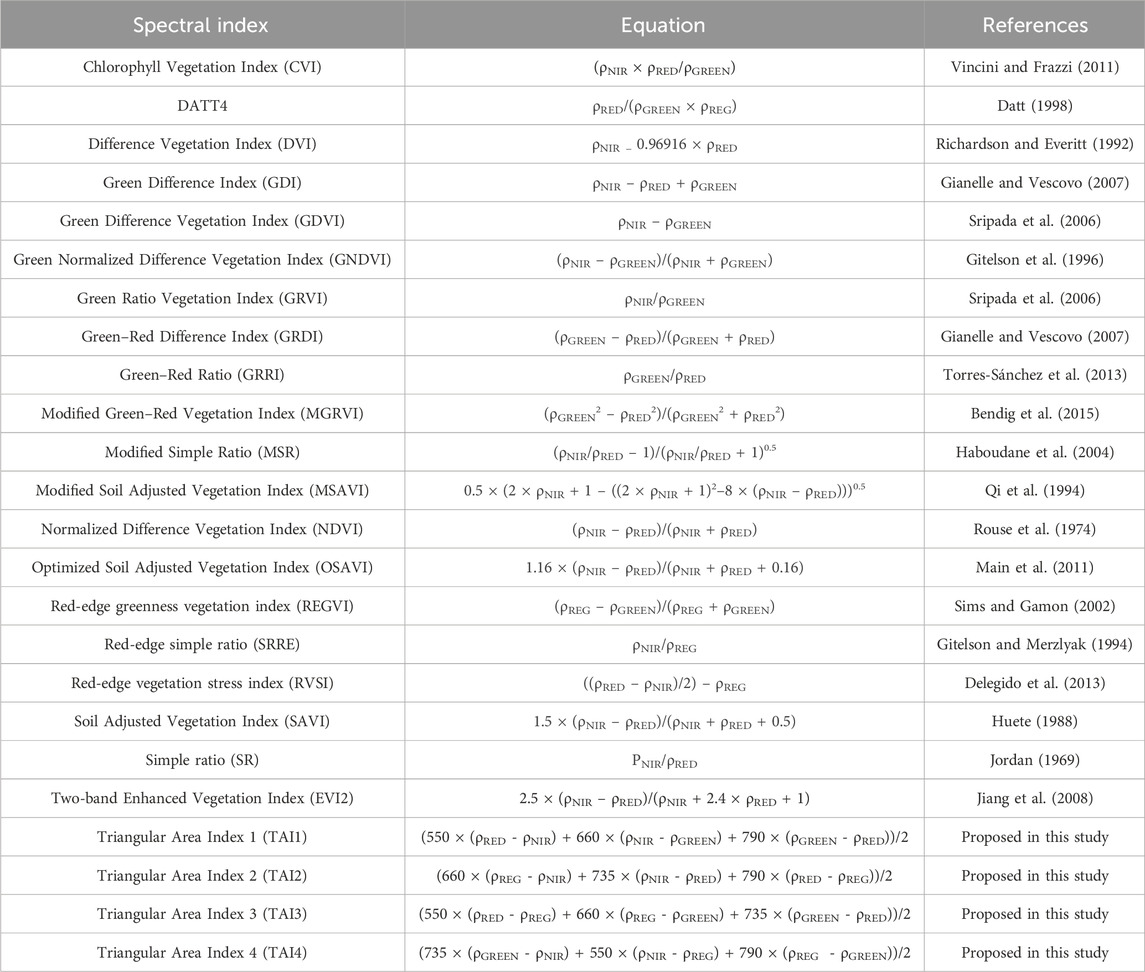
Table 1. List of spectral indices used as input variables. ρNIR refers to the reflectance value in the near-infrared band, ρRED to the reflectance value in the red band, ρGREEN to the reflectance value in the green band, and ρREG to the reflectance value in the red-edge band.
2.6 Collation of the fire-damage dataset
Through visual interpretation of the true color orthomosaics, 100 points were randomly assigned per site and then labelled within damage classes for each surveyed date. The sampling design aimed to place these points consistently across surveys to monitor temporal changes in fire damage. As a result, the proportions of damage classes changed over time, reflecting the natural progression of post-fire recovery. This design choice prioritized ecological realism and temporal consistency rather than artificial class balancing. However, we acknowledge that a more balanced distribution across classes would enhance the generalizability of our findings (Collins et al., 2020).
The assignment of damage labels was performed based on two distinct approaches: a binary classification (Tran et al., 2020) and a multi-level classification (McKenna et al., 2017; Simes et al., 2024). The binary classification discriminated between ‘unburnt’ and ‘burnt’, and the multi-level approach included the following damage classes: ‘unburnt’, ‘partially damaged’ (i.e., burned but without ash or charcoal cover) and ‘consumed’ (i.e., with ash or charcoal cover). Figure 2 displays examples of the classes that were assigned based on these approaches.
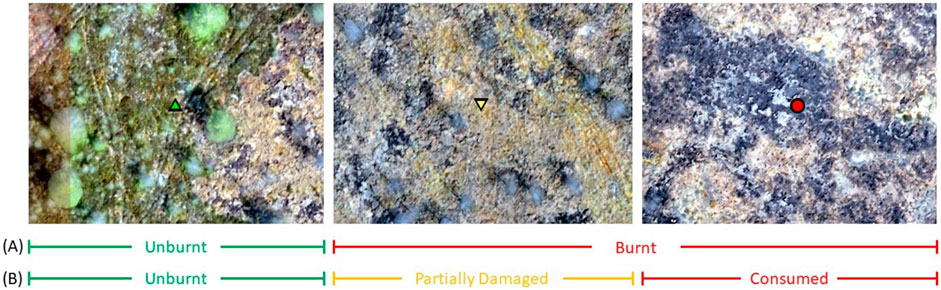
Figure 2. Examples of vegetation condition in the true-color orthomosaics for the assignment of fire-damage classes using: (A) the binary approach and (B) the multi-level approach.
Nevertheless, it is worth highlighting that due to the partial mapping of the site BRN at the survey on 3 June 2020, only 57 points were labelled. In this way, 657 samples were generated for the four survey dates. The values of the indices and reflectance were extracted within a 900-cm2 buffer around the recorded geolocations to match the data from the field survey. Last, the dataset was split into training and validation samples, for which 70% of the points were used for model training and 30% for validation analysis.
2.7 Data analysis
Decision Trees using single indices or bands were generated using the training dataset. Subsequently, the splitting thresholds for each index were applied to classify the validation dataset and compared through confusion matrices. To assess the classification accuracy, the commonly used metrics for overall accuracy, Kappa coefficient, and F1-score (i.e., the harmonic mean of precision and recall) from ‘caret’ (Kuhn, 2008) and ‘MLmetrics’ (Yan, 2015) packages, respectively, were selected and calculated in R. To evaluate per-class accuracies and detect potential misclassifications between classes, sensitivity (namely, the rate of true positives) and specificity (namely, the true negative rate in a confusion matrix; Nhu et al., 2020) were also calculated. The overall accuracy represents the proportion of samples that are correctly classified relative to the total number of samples in the test set. The Kappa coefficient measures the degree of agreement between the predicted classifications and the true values, highlighting the difference between actual agreement and agreement that could occur by chance. Sensitivity quantifies the proportion of actual positive cases that are correctly identified by the model. Specificity evaluates the accuracy of the model in predicting negative cases, which is defined as the ratio of true negative predictions to the total number of actual negatives in the dataset. The F1-score offers a balanced measure of a model’s predictive performance by considering both the proportion of correct predictions among all predictions for a specific class (i.e., precision) and the proportion of correct predictions out of all actual positive instances of each class individually (i.e., recall). The F1-score is particularly valuable when class distributions are imbalanced (Jeni et al., 2013). Class accuracy indicates the number of correctly classified instances for each distinct class, thus allowing for a more refined assessment of the algorithm’s performance across different categories. Finally, Spearman’s correlation coefficient (r) was calculated to assess the relationship between the spectral indices and the biophysical variables.
3 Results
3.1 Description of the dataset and the construction of the TAIs
The training dataset for the binary classification contained 55.8% ‘burnt’ and 44.2% ‘unburnt’ vegetation. For validation, 38.6% of the labelled points were considered ‘burnt’, and 61.4% were considered ‘unburnt’. The training dataset for the multi-level approach included 31.3% of ‘consumed’, 24.4% of ‘partially damaged’, and 44.3% of ‘unburnt’ vegetation. The validation dataset contained 15.9%, 17.8%, and 66.3% of ‘consumed’, ‘partially damaged’, and ‘unburnt’ vegetation, respectively.
It was observed that the visible bands (ρRED and ρGREEN) were the most useful for distinguishing ‘consumed’ from ‘partially damaged’ vegetation (Figure 3). On the other hand, ρNIR and ρREG were better for distinguishing ‘consumed’ from ‘unburnt’ classes when compared with the visible bands. However, the overlapping variability of these bands suggests that they are likely to present limitations in differentiating between ‘partially damaged’ and ‘consumed’ vegetation.
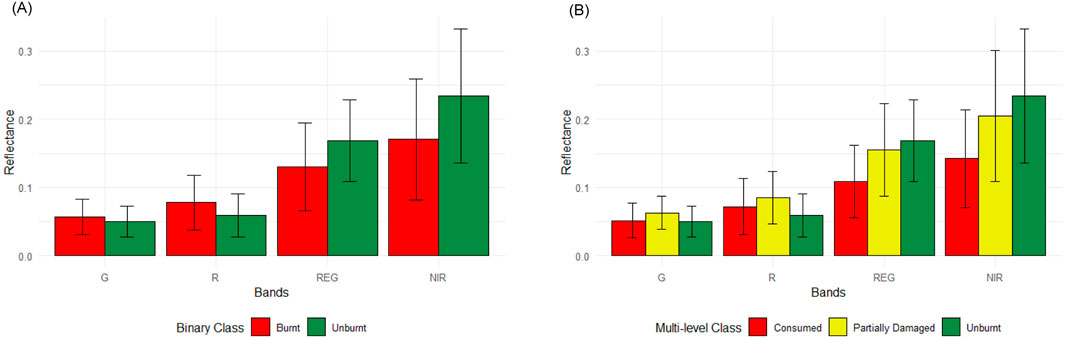
Figure 3. Average reflectance values for each optical band within the fire-damage classes. (A) binary and (B) multi-level approaches. Error bars represent the standard deviation within each class.
Figure 4 illustrates the triangular area formed by the average of each damage level using different bands. It appears that using two bands in the visible range can highlight the differences between them. In contrast, the inclusion of both NIR and REG bands seems to separate ‘burnt’ from ‘unburnt’ classes, but there was little difference between areas for each damage level.
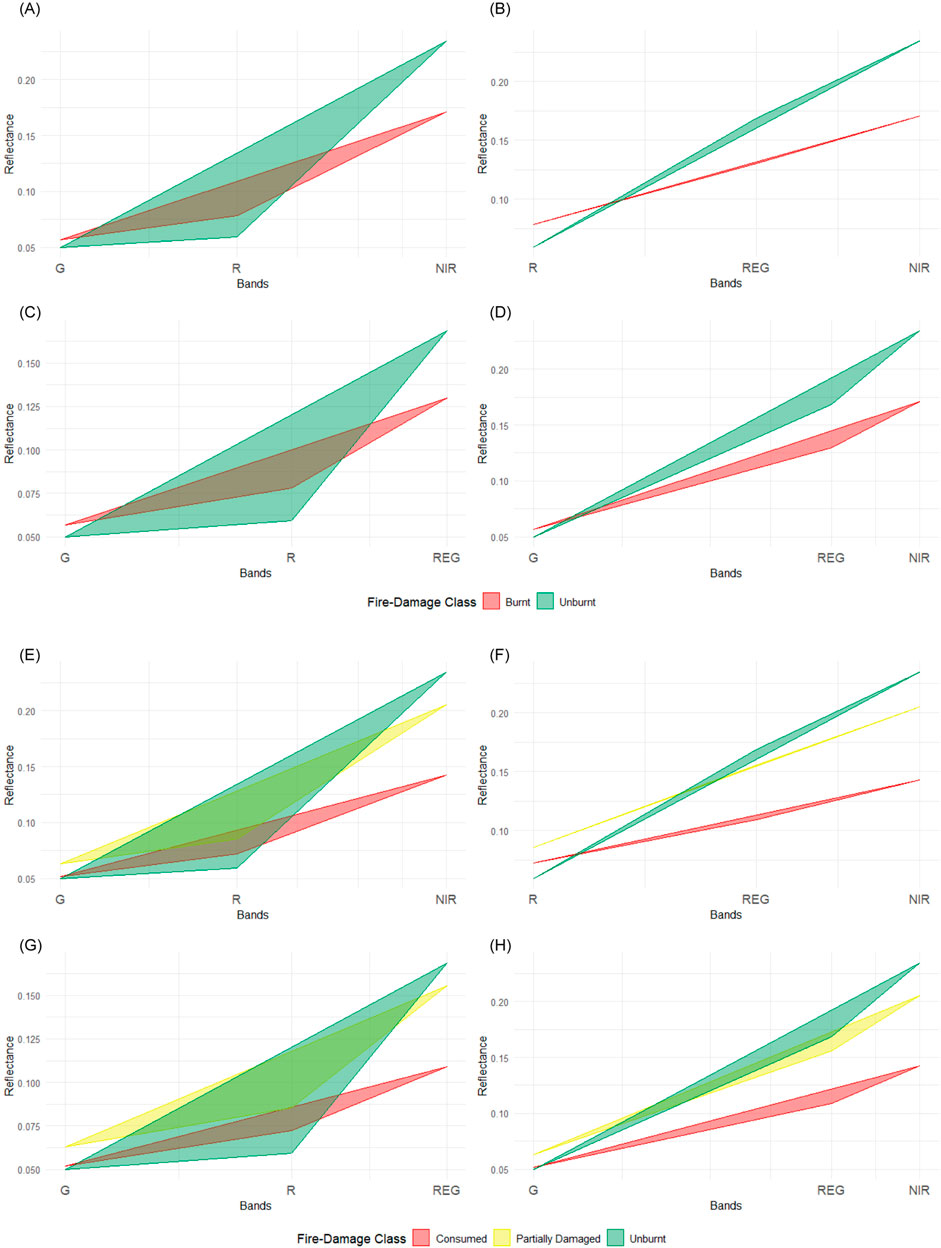
Figure 4. Visual representation of the Triangular-Area Indices (TAI) concerning the fire-damage classes based on the binary and multi-level approaches. (A) TAI1, (B) TAI2, (C) TAI3 and (D) TAI4 when applying the binary classification of fire-damage. (E) TAI1, (F) TAI2, (G) TAI3 and (H) TAI4 when applying the multi-level classification of fire-damage.
Considering the limitations on differentiating between damage levels, the spectral indices allowed better separation of the damage levels when compared with the individual reflectance bands. In this perspective, the binary classification provided better separation among classes (Figure 5). For the multi-level approach, indices including NIR (such as normalized difference vegetation index [NDVI], optimized soil adjusted vegetation index [OSAVI], and enhanced vegetation index [EVI2]) were likely to have an improved differentiation capability when compared with others (Figure 6). In both approaches, the TAI seemed to lead to a reduction in variability among damage classes, especially for ‘consumed’ vegetation.
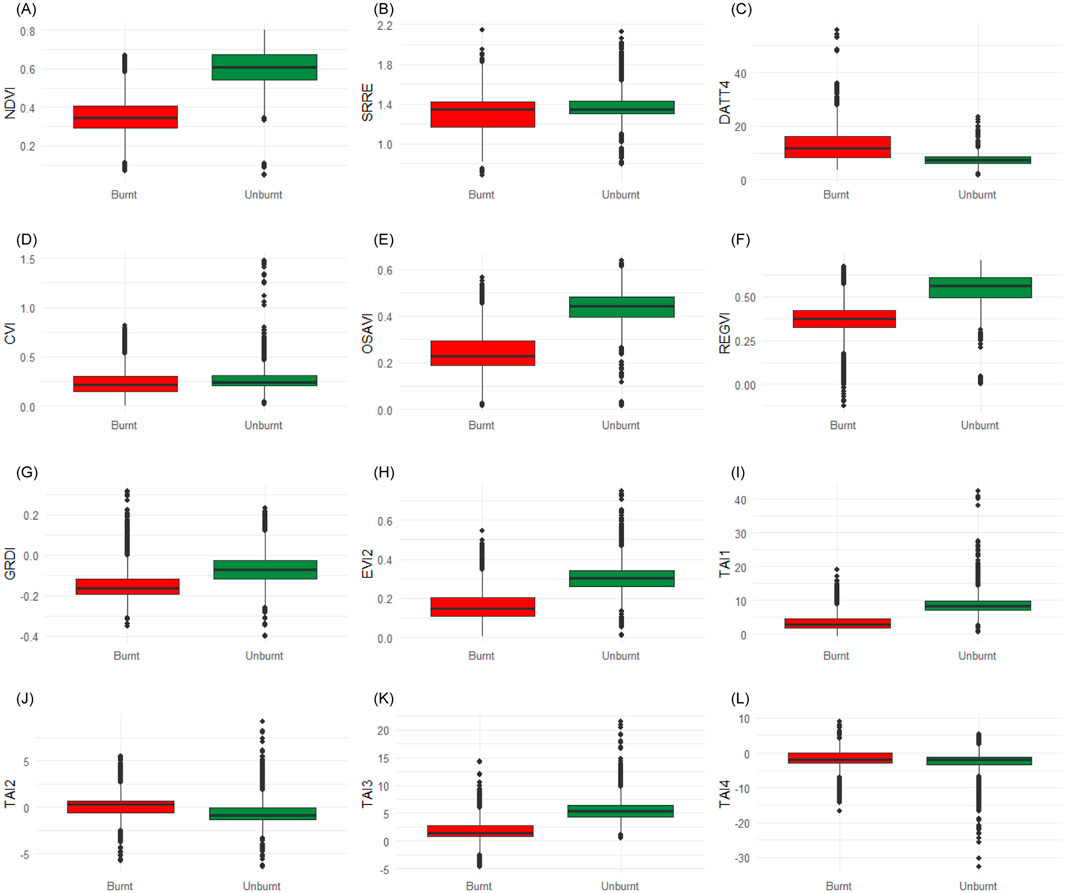
Figure 5. Examples of box-plots of the distribution of vegetation indices for the fire-damage classes based on the binary approach. (A) NDVI, (B) SRRE, (C) DATT4, (D) CVI, (E) OSAVI, (F) REGVI, (G) GRDI, (H) EVI2, (I) TAI1, (J) TAI2, (K) TAI3, and (L) TAI4.
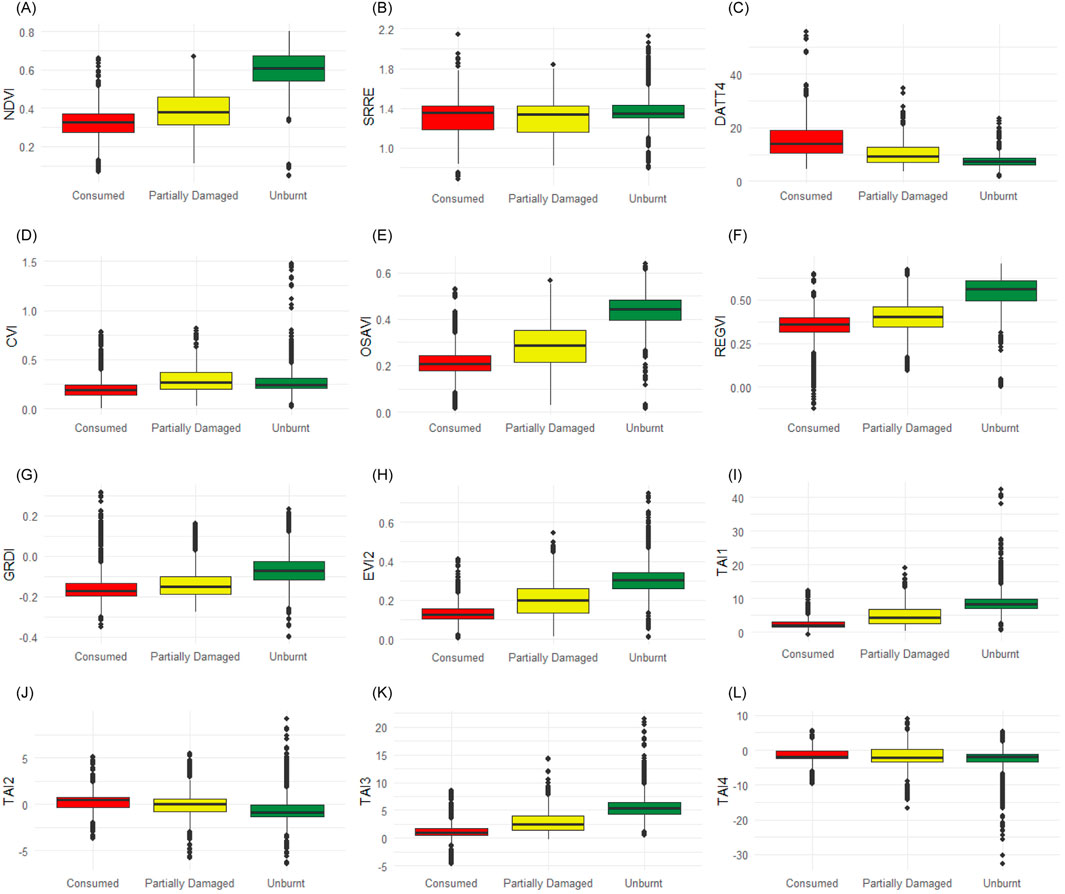
Figure 6. Examples of box-plots of the distribution of vegetation indices for the fire-damage classes based on the multi-level approach. (A) NDVI, (B) SRRE, (C) DATT4, (D) CVI, (E) OSAVI, (F) REGVI, (G) GRDI, (H) EVI2, (I) TAI1, (J) TAI2, (K) TAI3, and (L) TAI4.
3.2 Performance of the decision tree classifiers
The accuracy metrics of the Decision Trees using single variables were calculated from the confusion matrices. Table 2 displays the top six Decision Trees with the highest overall accuracy for the binary approach. NDVI and simple ratio (SR) had the best overall accuracies as they correctly assigned 93.6% of the validation data. The best TAI was TAI1 with an accuracy of 90.9%. Figure 7 shows the decision rules and splitting thresholds applied in each of the best classifiers for the binary classification. In addition, the capability of TAI1 to distinguish fire damage classes was slightly lower than conventional vegetation indices, such as NDVI, SR, and modified simple ratio (MSR). For example, TAI1 achieved a sensitivity of 0.846 and specificity of 0.948 in the overall binary classification. These values are marginally lower than those observed for NDVI and MSR, which consistently achieved sensitivity and specificity above 0.926 and 0.943, respectively.
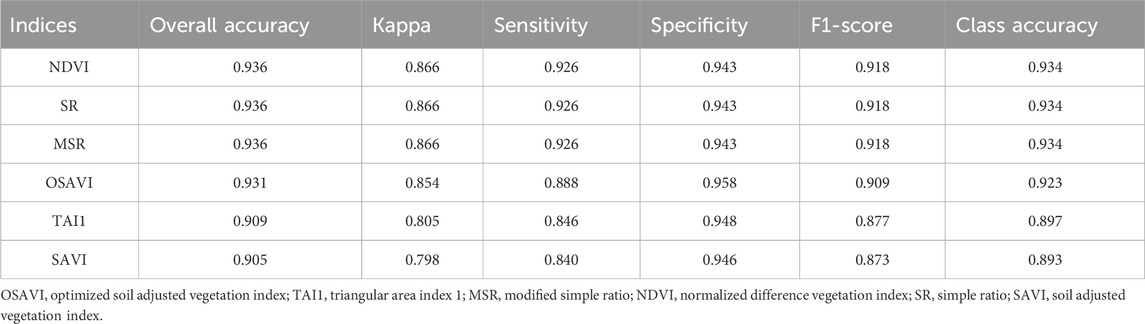
Table 2. Summary of the performance metrics of the six best Decision Tree classifiers for the binary classification of fire-damage based on the validation dataset. Sensitivity, Specificity, and F1-score refer to the class ‘burnt’, which was defined as the positive class in the classifier.
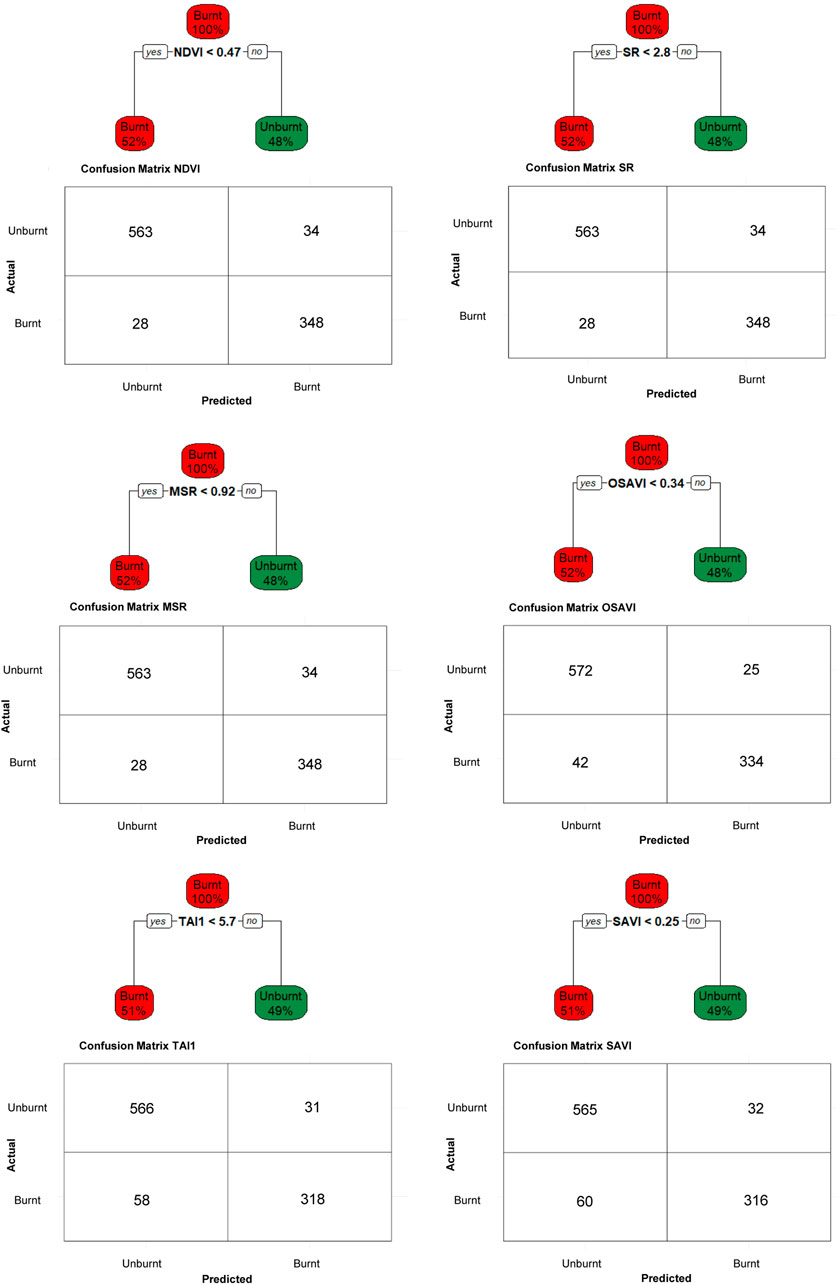
Figure 7. Illustration of the six best Decision Tree Classifiers and their respective confusion matrices for the binary classification of fire-related damage.
Similarly, the application of the same indices showed good performance when differentiating between multiple levels of fire damage (Table 3). OSAVI and TAI1 had the best values for overall accuracy. These indices could differentiate between the three fire-damage classes with an accuracy of 80.6%. While OSAVI was more efficient in detecting ‘partially damaged’ vegetation, TAI1 was more accurate at detecting ‘consumed’ and differentiating it from other levels. The results also demonstrated the suitability of TAI1 in classifying specific fire damage classes. For ‘consumed’ vegetation, TAI1 demonstrated high sensitivity (0.871) and F1-score (0.771) and outperformed OSAVI, SAVI, and MSR in sensitivity, suggesting it has strong potential for identifying damage at this level. However, TAI1 had poor capability to differentiate ‘partially damaged’ vegetation from the other classes. Despite this limitation, TAI1 consistently achieved comparable performance indicators across the fire damage classes compared to conventional indices. Figure 8 shows the decision rules and splitting thresholds applied in each of the best classifiers.
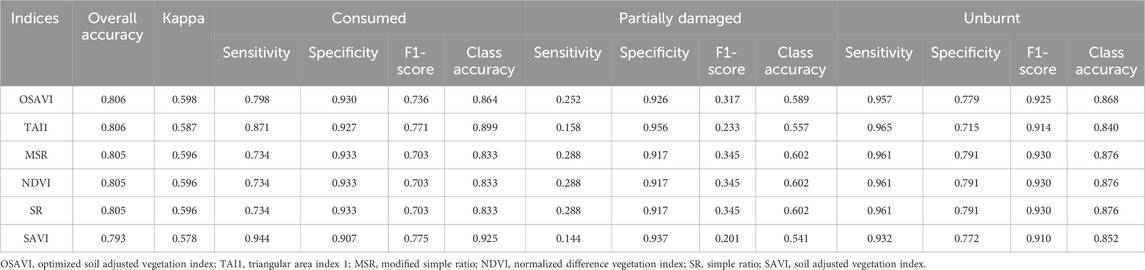
Table 3. Summary of the performance metrics of the six best Decision Tree classifiers for the multi-level classification of fire-damage based on the validation dataset.
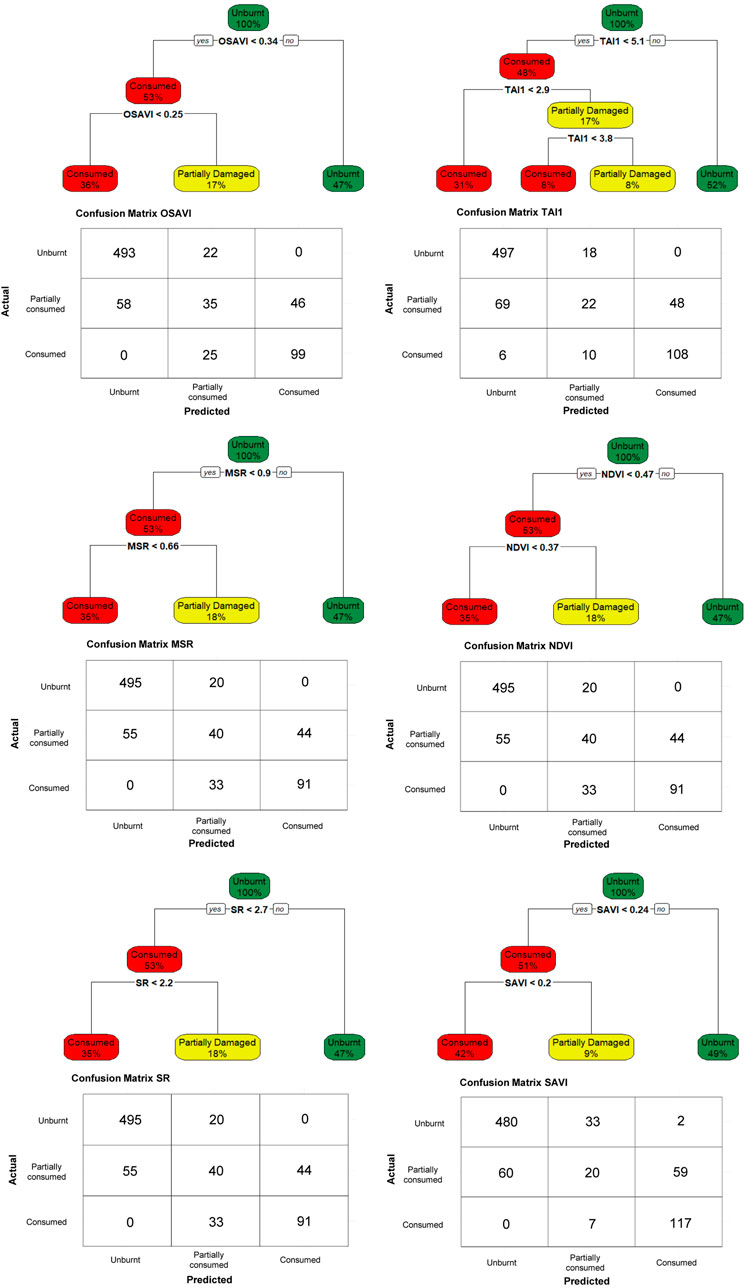
Figure 8. Illustration of the six best Decision Tree Classifiers and their respective confusion matrices for the multi-level classification of fire-related damage.
By comparing both tables, it can be observed that the algorithms for the binary classification retrieved slightly higher accuracy metrics. In addition, the proposed TAI1 was found to have one of the best performances among the tested indices for both classification approaches of fire damage. Supplementary Tables S1, S2 provide the complete performance summary of the Decision Tree classifiers for the binary and multi-level classification approaches, respectively.
3.3 Correlation with biophysical variables
Among the biophysical variables measured at the monitoring sites, aboveground biomass, land surface, and soil temperatures were found to correlate with TAI1 values. The strongest correlation (r = 0.51) was observed for AGB. Surface and Soil Temperatures negatively correlated with TAI1 (r values of −0.28 and −0.21, respectively). Soil Moisture showed no statistically significant correlation with the best-performance TAI. Figure 9 displays the scatterplots of the relationship between these variables and TAI1. TAI3 also yielded moderate correlation coefficients, with the biophysical variables with correlations ranging between −0.27 (with Surface Temperature) and 0.56 (with AGB). Furthermore, GRDI, MGRVI, and GRRI had the strongest correlations with AGB (r = 0.64), yet were slightly weaker in comparison to the correlation with TAI1. Surface and Soil Temperatures had the strongest correlations (−0.28 and −0.20, respectively) with DVI and MSAVI. The CVI and TAI4 showed the strongest correlations with Soil Moisture (0.14 and −0.14, respectively). Supplementary Table S3 presents the complete list of correlation coefficients for the biophysical variables based on the validation dataset.
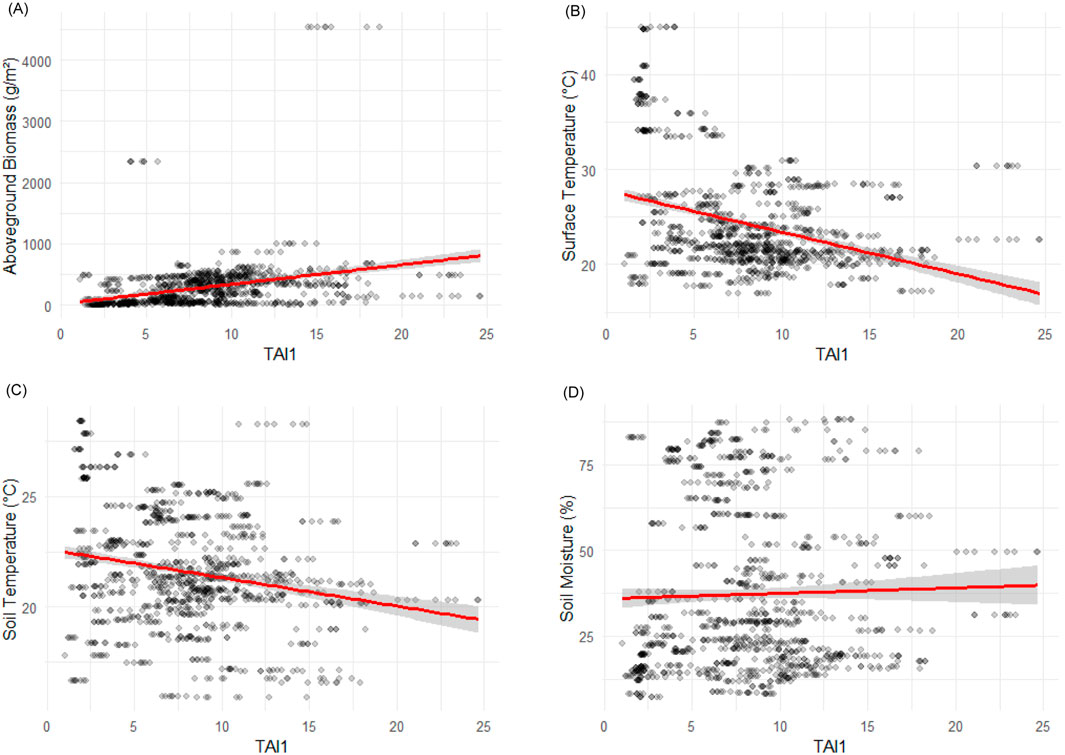
Figure 9. Scatterplots of TAI1 and the biophysical indicators (A) aboveground biomass, (B) surface temperature, (C) soil temperature, and (D) soil moisture. Linear trends and confidence intervals are displayed in the plots.
4 Discussion
4.1 Comparison with past applications
The performance of Decision Trees combined with TAI1 for detecting burnt areas and differentiating between fire damage levels was comparable to other applications using more complex machine learning techniques. In this regard, previous applications (see Beltrán-Marcos et al., 2021; Brook et al., 2022; Fraser et al., 2017; Pla et al., 2017; Simes et al., 2024; Woo et al., 2021) obtained accuracies between 44.0% and 99.9%, while the classifications using TAI1 yielded accuracies ranging between 80.6% and 90.9% using different classification approaches.
To illustrate the detection of burnt areas using binary classification approaches, the outstanding accuracy of 99.9% obtained by Fraser et al. (2017) was achieved using a thresholding algorithm on the values of a visible-based index (Excess Greenness Index) to separate affected from unaffected areas. Cruz et al. (2016) and Simes et al. (2024) also demonstrated the superiority of this type of index compared to multispectral ones for binary classifications. In these examples, the clear differences between burnt and unburnt surfaces allowed this approach to achieve high accuracy. Thus, using indicators that discriminate brighter from darker surfaces was efficient for separating such surfaces. Therefore, these findings suggest that simpler sensors are likely more suitable for performing this kind of task in contrast to those requiring complex datasets.
Regarding multi-level approaches, Simes et al. (2024) combined seven RGB and multispectral indices to detect and classify burnt areas and their corresponding severities based on support vector machine and random forest (RF) algorithms. While the RF models achieved a 96.6% overall accuracy for the burnt area classification, the models using only red–green–blue data encountered limitations while attempting to differentiate between damage classes. Similar misclassifications in certain severity levels were also observed in Pérez-Rodríguez et al. (2019) and Brook et al. (2022), especially in moderate damage classes. It has been reported that vegetation with this level of damage exhibits spectral characteristics that closely resemble those of bare soil (Pádua et al., 2020), especially when associated with agricultural harvests (van Dijk et al., 2021).
The results of the present study achieved up to 80.6% overall accuracy. When specifically considering other indices, Shin et al. (2019) applied a thresholding approach to NDVI values and achieved an overall accuracy of 71% to differentiate between multiple levels of fire severity in specific components of vegetation. Compared to this example, the application of thresholds on both NDVI and TAI1 yielded better differentiation between fire damage. In contrast, Pérez-Rodríguez et al. (2019) could only achieve a statistically significant separation of damage classes when using the values of the difference between the reflectance in the NIR and red wavelengths; the NDVI only allowed for differentiating between fire damage in binary classification approaches. These findings regarding the application of the TAI indices suggest that this type of index is suitable for both methodologies of fire-damage classification by allowing both the detection of burned areas and the discrimination of damage levels.
4.2 Potential contributions of TAI1 and other triangular-area indices
Given the capability of the TAIs to differentiate between damage classes caused by fire, these indices slightly underperformed when compared with the conventional ones after application in binary classification approaches (Table 2). The results, especially in those presented in Table 3, highlight the potential of using TAI1 for targeted applications, particularly in multi-level classification approaches contingent on improvements in its capability to differentiate between moderately affected vegetation, particularly the ‘partially damaged’ class defined in the current study. The conventional indices showed better performance for detecting this level of damage. The confusion between severity classes has been a recurring challenge in studies assessing fire effects (see McKenna et al., 2017; Carvajal-Ramírez et al., 2019; Pérez-Rodríguez et al., 2019; Simes et al., 2024) and may be caused by multiple factors (Morgan et al., 2014). Despite this confusion, it is worth mentioning that TAI1’s strengths lie in its capability to detect and classify ‘consumed’ vegetation. For this damage class, the higher sensitivity and F1-score, in addition to the reduced variability observed in Figures 6I, indicate an improved capacity to detect the most severely affected locations, which is especially important for post-fire assessments and recoveries (Viana-Soto et al., 2017). This capability may contribute to the detection of severely burnt areas, which is beneficial for supporting prioritization of areas for reforestation, erosion control, biodiversity conservation and enhancement of their efficacy (Vallejo et al., 2012).
In addition, the results demonstrate that TAI1 correlated with most biophysical variables and had some of the strongest coefficients considering the other spectral indices under assessment. In general, TAIs effectively captured features related to the effects wildfires may have on the environment, as demonstrated by the correlation analysis. Similarly, other studies have also linked spectral indices to fire-related biophysical variables (see Beltrán-Marcos et al., 2021; Talucci et al., 2020; Fraser et al., 2017). For example, Fraser et al. (2017) investigated the usefulness of drone-derived mapping techniques for assessing biophysical indicators of burn severity. The authors demonstrate their ability to estimate the proportions of charred surfaces and residual green vegetation by utilizing the NBR and its variant forms. These indices had an explanatory power of at least 69% of the indicators’ variability. The NBR mostly relies on the short-term spectral responses due to biomass amounts and moisture variations in leaves that were caused by fire (Chuvieco et al., 2020). However, clouds, water, and specific land covers may present similar behaviors in the spectral bands employed by this index and promote an increase in the rate of false positives (Alcaras et al., 2022).
Thus, drones offer spatial resolution imagery at the centimeter level, allowing the detection of fine-scale heterogeneity in fire damage that might be overlooked by coarser satellite data. This improvement is especially valuable in environments where fire effects can vary over short distances (Simes et al., 2024). Furthermore, these platforms offer improved flexibility and on-demand data acquisition, thereby overcoming one of the main limitations of satellite data, namely, the need for prompt observation (Afira and Wijayanto, 2022). Compared to satellite-based applications, drones can support mono-temporal assessments with very-high spatial resolution, reducing the dependency on prior surveys (Veraverbeke et al., 2012). Although several studies have demonstrated that indices derived from the differences between pre- and post-fire reflectance exhibit enhanced performance compared to mono-temporal indices (see Carvajal-Ramírez et al., 2019; Fraser et al., 2017) and the improvement offered by their capacity to reduce variability from confounding factors (Veraverbeke et al., 2010; 2011), it is important to note, however, that the decision to use either a mono- or multi-temporal approach is dependent on the availability of satellite scenes, the timing of post-fire assessments, and the specific objectives of the survey (Royet al., 2002; Fraser et al., 2017). In this context, Fraser et al. (2017) discussed that mono-temporal indices effectively characterize environmental properties at a specific moment in time, while multi-temporal indices are more suitable for capturing changes induced by fire on these properties. Consequently, the application of mono-temporal approaches relies on the establishment and optimization of their correlation with other indicators of fire-induced environmental alterations, which would allow for promptly differentiating between burned and unburned locations (Mpakairi et al., 2020). Therefore, the application of spectral indices in mono-temporal approaches appears to be a suitable alternative for rapid assessments of fire damage on vegetation, and their interpretation may be enhanced when integrated into multi-temporal frameworks.
These findings are especially relevant considering the potential of an ecological meaning for the index, which enhances the interpretability of fire damage. Ecologically validated spectral indices derived from drone-acquired data may contribute to rapid and high-resolution assessments of vegetation health and pattern, thus promoting a comprehensive understanding of the impact of fires on ecosystems (Arroyo-Vargas et al., 2019). These data are expected to support the monitoring of post-fire vegetation recovery (Nolè et al., 2022; Talucci et al., 2020) in addition to facilitating improvements in models for fire behavior and impacts (McNamara and Mell, 2022). Thus, TAI1 can contribute to condition and degradation monitoring efforts by providing ecologically relevant information and enhancing the interpretation of fire damage beyond simple detection.
4.3 Limitations and challenges
The poor capability to separate ‘partially damaged’ and ‘unburnt’ vegetation may be explained by physiological responses due to water stress, which often cannot be dissociated from fire-induced impacts on vegetation (Hislop et al., 2023). As a result, the spectral response of these two classes of damage likely overlaps, making it difficult to distinguish between drought stress caused by climate variations and the effects of fire. One aspect that may assist in differentiating between sources of drought stress in this situation could be a better understanding of the time lag and duration of physiological responses, which are usually less immediate and shorter in duration in weather-induced drought stress (Ahmed et al., 2017; Ji et al., 2021). Furthermore, Carvajal-Ramírez et al. (2019) identified significant challenges when differentiating between medium and high-severity classifications, in contrast to the confusion between low and medium severity responses. This difficulty may correspond to the ‘partially damaged’ and ‘consumed’ classes that are delineated in the current study. These divergent findings indicate that additional efforts should focus on understanding the factors and mechanisms causing this confusion in intermediate severity classes.
Assessments using mono-temporal indices face several limitations, particularly concerning the temporal window accessible for observation through remote sensing tools. For instance, Fraser et al. (2017) highlighted that ash cover on burnt surfaces can be rapidly removed by wind and precipitation; this process underscores the need for timely surveys immediately following fire events, a finding that is corroborated by Pádua et al. (2020). Consequently, these inconsistencies suggest the need to establish an optimal post-fire temporal window for conducting drone surveys to enhance the characterization of fire damage levels. Additionally, Veraverbeke et al. (2010) discussed the importance of accounting for the temporal dimension in fire severity assessments by considering factors such as phenological changes and vegetation recovery in the evaluation. In this context, the dataset utilized in the present study addresses the temporal aspect of fire damage effectively, as it encompasses observations made on multiple post-fire dates (3, 46-, 117-, 124-, and 350-day). To date, such comprehensive temporal coverage of fire damage conditions using drones has not been undertaken previously. Thus, the findings of the present study integrate potential changes in environmental conditions and the varying phenological stages of vegetation into the analysis, thereby offering more nuanced data for the development of indices tailored to quantify fire damage over time.
Class imbalance in the validation dataset may have negatively impacted the model’s ability to distinguish between ‘partially damaged’ and ‘unburnt’ vegetation. The validation dataset contained a higher proportion of ‘unburnt’ samples, which likely biased the classifier in favor of the dominant class. This imbalance can reduce both the sensitivity and precision for minority classes, particularly for ‘partially damaged’ vegetation, thus increasing the risk of misclassification errors. To mitigate this issue, the F1-score was included in the analysis (Jeni et al., 2013). In addition, although the training dataset was relatively more balanced, the varying proportions observed, driven by natural ecological recovery across different surveys, introduced natural variability, which was intentionally preserved to reflect realistic post-fire conditions. While this design reflects realistic post-fire conditions, it emphasizes the need for caution when interpreting classification performance, particularly regarding intermediate damage levels. Future research may benefit from employing stratified sampling or resampling techniques to address the challenges posed by class imbalance. Such methodologies could enhance the robustness and predictive performance of multi-level classification models (Boschetti et al., 2016).
4.4 Practical implications and future directions
The results demonstrated that the proposed TAI1 had similar or higher performance than traditionally employed spectral indices for detecting burnt areas and differentiating between fire damage levels. Determining thresholds using Decision Trees allowed for enhancing the differentiation between the identified classes in the models derived from the training data. This approach facilitated a more refined characterization of damage categories addressing specific local conditions (McKenna et al., 2017). This technique was chosen for assessing the proposed indices due to the enhanced interpretability that it offers. Shin et al. (2019) have corroborated that utilizing NDVI thresholding for the classification of fire severity yields superior results when compared to conventional supervised classification methods. Nonetheless, additional efforts are necessary to test and validate the established thresholds to enable their generalization across different regions, seasons, environmental contexts, and data sources (Barbosa et al., 1998; Farhadi et al., 2022; Roy et al., 2002). In this regard, the current research specifically retrieved empirical thresholds suitable for distinguishing burnt areas and levels of fire damage in a peatland utilizing drone-based data. Specifically, this study contributes to the development of a transferable framework for monitoring and assessment efforts, thereby enhancing the efficiency of resource allocation and methodological consistency for researchers and practitioners operating in diverse locations and contexts.
While machine learning and other techniques of supervised classification require a substantial level of input for their implementation, their use can be optimized by exploring automated procedures for tuning parameters to enhance their performance. There are several automated methods for the selection of the optimal parameterization (e.g., Lee et al., 2022; Li et al., 2022; Simes et al., 2024), mostly using frameworks for implementing grid searches of the optimal parameters based on cross-validation. However, this type of procedure is usually time-consuming and may not yield transferable or generalizable frameworks (Bischl et al., 2023; Probst et al., 2019), focusing mainly on maximizing model fit to the available data. Therefore, the decision between employing a more explicit methodology and opting for one that prioritizes higher accuracy will largely depend on the specific objectives of the research. Moreover, multiple approaches could be explored for minimizing the confusion of fire damage classes and hence the inclusion of false-positive delineations into assessments. In this context, Hislop et al. (2023) proposed a method for distinguishing phenological changes from physiological responses caused by droughts and fires using deviations from baseline NBR values to overcome the limitations regarding the confusion between damage levels. Another alternative for improving the delineation of burned areas using a binary approach would be using burned-pixel seeds, as described by Roteta et al. (2019). This procedure leverages the distinct spectral signal of the ‘consumed’ vegetation to reduce commission errors in the delineation using a binary approach. Thus, this approach could diminish the inclusion of false positive results caused by the similarity of the spectral signal between stressed vegetation and burnt surfaces. Finally, combining multiple indices for identifying burnt surfaces may improve the detection of burned surfaces, leveraging the strengths of individual indices for the classification and improving the overall accuracy while keeping the framework simple to implement and interpret (Brown et al., 2018; Colson et al., 2018; Carvajal-Ramírez et al., 2019; Fan et al., 2024).
In summary, further research and evaluations are necessary to address the variations in scales, sensors, and environmental contexts to confirm the interchangeability potential of TAI1 for mapping fire damage. Such validation would clarify the extent to which these indices can characterize biophysical responses resulting from fire events and the potential for generalizing the classification thresholds established in this study. Alternatively, it may be necessary to determine site-specific values tailored to distinct regions and periods (Shin et al., 2019). Moreover, it is crucial to highlight the potential of utilizing satellite data to evaluate the efficacy of the TAI indices. For instance, Pádua et al. (2020) demonstrated that drone and satellite imagery provided comparable levels of accuracy in monitoring burned areas within the same geographic region. This finding suggests that TAI1 could be effectively applied for identifying fire-affected landscapes over larger geographic scales. The spatial and temporal resolution offered by satellites may mitigate several limitations associated with drone-based assessments, including confusion between different damage classes and environmental features, in addition to the lack of comparative analysis with pre-fire conditions (Pérez-Rodríguez et al., 2019; Arroyo-Vargas et al., 2019; Pontes-Lopes et al., 2022). Thus, the relevance of TAIs could be demonstrated at broader spatiotemporal scales and could be integrated as a complementary indicator in fire damage assessments using this type of data.
5 Conclusion
This study evaluated the potential of novel TAI for assessing fire damage levels in vegetation. The findings demonstrate that TAIs led to an improvement in the differentiation of fire damage levels, particularly in the binary classification approach. Compared to raw reflectance values, spectral indices produced an enhancement in discrimination performance, with indices incorporating NIR (NDVI, OSAVI, and EVI2) showing superior results. The best-performing decision tree classifiers achieved high accuracy, as NDVI and SR achieved 93.6% accuracy in binary classification, while TAI1 performed consistently well in both binary and multi-level classification schemes. For multi-level classification, OSAVI and TAI1 yielded the highest accuracies (80.6%), with TAI1 excelling in detecting ‘consumed’ vegetation. However, it showed reduced capability in identifying ‘partially damaged’ vegetation. Despite this limitation, TAI1 achieved comparable performance to conventional indices, reinforcing its suitability for fire damage assessment. Moreover, correlation analysis revealed that TAI1 was significantly associated with biophysical variables, particularly AGB (r = 0.51), while surface and soil temperatures exhibited negative correlations. These findings highlight its potential for retrieving more refined characterizations of fire damage, particularly for identifying the most severely affected areas. Its reliability in detecting ‘consumed’ vegetation indicates its potential as a valuable tool for prioritizing post-fire recovery actions, such as erosion control and reforestation efforts. Overall, the results indicate that integrating traditional vegetation indices with novel TAIs can enhance fire damage classification, supporting post-fire monitoring efforts and ecological assessments. Its application using drone data improves the spatial resolution of fire damage assessments, facilitating the detection of short-term vegetation changes and supporting adaptive management strategies, which is relevant for accurately mapping fire severity in heterogeneous landscapes. These platforms also offer the potential for more frequent data collection, enhancing the temporal resolution of monitoring efforts, particularly for monitoring post-fire vegetation recovery dynamics, enabling the detection of short-term changes and informing adaptive management strategies. Continued refinement of these indices, particularly in improving their capacity to differentiate between intermediate damage levels (e.g., ‘partially damaged’ vegetation), is essential for improving their effectiveness and applicability in practical contexts. Further research is necessary to assess the interchangeability of TAI1 across various scales, sensors, and environmental contexts, as this research will provide insight into the generalizability of the indices and their potential applicability across diverse geographic regions. Additionally, exploring satellite data to extend the spatial applicability of TAI1 could significantly enhance the practical utility of these indices and address some of the inherent limitations associated with drone-based assessments.
Data availability statement
The raw data supporting the conclusions of this article will be made available by the authors, without undue reservation.
Author contributions
RD: Conceptualization, Data curation, Formal Analysis, Investigation, Methodology, Validation, Visualization, Writing – original draft, Writing – review and editing. KS: Funding acquisition, Writing – review and editing.
Funding
The author(s) declare that financial support was received for the research and/or publication of this article. This article was supported by the European Regional Development Fund within the Estonian National Program for Addressing Socio-Economic Challenges through R&D (RITA): L180283PKKK, and the Doctoral School of Earth Sciences and Ecology (Estonian University of Life Sciences ASTRA project “Value-chain based bio-economy”).
Acknowledgments
The authors thank Kaja Orupõld for her support and collaboration in providing the materials and equipment for measuring the biomass samples.
Conflict of interest
The authors declare that the research was conducted in the absence of any commercial or financial relationships that could be construed as a potential conflict of interest.
Generative AI statement
The author(s) declare that no Generative AI was used in the creation of this manuscript.
Any alternative text (alt text) provided alongside figures in this article has been generated by Frontiers with the support of artificial intelligence and reasonable efforts have been made to ensure accuracy, including review by the authors wherever possible. If you identify any issues, please contact us.
Publisher’s note
All claims expressed in this article are solely those of the authors and do not necessarily represent those of their affiliated organizations, or those of the publisher, the editors and the reviewers. Any product that may be evaluated in this article, or claim that may be made by its manufacturer, is not guaranteed or endorsed by the publisher.
Supplementary material
The Supplementary Material for this article can be found online at: https://www.frontiersin.org/articles/10.3389/fenvs.2025.1685279/full#supplementary-material
References
Afira, N., and Wijayanto, A. W. (2022). Mono-temporal and multi-temporal approaches for burnt area detection using Sentinel-2 satellite imagery (a case study of rokan hilir regency, Indonesia). Ecol. Inf. 69, 101677. doi:10.1016/j.ecoinf.2022.101677
Ahmed, M., Else, B., Eklundh, L., Ardö, J., and Seaquist, J. (2017). Dynamic response of NDVI to soil moisture variations during different hydrological regimes in the Sahel Region. Int. J. Remote Sens. 38 (19), 5408–5429. doi:10.1080/01431161.2017.1339920
Alcaras, E., Costantino, D., Guastaferro, F., Parente, C., and Pepe, M. (2022). Normalized burn ratio plus (NBR+): a new index for Sentinel-2 imagery. Remote Sens. 14 (7), 1727. doi:10.3390/rs14071727
Arkin, J., Coops, N. C., Daniels, L. D., and Plowright, A. (2023). A novel post-fire method to estimate individual tree crown scorch height and volume using simple RPAS-Derived data. Fire Ecol. 19 (1), 17. doi:10.1186/s42408-023-00174-7
Arroyo-Vargas, P., Fuentes-Ramírez, A., Muys, B., and Pauchard, A. (2019). Impacts of fire severity and cattle grazing on early plant dynamics in old-growth araucaria-nothofagus forests. For. Ecosyst. 6 (1), 44. doi:10.1186/s40663-019-0202-2
Barbosa, P. M., Pereira, J. M. C., and Grégoire, J. M. (1998). Compositing criteria for burned area assessment using multitemporal low resolution satellite data. Remote Sens. Environ. 65 (1), 38–49. doi:10.1016/S0034-4257(98)00016-9
Bastarrika, A., Rodriguez-Montellano, A., Roteta, E., Hantson, S., Franquesa, M., Torre, L., et al. (2024). An automatic procedure for mapping burned areas globally using Sentinel-2 and VIIRS/MODIS active fires in google Earth engine. ISPRS J. Photogrammetry Remote Sens. 218, 232–245. doi:10.1016/j.isprsjprs.2024.08.019
Beltrán-Marcos, D., Suarez-Seoane, S., Fernández-Guisuraga, J. M., Fernandez-Garcia, V., Pinto, R., Garcia-Llamas, P., et al. (2021). Mapping soil burn severity at very high spatial resolution from unmanned aerial vehicles. Forests 12 (2), 179. doi:10.3390/f12020179
Bendig, J., Yu, K., Aasen, H., Bolten, A., Bennertz, S., Broscheit, J., et al. (2015). Combining UAV-Based plant height from crop surface models, visible, and near infrared vegetation indices for biomass monitoring in barley. Int. J. Appl. Earth Observation Geoinformation 39, 79–87. doi:10.1016/j.jag.2015.02.012
Berg, M., Joyce, C., and Burnside, N. (2012). Differential responses of abandoned wet grassland plant communities to reinstated cutting management. Hydrobiologia 692 (1), 83–97. doi:10.1007/s10750-011-0826-x
Bischl, B., Binder, M., Lang, M., Pielok, T., Richter, J., Coors, S., et al. (2023). Hyperparameter optimization: foundations, algorithms, best practices, and open challenges. Wiley Interdiscip. Rev. Data Min. Knowl. Discov. 13 (2), e1484. doi:10.1002/widm.1484
Boschetti, L., Stehman, S. V., and Roy, D. P. (2016). A stratified random sampling design in space and time for regional to global scale burned area product validation. Remote Sens. Environ. 186, 465–478. doi:10.1016/j.rse.2016.09.016
Brook, A., Hamzi, S., Roberts, D., Ichoku, C., Shtober-Zisu, N., and Wittenberg, L. (2022). Total carbon content assessed by UAS near-infrared imagery as a new fire severity metric. Remote Sens. 14 (15), 3632. doi:10.3390/rs14153632
Brown, A. R., Petropoulos, G. P., and Ferentinos, K. P. (2018). Appraisal of the Sentinel-1 and 2 use in a large-scale wildfire assessment: a case study from Portugal's fires of 2017. Appl. Geogr. 100, 78–89. doi:10.1016/j.apgeog.2018.10.004
Burnside, N. G., Joyce, C. B., Puurmann, E., and Scott, D. M. (2007). Use of vegetation classification and plant indicators to assess grazing abandonment in Estonian coastal wetlands. J. Veg. Sci. 18 (5), 645–654. doi:10.1111/j.1654-1103.2007.tb02578.x
Carvajal-Ramírez, F., Marques da Silva, J. R., Agüera-Vega, F., Martínez-Carricondo, P., Serrano, J., and Moral, F. J. (2019). Evaluation of fire severity indices based on pre-and post-fire multispectral imagery sensed from UAV. Remote Sens. 11 (9), 993. doi:10.3390/rs11090993
Chuvieco, E., Mouillot, F., Van der Werf, G. R., San Miguel, J., Tanase, M., Koutsias, N., et al. (2019). Historical background and current developments for mapping burned area from satellite Earth observation. Remote Sens. Environ. 225, 45–64. doi:10.1016/j.rse.2019.02.013
Chuvieco, E., Aguado, I., Salas, J., García, M., Yebra, M., and Oliva, P. (2020). Satellite remote sensing contributions to wildland fire science and management. Curr. For. Rep. 6 (2), 81–96. doi:10.1007/s40725-020-00116-5
Collins, L., McCarthy, G., Mellor, A., Newell, G., and Smith, L. (2020). Training data requirements for fire severity mapping using landsat imagery and random forest. Remote Sens. Environ. 245, 111839. doi:10.1016/j.rse.2020.111839
Colomina, I., and Molina, P. (2014). Unmanned aerial systems for photogrammetry and remote sensing: a review. ISPRS J. Photogrammetry Remote Sens. 92, 79–97. doi:10.1016/j.isprsjprs.2014.02.013
Colson, D., Petropoulos, G. P., and Ferentinos, K. P. (2018). Exploring the potential of Sentinels-1 and 2 of the copernicus mission in support of rapid and cost-effective wildfire assessment. Int. J. Appl. Earth Observation Geoinformation 73, 262–276. doi:10.1016/j.jag.2018.06.011
Cruz, H., Eckert, M., Meneses, J., and Martínez, J. F. (2016). Efficient forest fire detection index for application in unmanned aerial systems (UASs). Sensors 16 (6), 893. doi:10.3390/s16060893
Dandois, J. P., Olano, M., and Ellis, E. C. (2015). Optimal altitude, overlap, and weather conditions for computer vision UAV estimates of forest structure. Remote Sens. 7 (10), 13895–13920. doi:10.3390/rs71013895
Datt, B. (1998). Remote sensing of chlorophyll A, chlorophyll B, chlorophyll a+b, and total carotenoid content in eucalyptus leaves. Remote Sens. Environ. 66 (2), 111–121. doi:10.1016/S0034-4257(98)00046-7
De Simone, W., Di Musciano, M., Di Cecco, V., Ferella, G., and Frattaroli, A. R. (2020). The potentiality of Sentinel-2 to assess the effect of fire events on mediterranean Mountain vegetation. Plant Sociol. 57, 11–22. doi:10.3897/pls2020571/02
De Swaef, T., Maes, W. H., Aper, J., Baert, J., Cougnon, M., Reheul, D., et al. (2021). Applying RGB-And thermal-based vegetation indices from UAVs for high-throughput field phenotyping of drought tolerance in forage grasses. Remote Sens. 13 (1), 147. doi:10.3390/rs13010147
Delegido, J., Verrelst, J., Meza, C. M., Rivera, J. P., Alonso, L., and Moreno, J. (2013). A red-edge spectral index for remote sensing estimation of green LAI over agroecosystems. Eur. J. Agron. 46, 42–52. doi:10.1016/j.eja.2012.12.001
Deng, L., Mao, Z., Li, X., Hu, Z., Duan, F., and Yan, Y. (2018). UAV-Based multispectral remote sensing for precision agriculture: a comparison between different cameras. ISPRS J. Photogrammetry Remote Sens. 146, 124–136. doi:10.1016/j.isprsjprs.2018.09.008
Eitel, J. U., Vierling, L. A., Litvak, M. E., Long, D. S., Schulthess, U., Ager, A. A., et al. (2011). Broadband, red-edge information from satellites improves early stress detection in a New Mexico conifer woodland. Remote Sens. Environ. 115 (12), 3640–3646. doi:10.1016/j.rse.2011.09.002
Estonian Weather Service (2021). Climate normals. Available online at: http://www.ilmateenistus.ee/kliima/kliimanormid/ohutemperatuur/?lang=en (Accessed May 18, 2021).
Fan, J., Yao, Y., Tang, Q., Zhang, X., Xu, J., Yu, R., et al. (2024). A hybrid index for monitoring burned vegetation by combining image texture features with vegetation indices. Remote Sens. 16 (9), 1539. doi:10.3390/rs16091539
Farhadi, H., Mokhtarzade, M., Ebadi, H., and Beirami, B. A. (2022). Rapid and automatic burned area detection using sentinel-2 time-series images in google Earth engine cloud platform: a case study over the andika and behbahan regions, Iran. Environ. Monit. Assess. 194 (5), 369. doi:10.1007/s10661-022-10045-4
Fernandez-Anez, N., Krasovskiy, A., Müller, M., Vacik, H., Baetens, J., Hukić, E., et al. (2021). Current wildland fire patterns and challenges in Europe: a synthesis of national perspectives. Air, Soil Water Res. 14, 11786221211028185. doi:10.1177/11786221211028185
Fernández-Guisuraga, J. M., Sanz-Ablanedo, E., Suárez-Seoane, S., and Calvo, L. (2018). Using unmanned aerial vehicles in postfire vegetation survey campaigns through large and heterogeneous areas: opportunities and challenges. Sensors 18 (2), 586. doi:10.3390/s18020586
Fernández-Manso, A., Fernández-Manso, O., and Quintano, C. (2016). SENTINEL-2A red-edge spectral indices suitability for discriminating burn severity. Int. J. Appl. Earth Observation Geoinformation 50, 170–175. doi:10.1016/j.jag.2016.03.005
Flannigan, M. D., Krawchuk, M. A., de Groot, W. J., Wotton, B. M., and Gowman, L. M. (2009). Implications of changing climate for global wildland fire. Int. J. Wildland Fire 18 (5), 483–507. doi:10.1071/WF08187
Fornacca, D., Ren, G., and Xiao, W. (2018). Evaluating the best spectral indices for the detection of burn scars at several post-fire dates in a mountainous region of northwest Yunnan, China. Remote Sens. 10 (8), 1196. doi:10.3390/rs10081196
Fraser, B. T., and Congalton, R. G. (2018). Issues in unmanned aerial systems (UAS) data collection of complex forest environments. Remote Sens. 10 (6), 908. doi:10.3390/rs10060908
Fraser, R. H., Van der Sluijs, J., and Hall, R. J. (2017). Calibrating satellite-based indices of burn severity from UAV-Derived metrics of a burned boreal forest in NWT, Canada. Remote Sens. 9 (3), 279. doi:10.3390/rs9030279
García, M. L., and Caselles, V. (1991). Mapping burns and natural reforestation using thematic mapper data. Geocarto Int. 6 (1), 31–37. doi:10.1080/10106049109354290
Gianelle, D., and Vescovo, L. (2007). Determination of green herbage ratio in grasslands using spectral reflectance. Methods and ground measurements. Int. J. Remote Sens. 28 (5), 931–942. doi:10.1080/01431160500196398
Gitelson, A., and Merzlyak, M. N. (1994). Spectral reflectance changes associated with autumn senescence of Aesculus hippocastanum L. and Acer platanoides L. leaves. Spectral features and relation to chlorophyll estimation. J. Plant Physiology 143 (3), 286–292. doi:10.1016/S0176-1617(11)81633-0
Gitelson, A. A., Kaufman, Y. J., and Merzlyak, M. N. (1996). Use of a green channel in remote sensing of global vegetation from EOS-MODIS. Remote Sens. Environ. 58 (3), 289–298. doi:10.1016/S0034-4257(96)00072-7
Haboudane, D., Miller, J. R., Pattey, E., Zarco-Tejada, P. J., and Strachan, I. B. (2004). Hyperspectral vegetation indices and novel algorithms for predicting green LAI of crop canopies: modeling and validation in the context of precision agriculture. Remote Sens. Environ. 90 (3), 337–352. doi:10.1016/j.rse.2003.12.013
Hamilton, D., Gibson, W., Harris, D., and McGath, C. (2023). Evaluation of multi-spectral band efficacy for mapping wildland fire burn severity from PlanetScope imagery. Remote Sens. 15 (21), 5196. doi:10.3390/rs15215196
Hislop, S., Stone, C., Gibson, R. K., Roff, A., Choat, B., Nolan, R. H., et al. (2023). Using dense Sentinel-2 time series to explore combined fire and drought impacts in eucalypt forests. Front. For. Glob. Change 6, 1018936. doi:10.3389/ffgc.2023.1018936
Huete, A. R. (1988). A soil-adjusted vegetation index (SAVI). Remote Sens. Environ., 25(3), 295–309. doi:10.1016/0034-4257(88)90106-X
Hunt Jr, E. R., Doraiswamy, P. C., McMurtrey, J. E., Daughtry, C. S., Perry, E. M., and Akhmedov, B. (2013). A visible band index for remote sensing leaf chlorophyll content at the canopy scale. Int. J. Appl. Earth Observation Geoinformation 21, 103–112. doi:10.1016/j.jag.2012.07.020
Imran, H. A., Gianelle, D., Rocchini, D., Dalponte, M., Martín, M. P., Sakowska, K., et al. (2020). VIS-NIR, red-edge and NIR-shoulder based normalized vegetation indices response to Co-Varying leaf and canopy structural traits in heterogeneous grasslands. Remote Sens. 12 (14), 2254. doi:10.3390/rs12142254
Jeni, L. A., Cohn, J. F., and De La Torre, F. (2013). “Facing imbalanced data--recommendations for the use of performance metrics,” in 2013 humaine association conference on affective computing and intelligent interaction (IEEE), 245–251. doi:10.1109/ACII.2013.47
Ji, Y., Li, Y., Yao, N., Biswas, A., Zou, Y., Meng, Q., et al. (2021). The lagged effect and impact of soil moisture drought on terrestrial ecosystem water use efficiency. Ecol. Indic. 133, 108349. doi:10.1016/j.ecolind.2021.108349
Jiang, Z., Huete, A. R., Didan, K., and Miura, T. (2008). Development of a two-band enhanced vegetation index without a blue band. Remote Sens. Environ. 112 (10), 3833–3845. doi:10.1016/j.rse.2008.06.006
Joiner, J., Yoshida, Y., Anderson, M., Holmes, T., Hain, C., Reichle, R., et al. (2018). Global relationships among traditional reflectance vegetation indices (NDVI and NDII), evapotranspiration (ET), and soil moisture variability on weekly timescales. Remote Sens. Environ. 219, 339–352. doi:10.1016/j.rse.2018.10.020
Jolly, W. M., Cochrane, M. A., Freeborn, P. H., Holden, Z. A., Brown, T. J., Williamson, G. J., et al. (2015). Climate-induced variations in global wildfire danger from 1979 to 2013. Nat. Commun. 6 (1), 7537. doi:10.1038/ncomms8537
Jordan, C. F. (1969). Derivation of leaf-area index from quality of light on the forest floor. Ecology 50 (4), 663–666. doi:10.2307/1936256
Kargas, G., Kerkides, P., Seyfried, M., and Sgoumbopoulou, A. (2011). WET sensor performance in organic and inorganic media with heterogeneous moisture distribution. Soil Sci. Soc. Am. J. 75 (4), 1244–1252. doi:10.2136/sssaj2010.0238
Keeley, J. E. (2009). Fire intensity, fire severity and burn severity: a brief review and suggested usage. Int. J. Wildland Fire 18 (1), 116–126. doi:10.1071/WF07049
Kuhn, M. (2008). Building predictive models in R using the caret package. J. Stat. Softw. 28, 1–26. doi:10.18637/jss.v028.i05
Lasaponara, R., Tucci, B., and Ghermandi, L. (2018). On the use of satellite sentinel 2 data for automatic mapping of burnt areas and burn severity. Sustainability 10 (11), 3889. doi:10.3390/su10113889
Leblon, B., Ogunjobi Oluwamuyiwa, F., Lingua, E., and LaRocque, A. (2022). Fire severity assessment of an alpine forest fire with Sentinel-2 imagery. Int. Archives Photogrammetry, Remote Sens. Spatial Inf. Sci. 43, 1115–1120. doi:10.5194/isprs-archives-XLIII-B3-2022-1115-2022
Lee, C., Park, S., Kim, T., Liu, S., Md Reba, M. N., Oh, J., et al. (2022). Machine learning-based forest burned area detection with various input variables: a case study of South Korea. Appl. Sci. 12 (19), 10077. doi:10.3390/app121910077
Li, Z., Angerer, J. P., Jaime, X., Yang, C., and Wu, X. B. (2022). Estimating rangeland fine fuel biomass in Western Texas using high-resolution aerial imagery and machine learning. Remote Sens. 14 (17), 4360. doi:10.3390/rs14174360
Main, R., Cho, M. A., Mathieu, R., O’Kennedy, M. M., Ramoelo, A., and Koch, S. (2011). An investigation into robust spectral indices for leaf chlorophyll estimation. ISPRS J. Photogrammetry Remote Sens. 66 (6), 751–761. doi:10.1016/j.isprsjprs.2011.08.001
Manisalidis, I., Stavropoulou, E., Stavropoulos, A., and Bezirtzoglou, E. (2020). Environmental and health impacts of air pollution: a review. Front. Public Health 8, 14. doi:10.3389/fpubh.2020.00014
Martínez, J., Egea, G., Agüera, J., and Pérez-Ruiz, M. (2017). A cost-effective canopy temperature measurement system for precision agriculture: a case study on sugar beet. Precis. Agric. 18 (1), 95–110. doi:10.1007/s11119-016-9470-9
McKenna, P., Erskine, P. D., Lechner, A. M., and Phinn, S. (2017). Measuring fire severity using UAV imagery in semi-arid central Queensland, Australia. Int. J. Remote Sens. 38 (14), 4244–4264. doi:10.1080/01431161.2017.1317942
McNamara, D., and Mell, W. (2022). Towards the use of remote sensing for identification of building damage, destruction, and defensive actions at wildland-urban interface fires. Fire Technol. 58 (1), 641–672. doi:10.1007/s10694-021-01170-6
Metsar, J., Kollo, K., and Ellmann, A. (2018). Modernization of the Estonian national GNSS reference station network. Geodesy Cartogr. 44 (2), 55–62. doi:10.3846/gac.2018.2023
Miller, J. D., and Thode, A. E. (2007). Quantifying burn severity in a heterogeneous landscape with a relative version of the Delta normalized burn ratio (dNBR). Remote Sens. Environ. 109 (1), 66–80. doi:10.1016/j.rse.2006.12.006
Monreal, C. M., Etchevers, J. D., Acosta, M., Hidalgo, C., Padilla, J., López, R. M., et al. (2005). A method for measuring above-and below-ground C stocks in hillside landscapes. Can. J. Soil Sci. 85 (Special Issue), 523–530. doi:10.4141/S04-086
Morgan, P., Keane, R. E., Dillon, G. K., Jain, T. B., Hudak, A. T., Karau, E. C., et al. (2014). Challenges of assessing fire and burn severity using field measures, remote sensing and modelling. Int. J. Wildland Fire 23 (8), 1045–1060. doi:10.1071/WF13058
Mpakairi, K. S., Ndaimani, H., and Kavhu, B. (2020). Exploring the utility of Sentinel-2 MSI derived spectral indices in mapping burned areas in different land-cover types. Sci. Afr. 10, e00565. doi:10.1016/j.sciaf.2020.e00565
Mutanga, O., and Skidmore, A. K. (2004). Narrow band vegetation indices overcome the saturation problem in biomass estimation. Int. J. Remote Sens. 25 (19), 3999–4014. doi:10.1080/01431160310001654923
Nhu, V. H., Mohammadi, A., Shahabi, H., Ahmad, B. B., Al-Ansari, N., Shirzadi, A., et al. (2020). Landslide susceptibility mapping using machine learning algorithms and remote sensing data in a tropical environment. Int. J. Environ. Res. Public Health 17 (14), 4933. doi:10.3390/ijerph17144933
Nolè, A., Rita, A., Spatola, M. F., and Borghetti, M. (2022). Biogeographic variability in wildfire severity and post-fire vegetation recovery across the European forests via remote sensing-derived spectral metrics. Sci. Total Environ. 823, 153807. doi:10.1016/j.scitotenv.2022.153807
Ostroukhov, A., Klimina, E., Kuptsova, V., and Naito, D. (2022). Estimating long-term average carbon emissions from fires in non-forest ecosystems in the temperate belt. Remote Sens. 14 (5), 1197. doi:10.3390/rs14051197
Paal, J. (2011). “Jääksood, nende kasutamine ja korrastamine,” in Eesti turbaliit. 1st ed. Tartu, Estonia.
Pádua, L., Guimarães, N., Adão, T., Sousa, A., Peres, E., and Sousa, J. J. (2020). Effectiveness of sentinel-2 in multi-temporal post-fire monitoring when compared with UAV imagery. ISPRS Int. J. Geo-Information 9 (4), 225. doi:10.3390/ijgi9040225
Palm, E. C., Suitor, M. J., Joly, K., Herriges, J. D., Kelly, A. P., Hervieux, D., et al. (2022). Increasing fire frequency and severity will increase habitat loss for a boreal forest indicator species. Ecol. Appl. 32 (3), e2549. doi:10.1002/eap.2549
Pérez-Rodríguez, L. A., Quintano, C., García-Llamas, P., Fernández-García, V., Taboada, A., Fernández-Guisuraga, J. M., et al. (2019). “Using unmanned aerial vehicles (UAV) for forest damage monitoring in south-western Europe,”, 11130. SPIE, 117–123. doi:10.1117/12.2531265Imaging Spectrom. XXIII Appl. Sensors, Process.
Picotte, J. J., Bhattarai, K., Howard, D., Lecker, J., Epting, J., Quayle, B., et al. (2020). Changes to the monitoring trends in burn severity program mapping production procedures and data products. Fire Ecol. 16 (1), 16. doi:10.1186/s42408-020-00076-y
Pla, M., Duane, A., and Brotons, L. (2017). Potencial de las imágenes UAV como datos de verdad terreno para la clasificación de la severidad de quema de imágenes Landsat: aproximaciones a un producto útil para la gestión post incendio. Rev. Teledetección (49), 91–102. doi:10.4995/raet.2017.7140
Pontes-Lopes, A., Dalagnol, R., Dutra, A. C., de Jesus Silva, C. V., de Alencastro Graça, P. M. L., and de Oliveira e Cruz de Aragão, L. E. (2022). Quantifying post-fire changes in the aboveground biomass of an Amazonian forest based on field and remote sensing data. Remote Sens. 14 (7), 1545. doi:10.3390/rs14071545
Probst, P., Boulesteix, A. L., and Bischl, B. (2019). Tunability: importance of hyperparameters of machine learning algorithms. J. Mach. Learn. Res. 20 (53), 1–32. doi:10.48550/arXiv.1802.09596
Qi, J., Chehbouni, A., Huete, A. R., Kerr, Y. H., and Sorooshian, S. (1994). A modified soil adjusted vegetation index. Remote Sens. Environ., 48(2), 119–126. doi:10.1016/0034-4257(94)90134-1
Restas, A. (2015). Drone applications for supporting disaster management. World J. Eng. Technol. 3 (3), 316–321. doi:10.4236/wjet.2015.33C047
Richardson, A. J., and Everitt, J. H. (1992). Using spectral vegetation indices to estimate rangeland productivity. Geocarto Int. 7 (1), 63–69. doi:10.1080/10106049209354353
Rogan, J., and Yool, S. R. (2001). Mapping fire-induced vegetation depletion in the peloncillo Mountains, Arizona and New Mexico. Int. J. Remote Sens. 22 (16), 3101–3121. doi:10.1080/01431160152558279
Roteta, E., Bastarrika, A., Padilla, M., Storm, T., and Chuvieco, E. (2019). Development of a Sentinel-2 burned area algorithm: generation of a small fire database for Sub-Saharan Africa. Remote Sens. Environ. 222, 1–17. doi:10.1016/j.rse.2018.12.011
Rouse, J. W., Haas, R. H., Schell, J. A., and Deering, D. W. (1974). “Monitoring vegetation systems in the great plains with ERTS,” in Third Earth Resources Technology Satellite-1 Symposium (Greenbelt, MD: NASA) 1. 309–317. NASA SP-351, Available online at: https://ntrs.nasa.gov/citations/19740022614.
Roy, D. P., Lewis, P. E., and Justice, C. O. (2002). Burned area mapping using multi-temporal moderate spatial resolution data — a bi-directional reflectance model-based expectation approach. Remote Sens. Environ. 83 (1-2), 263–286. doi:10.1016/S0034-4257(02)00077-9
Salas, E. A. L., and Henebry, G. M. (2013). A new approach for the analysis of hyperspectral data: theory and sensitivity analysis of the moment distance method. Remote Sens. 6 (1), 20–41. doi:10.3390/rs6010020
Shin, J. I., Seo, W. W., Kim, T., Park, J., and Woo, C. S. (2019). Using UAV multispectral images for classification of forest burn severity — a case study of the 2019 gangneung forest fire. Forests 10 (11), 1025. doi:10.3390/f10111025
Simes, T., Pádua, L., and Moutinho, A. (2024). Wildfire burnt area severity classification from UAV-Based RGB and multispectral imagery. Remote Sens. 16 (1), 30. doi:10.3390/rs16010030
Sims, D. A., and Gamon, J. A. (2002). Relationships between leaf pigment content and spectral reflectance across a wide range of species, leaf structures and developmental stages. Remote Sens. Environ. 81 (2-3), 337–354. doi:10.1016/S0034-4257(02)00010-X
Sripada, R. P., Heiniger, R. W., White, J. G., and Meijer, A. D. (2006). Aerial color infrared photography for determining early in-season nitrogen requirements in corn. Agron. J. 98 (4), 968–977. doi:10.2134/agronj2005.0200
Szpakowski, D. M., and Jensen, J. L. (2019). A review of the applications of remote sensing in fire ecology. Remote Sens. 11 (22), 2638. doi:10.3390/rs11222638
Szpakowski, D. M., Jensen, J. L., Chow, T. E., and Butler, D. R. (2023). Assessing the use of burn ratios and red-edge spectral indices for detecting fire effects in the greater yellowstone ecosystem. Forests 14 (7), 1508. doi:10.3390/f14071508
Talucci, A. C., Forbath, E., Kropp, H., Alexander, H. D., DeMarco, J., Paulson, A. K., et al. (2020). Evaluating post-fire vegetation recovery in cajander larch forests in northeastern siberia using UAV derived vegetation indices. Remote Sens. 12 (18), 2970. doi:10.3390/rs12182970
Tomaštík, J., Mokroš, M., Surový, P., Grznárová, A., and Merganič, J. (2019). UAV RTK/PPK method — an optimal solution for mapping inaccessible forested areas? Remote Sens. 11 (6), 721. doi:10.3390/rs11060721
Torres-Sánchez, J., López-Granados, F., De Castro, A. I., and Peña-Barragán, J. M. (2013). Configuration and specifications of an unmanned aerial vehicle (UAV) for early site specific weed management. PloS ONE 8 (3), e58210. doi:10.1371/journal.pone.0058210
Toth, C., and Jóźków, G. (2016). Remote sensing platforms and sensors: a survey. ISPRS J. Photogrammetry Remote Sens. 115, 22–36. doi:10.1016/j.isprsjprs.2015.10.004
Tran, N. B., Tanase, M. A., Bennett, L. T., and Aponte, C. (2019). “Fire-severity classification across temperate Australian forests: random forests versus spectral index thresholding,” 11149. SPIE, 34–267. doi:10.1117/12.2535616 Remote Sens. Agric. Ecosyst. Hydrology XXI
Tran, D. Q., Park, M., Jung, D., and Park, S. (2020). Damage-map estimation using UAV images and deep learning algorithms for disaster management system. Remote Sens. 12 (24), 4169. doi:10.3390/rs12244169
Turetsky, M. R., Benscoter, B., Page, S., Rein, G., Van Der Werf, G. R., and Watts, A. (2015). Global vulnerability of peatlands to fire and carbon loss. Nat. Geosci. 8 (1), 11–14. doi:10.1038/ngeo2325
Vallejo, V. R., Arianoutsou, M., and Moreira, F. (2012). “Fire ecology and post-fire restoration approaches in southern European forest types,” in Post-fire management and restoration of southern European forests (Dordrecht: Springer), 93–119. doi:10.1007/978-94-007-2208-8_5
van Dijk, D., Shoaie, S., van Leeuwen, T., and Veraverbeke, S. (2021). Spectral signature analysis of false positive burned area detection from agricultural harvests using Sentinel-2 data. Int. J. Appl. Earth Observation Geoinformation 97, 102296. doi:10.1016/j.jag.2021.102296
Veraverbeke, S., Lhermitte, S., Verstraeten, W. W., and Goossens, R. (2010). The temporal dimension of differenced normalized burn ratio (dNBR) fire/burn severity studies: the case of the large 2007 Peloponnese wildfires in Greece. Remote Sens. Environ. 114 (11), 2548–2563. doi:10.1016/j.rse.2010.05.029
Veraverbeke, S., Lhermitte, S., Verstraeten, W. W., and Goossens, R. (2011). Evaluation of pre/post-fire differenced spectral indices for assessing burn severity in a mediterranean environment with landsat thematic mapper. Int. J. Remote Sens. 32 (12), 3521–3537. doi:10.1080/01431161003752430
Veraverbeke, S., Hook, S., and Hulley, G. (2012). An alternative spectral index for rapid-fire severity assessments. Remote Sens. Environ. 123, 72–80. doi:10.1016/j.rse.2012.02.025
Viana-Soto, A., Aguado, I., and Martínez, S. (2017). Assessment of post-fire vegetation recovery using fire severity and geographical data in the mediterranean region (spain). Environments 4 (4), 90. doi:10.3390/environments4040090
Villoslada, M., Sipelgas, L., Bergamo, T. F., Ward, R. D., Reintam, E., Astover, A., et al. (2022). Multi-source remote sensing data reveals complex topsoil organic carbon dynamics in coastal wetlands. Ecol. Indic. 143, 109329. doi:10.1016/j.ecolind.2022.109329
Vincini, M., and Frazzi, E. (2011). Comparing narrow and broad-band vegetation indices to estimate leaf chlorophyll content in planophile crop canopies. Precis. Agric. 12 (3), 334–344. doi:10.1007/s11119-010-9204-3
Ward, R. D., Burnside, N. G., Joyce, C. B., and Sepp, K. (2016). Importance of microtopography in determining plant community distribution in Baltic coastal wetlands. J. Coast. Res. 32 (5), 1062–1070. doi:10.2112/JCOASTRES-D-15-00065.1
Weber, K. T., Seefeldt, S., and Moffet, C. (2009). Fire severity model accuracy using short-term, rapid assessment versus long-term, anniversary date assessment. GIScience and Remote Sens. 46 (1), 24–38. doi:10.2747/1548-1603.46.1.24
Woo, H., Acuna, M., Madurapperuma, B., Jung, G., Woo, C., and Park, J. (2021). Application of maximum likelihood and spectral angle mapping classification techniques to evaluate forest fire severity from UAV multi-spectral images in South Korea. Sensors Mater. 33 (11), 3745–3760. doi:10.18494/SAM.2021.3365
Xing, N., Huang, W., Xie, Q., Shi, Y., Ye, H., Dong, Y., et al. (2019). A transformed triangular vegetation index for estimating winter wheat leaf area index. Remote Sens. 12 (1), 16. doi:10.3390/rs12010016
Keywords: remote sensing, spectral indices, peatland, vegetation monitoring, post-fire assessment
Citation: De Lima RS and Sepp K (2025) A novel spectral index designed for drone-based mapping of fire-damage levels: demonstration and relationship with biophysical variables in a peatland. Front. Environ. Sci. 13:1685279. doi: 10.3389/fenvs.2025.1685279
Received: 13 August 2025; Accepted: 14 October 2025;
Published: 29 October 2025.
Edited by:
Gerardo López Saldaña, Assimila Ltd., United KingdomReviewed by:
Shaohua Lei, Nanjing Hydraulic Research Institute, ChinaAxel Ricardo Von Müller, National Institute of Agricultural Technology (INTA), Argentina
Copyright © 2025 De Lima and Sepp. This is an open-access article distributed under the terms of the Creative Commons Attribution License (CC BY). The use, distribution or reproduction in other forums is permitted, provided the original author(s) and the copyright owner(s) are credited and that the original publication in this journal is cited, in accordance with accepted academic practice. No use, distribution or reproduction is permitted which does not comply with these terms.
*Correspondence: Raul Sampaio De Lima, cmF1bC5zYW1wYWlvX2RlX2xpbWFAZW11LmVl