 Chaofei Li1
 Lu Shen2*
- 1College of Geological and Surveying Engineering, Taiyuan University of Technology, Taiyuan, Shanxi, China
- 2Country School of Civil Engineering, Wanjiang University of Technology, Ma’anshan, Anhui, China
Introduction: Landslide frequency and ecological fragility jointly constrain Luding’s development. Clarifying the regional landslide distribution pattern and associated ecological hazards is critical for scientific disaster prevention and ecological management.
Methods: This study first considers internal and external geodynamic factors and analyzes the spatial distribution pattern of landslides in Luding County. Secondly, the Geographical Detector Model (GDM) was employed to quantify the influence of various factors on the distribution of landslides. Then, the RX-Stacking ensemble learning model was utilized to assess landslide susceptibility in Luding County. Finally, using land use type changes, the weight of ecosystem service value, and landslide occurrence probability three key factors, this study quantified the ecological damage induced by landslides and constructed an evaluation model for landslide-induced ecological damage. Based on this model and the susceptibility assessment results, an ecological vulnerability assessment of Luding County was conducted.
Results: The following conclusions were drawn: (1) Landslides in Luding County are densely distributed, with an over-all distribution density of 0.19 sites/km2; (2) Rainfall, distance to fault zones, and Bouguer gravity anomaly gradient had the most significant influence on the distribution of land-slides, with q values of 0.24, 0.18, and 0.10, respectively; (3) Interactions between factors exhibit a nonlinear enhancement effect, with any two-factor synergy significantly surpassing the influence of individual factors on landslide spatial distribution. Among these interactions, the one between rainfall and distance from the fault zone exerts the greatest influence, with a q value of 0.37; (4) Compared with the Random Forest (RF) model and Extreme Gradient Boosting (XGBoost) model, the RX-Stacking ensemble learning model has an AUC of 0.926, and its landslide susceptibility evaluation is better than the other two models, with good generalization; (5) The distribution of landslide susceptibility levels and ecological vulnerability levels exhibits a high degree of consistency. High/extremely high vulnerability zones are predominantly clustered in the eastern region with prominent ecosystem service functions, while low/moderate vulnerability zones are mainly clustered in the western region with weaker ecosystem service capacities.
Discussion: The GDM results confirm that rainfall distance to fault zones, and Bouguer gravity anomaly gradient factors are the core controllers of landslides in Luding County, providing a basis for identifying high-risk landslide areas. The non-linear enhancement of factor interactions highlights the necessity of multi-factor synergy analysis in landslide risk assessment, avoiding the limitations of single-factor analysis. The superior performance of the RX-Stacking model ensures the reliability of susceptibility results, which is a key prerequisite for accurate ecological vulnerability evaluation. The spatial consistency between high susceptibility and high ecological vulnerability indicates that landslide prevention in the east should be integrated with ecological protection. In contrast, the western region can adopt targeted management strategies based on its weaker ecosystem service capacity. Overall, this study provides a scientific framework for landslide prevention and ecological management in Luding County, and its methods can be referenced for similar mountainous areas facing combined geological and ecological risks.
1 Introduction
Western Sichuan is located on the eastern margin of the Tibetan Plateau. This region features highly complex topographic and geological conditions, characterized by steep terrain, high seismic intensity, and a fragile geological environment, resulting in frequent landslide disasters. As a highly hazardous natural phenomenon, landslides pose significant threats to ecological systems, social stability, and human survival (Guzzetti et al., 2018). Integrating deep and shallow geodynamic factors, adapting to spatial heterogeneity in their effects, and quantifying the coupling between landslide risk and ecological damage to achieve fine-grained regional assessments of susceptibility and vulnerability have long been central challenges in landslide disaster mitigation and ecological protection. Addressing these challenges is essential to effectively enhance capabilities in landslide prediction, early warning, and prevention.
Landslide susceptibility assessment predicts the probability of landslide occurrence within a region by analyzing inherent relationships between predisposing factors and the spatial distribution of landslides (Wu et al., 2016; Liu et al., 2022). Ecological environmental damage refers to adverse changes in environmental components and biological elements, resulting from environ-mental pollution or ecosystem destruction, which consequently diminish ecosystem functionality and service provision (Wang et al., 2025). Landslides cause abrupt, short-term catastrophic alterations to ecosystems. Given the high ecological sensitivity and vulnerability of the study area, major landslide events would inflict serious impairment on its ecosystem services. In recent years, landslide events have intensified in terms of severity, frequency, and scale, exemplified by the “April 1 Ya’an Landslide” in 2016 and the “June 24 Maoxian Land-slide” in 2017, and the mass landslides caused by the 6.8-magnitude earthquake in Luding, Sichuan in 2022 (Wang et al., 2018; Yang et al., 2020). These disasters not only caused direct casualties and property losses but also resulted in extensive vegetation destruction and soil erosion, severely degrading local ecosystems. Statistical data indicate that in recent years, landslide disasters in this region have caused over a thousand casualties and billions of yuan in direct and indirect economic losses, and incalculable long-term ecological damage.
Following the “5.12” Wenchuan Earthquake, an increasing number of scholars have focused their research on Western Sichuan. Through field investigations and remote sensing interpretation of landslides, studies have explored the background and devel-op-mental characteristics of landslide disasters across varying scales and regions (Huang and Li, 2008; Zhao et al., 2024). Multifactor sensitivity analyses indicate that endogenic and exogenic dynamic fac-tors-including slope angle, rainfall, lithology, and seismic activity—significantly in-fluence the spatiotemporal distribution patterns of landslides (Yang et al., 2018; Fan et al., 2018; Shu et al., 2022; Gu et al., 2023).
Current research primarily focuses on the influence of shallow geodynamic processes on the development and distribution patterns of landslides (Convertino et al., 2013; Dandridge et al., 2023). For instance, studies reveal that landslide density exhibits a positive correlation with rainfall return periods rather than single extreme rainfall events (Mtibaa and Tsunetaka, 2023); research on geohazard distribution in the Lhasa region of Tibet demonstrates that landslides predominantly occur at elevations between 4,300–5,300 m and within topographic relief ranges of 1,100–1,500 m, with land-slide abundance indices continuously increasing alongside slope steepness (Ma et al., 2024). Concurrently, deep geodynamic processes such as crustal movement and tectonic stress fields also play critical roles in landslide initiation and progression (Cloetingh and Willett, 2013; Xie et al., 2021). However, quantitative investigations into the impacts of deep geodynamic factors and nonlinear coupling effects among multiple factors remain insufficient.
Current susceptibility assessment primarily adopt two methodologies: statistical models and machine learning approaches (Dikshit et al., 2020; Merghadi et al., 2020). Statistical models quantify landslide probabilities using mathematical formulations, offering strong interpretability, but they exhibit limited capacity to model complex nonlinear relationships (Reichenbach et al., 2018). In contrast, machine learning methods leverage data-driven strategies to capture multi-dimensional feature correlations, achieving significant improvements in prediction accuracy (Huang et al., 2024). However, the substantial variations in geological environments and dominant controlling factors across regions render single-model frameworks inadequate. There is an urgent need to integrate the strengths of diverse models to enhance the precision of landslide susceptibility assessments (Fang et al., 2021). Moreover, existing approaches predominantly rely on global uniform modeling strategies, failing to sufficiently account for spatial heterogeneity in landslide distribution patterns across subregions.
Apart from enhancing the accuracy of landslide susceptibility assessment, traditional susceptibility-focused studies often neglect the potential ecological impacts of landslides, especially critical in ecologically sensitive regions like western Sichuan, where landslides frequently cause vegetation destruction and soil erosion (as noted earlier with the 2022 Luding earthquake-induced landslides). From the perspective of a complete disaster risk system, it is therefore necessary to integrate ecological vulnerability evaluation to comprehensively characterize the potential ecological impacts of disasters, thereby forming a holistic assessment of landslide risk (Xu et al., 2023).
Building on this foundation, the present study collected landslide data from Luding County in Western Sichuan. To account for the influence of spatial heterogeneity, the geo-graphical detector model was employed to investigate the spatial distribution patterns and dominant controlling factors of landslides in Luding County under the combined effects of internal and external geodynamic factors and their coupling mechanisms. On this basis, through feature optimization, the RX-stacking ensemble learning model and ecological environment damage assessment model were used to evaluate the landslide susceptibility and ecological vulnerability, effectively eliminating the prediction bias caused by spatial feature heterogeneity and improving the universality and prediction accuracy of the model. Through this study, not only has a scientific basis been provided for the prevention and control of landslide disasters in Luding County, but effective identification of potential ecological risk areas for landslides has also been achieved. It also provides reference and guidance for the study of landslide disasters and their ecological risk assessment in other areas of western Sichuan.
2 Study area
The western Sichuan Plateau constitutes a stepped transition zone extending from the western hilly margins of the Sichuan Basin to the Longmen Mountains in northwest-ern Sichuan and the eastern periphery of the Qinghai-Tibet Plateau. Characterized by intricate gully networks, deeply incised valleys, complex lithological compositions, and multiple superimposed tectonic units, this region exhibits a geologically exceptional environment. Luding County, situated in the central-eastern portion of western Sichuan (Figure 1), features a dramatic topography where the Qionglai Mountain Range dominates the eastern sector and the Daxue Mountain Range occupies the west. The Dadu River traverses the intermontane valley between these two ranges in a north-south orientation. Intense neotectonic movements have generated significant vertical relief between the river and adjacent mountains, sculpting distinctive geomorphological features including truncated slope surfaces, steep gradients, fragmented rock masses, and extensive bedrock exposure. The Dadu River, as the principal drainage artery within the study area, commands a catchment of 2,020.7 km2. Characterized by rapid flow velocities and pronounced downcutting dynamics, its persistent fluvial scouring promotes widespread slope toe degradation.
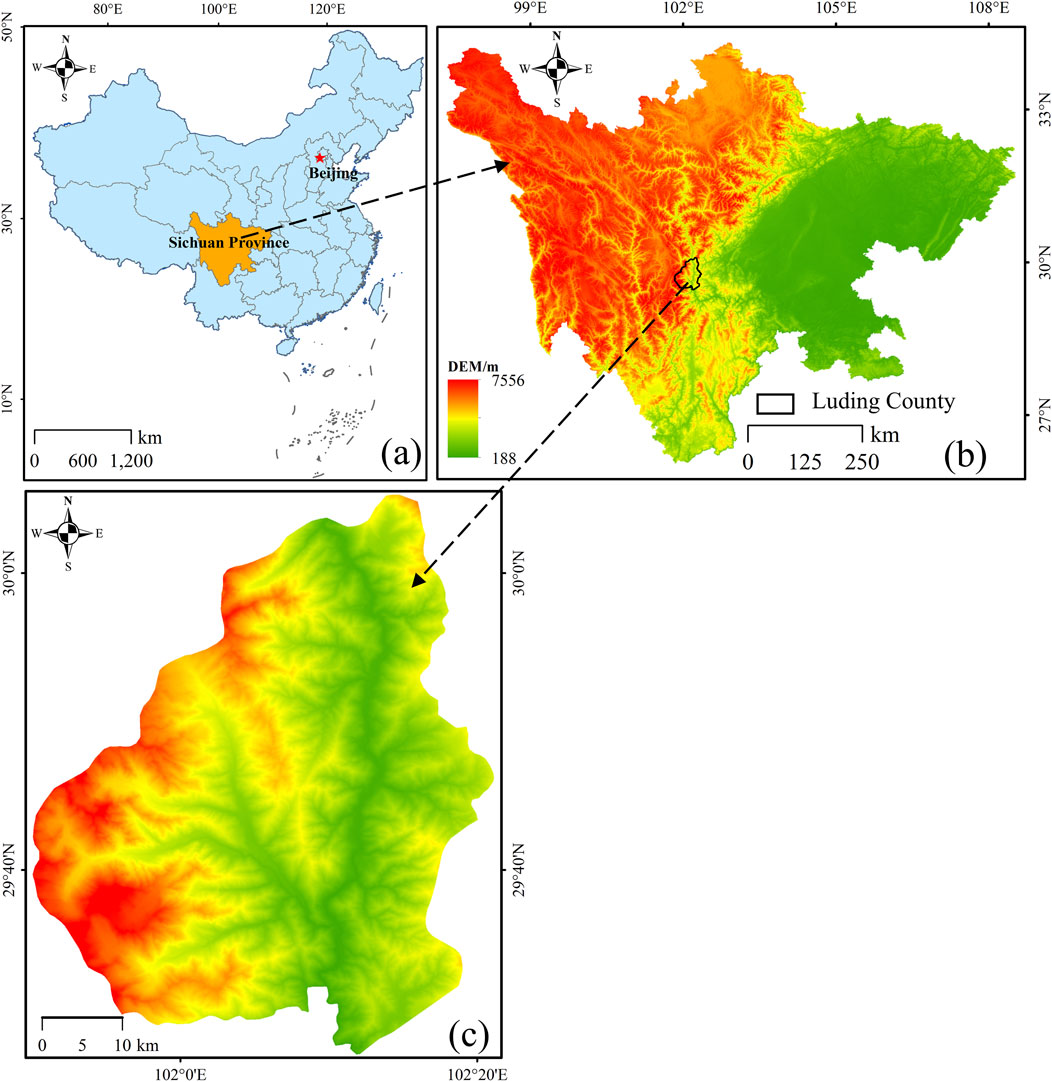
Figure 1. Geographical location of the study area: (a) Map of China (b) Map of Sichuan Province (c) map of Luding County.
Climatically governed by the synergistic interplay between subtropical monsoons and plateau cold-air masses, the region exhibits distinct seasonal patterns: dry-warm winters contrast with humid summers, featuring a mean annual temperature of 15.5 °C. The annual rainfall is 664.4 mm, and the rainfall is mostly concentrated from May to October (Figure 2). The interaction between the rainfall concentration period and steep terrain exacerbates the development of surface erosion and geological disasters.

Figure 2. Monthly average rainfall in the study area.
There are various types of landslides in this area, mainly consisting of accumulation layer landslides, which can be further divided into residual slope layer landslides, clay and glacier accumulation layer landslides (Guo et al., 2021). Typical landslides are shown in Figure 3. Structurally, Luding County is a typical intersection of multiple tectonic systems, located at the junction of the northern section of the Sichuan Yunnan north-south tectonic belt, the northeast trending fault zone of Longmenshan, and the northwest trending active fault zone of Xianshuihe River. Among them, the Xianshuihe fault zone has the most intense activity (Ma et al., 2023). In addition, the strata of Luding County span from the Quaternary to the Sinian period, with the Mesozoic, Paleo-zoic Triassic strata and Precambrian metamorphic rock layers being the most extensive, with complex and fragmented lithology. This complex geological structure provides the basic conditions for frequent landslides.
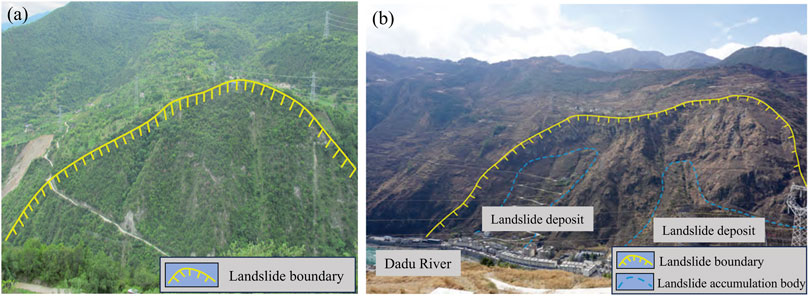
Figure 3. Typical landslides in the study area. (a) Gancao village ancient landslide; (b) Daping landslide.
3 Data sources and research methods
3.1 Data sources
Based on the national spatial distribution data of geological hazard points, the Luding County seismic landslide inventory (Dai et al., 2025), and the landslide points supplemented by field investigations, this study constructed a landslide dataset for Luding County, which contains a total of 417 landslides. In order to analyze the influence of internal and external dynamic factors on the spatial distribution of landslides in Luding County, this study selected three external geodynamic factors: Normalized Difference Vegetation Index (NDVI), rainfall, and human activity intensity, as well as six in-ternal geodynamic factors: elevation, slope angle, relief amplitude, Bouguer gravity anomaly gradient, horizontal deformation gradient and distance from the fault zone for analysis.
The specific data sources include: 30-m resolution Digital Elevation Model (DEM) data from NASA’s Shuttle Radar Topography Mission (SRTM); 30-m resolution Google Maps data; 2022 NDVI data from Google Earth Engine; annual rainfall data from the National Climate Center. Regional fault zone locations and land use types data pro-vided by the China Geological Survey. Bouguer gravity anomaly gradient and horizontal deformation gradient data provided by Yao et al. (2015).
3.2 Research methods
3.2.1 Geographical Detector Model (GDM)
This study primarily employs numerical statistical methods to investigate the land-slide distribution patterns in Luding County. Based on the GDM, the influence of individual factors and their combinations on landslide distribution is quantified (Wang et al., 2016).
The GDM is a statistical method designed to quantitatively evaluate stratified heterogeneity and uncover its underlying driving forces. Its core concept involves partitioning the study area into subregions based on variables and comparing spatial variances within and between these subregions to assess the explanatory power of potential independent variables on the dependent variable. A key strength of this model is its ability to simultaneously identify the independent effects of individual factors and the interactive effects of multiple factors. The framework comprises four submodules: factor detector, interaction detector, risk detector, and ecological detector. The factor detector assesses the explanatory power of a single influencing factor on the spatial distribution of landslides. The interaction detector assesses the combined explanatory capacity of two interacting factors on the spatial distribution of landslides. The calculation formula is as follows:
Where: q is the degree of interpretation of the influence factor; nh and σh are the sample size and variance of the driving factor in layer h; n and σ2 are the full sample size and variance. The value of q ranges from [0, 1], with larger values indicating a higher degree of interpretation, thus suggesting a greater influence on the distribution of landslides.
3.2.2 Random Forest (RF)
The RF model is a type of Bagging ensemble learning method (Breiman, 2001; Goetz et al., 2015). Its principle involves the following steps: First, bootstrap sampling is used to randomly draw K sub-sets with replacement from the original training set. Each subset is then employed to train a distinct decision tree model, generating K classification results. Finally, the outputs of all decision trees are averaged, and this mean value serves as the final prediction of the mod-el. The tree-based structure of the RF model enables it to significantly improve approximation accuracy when addressing discrete optimization problems.
3.2.3 Extreme Gradient Boosting (XGBoost)
The XGBoost model is a type of Boosting ensemble learning method (Freund and Schapire, 1997). In each iteration, a decision tree is added, and a strong learner is trained through an additive strategy that continuously optimizes the model. Its uniqueness lies in the inclusion of both a loss function and a regularization term in the objective function (Li et al., 2021). The loss function measures how well the model fits the data. While traditional gradient boosting uses the first-order derivative to determine the direction of gradient descent, the XGBoost model further calculates the second-order derivative of the loss function, which accounts for the trend of gradient changes. This enables faster convergence and higher accuracy. The regularization term controls model complexity. As the number of leaf nodes increases, the model becomes larger, computational time grows, and excessive nodes may lead to over-fitting, degrading classification performance. XGBoost’s regularization term acts as a penalty mechanism: the greater the number of leaf nodes, the stronger the penalty, thereby restricting their proliferation. The optimal objective function is defined as follows:
In the formula: λ denotes the fixed coefficient; γ represents the complexity parameter; T is the number of leaf nodes in the tree; Gj denotes the sum of the first-order partial derivatives of the samples contained in leaf node j; Hj represents the sum of the second-order partial derivatives of the samples in leaf node j.
3.2.4 RX-stacking ensemble learning model
Stacking is a heterogeneous ensemble learning method (Wolpert, 1992). Its principle involves training base learners on the initial training dataset, then using their predictions to create a new dataset. In this new dataset, the outputs of the base learners are treated as novel in-put features for training a second-layer meta-learner to obtain the final prediction results.
In this study, the RF model and the XGBoost model are employed as base learners for the Stacking framework. For the second-layer meta-learner, Logistic Regression (LR)-a structurally simple yet robust model with strong generalization capability is selected to mitigate overfitting risks. Together, these components collectively form the RX-Stacking ensemble learning model. By combining the strengths of different ensemble approaches, this hybrid model reliably handles diverse data scenarios and achieves more stable and robust results compared to individual models.
To enhance the stability and generalization ability of the model, the RX-Stacking framework introduces a five-fold cross-validation mechanism. First, samples are divided into a training set and a test set through stratified sampling. Subsequently, the training set is randomly divided into 5 mutually exclusive subsets. In each iteration, 4 of these subsets are selected as training data to train the RF and XGBoost base learners, while the remaining 1 subset serves as a validation set to output landslide probability predictions. After 5 iterations, the prediction results of all validation sets are concatenated to form a meta-training set. Once cross-validation is completed, the base learners are retrained using the entire training set, and predictions are made on the test set to generate a meta-test set. Finally, a LR meta-learner is trained using the meta-training set, and the overall performance of the model is evaluated on the meta-test set. The hyperparameters of the base learners are optimized via grid search combined with five-fold cross-validation. The specific parameter settings are as follows: For the RF model, the number of decision trees (n_estimators) is 100, the maximum tree depth (max_depth) is 8, the number of features considered per split node (max_features) is set to “sqrt”, and the minimum number of samples required at a leaf node (min_samples_leaf) is 5; For the XGBoost model, the learning rate (learning_rate) is 0.1, the number of decision trees (n_estimators) is 150, the L1 regularization coefficient (reg_alpha) is 1, the L2 regularization coefficient (reg_lambda) is 0.1, the subsample ratio (subsample) is 0.8, and the loss function (objective) is set to “binary:logistic”.
3.2.5 Landslide ecological environment damage assessment model
Landslides can directly cause damage to a series of attachments such as forest, farmland, and grassland on the slope surface and below the slope, changing the original land use type and affecting its ecosystem service functions. Changes in ecosystem service functions can be effectively evaluated based on changes in land use types. Therefore, this study chose land use type as the assessment index for ecological environment damage caused by landslides, which can intuitively reflect the damage of landslides to regional ecosystem functions. China’s land use types primarily comprise six major categories: forest, grassland, wetland, water bodies, farmland, and other difficult to utilize lands. This study employs these six land use categories as assessment indicators for landslide-induced ecological environmental damage. Wang et al. (2025). Calculated the weight values of landslide ecological environment damage assessment indicators for six types of land use using the Analytic Hierarchy Process based on the equivalent factor of ecosystem service value, as shown in Table 1.

Table 1. Weight of assessment indicators for landslide ecosystem service value.
As can be seen, the weight values of different land use types reflect the proportional contribution of their ecosystem services per unit area within the ecosystem. That is, the larger the weight value, the greater the contribution of the corresponding land use type to ecosystem; conversely, the smaller the weight value, the smaller its contribution. After a landslide occurs, all natural environmental factors on the original slope surface, sliding path, and accumulation area are destroyed. In high vegetation coverage areas, such as forest, grassland, and farmland. These areas transform into other difficult to utilize land types, such as exposed bedrock or accumulated soil.
Therefore, the quantitative assessment model for ecosystem damage caused by land-slide-induced land use type changes is:
Where: ED denotes the ecological damage index, ranging from 0 to 1; p represents the landslide occurrence probability in distinct susceptibility zones; wi signifies the weight of the ecosystem service value evaluation indicator for the pre-disturbance land use type; wj is the weight of the ecosystem service value evaluation indicator for the post-disturbance land use type, uniformly assigned as 0.290.
This article first uses numerical statistical methods to study the spatial distribution of landslides in Luding County under the influence of internal and external geodynamic. The GDM is used to calculate the impact of different influencing factors and their coupling effects on the spatial distribution of landslides. Then, the factors that have the greatest impact on the distribution of landslides are selected, and combined with the landslide dataset, the RX-Stacking ensemble learning model is used to assess the susceptibility of the study area. On this basis, according to the landslide ecological environment damage assessment model, calculate its ecological vulnerability. The technical workflow of this study is shown in Figure 4.

Figure 4. Technical workflow of the study.
4 Distribution pattern of landslides in Luding County
4.1 Overall spatial distribution pattern
The regional area of Luding County is approximately 2,165 km2. A total of 417 landslides were collected in this study, with their specific distribution illustrated in Figure 5. Based on calculations, the landslide density in the study area reaches 0.19 landslides per km2. Landslides are mainly concentrated in the eastern and southern parts of the study area, where the elevation is below 3,000 m above sea level, urban settlements are dense, and human activities are frequent. While areas above 3,000 m above sea level are characterized by steep terrain, complex and variable topography, and sparse human habitation, making it often difficult to comprehensively investigate and document some landslide disaster sites.

Figure 5. Overall spatial distribution of landslides in Luding County.
4.2 Distribution pattern under internal and external geodynamic factors
4.2.1 Rainfall and landslides
Rainfall is the primary triggering factor for landslides. The study area is classified into three rainfall intensity levels based on annual average precipitation: 500–800 mm, 800–1,200 mm, and 1,200–1,800 mm, with specific zoning results presented in Figure 6a. As clearly shown, the 500–800 mm rainfall zone covers the largest area in the study region, consequently containing the highest number of landslide points, with 209 landslides and a density of 0.17/km2. Conversely, although the 1,200–1,800 mm rainfall zone occupies the smallest area, it exhibits a higher landslide density, with 123 landslides and a density of 0.41/km2. This pattern demonstrates that increased rainfall intensity exerts a significant triggering effect on landslide occurrences.
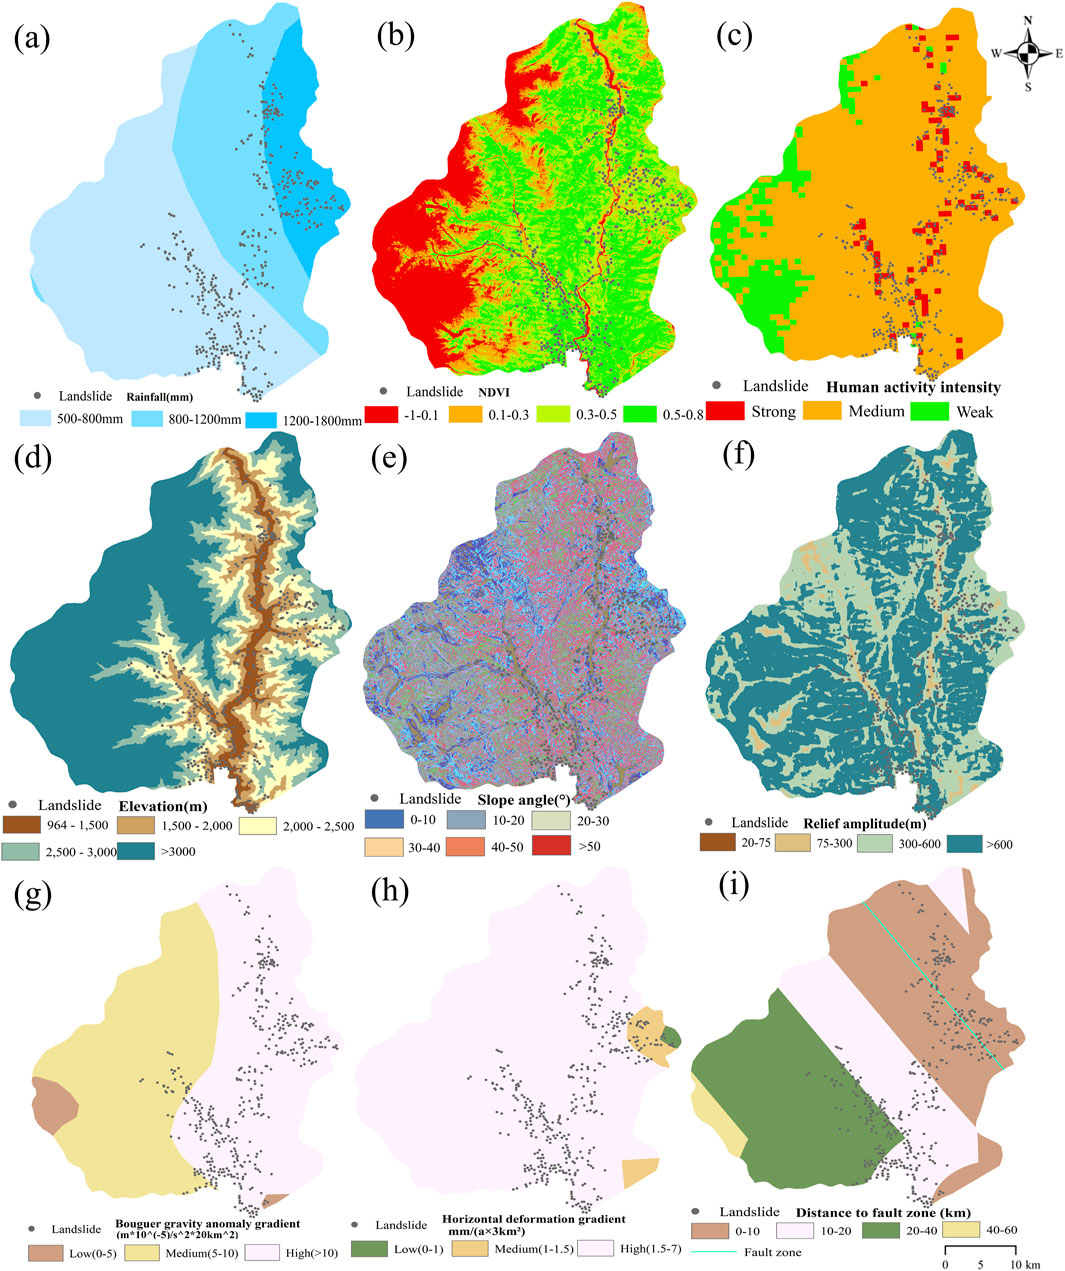
Figure 6. The spatial distribution laws of landslides under different influencing factors. (a) rain-fall; (b) NDVI; (c) human activity intensity; (d) elevation; (e) slope angle; (f) relief amplitude; (g) Bouguer gravity anomaly gradient; (h) Horizontal deformation gradient; (i) distance to the fault zone.
4.2.2 NDVI and landslides
As a vegetation characterization indicator, NDVI exerts significant influences on slope hydrological processes including infiltration and runoff. Additionally, NDVI can serve as a proxy for quantifying anthropogenic impacts on slopes to a certain extent (Ma et al., 2021). Specifically, NDVI values typically range from −1 to 1, with values approaching 1 indicating dense and healthy vegetation, while negative or near-zero values signify sparse or ab-sent vegetation cover. The NDVI values were classified into four categories: -1-0.1, 0.1–0.3, 0.3–0.5, and 0.5–0.8, with spatial zoning results detailed in Figure 6b. The analysis reveals that the −1.0–0.1 zone predominantly comprises water bodies, rock formations, bare soil, and snow-capped mountains, exhibiting minimal human activity and correspondingly rare landslide occurrences, with only 21 landslides and a density of 0.05/km2. Landslides are primarily concentrated within the 0.1–0.3 and 0.3–0.5 zones, which contain 66 and 185 landslides, respectively, with densities reaching 0.20/km2 and 0.33/km2. In contrast, the 0.5–0.8 zone, despite covering a relatively large area, contains 135 landslides with a density of 0.16/km2, which is lower than that observed in the 0.1–0.3 and 0.3–0.5 zones. Collectively, these findings demonstrate that landslide distribution exhibits preferential clustering in low-to-medium NDVI ranges.
4.2.3 Human activity intensity and landslides
Land use is influenced by human activities and affects slope stability. In previous studies, land factors were generally categorized into nine types based on land use patterns: farmland, forest, grassland, shrubland, wetland, water bodies, impervious surfaces, bare land, and glaciers/permanent snow cover. Building on existing research, these categories were further classified according to human activity intensity: farmland and impervious surfaces represent high-intensity human activities; forest, grassland, and shrubland moderate-intensity; while wetland, water bodies, bare land, and glaciers/permanent snow cover low-intensity. The specific regional classification results and area statistics are shown in Figure 6c. It can be observed that the vast majority of landslides are primarily distributed in areas with moderate to high human activity intensity. Since regions with moderate human activity intensity cover the largest area, they exhibit the highest number of landslides, with 313 landslides and a density of 0.18/km2. In contrast, areas with high human activity intensity, despite their smaller spatial extent, show the greatest landslide distribution density, containing 91 landslides with a density of 0.85/km2. Overall, increasing human activity intensity correlates with more favorable conditions for landslide initiation and development.
4.2.4 Elevation and landslides
According to the elevation of the research area, it is divided into five levels: 964–1500 m, 1,500–2000 m, 2000–2500 m, 2500–3000 m, and >3000 m. The specific zoning results are shown in Figure 6d. It can be seen that the vast majority of landslides are mainly distributed in the elevation ranges of 964–1,500 m and 1,500–2000 m, with 130 and 161 landslides respectively, and corresponding densities of 1.11/km2 and 0.62/km2. In contrast, fewer landslides occur in the 2000–2,500 m elevation zone, with 97 landslides and a density of 0.26/km2, while the 2,500–3,000 m and >3,000 m ranges exhibit minimal landslide distribution.
4.2.5 Slope angle and landslides
According to the slope angle size of the research area, it is divided into six levels: 0°–10°, 10°–20°, 20°–30°, 30°–40°, 40°–50°, and >50°. The specific zoning results are shown in Figure 6e. It can be seen that the number of landslides is highest in the slope angle ranges of 20°–30° and 30°–40°, with 91 and 137 landslides respectively, while landslide distribution is relatively low in other slope ranges.
4.2.6 Relief amplitude and landslides
Relief amplitude, defined as the elevation difference between the highest and lowest points within a specific area, serves as a quantitative indicator for describing geomorphological features and reflects the favorability of topographic conditions for geological hazard formation (Yin et al., 2010). Using DEM data, terrain relief was calculated and categorized into four levels: 20–75 m, 75–300 m, 300–600 m, ≥600 m. The zoning results are illustrated in Figure 6f. It can be clearly seen that landslides are mainly distributed in two relief amplitude ranges: 300–600 m and ≥600 m. These two ranges cover relatively extensive areas and contain the majority of landslides, with 228 and 162 landslides respectively, and densities of 0.29/km2 and 0.12/km2. However, in terms of density, the 75–300 m relief amplitude range exhibits the highest value, with 27 landslides and a density of 0.42/km2. Overall, greater relief amplitude strongly favors landslide development. Areas with low relief amplitude experience more frequent human activities, and due to influences such as engineering projects, the probability of landslide occurrence is relatively high. In contrast, as relief amplitude increases, the difficulty of landslide investigation also correspondingly rises.
4.2.7 Bouguer gravity anomaly gradient and landslides
Deep structures are important factors controlling crustal stability, and changes in deep geophysical fields are important manifestations of deep tectonic activity. This study selected the gradient of Bouguer gravity anomaly as an indicator of regional crustal stability, calculated by the variation of Bouguer gravity anomaly values per 20 square kilometer unit (Fu et al., 2014). The Bouguer gravity anomaly gradient is divided into three levels: low (0–5), medium (5–10), and high (>10). The specific zoning results are shown in Figure 6g. It can be clearly seen that the distribution of landslides is the least in areas with low Bouguer gravity anomaly gradient, with only 3 landslides and the lowest density of 0.05/km2. In contrast, the vast majority of landslides are concentrated in areas with high gradient levels, containing as many as 362 landslides and reaching the highest density of 0.33/km2. As the gradient level of Bouguer gravity anomaly increases, the overall distribution of landslides shows an upward trend.
4.2.8 Horizontal deformation gradient and landslides
Regions with significant crustal deformation are often characterized by crustal instability zones, seismic activity zones, or tectonic stress concentration zones. Horizontal de-formation gradient is used as an indicator to measure regional crustal deformation. The unit of horizontal deformation gradient is the annual average horizontal deformation within a range of 3 square kilometers. The study area is divided into three levels based on the magnitude of the horizontal deformation gradient: low (0–1), medium (1–1.5), and high (1.5–7). The specific zoning results are shown in Figure 6h. It can be seen that due to the extensive areal coverage of high-grade zones within the study area, which include remote and difficult-to-investigate regions above 3,000 m in elevation, this zone contains the largest number of landslides, totaling 383. However, it also exhibits the lowest landslide density, at 0.19/km2. In contrast, low-grade zones account for the smallest spatial extent, covering only 4.3% of the total study area. Although these areas contain relatively few landslides, with only 7 landslides, they show the highest distribution density, reaching 0.75/km2.
4.2.9 Distance from the fault zone and landslides
Fault zones are geological structures that are prone to induce geological disasters, which can lead to discontinuity of slope rock and soil mass, decrease in strength, and create favorable conditions for landslide occurrence (Qi et al., 2021). According to the distance from the fault zone, the study area is divided into five levels: 0–10 km, 10–20 km, 20–40 km, and 40–60 km. The specific zoning results are shown in Figure 6i. Among them, the area within 0–10 km of the fault zone has the highest number of landslides, reaching 184. As the distance from the fault zone increases, the number of landslides statistically decreases, while the area within 40–60 km has the lowest number of landslides, with no landslides distributed in this region. The closer the distance to the fault zone, the more it favors the development and occurrence of landslides.
4.3 Importance analysis of influencing factors
The GDM was applied to assess the influence of nine factors on landslide spatial distributeon in the study area. These factors include: rainfall (X1), NDVI (X2), human activity intensity (X3), elevation (X4), slope angle (X5), relief amplitude (X6), Bouguer gravity anomaly gradient (X7), horizontal deformation gradient (X8), and distance from the fault zone (X9). Interpretability values (q) for each factor were calculated to quantify their im-pact. Results are shown in Figure 7.

Figure 7. Interpretability q of different influencing factors on the distribution of landslides.
It can be seen that among all the influencing factors, rainfall, distance from the fault zone, and Bouguer gravity anomaly gradient have the greatest impact on the spatial distribution of landslides in the study area, with q-values of 0.24, 0.18, and 0.10, respectively. In contrast, the effects of horizontal deformation gradient, slope angle, and relief amplitude are secondary, with q-values of 0.08, 0.06, and 0.05, respectively. NDVI, human activity intensity and elevation is relatively small.
The occurrence of landslides is caused by the joint action of internal and external geodynamic factors. The different combinations of internal and external geodynamic factors lead to the differences in the spatial distribution of landslides. Figure 8 shows the influence degree of the interaction of different influence factors on the spatial distribution of landslide. It can be seen that the interaction between influence factors is mainly manifest-ed as nonlinear enhancement effect, and the influence of the interaction factors of any two factors on the spatial distribution of landslide exceeds that of a single factor. The interaction between rainfall and other factors is much greater than that between other factors. Among them, the rainfall ∩ distance from the fault zone has the greatest impact on the spatial distribution of landslide, and its q value is 0.37. The second is rainfall ∩ horizontal deformation gradient, rainfall ∩ human activity intensity, rainfall ∩ Bouguer gravity anomaly gradient, with q values of 0.28, 0.28 and 0.27 respectively.
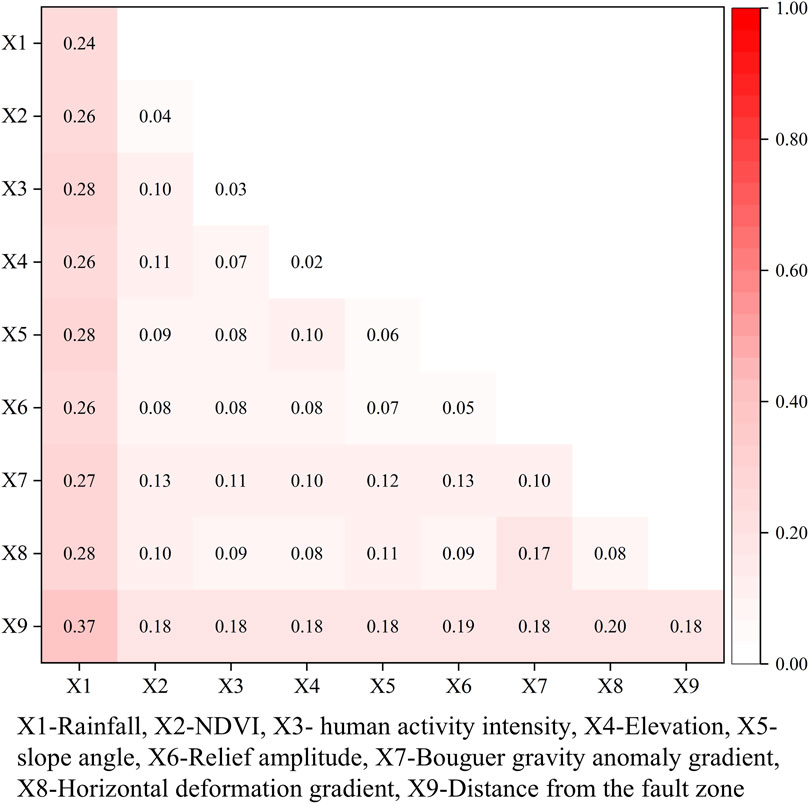
Figure 8. Interactive detection results of different influencing factors on the distribution of land-slides.
5 Landslide susceptibility and ecological vulnerability assessment of Luding County
5.1 Landslide susceptibility assessment
5.1.1 Sample dataset
Considering comprehensively the above analysis results of landslide influencing factors, this study screened out core driving factors with stable spatial explanatory power by leveraging the factor detector function of the GDM. Specifically, the study selected seven key factors, including rainfall, distance from the fault zone, Bouguer gravity anomaly gradient, horizontal deformation gradient, slope angle, relief amplitude, and NDVI to assess landslide susceptibility. This step serves as the foundation for eliminating biases caused by spatial heterogeneity, and ensures that the input features possess stable spatial explanatory power across different regions.
Based on the data of 417 landslides in Luding County, 417 non-landslide points were selected in the study area in accordance with the principle of spatial balance, thus constructing a complete dataset containing 834 samples. This process takes the spatial differentiation of rainfall, distance from the fault zone, and Bouguer gravity anomaly gradient as the core. The study area is divided into multiple sub-regions, and the number of sampled non-landslide points in each sub-region is proportional to the number of existing landslide points. All non-landslide points are located outside the 500 m radius of landslide points, and priority is given to areas with significant differences in the characteristics of the dominant landslide-influencing factors. Subsequently, the stratified sampling method was adopted to divide the total samples into a training set and a test set at a 7:3 ratio, thereby ensuring that landslide and non-landslide samples maintain class balance in both the training and testing phases.
5.1.2 Model prediction accuracy evaluation
Regional landslide susceptibility assessment in Luding County was conducted using the RF model, XGBoost model, and RX-Stacking ensemble learning model, respectively. The susceptibility levels were classified into five categories using the equal interval classification method: very low susceptibility (0–0.2), low susceptibility (0.2–0.4), moderate susceptibility (0.4–0.6), high susceptibility (0.6–0.8), and very high susceptibility (0.8–1.0) (Sahana and Sajjad, 2017; Wang et al., 2017). Furthermore, the median of each susceptibility level interval is taken as the probability p of landslide occurrence to quantify the potential threat level of different susceptibility levels to the ecological environment. Detailed assessment results are illustrated in Figure 9.
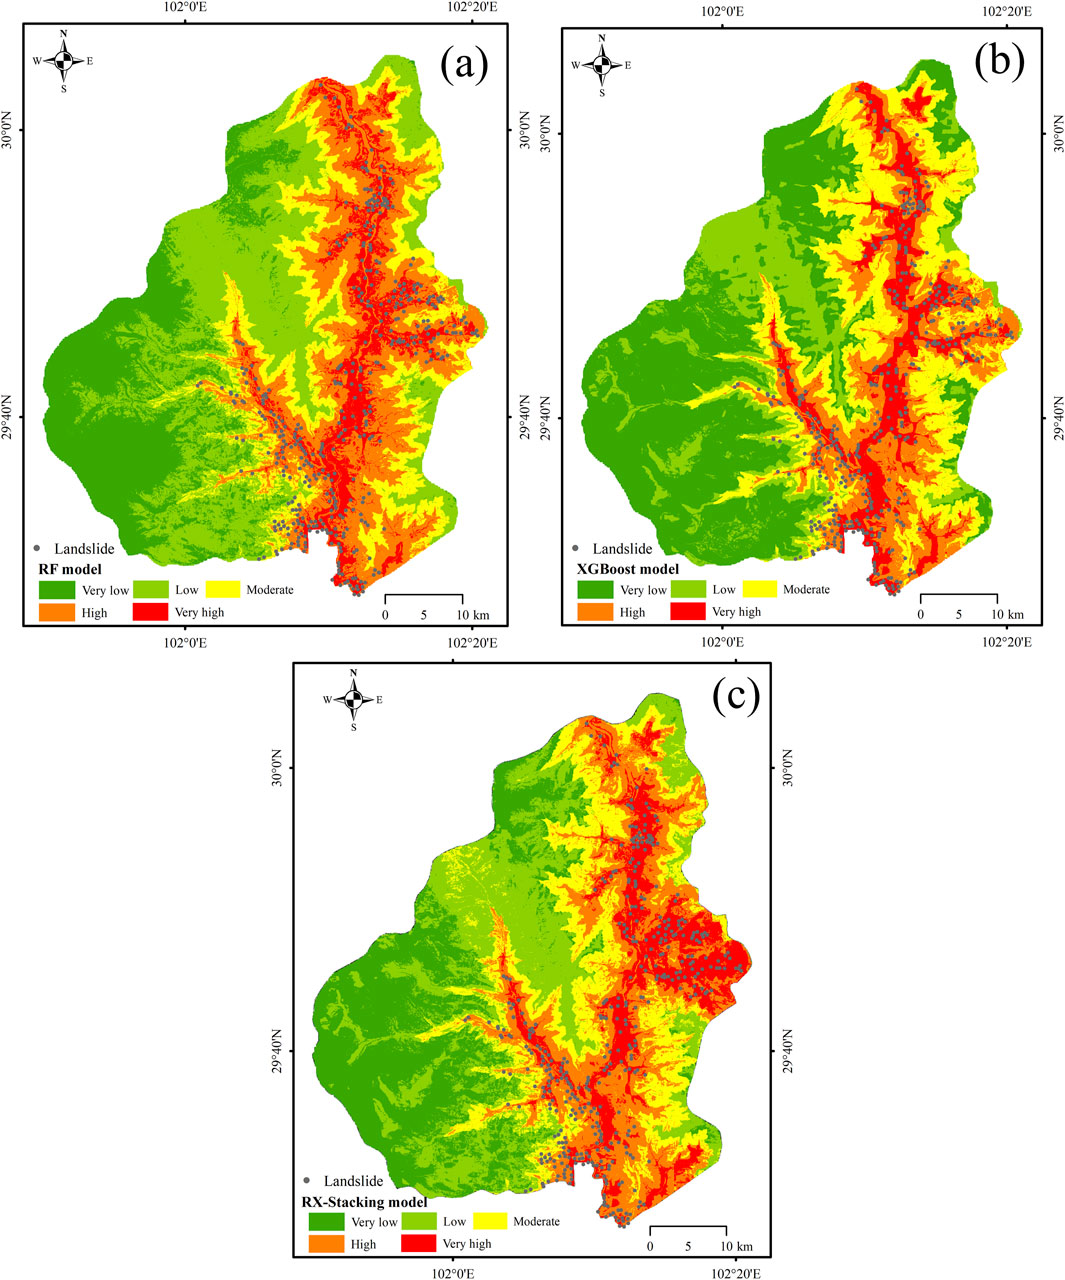
Figure 9. Results of landslide susceptibility assessment in Luding County: (a) RF model; (b) XGBoost model; (c) RX-Stacking model.
To evaluate the prediction accuracy of each model, Receiver Operating Characteristic (ROC) curves were employed for validation (Reichenbach et al., 2018). The underlying logic of ROC curves is that if a test has no diagnostic capability, the probabilities of generating true positives and false positives are identical. These curves reflect the relationship between specificity and sensitivity, graphically representing the trade-off between true positive rate (TPR) and false positive rate (FPR) (Anis et al., 2019). The Area Under the Curve (AUC) quantifies model performance, where a value closer to 1 indicates superior predictive capability, while an AUC of 0.5 denotes no practical utility. The ROC curves and AUC values of the three models are shown in Figure 10. The RF model AUC = 0.895, XGBoost model AUC = 0.903, and RX-Stacking ensemble learning model AUC = 0.926. All three models have good prediction accuracy.

Figure 10. ROC curves and AUC values of three landslide susceptibility assessment models.
Compared with other models, the AUC of RX-Stacking ensemble learning model for landslide susceptibility assessment in Luding County is 0.926, which is greater than the AUC of other models.
This indicates that the feature set screened and optimized by the GDM enables the global model to capture more detailed spatial variations in landslide susceptibility, thus avoiding underfitting or overfitting issues caused by spatial heterogeneity. To a certain extent, RX-Stacking ensemble learning model is better than the other two models for landslide susceptibility assessment in Luding County considering a variety of internal and external geodynamic factors. Compared with basic classifiers and commonly used susceptibility assessment algorithms, RX-Stacking ensemble learning model can effectively improve the prediction accuracy, and the susceptibility assessment is more accurate and reliable.
Furthermore, the landslide susceptibility assessment results of RX-Stacking show that the high and very high susceptibility zones exactly correspond to the eastern region where actual landslide disasters are frequent, while the western region with fewer disasters is correctly classified into low to moderate susceptibility zones. This high degree of spatial consistency confirms that the model does not systematically underestimate or overestimate risks in specific regions due to spatial heterogeneity, and accurately reproduces the regional differentiation pattern of landslide risks.
5.2 Ecological vulnerability assessment
According to the landslide ecological environment damage assessment model, the ecological vulnerability values of each grid unit were calculated. Then, based on the equal interval classification method, the ecological vulnerability values are divided into five levels: very low (0–0.2), low (0.2–0.4), moderate (0.4–0.6), high (0.6–0.8), and very high (0.8–1.0). The spatial distribution of different ecological vulnerability levels is shown in Figure 11. It can be seen that the ecological vulnerability is extremely high and high, accounting for 48.61% of the total regional area, medium, accounting for 18.31% of the total regional area, and low and extremely low, accounting for 33.07% of the total regional area. The high and high levels of ecological vulnerability are mainly distributed in the eastern part of the study area, while the low and extremely low levels are mainly distributed in the western part of the study area.

Figure 11. Results of ecological vulnerability assessment in Luding County.
6 Discussion
Landslides are not caused by a single factor, but by the interaction of deep earth geological processes, the surface system, the atmosphere, and human activities (Peng et al., 2023). Processes such as regional river valley downcutting triggered by the continuous uplift of the Qinghai-Tibet Plateau, and rock-soil mass fragmentation caused by tectonic deformation, manifest as a superimposed environment of high rainfall, proximity to faults, and high Bouguer gravity anomaly gradient in the eastern and southern parts of Luding County. This is precisely the core geological driving background of the “high both in susceptibility and vulnerability in the eastern part” discovered in this study.
Internal geodynamic factors such as distance from fault zone, Bouguer gravity anomaly gradient and horizontal deformation gradient are indicators of regional tectonic deformation intensity. Strong tectonic deformation will not only lead to the deformation and fracture of geological body, but also cause the change of regional tectonic stress field. And then affect the stability of regional geological structure. The results of the GDM in this study provide quantitative support for this feedback mechanism, The Bouguer gravity anomaly gradient, as an indicator of regional crustal stability, has a q value of 0.10 for the explanatory power of landslide distribution, and the landslide density in the high gradient area is significantly higher than that in the low gradient area. Meanwhile, landslides are mainly distributed within 0–10 km from faults, and the q value of the interactive explanatory power between rainfall and distance from the fault zone is as high as 0.37. These data collectively confirm that strong tectonic deformation significantly increases landslide risk in Luding County by causing rock mass fragmentation and tectonic stress concentration.
With the continuous uplift of the Qinghai Tibet Plateau, strong downcutting of the regional river valley occurred, ac-companied by severe erosion of the mountains. This geodynamic process has shaped the geomorphic features of stepped evolution, forming topographic units such as high mountains, deep valleys and wide open valleys. In this process, topographic factors such as elevation, slope angle and relief amplitude provide disaster pregnant environment for the occurrence of landslide, and play an important role in promoting the occurrence of landslides. In this study, a large number of landslides are concentrated in the area below 3000 m above sea level in Luding County. This region exhibits the most significant slope unloading effect caused by river valley downcutting, forming a disaster-prone topographic environment with high landslide frequency.
The interference of human activity, such as engineering excavation, destroyed the original stress balance of the slope. This damage intensifies the development and evolution of the shallow unloading area of the slope, and creates favorable conditions for the occurrence of landslides (Song et al., 2023). The q value of the explanatory power of human activity intensity on landslide distribution in the study area is 0.04, which is significantly lower than that of natural factors such as rainfall, distance from the fault zone, and Bouguer gravity anomaly gradient. This result is mainly due to the significant overlap between the spatial distribution of human activities and areas with high-impact natural factors. Statistics on land use classification show that areas with moderate to high human activity intensity are highly spatially coincident with high rainfall zones, near fault zone areas, and areas with high Bouguer gravity anomaly gradient. The strong driving effect of natural factors on landslide development has to a certain extent masked the independent contribution of human activity, resulting in a low explanatory power of human activity as a single factor. However, the interaction between human activity and natural factors has a significant enhancing effect on landslide distribution. For example, the q value of the interactive explanatory power between rainfall and human activity intensity is as high as 0.28, indicating that the explanatory power for landslide development is significantly improved when the two act together. At the same time, it should be objectively noted that the land use index has limited ability to capture short-term sudden engineering projects. However, field investigations show that such projects have a small individual impact range and are relatively scattered in the study area, making their contribution to the overall distribution pattern of regional landslides relatively low. Therefore, they do not have a substantial impact on the effectiveness of the land use index. Landslide development in the study area is dominated by natural dynamics, with human activity as a secondary influencing factor. Under the superposition of the natural background, the role of human activity is characterized by synergistic enhancement rather than independent dominance.
Rainfall is an important indicator of the feedback effect of atmospheric circulation. Under the influence of continuous rainfall, the physical and mechanical properties of rock and soil mass continue to deteriorate, resulting in groundwater level fluctuations and seepage path changes. This seriously affects the stability of slope rock and soil mass, and is an important trigger factor for landslides. In this process, NDVI, as an indicator of vegetation characteristics, has an important impact on slope hydrological processes such as seepage and runoff through biological hydrological processes such as canopy interception regulation, root consolidation effect and transpiration energy consumption. The rainfall characteristics in the study area exhibit significant temporal and spatial heterogeneity, rainfall from May to October accounts for approximately 80% of the annual rainfall, with rainfall in the eastern Qionglai Mountains area concentrated in the range of 800–1800 mm, and that in the western Daxue Mountains area mostly in the range of 500–800 mm. The landslide density in the 1,200–1800 mm rainfall area in the east is 2.41 times that in the 500–800 mm rainfall area in the west. Further analysis shows that this high-rainfall area highly overlaps spatially with the eastern Xianshuihe fault zone. By increasing the water content of rock and soil masses and raising pore water pressure, rainfall significantly reduces the shear strength of rock and soil masses in the fault fracture zone, forming a synergistic triggering effect between rainfall and the tectonic fracture zone. It is precisely the concentrated rainy season, uneven spatial distribution, and overlapping with structurally fragile areas that make the explanatory power of rainfall on landslide distribution significantly higher than other factors.
In the study area, except for the high-altitude snow mountain areas which show low NDVI values due to natural constraints, other areas with medium and low NDVI values present a scattered point-like pattern in the eastern part, and most landslides also occur in these areas. In these areas with moderate vegetation coverage, landslide susceptibility is still mainly dominated by the combined factors of rainfall and fault zone. The infiltration effect of heavy rainfall significantly offsets the positive role of vegetation in soil consolidation and water retention, resulting in the independent contribution of NDVI being masked. In addition, these medium and low NDVI areas in low-altitude zones often highly overlap with areas with intensive human activities. Human engineering activity have damaged the surface soil structure and stability, further weakening the protective effect that vegetation should have provided. The q value of the single-factor explanatory power of NDVI is only 0.06, which is not due to the overall level of vegetation coverage, but because its protective role is subject to dual constraints from regional dominant factors and human activities.
As shown in Figures 9, 12, the high and very high susceptibility zones identified by all three models are predominantly distributed in the eastern part of the study area. In this area, the overall rainfall is the largest, the distance from the fault zone is relatively short, and the Bouguer gravity anomaly gradient is the largest. Combined with the in-creasing influence of human activities, many factors jointly aggravate the risk of land-slides in this area. Notably, the spatial clustering of high-susceptibility zones in the east is not a random occurrence but closely aligns with the synergistic influence of the core predisposing factors emphasized in this study. Intense rainfall provides ample water to reduce the shear strength of rocks and soils, the proximity to fault zones reflects structurally fragmented and unstable geology, and a high Bouguer gravity anomaly gradient suggests significant deep-seated tectonic activity. When superimposed with human interventions, these conditions further amplify the landslide susceptibility. At the same time, the landslide susceptibility assessment by different models also has some differences. Compared with the RF model and XGBoost model, the RX-Stacking ensemble learning model has the highest proportion in high and extremely high susceptibility regions, reaching 34% of the total area. The proportion of low and extremely low susceptibility areas is the smallest, only 49%. This difference in proportion is attributed to the RX-Stacking model’s advantage in integrating features from diverse base models. It effectively compensates for the limitations of single models and more accurately identifies the subtle differences in susceptibility within the eastern part, which aligns better with the actual landslide density distribution.

Figure 12. Proportion of susceptibility levels in different susceptibility assessment results.
From the above analysis, it can be seen that the eastern part of the study area is prone to landslides. The RX-Stacking ensemble learning model can divide the landslide susceptibility in the eastern part of the study area into extremely high and high, which is more in line with the actual landslide distribution. Compared to other models, the RX-Stacking ensemble learning model integrates features from diverse base models to achieve com-prehensive data representation (Merghadi et al., 2020). It demonstrates balanced classification across susceptibility levels, robust generalization capability, and significant potential for enhancing landslide disasters prediction accuracy. More importantly, this result provides a clear target for landslide risk management in the study area, the high and extremely high susceptibility area in the east should be prioritized for monitoring and prevention measures. The RX-Stacking model’s classification results can be used to delineate precise management units to avoid the inefficiency of “one-size-fits-all” risk control.
The distribution of landslide susceptibility levels and ecological vulnerability levels is highly consistent. This spatial consistency is not coincidental but stems from the interactive effects of core environmental factors identified in this study. The eastern area, characterized by clustered high landslide susceptibility, coincides precisely with the zone where elevation is below 3,000 m and annual rainfall exceeds 800 mm. These specific hydrothermal conditions not only facilitate landslide occurrence but also support ecosystems with high service functions, thereby creating an inherent coupling between landslide susceptibility and ecological vulnerability. The ecosystem services in this region are manifested primarily through soil and water conservation and the maintenance of biodiversity, findings which align with the ecological function assessment results of this study. Once a landslide occurs, ecosystem services will suffer serious losses. However, the western regions have higher altitudes, colder climates, lower vegetation coverage, and weaker eco-system service capabilities, resulting in lower ecological damage values. This spatial differentiation of ecological damage provides targeted support for regional disaster management. The eastern region, identified as a key area of high susceptibility and vulnerability, requires subsequent measures that synchronously consider both landslide prevention and ecological protection. In contrast, the western region can focus on low-intensity natural restoration, based on its weaker ecosystem service functions.
Landslide prevention and control measures in different risk areas need to be more targeted and tailored to local conditions. For the overlapping areas with high landslide susceptibility and high ecological vulnerability in the eastern and southern regions, it is recommended to prioritize the establishment of a real-time monitoring network for the dual factors of rainfall and fault activity. For example, additional rainfall stations and GNSS deformation monitoring points should be installed along the Xianshuihe fault zone; composite measures of “biological slope stabilization + engineering reinforcement” should be promoted in areas with concentrated cultivated land and forestland; and at the same time, tourism development and engineering construction in high-risk areas such as the Hailuogou scenic area should be strictly restricted. Although the western low-risk areas have lower landslide susceptibility and ecological vulnerability, their ecosystem services are limited. Therefore, a prevention-oriented strategy is recommended, including strictly restricting overgrazing and mineral mining, increasing NDVI through artificial afforestation to enhance slope erosion resistance, and designating the region as an ecological buffer zone to prevent new landslides triggered by development activities.
Although this study systematically conducted landslide susceptibility and ecological vulnerability assessments in Luding County through the technical framework integrating the GDM, ensemble learning, and ecological damage assessment, providing scientific support for regional disaster prevention and mitigation, there are still some limitations that need to be addressed in future research. This study used static data for the assessments and failed to fully consider the temporal heterogeneity characteristics of landslide driving factors. In the future, it is necessary to further integrate higher-precision InSAR surface deformation monitoring data to dynamically depict the evolution process of slope stability, thereby improving the spatiotemporal accuracy of landslide susceptibility assessment. Meanwhile, in terms of ecological vulnerability assessment, this study only took changes in land use types as the core assessment indicator and did not further integrate key ecological process indicators such as soil erosion modulus and the degree of biodiversity loss. This makes it difficult to fully reflect the multi-dimensional damage characteristics of landslides to ecosystems. Further research is needed in the future.
7 Conclusion
1. Landslide disasters are densely distributed within Luding County, predominantly clustered in the eastern and southern regions, with an overall density of 0.19 landslides per square kilometer.
2. Rainfall, distance from the fault zone and Bouguer gravity anomaly gradient have the most significant effects on the distribution of landslides in Luding County, with q values of 0.24, 0.18 and 0.10, respectively. Comparatively, horizontal deformation gradient, slope angle, and relief amplitude demonstrated secondary influences, while NDVI, hu-man activity intensity, and elevation contributed minimally to the spatial distribution patterns of landslides.
3. The interaction between the influencing factors is mainly nonlinear enhancement effect. The interaction of any two factors has more influence on the spatial distribution of landslide than a single factor. The interaction between rainfall and other factors is much greater than that between other factors.
4. Regional landslide susceptibility assessment in Luding County was conducted using the RF model, XGBoost model, and RX-Stacking ensemble learning model. The RF model achieved an AUC of 0.895, the XGBoost model attained an AUC of 0.903, and the RX-Stacking ensemble learning model with an AUC of 0.926. All three models exhibited strong predictive accuracy in landslide susceptibility evaluation. Compared with other models, the AUC value of RX-Stacking ensemble learning model is higher, which to some extent shows that the model has better assessment effect on landslide susceptibility in Luding County considering the internal and external geodynamic factors, and has good generalization ability.
5. According to the landslide ecological environment damage assessment model, an ecological vulnerability assessment was conducted on Luding County. The distribution of landslide susceptibility levels and ecological vulnerability levels showed a high degree of consistency. The area with the highest ecological damage value is mainly concentrated in the eastern part of the study area, where the ecosystem service functions are significant. Once a landslide occurs, it can easily lead to serious ecosystem service damage. However, the ecosystem service capacity in the western region is weak, and the ecological damage caused by landslides is relatively low.
6. At the regional development level, the high coupling between landslide susceptibility and ecological vulnerability reveals the symbiotic relationship between disaster risks and ecological values in the Western Sichuan Mountains, providing a core basis for this region to balance development and protection and formulate sustainable development policies.
Data availability statement
The original contributions presented in the study are included in the article/supplementary material, further inquiries can be directed to the corresponding author.
Author contributions
CL: Data curation, Investigation, Writing – original draft. LS: Data curation, Methodology, Project administration, Writing – original draft.
Funding
The author(s) declare that financial support was received for the research and/or publication of this article. This research was funded by the Key Project of Natural Science Research Program of Anhui Provincial Education Department and 2023 International Visiting Scholar Program for Young Key Teachers, with grant numbers 2023AH052494 and JWFX2023045, respectively.
Conflict of interest
The authors declare that the research was conducted in the absence of any commercial or financial relationships that could be construed as a potential conflict of interest.
Generative AI statement
The author(s) declare that no Generative AI was used in the creation of this manuscript.
Any alternative text (alt text) provided alongside figures in this article has been generated by Frontiers with the support of artificial intelligence and reasonable efforts have been made to ensure accuracy, including review by the authors wherever possible. If you identify any issues, please contact us.
Publisher’s note
All claims expressed in this article are solely those of the authors and do not necessarily represent those of their affiliated organizations, or those of the publisher, the editors and the reviewers. Any product that may be evaluated in this article, or claim that may be made by its manufacturer, is not guaranteed or endorsed by the publisher.
References
Anis, Z., Wissem, G., Vali, V., Smida, H., and Essghaier, G. M. (2019). GIS-based landslide susceptibility mapping using bivariate statistical methods in north-Western Tunisia. Open Geosci. 11, 708–726. doi:10.1515/geo-2019-0056
Cloetingh, S., and Willett, S. D. (2013). TOPO-EUROPE: understanding of the coupling between the deep earth and continental topography. Tectonophysics 602, 1–14. doi:10.1016/j.tecto.2013.05.023
Convertino, M., Troccoli, A., and Catani, F. (2013). Detecting fingerprints of landslide drivers: a MaxEnt model. J. Geo-Physical Research-Earth Surf. 118 (3), 1367–1386. doi:10.1002/jgrf.20099
Dai, X. A., Yao, Y., Chen, L., Li, W. L., and Guo, Y. T. (2025). Landslide susceptibility evaluation model based on optimization of heterogeneous ensemble learning technology: a case study of luding county. Journal of Chengdu University of Technology Science and Technology Edition, 1–16. doi:10.12474/cdlgzrkx.2024101501
Dandridge, C., Stanley, T. A., Kirschbaum, D. B., and Lakshmi, V. (2023). Spatial and temporal analysis of global landslide Re-porting using a decade of the global landslide catalog. Sustainability 15 (4), 3323. doi:10.3390/su15043323
Dikshit, A., Sarkar, R., Pradhan, B., Segoni, S., and Alamri, A. M. (2020). Rainfall induced landslide studies in Indian himalayan region: a critical review. Appl. Sciences-Basel 10 (7), 2466. doi:10.3390/app10072466
Fan, X. M., Scaringi, G., Xu, Q., Zhan, W. W., Dai, L. X., Li, Y. S., et al. (2018). Coseismic landslides triggered by the 8th August 2017 Ms 7.0 jiuzhaigou earthquake (Sichuan,China):factors controlling their spatial distribution and implications for the seismogenic blind fault identification. Landslides 15 (5), 967–983. doi:10.1007/s10346-018-0960-x
Fang, Z. C., Wang, Y., Peng, L., and Hong, H. Y. (2021). A comparative study of heterogeneous ensemble-learning techniques for landslide susceptibility mapping. Int. J. Geogr. Inf. Sci. 35 (2), 321–347. doi:10.1080/13658816.2020.1808897
Freund, Y., and Schapire, R. E. (1997). A desicion-theoretic generalization of on-line learning and an application to boosting. J. Comput. Syst. Sci. 55, 23–37. doi:10.1007/3-540-59119-2_166
Fu, G. Y., Gao, S. H., Freymueller, J. T., Zhang, G. Q., Zhu, Y. Q., and Yang, G. L. (2014). Bouguer gravity anomaly and isostasy at Western sichuan basin revealed by new gravity surveys. J. Geophys. Research-Solid Earth 119, 3925–3938. doi:10.1002/2014JB011033
Goetz, J. N., Brenning, A., Petschko, H., and Leopold, P. (2015). Evaluating machine learning and statistical prediction techniques for landslide susceptibility modeling. Comput. and Geosciences 81, 1–11. doi:10.1016/j.cageo.2015.04.007
Gu, Z. K., Yao, X., Li, G. G., and Zhu, X. C. (2023). Driving effects of dynamic geomorphologic environments on gravitational erosion hazards: a case of the baihetan drainage area of the jinsha river, China. Bull. Eng. Geol. Environ. 82, 49. doi:10.1007/s10064-022-03051-w
Guo, C. B., Ni, J. W., Yang, Z. H., Wu, R. A., Sun, W. F., and Zhang, Y. Y. (2021). The ancient landslides development characteristics and stability evaluation along the luding section, dadu river, Western Sichuan Province. Geol. Buletin China 40 (12), 1981–1991. doi:10.12097/gbc.dztb-40-12-1981
Guzzetti, F., Malamud, B. D., Rossi, M., and Reichenbach, P. (2018). Landslide hazard assessment: summary review and new perspectives. Earth Sci. Rev. 180, 60–91. doi:10.1016/j.earscirev.2018.03.001
Huang, R. Q., and Li, W. L. (2008). Research on development and distribution rules of geohazards induced by wenchuan earthquake on 12th may,2008. Chin. J. Rock Mech. Eng. 27 (12), 2585–2592. doi:10.3321/j.issn:1000-6915.2008.12.028
Huang, F. M., Ouyang, W. P., Jiang, S. H., Fan, X. M., Lian, Z. P., and Zhou, C. B. (2024). Landslide susceptibility prediction considering spatio-temporal division principle of training/testing datasets in machine learning models. Earth Sci. 49 (5), 1607–1618. doi:10.3799/dqkx.2022.357
Li, J., Liu, H. B., Yang, Z. J., and Han, L. (2021). A credit risk model with small sample data based on G-XGBoost. Appl. Artif. Intell. 35 (15), 1550–1566. doi:10.1080/08839514.2021.1987707
Liu, J. P., Liang, E. J., Xu, S. H., Liu, M. M., Wang, Y., Zhang, F. H., et al. (2022). Multi-kernel support vector machine considering sample optimization selection for analysis and evaluation of landslide disaster susceptibility. Acta Geodetica Carto Graph. Sinica 51 (10), 2034–2045. doi:10.11947/j.AGCS.2022.20220326
Ma, C., Cui, P. P., Zhong, G. R., Meng, M., Yang, C., and Ma, W. S. (2021). Impact of climate change and engineering activities on spatiotemporal changes of vegetation index along Qinghai-Tibet railway. Geogr. Res. 40 (01), 35–51. doi:10.11821/dlyj020200528
Ma, S. Y., Lu, Y., Xia, C. X., Liu, X. M., Qi, W. H., and Yuan, R. M. (2023). Brief report of landslides triggered by the 2022 Ms 6.8 luding earthquake, sichuan, China. Landslides 20 (12), 2695–2707. doi:10.1007/s10346-023-02156-x
Ma, S. Y., Shao, X. Y., and Xu, C. (2024). Landslide inventory and distribution patterns in lhasa area, Tibet Plateau. Nat. Haz-Ards 121 (5), 5849–5871. doi:10.1007/s11069-024-07031-z
Merghadi, A., Yunus, A. P., Dou, J., Whiteley, J., ThaiPham, B., Bui, D. T., et al. (2020). Machine learning methods for landslide susceptibility studies: a comparative overview of algorithm performance. Earth-Science Re-Views 207, 103225. doi:10.1016/j.earscirev.2020.103225
Mtibaa, S., and Tsunetaka, H. (2023). Revealing the relation between spatial patterns of rainfall return levels and landslide density. Earth Surf. Dyn. 11 (3), 461–474. doi:10.5194/esurf-11-461-2023
Peng, J. B., Zhang, Y. S., Huang, D., Wang, F. Y., and Wang, Z. P. (2023). Interaction disaster effects of the tectonic deformation sphere, rock mass loosening sphere, surface freeze-thaw sphere and engineering disturbance sphere on the Tibetan Plateau. Earth Sci. 48 (8), 3099–3114. doi:10.3799/dqkx.2023.137
Qi, T. J., Meng, X. M., Qing, F., Zhao, Y., Shi, W., Chen, G., et al. (2021). Distribution and characteristics of large landslides in a fault zone: a case study of the NE Qinghai-Tibet Plateau. Geomorphology 379, 107592. doi:10.1016/j.geomorph.2021.107592
Reichenbach, P., Rossi, M., Malamud, B. D., Mihir, M., and Guzzetti, F. (2018). A review of statistically-based landslide susceptibility models. Earth Sci. Rev. 180, 60–91.
Sahana, M., and Sajjad, H. (2017). Evaluating effectiveness of frequency ratio, fuzzy logic and logistic regression models in assessing landslide susceptibility: a case from rudraprayag district, India. J. Mt. Sci. 14 (11), 2150–2167. doi:10.1007/s11629-017-4404-1
Shu, B., Chen, Y., Amani-Beni, M., and Zhang, R. Z. (2022). Spatial distribution and influencing factors of mountainous geological disasters in southwest China: a fine-scale multi-type assessment. Front. Environ. Sci. 10, 1049333. doi:10.3389/fenvs.2022.1049333
Song, Y. W., Guo, J., Ma, F. S., Liu, J., and Li, G. (2023). Spatial distribution analysis and application of engineering disturbance dis-asters in the himalayan alpine valley. Front. Earth Sci. 10, 1098631. doi:10.3389/feart.2022.1098631
Wang, J. F., Zhang, T. L., and Fu, B. J. (2016). A measure of spatial stratified heterogeneity. Ecol. Indic. 67, 250–256. doi:10.1016/j.ecolind.2016.02.052
Wang, Q., Wang, Y., Niu, R. Q., and Peng, L. (2017). Integration of information theory, K-means cluster analysis and the logistic regression model for landslide susceptibility mapping in the three gorges area, China. Remote Sens. 9 (9), 938. doi:10.3390/rs9090938
Wang, Y. S., Zhao, B., and Li, J. (2018). Mechanism of the catastrophic June 2017 landslide at xinmo village, songping river, Sichuan Province, China. Landslides 15, 333–345. doi:10.1007/s10346-017-0927-3
Wang, K. S., Chen, H. Q., and Wen, G. C. (2025). Evaluation of ecological environment damages of mass landslides in high vegetation cover areas. Saf. Environ. Eng. 32 (02), 356–364. doi:10.13578/j.cnki.issn.1671-1556.20231007
Wolpert, D. (1992). Stacked generalization. Neural Netw. 5 (2), 241–259. doi:10.1016/S0893-6080(05)80023-1
Wu, X. L., Shen, S. Q., and Niu, R. Q. (2016). Landslide susceptibility prediction using GIS and PSO-SVM. Geomatics Inf. Sci. Wuhan Univ. 41 (5), 665–671. doi:10.13203/j.whugis20130566
Xie, H. P., Zhang, H. R., Deng, J. H., Gao, M. Z., Li, Y. H., He, Z. L., et al. (2021). A preliminary study on the technical system of deep Earth science and geo disaster prevention-control based on the “Deep Earth–Surface” linkage strategy. Adv. Eng. Sci. 53 (04), 1–12. doi:10.15961/j.jsuese.202100493
Xu, J. H., Sun, D. L., Zhang, H., Wen, H. J., Wu, J. P., and Huang, Y. (2023). Multi-scale ecological risk assessment and risk management of landslide disasters: a case study of wanzhou-wushan section in the three gorges reservoir area. Acta Ecol. Sin. 43 (11), 4594–4603. doi:10.5846/stxb202105181296
Yang, Z. H., Zhang, Y. S., Guo, C. B., and Yao, X. (2018). Sensitivity analysis on causative factors of geohazards in eastern margin of Tibetan Plateau. J. Eng. Geol. 26 (3), 673–683. doi:10.13544/j.cnki.jeg.2017-165
Yang, L. W., Wang, W. P., Zhang, N., and Wei, Y. J. (2020). Characteristics and numerical runout modeling analysis of the xinmo landslide in sichuan, China. Earth Sci. Res. J. 24 (2), 169–181. doi:10.15446/esrj.v24n2.78990
Yao, X., Li, L. J., Zhang, Y. S., Guo, C. B., and Zhou, N. J. (2015). Regional crustal stability assessment of the eastern margin of Tibetan Plateau. Geol. Bull. China 34 (1), 32–44. doi:10.3969/j.issn.1671-2552.2015.01.003
Yin, J. H., Chen, J., Xu, X. W., Wang, X. L., and Zheng, Y. G. (2010). The characteristics of the landslides triggered by the wenchuan Ms 8.0 earthquake from anxian to beichuan. J. Asian Earth Sci. 37 (5-6), 452–459. doi:10.1016/j.jseaes.2009.12.002
Keywords: landslide, geographical detector model, ensemble learning model, susceptibility assessment, ecological vulnerability
Citation: Li C and Shen L (2025) Research on landslide ecological vulnerability assessment in alpine valley region considering spatial heterogeneity and feature optimization: a case study of Luding County. Front. Environ. Sci. 13:1686605. doi: 10.3389/fenvs.2025.1686605
Received: 15 August 2025; Accepted: 26 September 2025;
Published: 13 October 2025.
Edited by:
Juergen Pilz, University of Klagenfurt, AustriaReviewed by:
Zhen Zhang, Anhui University of Science and Technology, ChinaChuangang Gong, Anhui University of Science and Technology, China
Copyright © 2025 Li and Shen. This is an open-access article distributed under the terms of the Creative Commons Attribution License (CC BY). The use, distribution or reproduction in other forums is permitted, provided the original author(s) and the copyright owner(s) are credited and that the original publication in this journal is cited, in accordance with accepted academic practice. No use, distribution or reproduction is permitted which does not comply with these terms.
*Correspondence: Lu Shen, d3QxNDA0OUB3anV0LmVkdS5jbg==