 Nathaniel Goetz1,2*†
 Clara Chang3,4
 Stephen Kovari2†
 Marina Alfano2†
 Aarna Pal-Yadav2†
 Derrick Vaughn5,6†
 Dorothy Peteet2,3,4*
- 1Department of Earth and Environmental Engineering, Columbia University, New York, NY, United States
- 2Goddard Institute for Space Studies, NASA, New York, NY, United States
- 3New Core Lab, Division of Biology and Paleoenvironment, Lamont-Doherty Earth Observatory, Palisades, NY, United States
- 4Department of Earth and Environmental Sciences, Columbia University, New York, NY, United States
- 5School of the Environment, Yale University, New Haven, CT, United States
- 6Department of Geosciences, Utah State University, Logan, UT, United States
Tidal wetlands provide critical ecosystem functions for coastal communities including flood protection, water filtration, carbon sequestration and aquatic nursery habitat. However, New York City’s salt marshes, including our study site at Pelham Bay Park’s Turtle Cove, are rapidly disappearing due to accelerating relative sea-level (RSL) rise and coastal development. Field research, mapping and satellite imagery reveal significant loss of this ∼10 hectare (ha) wetland, as perturbations from human activity prevent marsh landward migration, impede tidal flows and threaten marsh survival. We extracted three sediment cores and conducted 20 m transects across a gradient of disturbed marsh areas. We present the analyses of land-use change, X-ray fluorescence (XRF), loss on ignition (LOI), stable carbon isotopes (δ13C), foraminifera, and accelerator mass spectrometry (AMS) radiocarbon dating of terrestrial macrofossils to examine the past and to inform future conditions for this rapidly eroding wetland. Moreover, we reconstruct sea level over a millennium to analyze changes in marsh plant communities in response to RSL rise and coastal development. We found that between 1974 and 2018 CE, ∼65% of marsh disappeared at a rate of 1.5% yr-1 or 800 m2 yr-1. The marsh loss coincided with increasing RSL rates of 3.5 mm yr-1 from 1958-1975 CE to 6.7 mm yr-1 from 1999-2024 CE. Meanwhile, developed areas expanded 568 m2 yr-1 from 1985-2023 CE, replacing wetland areas and disrupting hydrologic processes with hardened shorelines. Marsh loss resulted in the release of soil organic carbon stored over many centuries and a concerning amount of lead (Pb) into Long Island Sound, presenting risks to public health and wildlife. Culvert assessments demonstrated that tidal restriction by built structures contributed to rising tide levels comparable to RSL rise over the past century, which likely exacerbated marsh erosion. Lastly, tidal prism reductions caused enough accumulation of heavy metals to significantly alter peat chemical composition for a century. This study improves our understanding of compounded stressors that prevent the capacity of salt marshes to with stand anthropogenic impacts. Ultimately, our findings inform an adaptive management of these threatened ecosystems in their struggle to keep pace with climate change and urbanization.
1 Introduction
Tidal wetlands, including salt marshes, are frequently saturated with shallow water levels that fluctuate diurnally with the tidal cycles and thus support anaerobic soils. These coastal hydrology characteristics help distinguish salt marshes from terrestrial ecosystems. If undisturbed, such anoxic constraints inhibit soil microbial activity and subsequently reduce decomposition rates, allowing for the accretion or vertical accumulation of organic-rich peat over multiple millennia (Chmura et al., 2003; Peteet et al., 2007; Howard, 2014). Given their unique stratigraphic and anaerobic conditions, salt marshes are among the world’s most efficient carbon (C) sinks, with over 50 times the C sequestration rate per unit area relative to terrestrial forest ecosystems (Mcleod, 2011; Chmura et al., 2003). Despite covering less than 5% of the global land area and 2% of the ocean surface, salt marshes are estimated to store nearly one-third of the organic C buried in the ocean floor (Duarte et al., 2005; Wang et al., 2020). Salt marsh soils are also effective at trapping and accumulating heavy metal pollutants associated with health risks to humans and aquatic wildlife (Ali et al., 2019; Jezycki et al., 2024; Ma et al., 2022).
However, accelerating relative sea-level (RSL) rise on the east coast of North America threatens the existence of salt marshes, which are increasingly unable to adapt quick enough to maintain their elevation in the tidal frame. Historically, salt marshes relied primarily on vertical accretion to keep pace with RSL rise and survive. However, RSL is rising to such an extent that regional salt marshes are steadily forced to adapt via lateral migration. At our study site in Pelham Bay (New York, USA) a mean annual marsh accretion rate of ∼0.5 mm yr-1 prior to 1800 CE sharply increased to a 20th century rate of 3.0 mm yr-1, with current regional rates up to 3.6 mm yr-1 (Kemp et al., 2017; Hill and Anisfeld, 2015). In response to accelerating RSL rise, nearby Long Island Sound salt marshes have shifted horizontally or landward to higher areas upslope, in some cases over 50 m in half a century (Anisfeld et al., 2019). Ultimately, the demise of salt marshes is increasingly inevitable, especially when confronted by developed shorelines with physical anthropogenic barriers.
In the context of accelerating RSL rise, the existential threat salt marshes face is compounded by the concurrent intensification of development along coastlines. This scenario is known as coastal squeeze, where hardened shorelines paved with impervious surfaces from seawalls, roads, culverts, bulkheads and other built structures prohibit tidal wetlands from accreting vertically or migrating landward in order to survive (Pontee, 2013; Torio and Chmura, 2013). For example, in Hempstead Bay, NY, marshes with channelized edges accelerated wetland loss rates by nearly four-fold and contributed to significantly higher multidecadal erosion rates compared to marshes with naturally vegetated edges (Browne, 2017). By 2100 CE, nearly 60% of the U.S. Atlantic coast is expected to be developed and unsuitable for inland migration of wetlands, with 73% of New York’s shoreline currently developed (Titus, 2009). Other estimates demonstrate that as many as 80% of New England salt marshes have already disappeared due to coastal development (Bertness et al., 2002).
In addition to hardened shorelines prohibiting marsh migration, the effects of coastal development undermine marsh survival by also disrupting hydrodynamic processes and reducing tidal flows. Tidal restriction occurs when a built structure limits tidal exchange between upstream and downstream habitats, and is therefore used as a proxy for hydrologic disturbance (U.S. EPA, 2020). For Long Island Sound salt marshes, tidal restriction, particularly from culverts, reduces the intertidal marsh zone and lowers the water table and marsh elevation, in some cases by up to four feet (Roman et al., 1984; Long Island Sound Study, 2003). Consequently, limited tidal ranges threaten marshes with increasing rates of peat oxidation, microbial decomposition of organic matter, soil compaction and subsidence, and the reduction of carbon sequestration and sediment accretion rates (Kroeger, 2017). Furthermore, modifications to the hydrologic regime of tidally restricted marshes are associated with changes to peat chemical composition that contribute to the elevated concentration and mobilization of heavy metals (Anisfeld and Benoit, 1997).
Meanwhile, about half of the salt marshes globally have degraded or disappeared due to RSL rise and vegetation disturbance from shoreline development (Barbier, 2011; Bertness et al., 2002). This pattern is consistent regionally, as New York has lost ∼48% of tidal wetlands since 1880 CE (Basso et al., 2015; Dahl, 1990). The associated carbon loss accelerates a positive feedback of climate change via anthropogenic forcing. For instance, around 450 million metric tons of annual carbon dioxide (CO2) are emitted from the human-induced disruption of tidal marshes worldwide, nearly the equivalent of the United Kingdom’s total annual CO2 emissions (Pendleton, 2012). Marsh degradation and erosion also exposes estuaries to legacy pollution from the remobilization of toxic heavy metals (Vane et al., 2020; Peteet et al., 2018). For example, the likely erosion of a nearby marsh in Staten Island would release heavy metal contaminants into the waterway from sediment that exceeds NYC’s sediment quality standards, which involves adverse biological effects (Vane et al., 2020).
The purpose of this research is to examine the role of anthropogenic impacts on the disappearance of salt marshes. We seek to improve our ability to evaluate how coastal development exacerbates marsh loss in the context of accelerating RSL, focusing specifically on the effects of hydrologic disruption from tidal restriction and the impediment of marsh migration by hardened shorelines. This study also attempts to demonstrate the consequences for carbon storage and water quality resulting from the compounded stressors of human-induced marsh erosion. Overall, the objective is to inform an adaptation management approach that supports these threatened coastal ecosystems and therefore improve community resilience.
2 Materials and methods
We use a range of methods to investigate the combined impacts of accelerating RSL rise and coastal development on marsh loss, and consequently the implications to C storage and heavy metal pollution. RSL trends at the site were derived using water level data from multiple NOAA tide gauges near the site. GIS mapping was conducted for a spatiotemporal analysis of land cover and quantifying multidecadal trends for developed areas. High-resolution orthoimagery allowed us to overlay aerial photographs and measure the extent of marsh loss over time. Field work included extracting three sediment cores (1.5–1.9 m depth) across an anthropogenic disturbance gradient, three 20 m depth transects recording marsh depth profiles and culvert assessments to evaluate wetland hydrology perturbations by tidal restriction. Finally, laboratory analyses of XRF, LOI, C stocks, δ13C, foraminifera, and AMS radiocarbon dating involved sampling sediment cores to estimate the release of stored C and heavy metal pollutants resulting from marsh erosion, and ultimately reconstruct a marsh sedimentological chronology over many centuries.
2.1 Site selection
The salt marshes of the northeastern United States, which include New York City (NYC) and our site at Turtle Cove, formed in the Mid-Holocene (<6,000 years before present; yBP) as accretion rates kept pace with relatively slow rates of post-glacial RSL rise (Orson, Warren, and Niering, 1998; Engelhart and Horton, 2012; Redfield, 1972; Nixon, 1982). During this time, a steady-state wetland formation process depended on optimal RSL rise rates (1–2 mm yr-1) to maintain a system of dynamic equilibrium (Engelhart and Horton, 2012; Varekamp and Thomas, 1998). However, reversing trends in marsh growth are currently documented at an unprecedented rate, highlighting NYC’s disproportionate vulnerability to the impacts of climate change, particularly RSL rise (Hartig, 2002).
From 1856 to 2024 CE, the annual rate of RSL rise at The Battery (New York Harbor) was 2.94 mm yr-1 (NOAA Sea Level Trends). Since 1900 CE, NYC’s mean RSL rise rate of 3.05 mm yr-1 doubled the global average of 1.52 mm yr-1 (Horton, 2015). Regional RSL trends are primarily a result of crustal subsidence from glacial isostatic adjustment since the deglaciation of the Laurentide Ice Sheet, which terminated at the Long Island moraine just south of Manhattan (Engelhart et al., 2011; Kopp, 2014). Furthermore, thermal expansion due to global ocean warming (Levermann, 2005), rapid melting of the West Antarctic Ice Sheet (WAIS; Scambos, 2017; Gomez, 2010) and intensified ocean circulation patterns expose NYC to the compounded risks associated with RSL rise (Davis, 2023; Yin et al., 2008).
This study focuses on the Turtle Cove salt marsh (Figure 1) in The Bronx’s Pelham Bay Park, which has the largest tidal wetland area in NYC excluding Jamaica Bay (NYC Parks). From ∼6000 YBP to ∼1885 CE, Turtle Cove was not a cove, but rather a tidal inlet connecting Eastchester Bay and Pelham Bay to Long Island Sound with continuous salt marsh habitat (Blaskowitz, 1776; Hosmer, 1882). Turtle Cove was originally inhabited by the Turtle Clan of the Algonquin people (Kazimiroff, 1991). In 1776 CE, the marsh was used as a naval landing and battleground site during the U.S. Revolutionary War (National Park Service). Today, there are nearly 1,500 ha of salt marshes in NYC and over 5% are in Pelham Bay Park (Natural Areas Conservancy). The area surrounding the site has approximately 10 ha of salt marsh now managed by the New York City Department of Parks and Recreation (NYC Parks).

Figure 1. Cartographic map of our study site at the Turtle Cove marsh in The Bronx, New York City (NYC). Top Left: Inset shows the position of the site in relation to the Atlantic Northeast (A). Bottom Left: Marsh location with NYC boroughs, Long Island Sound and the nearest NOAA tide gauge stations visible (B). Top Right: Turtle Cove in relation to the surrounding Pelham marsh, waterways and recent shoreline development (C). Bottom Right: Locations of sediment cores and line transects for Turtle Cove Inner North (TCI-N), Turtle Cove Inner South (TCI-S) and Turtle Cove Outer Remnant (TCO-R; D). Numbers in parentheses correspond to core depth (black) and mean transect depth (red) expressed in meters. Arrows represent current tidal exchanges at the recently expanded City Island Road culvert and partially removed railroad berm. Sources: NOAA Tides & Currents (A,B), National Wetlands Inventory and NYSDEC Regulatory Tidal Wetlands (C,D).
In the late-19th Century, coastal development began to fragment the marsh and severely disrupt the tidal inlet’s hydrology. These modifications included the construction of City Island Road, which initially divided the tidal inlet into an inner and outer marsh area, and draining the Turtle Cove marsh in 1934 CE to build Orchard Beach Road as part of the Orchard Beach landfill plan by Robert Moses (Pincus, 1885; Kadinsky, 2019) (Figure 1C). Furthermore, the City Island Railroad bisected the marsh into Turtle Cove Inner North (TCI-N) and Turtle Cove Inner South (TCI-S) in 1910 CE (Figure 1D). As a result of the rail impoundment, TCI-N was completely isolated from tidal flows, transforming the salt marsh into a freshwater seasonal wetland dominated by invasive vegetation (Supplementary Figure S1A) and periodically saturated by stormwater runoff (Friends of Pelham Bay Park). The coastal development and ensuing marsh loss and degradation at our study site has direct implications for carbon storage, water quality and aquatic nursery habitat for ecologically, commercially and recreationally important species in the region.
Despite recent improvements to hydrologic conditions, anthropogenic barriers continue to restrict landward migration and reduce tidal exchange and sediment supply for the Turtle Cove marsh. In 2009 CE, expansion of the City Island Road culvert and removal of a 1.5 m wide section of the railroad berm improved tidal mixing in TCI-S and reintroduced tidal flows in TCI-N, respectively (Long Island Sound Study, 2003). Subsequent efforts by NYC Parks in 2010 CE involved the removal of invasive vegetation and planting of over 50,000 Spartina alterniflora plugs in TCI-N, restoring the impounded wetland into native salt marsh (Supplementary Figure S1B). Already, significant lateral erosion has occurred downstream of the culvert at Turtle Cove Outer Remnant (TCO-R), as accelerating RSL rise (Figure 2) threatens the imminent collapse of this remnant marsh.

Figure 2. Sea level elevation time series for NOAA tide gauges nearest the study site between 1856–2024 CE. Data beginning in 1893 CE are shown for visual purposes. The Battery station is in New York Harbor at the southern tip of Manhattan, while Kings Point, Willets Point and New Rochelle stations are relatively closer to the study site in Long Island Sound. Points represent mean annual sea level in meters and are plotted relative to the most recent Mean Sea Level datum of the National Tidal Datum Epoch (NTDE) benchmark period from 1983–2001 CE, which is illustrated by the horizontal dashed line. Error bars are the monthly standard deviation for each year and are characterized by grey shading for the Battery. R-squared values from linear trendlines are provided for The Battery and Kings Point. From 1856–2024 CE, The Battery has a mean RSL rise rate of 3.0 mm yr-1 compared to 2.4 mm yr-1 at Willets Point from 1932–1999 CE, 3.5 mm yr-1 at New Rochelle from 1958–1975 CE and 6.7 mm yr-1 at Kings Point from 1999–2024 CE. RSL rise rates are derived by simple linear regression (Supplementary Data S1). Sources: National Oceanography Centre’s Permanent Service for Mean Sea Level (PSMSL) and NOAA Tides & Currents.
2.2 Transect probing and sediment coring
Three sediment cores were collected to investigate the paleoecological, biogeochemical and sea level indicators for Turtle Cove (Table 1). Two cores were extracted from the inner marsh on either side of the railroad berm at TCI-N and TCI-S and one core was collected from the outer remnant marsh at TCO-R. The sampling approach involved using a side-opening Dachnowski Russian corer, which prevents sediment compaction and thus maintains an accurate depth profile. Cores were obtained from the marsh surface downward until refusal to capture the entire peat stratigraphy, then immediately encased in a layer of polyethylene wrap and aluminum foil, transported and stored at 4 °C in the Lamont-Doherty Earth Observatory Core Repository. Each core was sampled at 4 cm intervals for laboratory analyses of X-ray fluorescence (XRF), loss-on-ignition (LOI), stable C isotopes (δ13C), accelerator mass spectrometry (AMS) radiocarbon dating, and foraminifera every 5 cm.

Table 1. Transect and core depths for all three sample locations, including marsh areas cited for our laboratory analyses.
Prior to core extraction, each marsh area was probed to ensure sampling from a maximum sediment depth (Table 1). Probing was conducted using hand-held 0.6 cm diameter fiberglass rods measuring 1.25 m in length. The rods were screwed together and inserted directly into the marsh peat until basal sand refusal to determine the peat depth at a given location. Depth profiles were measured for all three marsh areas along 20 m line transects (Supplementary Data S2). Average depth values for each marsh area were referenced in our carbon stock estimates.
2.3 GIS mapping and orthoimagery
To measure coastal development trends and inform relevant impacts on the Turtle Cove marsh, we used a combination of mapping and aerial photography. First, land cover areas were mapped using ArcGIS software to quantify the most recent distribution of developed and natural areas at the site. Data collected by the National Land Cover Database (NLCD) was downloaded from the Multi-Resolution Land Characteristics (MRLC) Viewer web application (MRLC Viewer, 2021) and resampled to 4 m spatial resolution. Imperviousness metrics corresponding to each land cover surface area were included (Supplementary Table S1). Descriptions and impervious surface percentages associated with each land cover type were referenced from the NLCD Classification Legend and Description (NLCD Legend). To understand long-term land cover trends at the site, data from the new Annual NLCD was synthesized into a spatiotemporal distribution for plotting annual changes in developed, wetland and other natural areas from 1985–2023 CE (Geological Survey, 2024). The sample area of focus was determined by considering the tidal inlet and most land cover immediately adjacent to the site, however the precise size was randomly selected.
We estimated the extent of marsh loss by combining ArcGIS software with high-resolution orthoimagery (Figure 3). Two aerial photographs of the site captured at low tide in 1974 and 2018 CE were sampled (Figures 3C,D). During this time period, the area of marsh that disappeared was determined by overlaying the images and computing the difference in marsh vegetation area (Figure 3E). The 1974 CE aerial photograph includes the earliest documented tidal wetland boundaries mapped for the New York State Department of Environmental Conservation (NYSDEC) tidal wetland mapping inventory, and therefore serves as our baseline image (New York State Department of Environmental Conservation, 2024). The most recent high-resolution image of the study site was captured in 2018 CE (New York State GIS Resources, 2022). Tidal wetland categories at the site primarily include intertidal marsh and high marsh zones in TCO-R. However, the formerly connected category was assigned for TCI-N and TCI-S due to hydrologic disturbances from anthropogenic tidal restriction (New York State Department of Environmental Conservation, 2025). Given this challenge, we used GIS data downloaded from the NYSDEC Regulatory Tidal Wetlands database to determine the spatial area for TCO-R, while areas for TCI-N and TCI-S were sourced from the U.S. Fish and Wildlife Service National Wetlands Inventory (NYS, 2022; Fish and Wildlife Service, 2004).

Figure 3. Top: Images captured at low tide during field investigations depict ongoing marsh loss of TCO-R. Eroding high marsh (Spartina patens) is clearly visible from the relatively preserved high marsh platform and characterized by a scarp or cliff-like edge retreating landward (A). Virtually all of the intertidal marsh (Spartina alterniflora) at TCO-R has disappeared or degraded. The exposed section of peat is the TCO-R core location and a preserved remnant of the high marsh platform in Turtle Cove Outer (B). Images are not to scale. Bottom: Aerial photography reveals the extent of intertidal marsh loss in TCO-R (C–E). From 1974–2018 CE, roughly two-thirds of the TCO-R marsh disappeared due to accelerating RSL rise and shoreline development. The 1974 and 2018 orthographic images were captured during low and ebb tide, respectively. Sources: NYS DEC Tidal Wetlands and NY Statewide Digital Orthoimagery Program (C–E).
2.4 Culvert assessment and tidal restriction
We conducted culvert assessments in the field to evaluate the extent of tidal restriction within the inner marsh. Methodology involved comparing tidal ranges or the change of water level during a tide cycle on the immediate upstream (north) and downstream (south) side of the City Island Road culvert. Tidal range was measured by calculating the height difference between the water surface at the time of sampling and water stains marked on the culvert during the previous high tide. Fieldwork was done at low tide using a 3 m telescoping leveling rod and following standard culvert assessment protocols by the North Atlantic Aquatic Connectivity Collaborative (NAACC; Jackson, 2019).
Tidal restriction metrics considered for this analysis are channel constriction and tidal constriction ratios. The channel constriction ratio is the culvert opening width divided by the mean active tidal channel width, while the tidal constriction ratio is the upstream tidal range divided by the downstream tidal range. Culvert inlet and outlet widths were measured in the field using a leveling rod and the mean channel width was derived using Google Earth Pro software. A numeric score on a continuous scale ranging from 0 (full constriction) to 1 (no constriction) is assigned to both variables and functions as a predictor metric of tidal restriction (Supplementary Data S1; NAACC, 2021). The following equations are used to generate scores for channel constriction (Equation 1) and tidal constriction (Equation 2) dependent on their respective ratios:
2.5 X-ray fluorescence spectroscopy
Each core was sampled for X-ray fluorescence (XRF) analysis at 4 cm intervals (Supplementary Data S4). Approximately 3 g of dried sediments were encased in 32 mm sample cups and capped with transparent Mylar film. Samples were scanned for chemical composition by a Bruker iTracer five handheld XRF analyzer at 120 s measurements following proper soil protocols (Croudace and Rothwell, 2010; Kenna et al., 2011). XRF data for the top meter of each core were recorded. Select samples were additionally measured by Inductively Coupled Mass Spectrometry (ICP-MS) by Actlabs (Ancaster, Canada). These measurements were used to calibrate XRF measurements. Results were used to calculate the total amount of heavy metals (δPb) released into Long Island Sound by the recent marsh loss (Equation 3). Pb flux is the product of chemical concentration (XRF), dry weight (W) of each cubic centimeter sample (see LOI methods), sample depth (D) and marsh area (A) of the outer remnant marsh. Uncertainty for Pb concentrations is the confidence interval of two standard deviations (2 sigma) from ICP-MS analysis and used in the Pb flux error estimates.
2.6 Loss on ignition and carbon stocks
Sediment material was measured at 4 cm intervals for all three cores using standard loss on ignition (LOI) laboratory procedures (Dean, 1974). Samples of 1 cm3 were placed in crucibles for drying overnight at 100 °C to estimate moisture content, then heated for 2 hours at 550 °C to burn off the organic content. For each sample, a wet and dry weight were recorded before and after burning, respectively. The crucible weight was excluded from each measurement. LOI was determined for each sample, providing the relative percentages of organic and inorganic material density (g cm-3) down-core (Supplementary Data S5). We estimated the percentage of organic carbon (C) for each sample using a linear regression equation (Equation 4) based on the relationship between soil organic C and organic matter (Craft et al., 1991). A conversion factor (CF) of 0.50 was referenced for converting organic matter to organic C typical of North American salt marsh soils. Bulk density (BD) was measured as the total organic and inorganic sediment content for each subsample. Coarse fragments were not removed prior to measuring BD.
With our LOI data, we performed full-depth carbon content (CC) and stock (CS) estimates (Equations 5, 6) for all sediment cores to quantify the total amount of C sequestered in the Turtle Cove salt marsh (Holmquist et al., 2018; Pace, 2021). CC was expressed in terms of density (g cm-3). The full CF range was included to account for uncertainty represented by error bars in our CS data. Mean transect depth (D) was used for each marsh area recorded during field probing. Area (A) was appropriately selected for TCI-N and TCI-S from the National Wetlands Inventory and for TCO-R using the NYSDEC Regulatory Tidal Wetlands database. The total amount of C released from the Turtle Cove marsh due to the recent loss is included in our results. We assume that C loss occurs through both aquatic (lateral) and greenhouse gas (vertical) fluxes (Sapkota and White, 2019).
2.7 Stable carbon isotope (δ13C)
Samples of 1 cm3 were dried in crucibles overnight at 100 °C, then ground using a mortar and pestle. Dried and ground samples were prepared in 5 × 9 mm tin capsules for % C and δ13C analyses using standard mass spectrometry procedures. Samples collected at 4 cm intervals from TCI-S core were flash combusted using a Thermo Delta V+ Mass Spectrometer at the Lamont-Doherty Earth Observatory (LDEO) Stable 1sotope Lab. The carbon isotope ratio (δ13C) of the sample is expressed as a part per thousand (per mil) difference from the standard reference material of USGS24 graphite (Geological Survey, 2022). δ13C concentrations are analyzed and tabulated in a LDEO Stable Isotope Lab report (Supplementary Data S6).
2.8 Foraminifera and macrofossils
Wet samples of 5 cm3 were carefully screened with water and a standard sieve. At 5 cm intervals of TCI-S core, samples were separated into fine (150 µm) and coarse (500 µm) fractions bearing foraminifera and macrofossils, respectively. Material remains were suspended in water inside a Petri dish and examined under a binocular microscope at 20-60x magnification following the LDEO foraminifera laboratory standard operating procedures. Samples were randomly selected, identified and transported to glass vials for refrigeration. A minimum of 100 foraminifera specimens were picked using an ultra-fine bristled paintbrush and identified at each depth (Supplementary Data S7). This sample size (n = 100) is a statistically robust representation for typical assemblages of salt marsh foraminifera (Fatela and Taborda, 2002). Samples were temporarily stored in zip-lock bags and refrigerated when not in use to preserve the foraminifera and plant macrofossils. Terrestrial macrofossils were identified using the extensive Peteet macrofossil collection housed at LDEO and various reference books (Martin and Barkley, 1961; Montgomery, 1977). Identified macrofossils, including plant seeds, were selected and utilized for 14C radiocarbon dating.
2.9 AMS radiocarbon dates
Identified macrofossils were selected for relatively reliable accelerator mass spectrometry (AMS) radiocarbon dating and sent to the Yale Analytical and Stable 1sotope Center (Strunk et al., 2020). Radiocarbon measurements were collected using the Mini Carbon Dating System (Shelton, 2022). Ages and their respective uncertainty were calibrated against the atmospheric IntCal20 14C curve from the IntCal R package (Blaauw, 2022; Heaton et al., 2020; Supplementary Figure S3). The calibration of radiocarbon age (cal yBP) to calendar years (cal CE) is presented.
3 Results
3.1 Marsh age
Radiocarbon results suggested an overall TCI-S marsh age dating back to 1,498 ± 188 yBP, with an age of 585 ± 193 yBP at 80 cm depth and 933 ± 241 yBP at 98 cm (Table 2). These dates were similar to the ages of many tidal marshes in the NYC area, such as Piermont and Jamaica Bay, where 1 m depth represented ∼400 years (Pederson et al., 2005; Peteet et al., 2018), and nearby in Pelham, where 1 m signified 700–800 yBP and 1.5 m was about 1,500 yBP (Kemp et al., 2017). Our results included a relatively high uncertainty (>± 200 years), which demonstrated the challenge of radiocarbon dating tidal marshes as older material may settle during high tide.
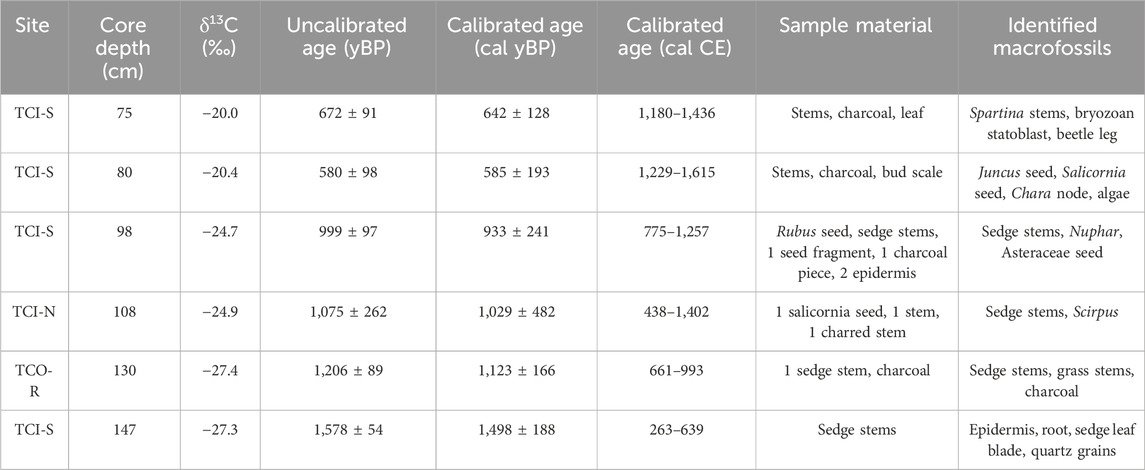
Table 2. 14C Radiocarbon ages of terrestrial macrofossils sampled from each Turtle Cove sediment core. Accelerated mass spectrometry data was provided courtesy of the Yale Mini Carbon Dating System. The δ13C results from our mass spectrometry test at LDEO are included.
3.2 Foraminifera, macrofossils and stable carbon isotope
Our foraminifera assemblage plotted a distribution of the five most abundant species in TCI-S (Figure 4). The results allowed us to delineate a boundary between high and low marsh zones at ∼40 cm depth. In the top 40 cm, we observed greater species diversity with relative abundances close to 20% for Trochammina inflata, Miliammina petila, Tiphotrocha comprimata and Siphotrochammina lobata. These species are typically abundant in low-to-mid marsh faunal zones below mean higher high water (MHHW) throughout the northeastern United States (Scott and Medioli, 1978; Scott and Medioli, 1980; Bertness, 1991; Gehrels, 1994; Edwards et al., 2004; Wright et al., 2011; Kemp et al., 2017). Below 40 cm, a greater presence (∼85%) of Jadammina macrescens suggested a high marsh habitat. This pattern continued to ∼90 cm, where we observed a monospecific assemblage (100%) of Jadammina representative of the transition zone between the upper salt and brackish marsh. Below 120 cm, an absence of foraminifera (n < 50) signified a depth above the upper high marsh border and beyond into the upland interface.

Figure 4. Sea level proxies are cross-referenced to help reconstruct early marsh formation and changes in marsh plant communities over the last millennia. Foraminiferal assemblages in TCI-S demonstrate greater faunal diversity of low marsh indicator species in the top ∼40 cm, accompanied with increasing δ 13C and declining LOI values representative of intertidal salt marsh below MHW. From ∼90 to 120 cm, a lack of diversity with Jadammina dominance associated with high marsh, low salinity species is paired with low δ 13C and high LOI, indicating a brackish zone with an abundant sedge community. Below 120 cm, we record an absence of foraminifera, suggesting a time of early marsh formation. Source (vegetation graphics): University of Maryland Center for Environmental Science.
Foraminifera results aligned well with our C isotope composition and macrofossil data, offering clues about RSL rise, tide levels and changes in Turtle Cove marsh plant communities over time (Figure 4). For salt marshes in the northeastern United States, bulk sediment δ13C values typically range from −18.9‰ to −15.8‰ for C4 and -27.0‰ to −22.0‰ for C3 floral zones (Kemp et al., 2011). In the top ∼40 cm of TCI-S, overall δ13C values trending above −18.9‰ signified low-to-mid marsh C4 species inhabiting the zone between mean tide level and MHHW, corresponding with Industrial Age rates of RSL rise. Plant macrofossils identified in this section mostly featured stem fragments of Spartina (Table 2). At this same depth in TCI-N, stem and seed fragments from freshwater marsh plant species, including Typha, were likely observed due to the rail impoundment. From ∼40 to 90 cm in TCI-S, pre-colonial fluctuations between −18.9‰ and −22.0‰ in conjunction with moderate foraminifera diversity suggested a mid-to-high marsh with a mix of C3 and C4 plants. Terrestrial macrofossils picked in this zone included three stems of Spartina, a leaf, insect wings and charcoal. From ∼90 to 120 cm in TCI-S, δ13C values below −22.0‰ and less foraminifera diversity with a greater presence of Jadammina indicated brackish conditions during early marsh formation with less tidal saturation. We identified an abundant combination of sedges from stems, epidermis and other remains, including two Juncus seeds, two freshwater Chara or Nitella branchlet nodes, one Rubus seed, one Asteraceae seed, algae strands and more charcoal pieces. Below 120 cm in TCI-S, we recorded a sedge leaf blade, epidermis, one root, several quartz grains and more charcoal. Macrofossils at this depth, along with lower δ13C measurements and an absence of foraminifera, were clear indicators of freshwater upland habitat from relatively low sea levels dating back to the previous millennium.
3.3 Coastal development and marsh loss
Land cover areas were mapped to illustrate a relative spatial distribution of natural and developed areas during more recent decades (Supplementary Figure S2A). In 2023 CE, dominant land cover areas at the site were broadly classified as developed (26.6 Ha, 35.4%), forest (22.7 Ha, 30.2%) and wetland (20.1 Ha, 26.5%), respectively (Supplementary Table S1). Open space developed areas included a mixture of some constructed materials, lawns, baseball fields and golf courses, which likely contributed to a notable reduction of pasture and grassland areas. Low and medium intensity developed areas were comprised of constructed fill materials for parking lots, built structures and roads fragmenting the marsh, including the City Island Road culvert between TCI-S and TCO-R. The railroad berm dividing TCI-N and TCI-S contains built materials. However, the berm was not displayed due to the restoration work in 2010 CE, when the berm was converted into a public trail and partially removed to reintroduce tidal flows into TCI-N. Open water corresponded to the tidal flat and tidal pond areas in TCI-S and TCI-N, respectively, the latter of which converted to open water following the berm breach during the 2010 CE tidal pond restoration.
Mapping results identified a multidecadal trend of increasing coastal development at the site in concurrence with declining natural land areas, particularly tidal wetlands (Supplementary Figure S2B; Supplementary Table S1). From 1985–2023 CE, an inverse correlation was measured between developed (positive) and wetland (negative) areas during the observed time period. Most notably, developed areas showed the highest relative increase (2.1 Ha, 3.4%) within the sampled area (Supplementary Table S1). Results revealed increasing rates of open space (+403 m2 yr-1) and low intensity (+166 m2 yr-1) developed areas in conjunction with a decline of emergent herbaceous wetlands (−308 m2 yr-1; Supplementary Figure S2B). The increase in developed areas included a conservative estimate of developed land cover, as most of the medium and high intensity development adjacent to the site was excluded from the analysis, such as the Orchard Beach parking lot and NYPD firing range facility. Overall, developed areas increased (+0.09% yr-1), while wetland areas (−0.03% yr-1) and the remaining non-developed areas like forest, grassland and pasture decreased (−0.06% yr-1) during the 38-year time period (Supplementary Figure S2C). The spatiotemporal breakdown of land cover changes were summarized (Supplementary Figure S2D).
Culvert assessment data was recorded in-situ to derive numeric scores from constriction ratios and evaluate the extent of tidal restriction (Figure 5). For reference, the mean tide range is 2.18 m compared to a 2.29 m verified tide range for the tide cycle at the time of sampling, with a low tide elevation of 0.14 m (11/4/2022, 15:06) and high tide elevation of 2.43 m (11/4/2022, 8:24) earlier that morning (Figure 5A; NOAA Tides and Currents). Tide data was referenced from the month of November 2022 CE at the nearest active tide gauge in Kings Point, NY, and relative to mean lower low water (MLLW) from the 1983–2001 CE benchmark period (Supplementary Data S3). Field measurements estimated a tide range difference of 0.2 m between the upstream (TCI-S, 1.7 m) and downstream (TCO-R, 1.9 m) side of the City Island Road culvert (Figure 5C). Results revealed a 10.5% reduction in tidal prism for TCI-S relative to TCO-R at the time of sampling. Tide range results generated a tidal constriction ratio of 0.89 and score of 0.95 (<1.0), indicating a tidal restriction severity ranging from minor to moderate depending on tide conditions (Figure 5B) (Table 3). The findings also demonstrated that the widened culvert actively constricts the tide channel from a mean width of 120 m to the inlet-outlet width of 2.4 m or by ∼98% (Figure 5E). Tide channel constriction by the culvert resulted in a severe channel constriction ratio of 0.02 and score of 0.05 (<0.2), likely contributing to the significant tidal restriction (Figure 5D) (Table 3).
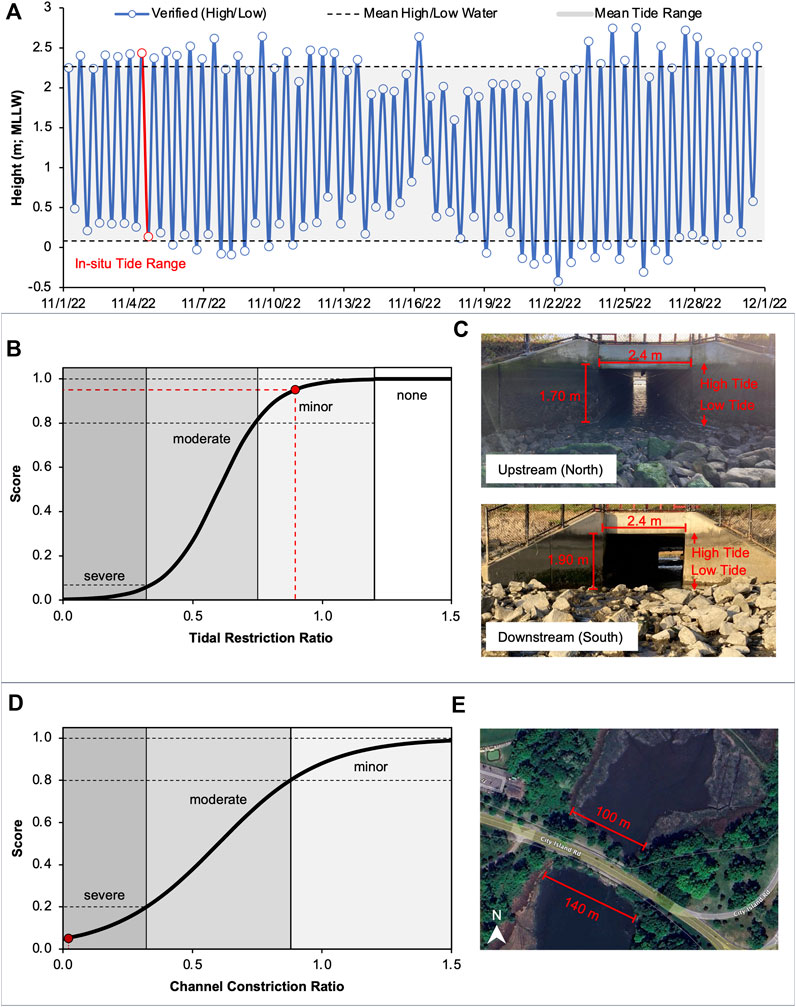
Figure 5. Analysis of tidal regime conditions in response to the culvert, which functions as the single point of tidal exchange between Turtle Cove Inner and Outer. Top: Tide data collected at the Kings Point tide gauge during November 2022 CE and relative to MLLW from 1983-2001 CE (A). The mean tide range for the month is shaded in gray and the verified tide range at the time of sampling is marked red. Center: Tidal ranges for TCI-S and TCO-R measured during low tide at the culvert upstream inlet and downstream outlet, respectively, are synthesized into a tidal restriction ratio and score (B,C). Bottom: Culvert opening widths recorded in the field and mean tide channel width using aerial imagery are referenced to quantify the extent of channel constriction (D,E). Sources: NOAA Tides & Currents (A). NAACC Scoring Systems for Tidal Crossings (B–E).

Table 3. Predictor variable metrics or ratios tabulated for channel constriction and tidal restriction, which function as indirect and direct indicators of tidal restriction, respectively. Our estimates demonstrate that despite recent efforts to expand the culvert, the tidal prism of TCI-S is significantly lower relative to TCO-R immediately downstream.
Orthoimagery and GIS mapping studies demonstrated roughly 3.35 ha of the 5.10 ha TCO-R marsh disappeared from 1974–2018 CE (Figure 3). Most marsh loss occurred at the south side of the City Island Road culvert and the seaward edge at TCO-R, where an exposed remnant of high marsh peat is vulnerable to accelerating RSL rise (Figures 3A,B). This area of loss comprised 65.7% of the 1974 TCO-R marsh, with an annual marsh loss rate of 800 m2 yr-1 or 1.5% yr-1 (Figures 3C–E). Based on tidal wetland boundaries, aerial photographs illustrated an overwhelming majority of the loss was intertidal marsh, while the high marsh platform remains relatively intact. This loss was represented by a solid hatch pattern and accounted for marsh eroded by encroaching water (Figure 3E). In addition to wave or fetch-driven marsh erosion, loss of terrestrial marsh due to the encroachment of invasive Phragmites australis was represented by the dashed hatch pattern. This area encompassed about 0.58 ha and functioned as another indicator of hydrologic disturbance and tidal restriction from shoreline development.
3.4 Peat chemical composition and Pb flux
XRF results identified a clear signal of regional and local human activity in recent centuries (Figure 6). Overall, significant increases of heavy metal concentration in the top half-meter core depths provided reliable age-depth tie points associated with the Industrial Age. These patterns were consistent with the sediment record from other nearby marshes and corresponded to the significant influence of anthropogenic impacts on peat chemical composition (Copple et al., 2023; Peteet et al., 2020). For instance, a steady rise of lead (Pb) observed at 48 ± 2 cm in all three cores was synonymous with atmospheric deposition from burning coal and leaded gasoline beginning around 1840 CE ± 1 year (Figure 6A; Lima, 2005). The rapid Pb decline at 14 ± 2 cm, most notably at TCI-N, was largely attributed to the phase-out of leaded gasoline motor vehicles by 1975 CE ± 1 year following the passing of the Clean Air Act (U.S. EPA, 1986). High concentrations of dissolved trace metals like nickel (Ni) and zinc (Zn) were common in municipal and industrial treatment plant effluent throughout the Hudson River Estuary prior to the Clean Water Act of 1972 CE (Figures 6B,C; Sañudo-Wilhelmy and Gill, 1999). Reductions of Ni and Zn recorded in TCI-N at 16 ± 2 cm reflected initial improvements in regulating discharge from the enactment of this federal legislation, although these pollutants persisted due to more recent increases in population and combined sewer overflows (Rouff et al., 2013; Beck et al., 2009).

Figure 6. Heavy metal concentrations plotted for each marsh core and measured by X-ray Fluorescence (XRF) at 4 cm intervals. Significant rises in Pb (A) from industrial atmospheric emissions and Ni (B) and Zn (C) from wastewater treatment plant discharge are recorded in the top half meter, followed by overall declines beginning at 16 cm due to US environmental policy. Relative increases of each metal in TCI-N at ∼24 cm are likely attributed to tidal impoundment from the 1910 CE City Island railroad, which prevented tidal flushing in TCI-N until 2010 CE. Three AMS 14C radiocarbon dates for TCI-S marsh are included between 75–100 cm depth.
In addition to impacts resulting from industrial emissions, we measured changes in peat chemical composition attributed to hydrologic modifications of the tidal inlet. For example, we observed noticeably high Pb, Ni and Zn concentrations in TCI-N (3–5X greater) relative to TCI-S and TCO-R toward the surface beginning at 24 ± 2 cm, most likely from tidal impoundment by the City Island Railroad. We also identified declining heavy metal concentrations in TCI-S at 32 ± 4 cm possibly due to tidal exchange following the initial culvert installment at City Island Road. Lastly, we calculated a considerable load of heavy metals that discharged into Eastchester Bay from the ongoing loss of TCO-R (Table 4). Between 1974 and 2018, the total amount of Pb released from the eroding outer marsh was estimated to be nearly 750 million kg, with annual Pb flux rates of over 17.0 billion g yr-1. Total Pb flux uncertainty during this time period was over 12 million kg.
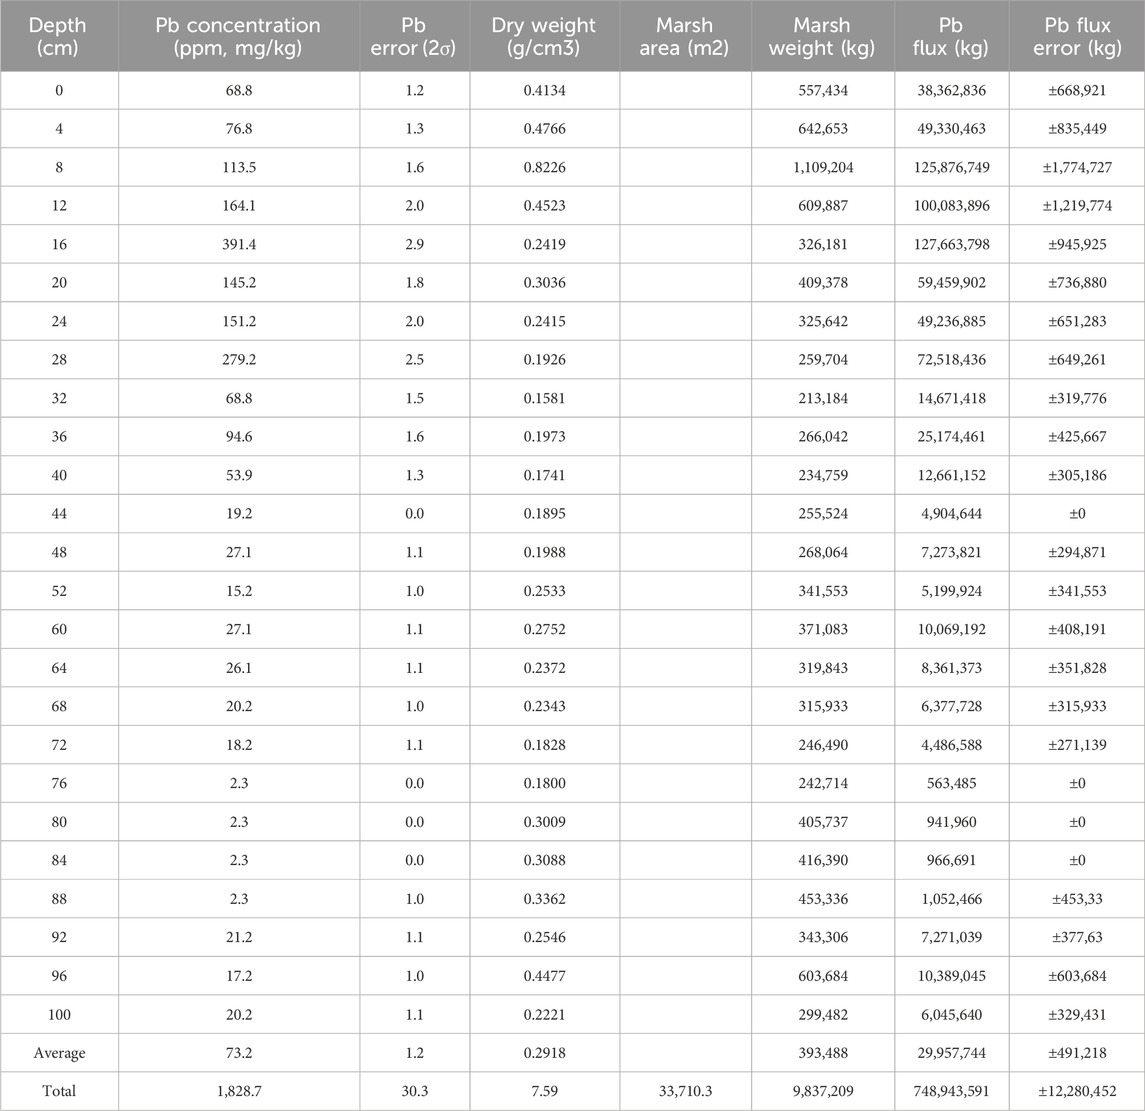
Table 4. XRF (Pb concentration) and LOI (dry weight) data for TCO-R are used to estimate the amount of lead released (Pb Flux) into Long Island Sound as a result of the ongoing marsh loss.
3.5 Bulk density and carbon sequestration
LOI results revealed a significant organic matter decline in TCO-R compared with TCI-N and TCI-S due to soil depletion from the marsh loss (Figures 7C–E). For example, overall higher % C values were found in the organic-rich layers of TCI-N and TCI-S (∼25%) compared to TCO-R (∼15%), which was partly due to oxidation from exposed peat as a result of erosion and a lower marsh elevation at TCO-R. This finding was cross-validated by our CC results, proving that the top 20 cm of TCO-R had a C density falling below the mean reference for the top 1 m of US tidal marshes (Figure 7A). We observed C density declines in TCI-S at 28–32 cm, which we attributed to relatively ephemeral tidal impoundment by City Island Road in ∼1880 CE prior to the initial culvert installment. Both relative bulk density of organic and inorganic sediment and % C were plotted with respect to core depth. As expected, each core illustrated a deep organic-rich peat layer (max 30%–40% C) relative to a thin basal layer of sand, silt and clay with high inorganic content (min 0%–10% C). We observed a steady increase in peat depth across the gradient of anthropogenic disturbance, partly due to a decline in marsh elevation from the inner to outer marsh areas. For instance, the organic-inorganic interface occurred at 108 cm in TCI-N (Figure 7C), 124 cm in TCI-S (Figure 7D) and 140 cm in TCO-R (Figure 7E). In addition to the relatively low organic matter in TCO-R, a high inorganic density existed near the surface (top 12 cm) as a result of the marsh erosion. Mean LOI, % C and relative bulk density values were provided for both the top meter and full depth of each sediment core (Table 5).

Figure 7. Top: C content (A) and C sequestration (B) results for each core sample area. C density distribution is plotted in relation to the mean reference of 0.027 g cm-3 for 1 m U.S. tidal marshes, which is represented by the horizontal dashed line (Holmquist et al., 2018). CC is measured by sampling core depths, while mean transect depths are used to calculate the total C stored (sink) and released (source) throughout the Turtle Cove salt marsh. Error bars represent the confidence interval from linear regression (Equation 4). Bottom: LOI results for sediment cores at TCI-N (C), TCI-S (D) and TCO-R (E). The figure plots relative bulk density of organic and inorganic sediment on the top primary x-axis (bars) and % C on the bottom secondary x-axis (curve), with core depth on the y-axis. For each core, the organic-rich peat layer increases in depth along a seaward gradient (left to right). The bottom 40 cm of TCO-R is predominately inorganic content and cropped for visual purposes.

Table 5. Top: Mean LOI estimates for the top meter and full depth at each core location. Results demonstrate a relatively high inorganic material density and low carbon percentage at TCO-R due to ongoing marsh loss. Bottom: C content data shows the relative density and total amount of blue carbon sequestered at the site and released from marsh loss since 1974 CE.
In the context of % C values, each sample area showed steady declines toward the surface beginning at ∼36 cm as a result of increased inorganic material from accelerating RSL rise, with the exception of TCI-N. Here, we measured an expected % C reduction at 36 cm followed by steady increases closer to the surface at 28 cm and concurrent declines in inorganic deposition from tidal impoundment by the 1910 CE railroad. This pattern continued until 12 cm, when % C decreases and inorganic content increased again as tidal flows were reintroduced following the railroad berm removal. We observed increasing organic content slightly closer to the present, likely from Spartina plantings during the restoration in 2010 CE. Overall, % C was disproportionately low in TCO-R and unexpectedly low in TCI-N despite being freshened for a century, which indicated peat degradation from marsh erosion and hydrologic disturbance from tidal impoundment, respectively. The climate impacts associated with these anthropogenic perturbations were calculated in our C stock results.
Our LOI data was used to estimate C content (CC) and C stocks (CS) for each marsh area (Figures 7A,B). CC or C density was plotted in relation to a reference value of 0.027 g cm-3, which is the mean CC for the top 1 m of tidal marshes in the United States (Holmquist et al., 2018). In the top meter of each core, we measured CC values above the reference, with the exception of TCO-R from 0–18 ± 2 cm and TCI-S at 30 ± 4 cm. CS estimates revealed the total C sequestered in Turtle Cove is 3,250 ± 325 tC (C tonnes), including a mean C density of 542 ± 54 tC ha-1 compared to 340 ± 94 tC ha-1 for the top 120 cm of U.S. tidal saline wetlands (Nahlik and Fennessy, 2016). From 1974–2018 CE, the total amount of C released from TCO-R into the water and atmosphere due to marsh erosion was 1,625 ± 163 tC and 485 tC ha-1, or the equivalent of 5,959 CO2e and 1,779 CO2e ha-1 (U.S. EPA, 2024). This was a conservative estimate, since it excluded both the area of marsh loss resulting from coastal development and Phragmites encroachment and the percentage of C assumed to be displaced by lateral transport or buried to the estuary bottom after erosion (∼25%, the remaining 75% of eroded C was expected to mineralize into the atmosphere as a greenhouse gas source; Sapkota and White, 2019). We estimated the relative amount of C stored as a sink and released from marsh loss using the mean transect depth for each core (Table 5).
4 Discussion
4.1 Sea level and anthropogenic reconstruction
Our sea level proxy analyses aligned well with cross-referenced macrofossil data, allowing us to extrapolate temporal shifts of marsh plant communities in response to RSL rise and anthropogenic perturbation from coastal development. For the top 90 cm of TCI-S, the sediment record illustrates that a salt marsh existed continuously through the past several centuries, while simultaneously at TCI-N, an abundance of relatively salt-intolerant plant species indicated a response to marsh freshening from the railroad impoundment. Previous literature from a nearby Pelham marsh described a down-core abundance of P. australis below 127 cm (Kemp et al., 2017). Although our foraminifera and δ13C data also depicted a freshwater marsh for this age-depth marker, our radiocarbon data pointed to a pre-colonial era (>1,100 yBP) well before the arrival of non-native Phragmites in North America (Table 2). Moreover, our macrofossil results provided evidence of sedges and did not identify any Phragmites plant fragments at this depth. Therefore, we propose that the core bottom representing early formation of the Pelham marsh was characterized by an abundance of native sedges.
4.2 Compounded impacts to marsh loss
The impacts of expanded development on the hydrologic regime were illustrated by our culvert assessments, which revealed that severe channel constriction by the culvert significantly reduces the tidal prism or overall volume of water entering Turtle Cove during a tide cycle. This finding demonstrates that tidal restriction exacerbates the ongoing loss of the remnant marsh. For instance, TCO-R had a tidal range 0.2 m higher than TCI-S partly due to ponding at high tide caused by the City Island Road culvert, in addition to possible variability in upstream and downstream invert elevation (Figure 5; Table 3). Although this height may appear insignificant, the difference of tidal range was comparable to the 0.25 m of RSL rise at the Kings Point tide station since 1931 CE (NOAA Sea Level Trends). Moreover, given that the in-situ tidal range was similar to the mean monthly tidal range, depending on the tide conditions we assumed the severity of tidal restriction fluctuates from minor to moderate, especially the latter during spring tides. Additional non-reported impacts of tidal restriction likely include lagging ebb flows, a reduction in sediment deposition and encroachment of invasive vegetation observed at the inner marsh reaches. The combined field, mapping and aerial imagery analyses demonstrated active tidal restriction at Turtle Cove, despite recent efforts to improve flow conditions with the berm breach and culvert expansion. These effects of coastal development on the hydrologic regime are compounded by accelerating RSL rise and exacerbate the ongoing TCO-R marsh loss.
4.3 Carbon storage and water quality implications
Our C stock data illustrated that human-induced marsh loss placed the remaining Turtle Cove marsh and other regional marshes at risk of no longer functioning as a C sink. We estimated about two-thirds of the organic C sequestered in TCO-R was released into the water and atmosphere between 1974 CE and 2018 CE (Table 5). Under the current RSL rise conditions, we expect that the continued disappearance of the TCO-R marsh would release an additional 864 ± 86 tC or 3,169 CO2e in the coming decades (Figure 6B). The consequences are significant when considering carbon budgets on a regional scale, as Pelham marshes are estimated to store about 36 million tC. Furthermore, mean C density results for Turtle Cove (54.2 kg C m-3) also suggested the marsh is very effective in terms of carbon burial compared with the average salt marsh carbon content of 27 kg C m-3 (Holmquist et al., 2018). Our findings highlight the importance of improving tidal conditions for salt marshes in Pelham Bay and Western Long Island Sound. Failure to restore the hydrodynamic period for the 2,800 ha of tidal wetlands throughout the urbanized Hudson River Estuary will continue to have significant climate implications, especially considering the amount of time required for salt marshes to sequester organic carbon.
Tidal restriction also exacerbated water quality impacts associated with marsh loss, as these effects were evident in the sediment record. According to the age-depth markers, heavy metal concentrations indicated the City Island Railroad limited tidal flows entering the inner marsh reaches enough to significantly alter peat chemical composition with Pb, Ni and Zn enrichment. This consistent pattern was apparent in the top quarter-meter of TCI-N, illustrating that the City Island Railroad prevented tidal mixing from 1910–2010 CE until the partial berm removal and caused the accumulation of heavy metals in the impounded marsh for a century. Our findings demonstrated that an alarming amount of toxic lead was released into Eastchester Bay and Long Island Sound directly from the erosion of TCO-R marsh. The total amount of Pb (∼750,000 tonnes) measured in our XRF flux analysis was a conservative estimate, as this excluded the area of marsh eroded pre-1974 CE and post-2018 CE (Table 4). Given the persistent bioavailability and ecotoxicity of heavy metals in salt marsh soils, the consequences of marsh loss involve adverse social and ecological impacts related to contamination (Ali et al., 2019; Jezycki et al., 2024). When considering the context of marsh loss on a regional or global scale, a heavy metal fate and transport analysis is critical in order to identify and effectively mitigate the risks associated with aquatic wildlife and public health.
4.4 Adaptive management recommendations
This study revealed that the compounded stressors of climate change and urbanization explained the rapid and ongoing disappearance of the Turtle Cove salt marsh. More broadly, our findings emphasize the challenges salt marsh ecosystems face in the midst of intensifying RSL rise and coastal development, which limit their adaptive capacity and consequently undermine coastal resilience. We hope to reverse this current trend by prioritizing nature-based solutions over conventional grey infrastructure practices and incorporating a scientific framework for monitoring marsh erosion, sediment accretion, and vegetation percent cover and survival rates at the study site. Restoration practices should adhere to the Salt Marsh Restoration Design and Monitoring Guidelines and the Wetlands Management Framework by NYC Parks and Natural Areas Conservancy (NYC Parks, 2018; Swadek et al., 2021).
In particular, we recommend any feasible removal of fill material, impervious surfaces and hardened structures along the shoreline. For example, replacing the culvert with a clear-spanning bridge and extending the berm breach with an elevated boardwalk to minimize hydrodynamic restrictions that increase scouring, ponding and lagging ebb flows near the drowning marsh. This effort should be accompanied with grading techniques like thin-layer placement of beneficially reused and locally dredged material to raise the marsh elevation and reconnect the eroded low marsh to the high marsh platform. Moreover, we advise natural substrate to be placed along the marsh edge and biotechnical stabilization methods like biodegradable coir rolls or fiber blankets interplanted with native Spartina plugs in order to control shoreline erosion and support marsh plant recolonization. Additional recommendations include bioengineered breakwater structures like log groins and oyster balls at the marsh toe to attenuate wave action and facilitate suspended sediment deposition. Lastly, routine hand removal of invasive vegetation, trash and debris should be incorporated without the application of ecotoxic herbicide, wherever feasible. Implementing these adaptive management measures is critical for the resilience of salt marshes, as they struggle to keep pace with the accelerating impacts of human activity, and ultimately survive.
Data availability statement
The original contributions presented in the study are included in the article/Supplementary Material, further inquiries can be directed to the corresponding authors.
Author contributions
NG: Conceptualization, Data curation, Formal Analysis, Investigation, Methodology, Software, Visualization, Writing – original draft, Writing – review and editing, Supervision. CC: Data curation, Methodology, Resources, Software, Supervision, Validation, Writing – review and editing. SK: Data curation, Investigation, Methodology, Project administration, Validation, Writing – review and editing. MA: Data curation, Investigation, Methodology, Project administration, Writing – review and editing. AP-Y: Data curation, Investigation, Methodology, Project administration, Writing – review and editing. DV: Data curation, Funding acquisition, Resources, Writing – review and editing. DP: Funding acquisition, Methodology, Project administration, Resources, Supervision, Validation, Writing – review and editing.
Funding
The authors declare that financial support was received for the research and/or publication of this article. This research was funded by the NASA Ocean Biology and Biogeochemistry (OBB) Grant # 80NSSC21K1365 and NASA Carbon Monitoring System (CMS) Grant # 22-CMS22-0033. Radiocarbon dating samples were funded by the Yale Center for Natural Carbon Capture.
Acknowledgements
We thank the NASA Climate Change Research Initiative (CCRI) program for administrative research support. Johan Varekamp (Weslayan University) for presenting literature related to sea-level rise and heavy metal pollution in Long Island Sound marshes. Scott Jackson (UMASS Amherst) provided field training and guidance for evaluating tidal restriction by culverts at road-channel crossings. Sediment accretion data and information related to regional Pelham marshes were shared by Troy Hill (U. S. EPA) and Ellen Hartig (NYC Parks). Sediment cores at the study site were sampled with the assistance of Jacky Austermann and Columbia University students. Wei Huang and Brad Linsley supported mass spectrometry sampling at the LDEO Stable Isotope Lab. Radiocarbon dating measurements were provided by the Blue Carbon Timescale Network at Yale University.
Conflict of interest
The authors declare that the research was conducted in the absence of any commercial or financial relationships that could be construed as a potential conflict of interest.
Generative AI statement
The authors declare that no Generative AI was used in the creation of this manuscript.
Any alternative text (alt text) provided alongside figures in this article has been generated by Frontiers with the support of artificial intelligence and reasonable efforts have been made to ensure accuracy, including review by the authors wherever possible. If you identify any issues, please contact us.
Publisher’s note
All claims expressed in this article are solely those of the authors and do not necessarily represent those of their affiliated organizations, or those of the publisher, the editors and the reviewers. Any product that may be evaluated in this article, or claim that may be made by its manufacturer, is not guaranteed or endorsed by the publisher.
Supplementary material
The Supplementary Material for this article can be found online at: https://www.frontiersin.org/articles/10.3389/fenvs.2025.1688420/full#supplementary-material
References
Ali, H., Khan, E., and Ilahi, I. (2019). Environmental chemistry and ecotoxicology of hazardous heavy metals: environmental persistence, toxicity, and bioaccumulation. J. Chem. 2019, 1–14. doi:10.1155/2019/6730305
Anisfeld, S. C., and Benoit, G. (1997). Impacts of flow restrictions on salt marshes: an instance of acidification. Environ. Sci. and Technol. 31 (6), 1650–1657. doi:10.1021/es960490o
Anisfeld, S. C., Kemp, A. C., and O'Connell, J. (2019). Salt marsh migration into lawns revealed by a novel sediment-based approach. Estuaries Coasts 42, 1419–1429. doi:10.1007/s12237-019-00590-6
Barbier, E. B., Hacker, S. D., Kennedy, C., Koch, E. W., Stier, A. C., and Silliman, B. R. (2011). The value of estuarine and coastal Ecosystem Services. Ecol. Monogr. 81 (2), 169–193. doi:10.1890/10-1510.1
Basso, G., O’Brien, K., Hegeman, M. A., and O’Neill, V. (2015). “Status and trends of wetlands in the Long Island Sound area: 130 year assessment,” in Fish and wildlife service (Washington, DC: USFWS), 36. Available online at: https://www.fws.gov/media/status-and-trends-wetlands-long-island-sound-area-130-year-assessment.
Beck, A. J., Cochran, J. K., and Sañudo-Wilhelmy, S. A. (2009). Temporal trends of dissolved trace metals in Jamaica Bay, NY: importance of wastewater input and submarine groundwater discharge in an urban estuary. Estuaries Coasts 32 (3), 535–550. doi:10.1007/s12237-009-9140-5
Bertness, M. D. (1991). Zonation of Spartina Patens and Spartina Alterniflora in new England salt Marsh. Ecol. Soc. Am. 72, 138–148. doi:10.2307/1938909
Bertness, M. D., Ewanchuk, P. J., and Silliman, B. R. (2002). Anthropogenic modification of New England salt marsh landscapes. Proc. Natl. Acad. Sci. U. S. A. 99 (3), 1395–1398. doi:10.1073/pnas.022447299
Blaauw, M. (2022). IntCal: radiocarbon calibration curves. CRAN: The Comprehensive R Archive Network. Available online at: https://cran.r-project.org/web/packages/IntCal/index.html
Blaskowitz, C. (1776). A survey of frog's neck and the route of the British army to the 24th of October, under the command of his excellency the honorable William Howe, general and commander in chief of his majesty's forces. Available online at: https://www.loc.gov/item/gm71000648/.
Browne, J. C. (2017). Long-Term erosional trends along channelized Salt marsh edges. Estuaries Coasts 40 (6), 1566–1575. doi:10.1007/s12237-017-0245-y
Chmura, G., Anisfeld, S. C., Cahoon, D. R., and Lynch, J. C. (2003). Global carbon sequestration in tidal, saline wetland soils. Glob. Biogeochem. Cycles 17. doi:10.1029/2002GB001917
Copple, S. P., Peteet, D. M., Balk, D., Chang, C., Jones, B. A., and Tzortziou, M. (2023). Marsh archive reveals human population history and future implications for estuarine health in Long Island Sound. Sci. Total Environ. 895, 164885. doi:10.1016/j.scitotenv.2023.164885
Craft, C. B., Seneca, E. D., and Broome, S. W. (1991). Loss on ignition and kjeldahl digestion for estimating organic carbon and total nitrogen in estuarine marsh soils: calibration with dry combustion. Estuaries 14, 175. doi:10.2307/1351691
Croudace, I., and Rothwell, G. (2010). Micro-XRF sediment core scanners: important new tools for the environmental and earth sciences. Spectrosc. Europe/World. Available online at: https://www.spectroscopyeurope.com/article/micro-xrf-sediment-core-scanners-important-new-tools-environmental-and-earth-sciences.
Dahl, T. E. (1990). Wetlands losses in the United States, 1780s to 1980s. Washington, DC: U.S. Department of Interior, Fish and Wildlife Service, 21. Available online at: https://www.fws.gov/media/wetland-losses-united-states-1780s-1980s.
Davis, P. E., Nicholls, K. W., Holland, D. M., Schmidt, B. E., Washam, P., Riverman, K. L., et al. (2023). Suppressed basal melting in the eastern Thwaites Glacier grounding zone. Nature 614, 479–485. doi:10.1038/s41586-022-05586-0
Dean, W. E. (1974). Determination of carbonate and organic matter in calcareous sediments and sedimentary rocks by loss on ignition: comparison with other methods. J. Sediment. Petrology Vol. 44 (44), 242–248. doi:10.1306/74D729D2-2B21-11D7-8648000102C1865D
Duarte, C. M., Middelburg, J. J., and Caraco, N. (2005). Major role of marine vegetation on the oceanic carbon cycle. Biogeosciences 2, 1–8. doi:10.5194/bg-2-1-2005
Edwards, R. J., Wright, A. J., and Plassche, O. V. (2004). Surface distributions of salt-marsh Foraminifera from Connecticut, USA: modern analogues for high-resolution sea level studies. Mar. Micropaleontol. 51, 1–21. doi:10.1016/j.marmicro.2003.08.002
Engelhart, S. E., and Horton, B. P. (2012). Holocene sea level database for the Atlantic coast of the United States. Quat. Sci. Rev. 54, 12–25. doi:10.1016/j.quascirev.2011.09.013
Engelhart, S. E., Peltier, W. R., and Horton, B. P. (2011). Holocene relative sea-level changes and glacial isostatic adjustment of the U.S. Atlantic coast. Geology 39, 751–754. doi:10.1130/G31857.1
Fatela, F., and Taborda, R. (2002). Confidence limits of species proportions in microfossil assemblages. Mar. Micropaleontol. 45 (2), 169–174. doi:10.1016/s0377-8398(02)00021-x
Fish and Wildlife Service (2004). Wetlands mapper. FWS.gov. Available online at: https://www.fws.gov/program/national-wetlands-inventory/wetlands-mapper.
Gehrels, W. R. (1994). Determining relative sea-level change from salt-marsh Foraminifera and plant zones on the Coast of Maine, U.S.A. J. Coast. Res. 10 (4), 990–1009. Available online at: http://www.jstor.org/stable/4298291.
Geological Survey (2022). RSIL: report of stable Isotopic Composition for reference material USGS24. Available online at: https://www.usgs.gov/media/files/rsil-report-stable-isotopic-composition-reference-material-usgs24.
Geological Survey (USGS) (2024). Annual NLCD Collection 1 Science Products. U.S. Geol. Surv. data release. doi:10.5066/P94UXNTS
Gomez, N., Mitrovica, J. X., Tamisiea, M. E., and Clark, P. U. (2010). A new projection of sea level change in response to collapse of marine sectors of the Antarctic Ice Sheet. Geophys. J. Int. 180, 623–634. doi:10.1111/j.1365-246X.2009.04419.x
Hartig, E. K., Gornitz, V., Kolker, A., Mushacke, F., and Fallon, D. (2002). “Anthropogenic and climate-change impacts on salt marshes of Jamaica Bay, New York, NY: Springer Nature”, 22. 71–89. doi:10.1672/0277-5212(2002)022[0071:aaccio]2.0.co;2
Heaton, T. J., Köhler, P., Butzin, M., Bard, E., Reimer, R. W., and Austin, W. E. N. (2020). Marine20—The Marine Radiocarbon Age Calibration Curve (0–55,000 cal BP). Radiocarbon 62 (4), 779–820. doi:10.1017/RDC.2020.68
Hill, T., and Anisfeld, S. C. (2015). Coastal wetland response to sea level rise in Connecticut and New York. Estuar. Coast. Shelf Sci. 163, 185–193. doi:10.1016/j.ecss.2015.06.004
Holmquist, J. R., Windham-Myers, L., Bliss, N., Crooks, S., Morris, J. T., Megonigal, J. P., et al. (2018). Accuracy and precision of tidal wetland soil carbon mapping in the conterminous United States. Sci. Rep. 8, 9478. doi:10.1038/s41598-018-26948-7
Horton, R., Little, C., Gornitz, V., Bader, D., and Oppenheimer, M. (2015). New York City Panel on climate change 2015 report chapter 2: sea level rise and Coastal storms. N. Y. Acad. Sci. 1336, 36–44. doi:10.1111/nyas.12593
Hosmer, C. (1882). Hart and City Island and vicinity – western part of Long Island Sound, New York. [Map] US Coast and Geodetic Survey. Available online at: https://nosimagery.noaa.gov/images/shoreline_surveys/survey_scans/T-1515-A-Bis.jpg.
Howard, J. (2014). Coastal blue carbon: methods for assessing carbon stocks and emissions factors in mangroves, tidal salt marshes, and seagrasses. Cent. Int. For. Res. Available online at: https://www.cifor.org/knowledge/publication/5095/.
Jackson, S. D. (2019). NAACC tidal stream crossing instruction manual for aquatic passability assessments. North Atlantic Aquatic Connectivity Collaborative (Amherst, MA: NAACC). University of Massachusetts Amherst, 34. Available online at: https://streamcontinuity.org/naacc-documents.
Jezycki, K. E., Rodriguez, E., Craft, C. B., Neubauer, S. C., Morris, J. T., Goldsmith, S. T., et al. (2024). Metal accumulation in salt marsh soils along the east coast of the United States. Sci. Total Environ. 922, 171025. doi:10.1016/j.scitotenv.2024.171025
Kadinsky, S. (2019). Turtle cove, Bronx. Hidden waters blog. Available online at: https://hiddenwatersblog.wordpress.com/2019/04/11/turtlebx/.
Kemp, A. C., Vane, C. H., Horton, B. P., Engelhart, S. E., and Nikitina, D. (2011). Application of stable carbon isotopes for reconstructing salt-marsh floral zones and relative sea level, New Jersey, USA. J. Quat. Sci. 27 (4), 404–414. doi:10.1002/jqs.1561
Kemp, A. C., Hill, T. D., Vane, C. H., Cahill, N., Orton, P. M., Talke, S. A., et al. (2017). Relative sea-level trends in New York City during the past 1500 years. Holocene 27 (8), 1169–1186. doi:10.1177/0959683616683263
Kenna, T. C., Nitsche, F. O., Herron, M. M., Mailloux, B. J., Peteet, D. M., Sritrairat, S., et al. (2011). Evaluation and calibration of a Field Portable X-Ray Fluorescence spectrometer for quantitative analysis of siliciclastic soils and sediments. J. Anal. Atomic Spectrom. 26 (2), 395–405. doi:10.1039/c0ja00133c
Kopp, R. E., Horton, R. M., Little, C. M., Mitrovica, J. X., Oppenheimer, M., Rasmussen, D. J., et al. (2014). Probabilistic 21st and 22nd century sea-level projections at a global network of tide-gauge sites. Earth's Future 2, 383–406. doi:10.1002/2014EF000239
Kroeger, K. D., Crooks, S., Moseman-Valtierra, S., and Tang, J. (2017). Restoring tides to reduce methane emissions in impounded wetlands: a new and potent Blue Carbon climate change intervention. Sci. Rep. 7, 11914. doi:10.1038/s41598-017-12138-4
Levermann, A., Griesel, A., Hofmann, M., Montoya, M., and Rahmstorf, S. (2005). Dynamic sea level changes following changes in the thermohaline circulation. Clim. Dyn. 24, 347–354. doi:10.1007/s00382-004-0505-y
Lima, A. L., Bergquist, B. A., Boyle, E. A., Reuer, M. K., Dudas, F. O., Reddy, C. M., et al. (2005). High-resolution historical records from Pettaquamscutt River basin sediments: 2. Pb isotopes reveal a potential new stratigraphic marker. Geochimica Cosmochimica Acta 69, 1813–1824. doi:10.1016/j.gca.2004.10.008
Long Island Sound Study (2003). Long Island Sound habitat restoration manual. Available online at: https://lispartnership.org/2004/12/long-island-sound-habitat-restoration-manual/.
Ma, Y., Choi, C., Thomas, A., and Gibson, L. (2022). Review of contaminant levels and effects in shorebirds: knowledge gaps and conservation priorities. Ecotoxicol. Environ. Saf. 242, 113868. doi:10.1016/j.ecoenv.2022.113868
Martin, A. C., and Barkley, W. D. (1961). Seed Identification Manual (DGO-Digital original, 1). University of California Press. doi:10.2307/jj.8500978
Mcleod, E., Chmura, G. L., Bouillon, S., Salm, R., Björk, M., Duarte, C. M., et al. (2011). A blueprint for blue carbon: toward an improved understanding of the role of vegetated coastal habitats in sequestering CO2. Front. Ecol. Environ. 9, 552–560. doi:10.1890/110004
Montgomery, F. (1977). Seeds and fruits of plants of Eastern Canada and Northeastern United States. University of Toronto Press eBooks. doi:10.3138/9781487583156
MRLC Viewer (2021). Nextgen-viewer. Available online at: https://www.mrlc.gov/viewer/.
Nahlik, A. M., and Fennessy, M. S. (2016). Carbon storage in US wetlands. Nat. Commun. 7 (1), 13835. doi:10.1038/ncomms13835
New York State Department of Environmental Conservation (2024). Tidal Wetl. - Inf. Mater. Photogr. Maps Video. Available online at: https://www.dec.ny.gov/lands/5118.html.
New York State Department of Environmental Conservation (2025). Tidal Wetl. – Tidal Wetl. Categ. Available online at: https://dec.ny.gov/nature/waterbodies/wetlands/tidal/categories.
New York State GIS Resources (2022). NY Statewide Digital Orthoimagery Program. Available online at: https://gis.ny.gov/orthoimagery.
Nixon, S. W. (1982). The ecology of New England high salt marshes: a community profile. U.S. Fish and Wildlife Service, Office of Biological Services. Washington, DC: USFWS. Available online at: https://books.google.com/books/about/The_Ecology_of_New_England_High_Salt_Mar.html?id=gsKHuL7BU20C.
North Atlantic Aquatic Connectivity Collaborative (NAACC) (2021). “Documents: aquatic connectivity - tidal,” in Aquatic connectivity scoring systems for tidal crossings, 13. Available online at: https://streamcontinuity.org/resources/aquatic-passability-scoring-systems-tidal-stream-crossings#appendix-a-comparison-tidal-scoring-systems-with-the-aquatic-passability-scoring-systems-for-non-tidal-stream-crossings.
Nys, G. I. S. C. (2022). Regulatory tidal wetlands. Albany, NY: NYSDEC Publisher. Available online at: https://data.gis.ny.gov/datasets/661acb5eaffb4be39b0d6d2203e636c3/explore?location=40.860410%2C-73.801950%2C15.48.
Orson, R. A., Warren, R. S., and Niering, W. A. (1998). Interpreting Sea level rise and rates of vertical marsh accretion in a Southern new England tidal salt marsh. Estuar. Coast. Shelf Sci. 47, 419–429. doi:10.1006/ecss.1998.0363
Pace, et al., G., Peteet, D., Dunton, M., Wang-Mondaca, C., Ismail, S., Supino, J., et al. (2021). Importance of quantifying the full-depth carbon reservoir of Jamaica Bay salt Marshes, New York. City Environ. Interact. 12, 100073. doi:10.1016/j.cacint.2021.100073
Pederson, D. C., Peteet, D. M., Kurdyla, D., and Guilderson, T. (2005). Medieval Warming, Little Ice Age, and European impact on the environment during the last millennium in the lower Hudson Valley, New York, USA. Quat. Res. 63, 238–249. doi:10.1016/j.yqres.2005.01.001
Pendleton, L., Donato, D. C., Murray, B. C., Crooks, S., Jenkins, W. A., Sifleet, S., et al. (2012). Estimating global ‘blue carbon’ emissions from conversion and degradation of vegetated coastal ecosystems. PLoS ONE 7 (9), e43542. doi:10.1371/journal.pone.0043542
Peteet, D. M., Pederson, D. C., Kurdyla, D., and Guilderson, T. (2007). “Hudson River paleoecology from marshes: environmental change and its implications for fisheries,” in Hudson River fishes and their environment. Editors A. F. S. Symposium, J. R. Waldman, K. E. Limburg, and D. Strayer (American Fisheries Society), 112–128. Available online at: https://pubs.giss.nasa.gov/abs/pe02300a.html.
Peteet, D. M., Nichols, J. E., Kenna, T. C., Chang, C., Browne, J. P., Reza, M. R. G., et al. (2018). Sediment starvation destroys New York City marshes’ resistance to sea level rise. Proc. Natl. Acad. Sci. U. S. A. 115 (41), 10281–10286. doi:10.1073/pnas.1715392115
Peteet, D. M., Nichols, J. E., Pederson, D., Kenna, T. C., Chang, C., Newton, B. W., et al. (2020). Climate and anthropogenic controls on blue carbon sequestration in Hudson River tidal marsh, Piermont, New York. Environ. Res. Lett. 15 (6), 065001. doi:10.1088/1748-9326/ab7a56
Pincus (1885). Map showing topographical survey of land to be taken for Pelham Bay Park. Available online at: https://digitalcollections.nypl.org/items/f4db85b0-03ed-0134-688d-00505686a51c.
Pontee, N. (2013). Defining coastal squeeze: a discussion. Ocean and Coast. Manag. 84, 204–207. doi:10.1016/j.ocecoaman.2013.07.010
Redfield, A. C. (1972). Development of a new England salt Marsh. Ecol. Monogr. 42, 201–237. doi:10.2307/1942263
Roman, C. T., Niering, W. A., and Warren, R. S. (1984). Salt marsh vegetation change in response to tidal restriction. Environ. Manag. 8, 141–149. doi:10.1007/BF01866935
Rouff, A. A., Eaton, T. T., and Lanzirotti, A. (2013). Heavy metal distribution in an urban wetland impacted by combined sewer overflow. Chemosphere 93 (9), 2159–2164. doi:10.1016/j.chemosphere.2013.07.077
Sañudo-Wilhelmy, S. A., and Gill, G. A. (1999). Impact of the Clean Water Act on the levels of toxic metals in urban estuaries: the Hudson River Estuary revisited. Environ. Sci. and Technol. 33 (20), 3477–3481. doi:10.1021/es981130z
Sapkota, Y., and White, J. R. (2019). Long-term fate of rapidly eroding carbon stock soil profiles in coastal wetlands. Sci. Total Environ. 753, 141913. doi:10.1016/j.scitotenv.2020.141913
Scambos, T. A., Bell, R., Alley, R., Anandakrishnan, S., Bromwich, D., Brunt, K., et al. (2017). How much, how fast? a science review and outlook for research on the instability of Antarctica's Thwaites Glacier in the 21st century. Glob. Planet. Change 153, 16–34. doi:10.1016/j.gloplacha.2017.04.008
Scott, D. B., and Medioli, F. S. (1978). Vertical zonations of marsh Foraminifera as accurate indicators of former sea-levels. Nature 272, 528–531. doi:10.1038/272528a0
Scott, D. B., and Medioli, F. S. (1980). Foraminifera as sea-level indicators. Sea-Level Res. Available online at: https://link.springer.com/chapter/10.1007/978-94-009-4215-8_15.
Shelton, J. R. (2022). The MICADAS touch — carbon dating for climate solutions. YaleNews. Available online at: https://news.yale.edu/2022/12/16/micadas-touch-carbon-dating-climate-solutions.
Strunk, A., Olsen, J., Sanei, H., Rudra, A., and Larsen, N. K. (2020). Improving the reliability of bulk sediment radiocarbon dating. Quat. Sci. Rev. 242, 106442. doi:10.1016/j.quascirev.2020.106442
Swadek, R. K., Larson, M., Cullman, G., King, K. L., Greenfeld, J., Charlop-Powers, S., et al. (2021). “Wetlands management framework for New York City,” in Natural areas conservancy and NYC parks. New York, NY. Available online at: https://naturalareasnyc.org/coalition-advocacy/wetlands-management-framework/.
Titus, J. G., Hudgens, D. E., Trescott, D. L., Craghan, M., Nuckols, W. H., Hershner, C. H., et al. (2009). State and local governments plan for development of most land vulnerable to rising sea level along the US Atlantic coast. Environ. Res. Lett. 4, 044008. doi:10.1088/1748-9326/4/4/044008
Torio, D. D., and Chmura, G. L. (2013). Assessing coastal squeeze of tidal wetlands. J. Coast. Res. 290, 1049–1061. doi:10.2112/jcoastres-d-12-00162.1
U.S. EPA (1986). Air Quality Criteria for Lead (Final Report, 1986). Washington, D.C.: U.S. Environmental Protection Agency. Available online at: https://cfpub.epa.gov/ncea/risk/recordisplay.cfm?deid=32647.
U.S. EPA (2020). Tidal restriction synthesis review: an analysis of U.S. tidal restrictions and opportunities for their avoidance and removal. Wash. D.C., Doc. No. EPA-842-R-20001. Available online at: https://www.epa.gov/wetlands/tidal-restrictions-synthesis-review.
U.S. EPA (2024). Greenhouse gas equivalencies calculator. Available online at: https://www.epa.gov/energy/greenhouse-gas-equivalencies-calculator.
Vane, C. H., Kim, A. W., Moss-Hayes, V., Turner, G., Mills, K., Chenery, S. R., et al. (2020). Organic pollutants, heavy metals and toxicity in oil spill impacted salt marsh sediment cores, Staten Island, New York City, USA. Mar. Pollut. Bull. 151, 110721. doi:10.1016/j.marpolbul.2019.110721
Varekamp, J. C., and Thomas, E. (1998). Climate change and the rise and fall of sea level over the millennium. Eos 79, 69–75. doi:10.1029/98EO00046
Wang, F., Sanders, C. J., Santos, I. R., Tang, J., Schuerch, M., Kirwan, M. L., et al. (2020). Global blue carbon accumulation in tidal wetlands increases with climate change. Natl. Sci. Review/National Sci. Rev. 8 (9), nwaa296. doi:10.1093/nsr/nwaa296
Wright, A. J., Edwards, R. J., and Plassche, O. V. (2011). Reassessing transfer-function performance in sea-level reconstruction based on benthic salt-marsh Foraminifera from the Atlantic coast of NE North America. Mar. Micropaleontol. 81, 43–62. doi:10.1016/j.marmicro.2011.07.003
Keywords: tidal marsh loss, sea-level rise, shoreline development, water quality, carbon sequestration, wetland restoration, climate adaptation, coastal resilience
Citation: Goetz N, Chang C, Kovari S, Alfano M, Pal-Yadav A, Vaughn D and Peteet D (2025) Sediment stratigraphy in NYC salt marsh reveals extensive wetland loss, heavy metal pollution and blue carbon release. Front. Environ. Sci. 13:1688420. doi: 10.3389/fenvs.2025.1688420
Received: 26 August 2025; Accepted: 30 October 2025;
Published: 17 December 2025.
Edited by:
Zimin Li, Chinese Academy of Sciences (CAS), ChinaReviewed by:
Yener Ulus, Auburn University at Montgomery, United StatesMolly Bost, Southeast Fisheries Science Center (NOAA), United States
Copyright © 2025 Goetz, Chang, Kovari, Alfano, Pal-Yadav, Vaughn and Peteet. This is an open-access article distributed under the terms of the Creative Commons Attribution License (CC BY). The use, distribution or reproduction in other forums is permitted, provided the original author(s) and the copyright owner(s) are credited and that the original publication in this journal is cited, in accordance with accepted academic practice. No use, distribution or reproduction is permitted which does not comply with these terms.
*Correspondence: Nathaniel Goetz, bmxnMjEzMkBjb2x1bWJpYS5lZHU=; Dorothy Peteet, cGV0ZWV0QGxkZW8uY29sdW1iaWEuZWR1
†Present address: Nathaniel Goetz, Watershed Management Division, San Francisco Bay Regional Water Quality Control Board, Oakland, CA, United States
Stephen Kovari, Science Department, Bronxville High School, Bronxville, NY, United States
Marina Alfano, School of BioSciences, University of Melbourne, Melbourne, VIC, Australia
Aarna Pal-Yadav, Faculty of Arts and Sciences, Harvard University, Cambridge, MA, United States
Derrick Vaughn, Department of Geosciences, Utah State University, Logan, UT, United States