 Daniel Escobar
 Salim Belyazid1†
- 1Department of Physical Geography, Stockholm University, Stockholm, Sweden
- 2Climate Action Lever, Alliance of Bioversity International and the International Center for Tropical Agriculture, Palmira, Colombia
- 3Bolin Centre for Climate Research, Stockholm University, Stockholm, Sweden
A Correction on
Back to the future: restoring northern drained forested peatlands for climate change mitigation
by Carbonari DE, Belyazid S and Manzoni S (2022). Front. Environ. Sci. 10:834371. doi: 10.3389/fenvs.2022.834371
In the published article, there was an error in Figures 1, 6 as published. In Figure 1, the arrow going from “Mineral Nutrient Content” to “Plant Nutrient Uptake” was red with a minus sign; it should be blue with a plus. Similarly, the arrow going from “Plant Nutrient Uptake” to “Mineral Nutrient Uptake” was blue with a plus sign; it should be red with a minus sign. In Figure 6, the arrow going from “Soil Water” to “Soil Oxygen” was blue with a plus sign; it should be red with a minus sign.
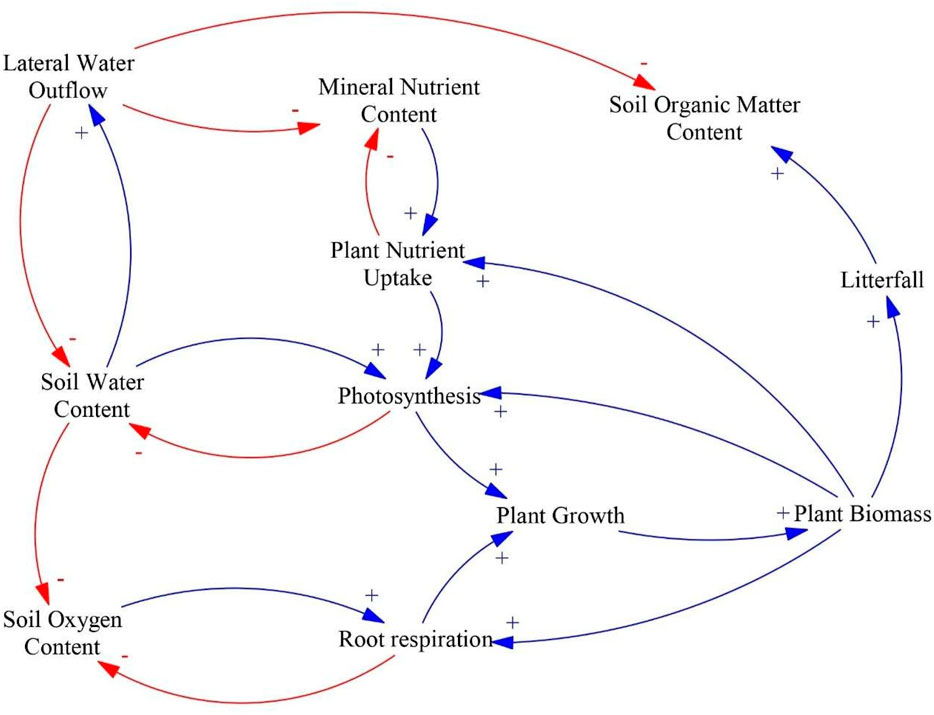
Figure 1. Causal loop diagram of the main effects of water table management on plant biomass and litterfall. An arrow with a plus sign (blue) indicates a change in the variable affected that is in the same direction as the change in the driving variable, an arrow with a minus sign (red) indicates a change in variable affected that is in the opposite direction as the change in the driving variable.
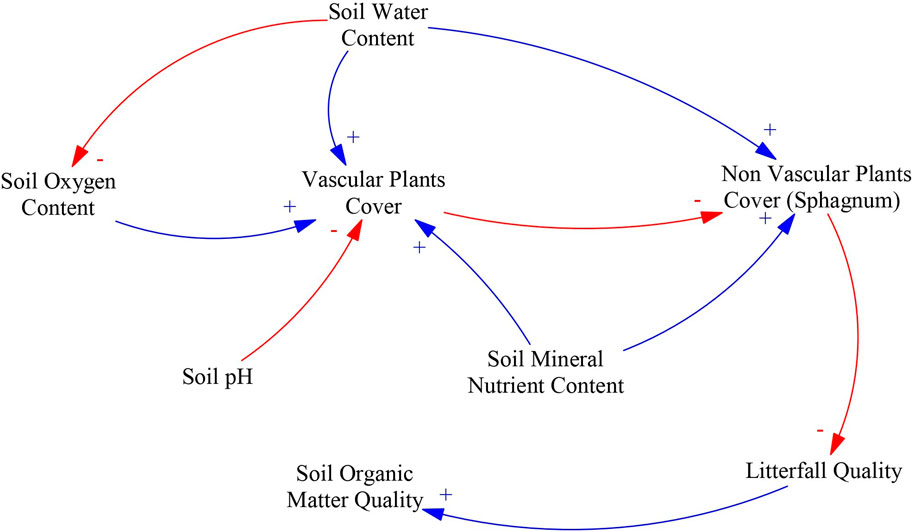
Figure 2. Causal loop diagram of the main effects of water table management on litterfall quality. An arrow with a plus sign (blue) indicates a change in the variable affected that is in the same direction as the change in the driving variable, an arrow with a minus sign (red) indicates a change in variable affected that is in the opposite direction as the change in the driving variable.
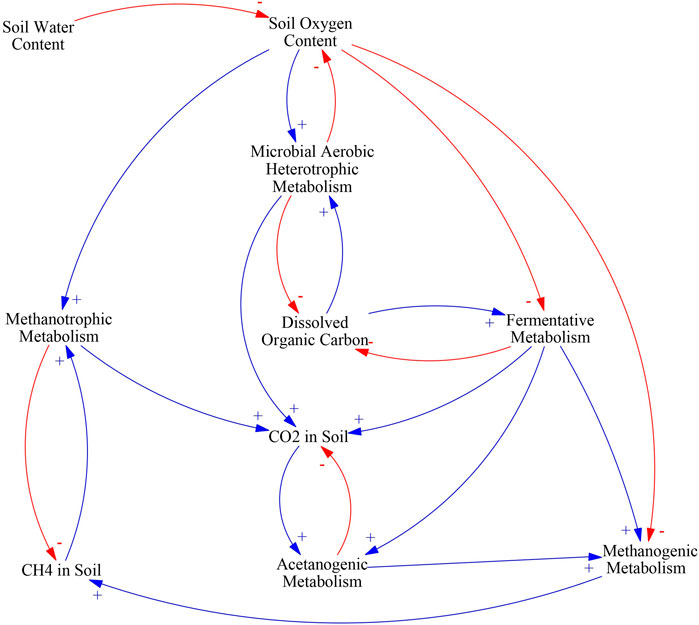
Figure 4. Causal loop diagram of the main effects of water table management on carbon mineralization pathways. An arrow with a plus sign (blue) indicates a change in the variable affected that is in the same direction as the change in the driving variable, an arrow with a minus sign (red) indicates a change in variable affected that is in the opposite direction as the change in the driving variable.
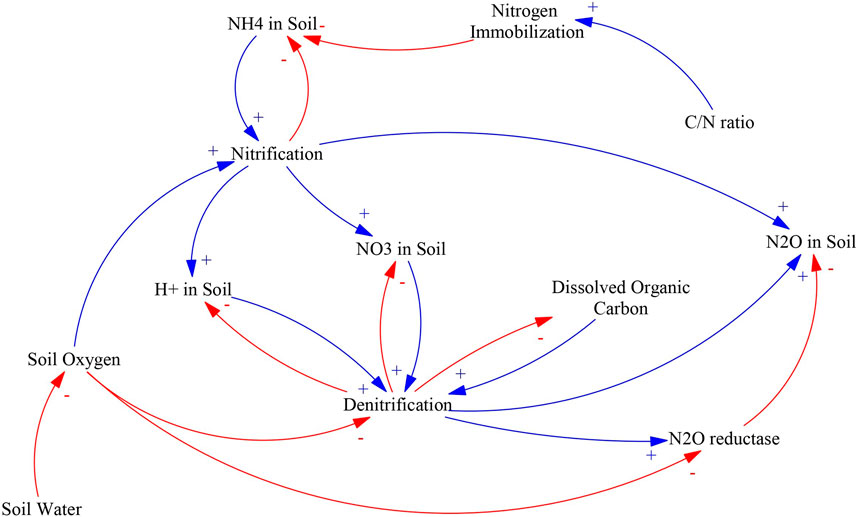
Figure 5. Causal loop diagram of the main effects of water table management on nitrogen mineralization pathways. An arrow with a plus sign (blue) indicates a change in the variable affected that is in the same direction as the change in the driving variable, an arrow with a minus sign (red) indicates a change in variable affected that is in the opposite direction as the change in the driving variable.
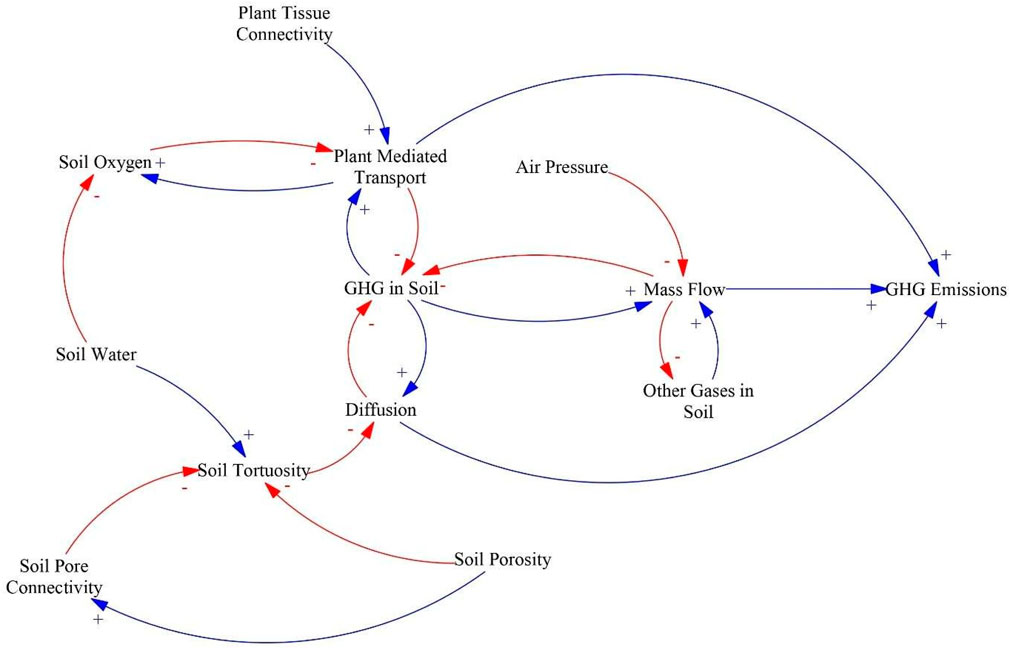
Figure 6. Causal loop diagram of the main effects of water table management on greenhouse gas transport in soils. An arrow with a plus sign (blue) indicates a change in the variable affected that is in the same direction as the change in the driving variable, an arrow with a minus sign (red) indicates a change in variable affected that is in the opposite direction as the change in the driving variable.
The corrected Figure 1, 6 and their captions appear below.
The original article also contained some grammatical errors in figures 2, 4 and 5. The corrected figures and their captions appear below.
The original article has been updated
Publisher’s note
All claims expressed in this article are solely those of the authors and do not necessarily represent those of their affiliated organizations, or those of the publisher, the editors and the reviewers. Any product that may be evaluated in this article, or claim that may be made by its manufacturer, is not guaranteed or endorsed by the publisher.
Keywords: peatland, restoration, rewetting, GHG balance, forest, land-use, management
Citation: Escobar D, Belyazid S and Manzoni S (2025) Correction: Back to the future: restoring northern drained forested peatlands for climate change mitigation. Front. Environ. Sci. 13:1691013. doi: 10.3389/fenvs.2025.1691013
Received: 22 August 2025; Accepted: 26 August 2025;
Published: 17 September 2025.
Edited and reviewed by:
Rosa Francaviglia, Council for Agricultural Research and Agricultural Economy Analysis (CREA), ItalyCopyright © 2025 Escobar, Belyazid and Manzoni. This is an open-access article distributed under the terms of the Creative Commons Attribution License (CC BY). The use, distribution or reproduction in other forums is permitted, provided the original author(s) and the copyright owner(s) are credited and that the original publication in this journal is cited, in accordance with accepted academic practice. No use, distribution or reproduction is permitted which does not comply with these terms.
*Correspondence: Daniel Escobar, ZHNjb3ZhcjkwQGdtYWlsLmNvbQ==
†These authors have contributed equally to this work and share senior authorship