 S. Sharief Basha
 A. Nagaraja Rao2*
 T. K. Nida Fariz
- 1Department of Analytics, School of Computer Science and Engineering, Vellore Institute of Technology, Vellore, Tamil Nadu, India
- 2Department of Computational Intelligence, School of Computer Science and Engineering, Vellore Institute of Technology, Vellore, Tamil Nadu, India
- 3Department of Mathematics, School of Advanced Science Vellore Institute of Technology, Vellore, Tamil Nadu, India
Introduction: Solar radiation forecasting (SRF) faces significant challenges due to high-dimensional meteorological data that can affect model generalization and computational efficiency. This study presents a comprehensive framework integrating Principal Component Analysis (PCA) with Support Vector Regression (SVR) to address these challenges and improve prediction accuracy.
Methods: Meteorological data were collected throughout 2023 at VIT University’s campus in Vellore, Tamil Nadu, incorporating multiple parameters including ambient temperature, dew point, wind characteristics, and atmospheric conditions. PCA was employed to transform correlated variables into uncorrelated principal components through data normalization, covariance analysis, component extraction, and selective feature retention based on cumulative explained variance thresholds. The dimensionally reduced dataset was then fed into various SVR models with different kernel functions (linear, polynomial, tanh, and Gaussian). Model validation was rigorously performed using k-fold cross-validation to identify the optimal configuration for solar radiation prediction.
Results: Comparative analysis revealed that the SVR_Gaussian implementation demonstrated superior performance with RMSE of 9.111125, MAE of 3.765607, MAPE of 0.013853, and R2 of 98.37%, outperforming all alternative models tested.
Discussion: The hybrid PCA-SVR approach effectively handles the inherent complexity of solar radiation patterns while maintaining computational efficiency, demonstrating that dimensionality reduction combined with advanced machine learning techniques can significantly enhance solar radiation forecasting accuracy.
Introduction
Global efforts are increasingly focused on transitioning to renewable energy sources for electricity generation, fundamentally transforming our approach to power production. Integrating a significant proportion of renewable electricity into the energy infrastructure is essential for developing a sustainable and environmentally responsible power system (Sen and Ganguly, 2017). Solar energy stands as a promising renewable resource, yet faces significant challenges in the energy sector. The industry must contend with price fluctuations, demand variations, and the inherent instability of renewable energy production (Kannan and Vakeesan, 2016).
Photovoltaic power generation is particularly sensitive to manufacturing processes and meteorological variables. To address these complexities, advanced predictive models are crucial. These models can analyze historical data to forecast power availability, ultimately improving grid stability and supporting more effective economic decision-making in the renewable energy landscape (Ziane et al., 2021).
The solution lies in developing intelligent prediction frameworks that transform environmental data into actionable energy insights. Emerging economies such as India have begun making significant investments in renewable energy technologies to address their growing energy needs (Atheeque et al., 2024). This strategic shift serves two purposes: meeting the energy demands of their expanding populations and technological advancement, while also providing an alternative to the world’s diminishing fossil fuel reserves. Solar power has emerged as the predominant renewable energy source in numerous nations, including India, various European countries, Spain, and Saudi Arabia (Kiesecker et al., 2019). As of 2020, Tamil Nadu, one of India’s states, achieved a solar power generation capacity of approximately 4,000 MW. During the fiscal year 2019–2020, the state successfully captured 3,842 million units of solar energy (Kumar, 2020).
SRF can be accomplished through two main approaches: analyzing satellite data or utilizing Numerical Weather Prediction (NWP) models (Krishnan et al., 2023). With the growing availability of measured solar radiation data, researchers have increasingly turned to data-driven methodologies to improve prediction accuracy. Several studies have evaluated and compared the effectiveness of various forecasting techniques in this field (Alrashidi et al., 2021).
The use of NWP models for SRF offers notable benefits, particularly their worldwide accessibility and straightforward implementation (Tawn and Browell, 2022). This has led to extensive research and evaluation of these models over the past 10 years. However, their accuracy levels remain suboptimal, which has prompted researchers to enhance NWP-based predictions by incorporating machine learning algorithms. These advanced computational methods utilize various meteorological parameters forecast by NWP models as input data (Couto and Estanqueiro, 2022).
A significant challenge in this approach is the high dimensionality of the dataset, which can lead to poor model generalization (Zhang et al., 2021). To address this issue, researchers employ two main types of dimensionality reduction strategies. The first approach, feature selection, identifies and focuses on the most significant weather parameters (Ayesha et al., 2020). The second method, feature extraction, condenses the complete weather dataset into a more manageable form, though this process inevitably involves some information loss. Both these techniques have proven valuable in renewable energy forecasting applications that utilize machine learning methods (Ray et al., 2021). Mathematical statistics applied to problems with multiple variables, known as multivariate statistical analysis (Hair, 2009) provides crucial methodologies for addressing these dimensionality challenges. Recent computing advancements have expanded these techniques across numerous fields including meteorology and energy forecasting (Abdelhafidi et al., 2021). Principal Component Analysis (PCA), Factor Analysis (FA), and correspondence analysis effectively simplify complex systems by identifying key elements, guiding appropriate data selection, and clarifying the influence of various factors (Fariz and Basha, 2024; 2025). Within this framework, both prediction models (using multiple linear regression, stepwise regression, and discriminant analysis) and descriptive models (employing cluster analysis) play essential roles in understanding complex meteorological relationships and improving forecasting accuracy (Katz, 2003). Various analytical methods are employed to quantify relationships between variables, including cross-tabulation, partial correlation, and multiple regression, which help control for confounding factors and elucidate connections between independent and dependent variables (Bashir et al., 2024). Classification and pattern exploration often utilize cluster analysis, while regression techniques and discriminant analysis serve predictive functions (Ge et al., 2017). The field encompasses numerous important methodological approaches: multiple and logistic regression, MANOVA, factor analysis, discriminant function analysis, cluster analysis, multidimensional scaling (MDS), principal component analysis, correspondence analysis, canonical correlation, conjoint analysis, structural equation modeling, and log-linear models (Gnanadesikan, 2011). For dimensionality reduction purposes, researchers frequently apply PCA and factor analysis, whereas understanding variable relationships and classification typically involves multiple regression and cluster analyses (Shiker, 2012). Within the context of this particular study, PCA was selected as the primary methodology for dimensional reduction of variables, and a SVR is finally used to obtain the final prediction, in this case to a solar radiation prediction problem.
In India, there are only a limited number of meteorological stations that record global solar radiation (GSR) (Joshi, 2018; Verma and Joshi, 2021; Amith et al., 2022). However, even at established monitoring locations, GSR measurements frequently contain gaps or anomalous values outside expected parameters (Atheeque and Basha, 2024). Additionally, the relationship between GSR and meteorological conditions presents analytical challenges when approached through experimental methodologies, as direct measurement processes at weather stations prove resource-intensive and logistically complex. Computational intelligence approaches, including artificial neural networks, fuzzy logic systems, and adaptive-network-based fuzzy inference systems, therefore represent valuable analytical frameworks for GSR modeling and prediction. Numerous researchers have successfully implemented these computational techniques to develop models estimating GSR based on meteorological variables, resulting in a substantial body of predictive methodologies across diverse global contexts (Jiang, 2009).
Forecasting methods encompass a wide variety of approaches, each characterized by differences in model complexity, implementation, running speed, data requirements, and ultimate prediction accuracy. Traditional techniques such as engineering calculations and simulation model-based methods tend to involve highly detailed inputs and substantial computational complexity, yet are often less user-friendly and comparatively slow in operation. Statistical models, including popular options like ARIMA, offer a balance between ease of use and accuracy, especially when historical data are available, and typically involve moderate to fair complexity (Shadab et al., 2020).
The advent of artificial intelligence has brought about advanced machine learning (ML) methods that are now integral to forecast modeling. ML represents a prominent branch of artificial intelligence that employs statistical methodologies to enable computational systems to acquire knowledge from datasets and make predictions. Among these approaches, support vector machines (SVM) have emerged as particularly effective for forecasting applications. SVMs operate as supervised learning frameworks with corresponding algorithms designed to analyze data for both classification and regression purposes (Paudel et al., 2017). As a kernel-based methodology, SVM demonstrates versatility and is valued for its robustness in mitigating overfitting issues and high accuracy despite modest computational speeds. Additionally, SVM models demonstrate stability, as minor perturbations in data do not substantially affect decision boundaries, thereby ensuring consistent predictions.
Alongside SVMs, artificial neural networks (ANNs) are widely used supervised learning techniques inspired by biological nervous systems. While ANNs excel at extracting patterns from large datasets, their “black box” nature makes it difficult to interpret predictions, limiting organizational adoption due to transparency concerns with stakeholders (Agatonovic-Kustrin and Beresford, 2000). Decision trees organize classification and regression structures hierarchically but suffer from complexity with numerical inputs and high sensitivity to data variations. Random Forests (RF), as ensemble methods aggregating multiple trees, address these limitations and balance accuracy with speed, though requiring greater implementation expertise (Latinne et al., 2001).
A comparative summary of these methods, reflecting their practical strengths and limitations across key criteria, including model complexity, ease of use, running speed, inputs needed, and accuracy is presented in Table 1 below, offering a concise reference for selecting suitable forecasting techniques for specific applications.

Table 1. Comparison of forecasting methods based on key performance criteria.
Related work
A wide array of methodologies has been developed for the prediction of solar radiation. Presently, research on solar radiation forecasting generally falls into two main categories: white-box models and black-box models (Shahcheraghian et al., 2024). White-box approaches predominantly rely on physical principles and require extensive sets of detailed input features related to meteorological and environmental parameters. In contrast, black-box models predominantly involve data-driven learning algorithms such as neural networks and multiple linear regression, which infer predictive relationships directly from historical data.
For example, machine learning and regression-based techniques have been employed in various energy forecasting contexts. Abdelhak Keddouda et al. developed artificial neural network (ANN) and regression models to predict photovoltaic module power output (Keddouda et al., 2023). Zeynab Ramedani et al. developed and compared SVR models using polynomial and radial basis function kernels for forecasting global solar radiation (Ramedani et al., 2014). Table 2 presents a comprehensive list of SVR applications in SRF, summarizing the approaches and findings from existing literature.

Table 2. Comprehensive review of SVR applications in SRF.
A conventional approach to select SVM parameters is to use an exhaustive grid search algorithm. It should be noted that this method requires a large number of evaluations and, thus, its running time is considerably long. Feature selection is commonly applied to identify and retain only the most relevant features, leading to reduced training time and simplified classification models. In some cases, feature selection also enhances prediction accuracy and increases the comprehensibility and generalizability of the model (Alam et al., 2016). However, identifying the optimal subset among all possible feature combinations dramatically enlarges the search space, rendering feature selection an NP-hard problem. Fortunately, dimensionality reduction techniques such as Principal Component Analysis (PCA) offer a more efficient and powerful alternative (George and Vidyapeetham, 2012). By transforming the original feature set into a smaller number of uncorrelated components that capture the majority of the data’s variance, PCA not only streamlines the modeling process but also mitigates issues of multicollinearity and redundancy. This makes PCA a superior approach for reducing complexity and enhancing the predictive performance of machine learning models (Gumus et al., 2010). Additionally, rigorous model evaluation using k-fold cross-validation serves as a robust procedure to validate model stability and accuracy across different data partitions. In the current study, we present and discuss a hybrid modeling approach that combines SVM with PCA for dimensionality reduction and incorporates k-fold cross-validation to accurately forecast the electrical energy consumption of residential buildings in the shortest possible time. The main contribution of this study lies in proposing an integrated framework that leverages PCA and k-fold cross-validation for improved forecasting performance.
Despite the wide application of SVR, PCA–SVR, and other machine learning techniques in solar radiation forecasting, prior studies have not systematically addressed the overlap of dimensionality reduction, kernel selection, and robust cross-validation within a single integrated framework, especially in the context of data-rich, humid subtropical environments. Most existing works focus on either model performance under specific kernels or isolated feature selection strategies, lacking a comparative benchmarking of kernel configurations with respect to local climatic variability. This manuscript addresses these limitations by implementing PCA for optimal feature selection, evaluating multiple SVR kernel functions specifically for the Vellore region, and introducing a benchmarking comparison against ANN models; together, these fill a critical research gap related to model generalizability, computational efficiency, and real-world applicability in complex atmospheric conditions.
Motivation and contribution
The growing global emphasis on renewable energy, particularly solar power, has created a strong demand for precise solar radiation forecasting models, which critically impact photovoltaic (PV) power generation efficiency (Kabir et al., 2018). Traditional empirical methods often lack accuracy in regions with complex atmospheres, such as humid subtropical climates. Machine learning (ML) techniques, which incorporate climatic and air quality data, have shown significant promise in improving forecasting performance (Baghanam et al., 2024). Among ML methods, Support Vector Regression (SVR) stands out for capturing nonlinear relationships with strong generalization capabilities (Zhou et al., 2024). However, given the intricate nature of solar radiation patterns influenced by multiple meteorological factors, selecting an appropriate kernel function in SVR models becomes crucial for enhancing prediction accuracy (Li et al., 2021). To further refine the model’s performance, Principal Component Analysis (PCA) was applied to reduce the dimensionality of the input features prior to model training, ensuring that only the most relevant information contributed to the learning process. Additionally, K-fold cross-validation was implemented to ensure model robustness by assessing performance stability across multiple data splits, thereby enhancing generalizability and reducing the risk of overfitting.
Our study makes key contributions to solar radiation forecasting:
• To enhance model efficiency, we apply Principal Component Analysis (PCA) for dimensionality reduction before feeding data into the model, ensuring optimal feature selection while maintaining predictive accuracy.
• We evaluate four SVR kernel functions (Linear, Polynomial, Gaussian, and Hyperbolic Tangent) for predicting solar radiation in Vellore, Tamil Nadu, a region with distinct climatological conditions.
• We introduce a comparative framework that benchmarks SVR kernel configurations against Artificial Neural Networks (ANN), providing clear guidelines for model selection.
These findings reinforce that a properly tuned, single-kernel SVR model, combined with PCA for feature selection, can achieve high predictive accuracy while remaining computationally efficient.
Data collection
This study This research examines solar irradiance patterns using data collected throughout 2023 at VIT University’s campus in Vellore, Tamil Nadu. To ensure optimal neural network performance, the collected data underwent standardization - a process involving mean subtraction and standard deviation division. The dataset distribution followed a conventional 70–30 split between training and validation phases.
The investigation focused primarily on SRF measurements, with its annual patterns documented graphically (Figure 1). The study incorporated a comprehensive set of weather parameters, including:
• Ambient temperature readings (At)
• Dew point measurements (Dpm)
• Wind characteristics:
• Speed (Wsp)
• Gust intensity (Wgi)
• Directional components (Wdc)
• Atmospheric conditions:
• Humidity levels (Rhl)
• Pressure readings (Rpr)
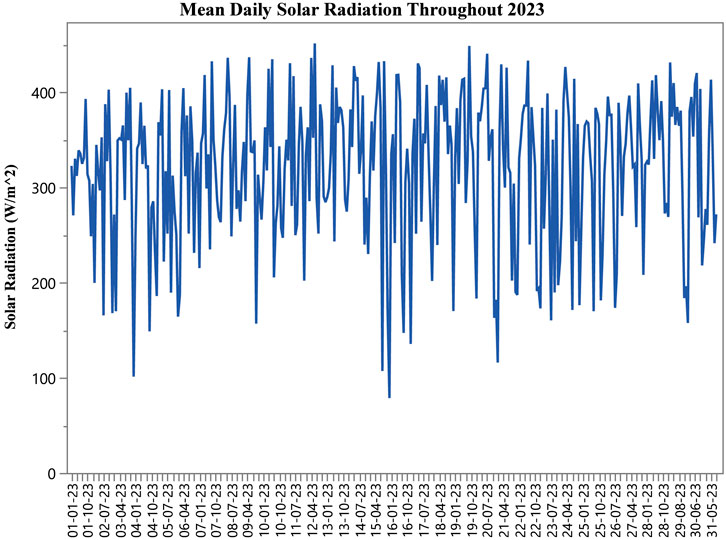
Figure 1. The average daily solar radiation (W/m2) throughout the year 2023.
In developing the machine learning models, these seven parameters (At, Dpm, Wsp, Wgi, Wdc, Rhl, Rpr) served as input variables, while daily average SRF represented the target output.
Essential solar radiation forecasting components
Solar radiation comprises electromagnetic energy emanating from the Sun that penetrates Earth’s atmosphere. During atmospheric transit, component wavelengths undergo selective absorption, scattering, or reflection through interactions with atmospheric constituents including molecular gases, water vapor, cloud formations, aerosols, and anthropogenic pollutants, generating diffuse solar radiation (Seidlitz et al., 2001). Unimpeded radiation reaching terrestrial surfaces constitutes direct beam irradiation. The comprehensive global radiation (insolation) represents the integrated solar energy flux incident upon specific geographic locations (Smedley et al., 2020).
Under optimal atmospheric conditions with minimal opacity and elevated solar angles, direct beam components may constitute 70%–90% of total radiation, while diffuse components predominate during cloud coverage or crepuscular periods, potentially exceeding 30% of total flux. Robust climatological characterization necessitates extended meteorological monitoring regimes to establish baseline radiation budgets, though significant observational challenges persist.
With increasing solar energy penetration globally, precise forecasting methodologies have become critical for maintaining electrical grid stability through effective generation management. Sophisticated hybrid approaches integrating physical principles with data-driven computational methods provide comprehensive solar forecasting frameworks while addressing inherent variability from transient atmospheric phenomena (Paulescu et al., 2013). Advanced forecasting algorithms enable grid operators to anticipate fluctuations in solar energy production and implement informed decisions for supply-demand equilibration. SVR represents an effective machine learning paradigm for solar radiation prediction by identifying complex relationships between historical meteorological parameters and radiation measurements. SVR’s nonlinear mapping capabilities and structural risk minimization principles facilitate robust generalization across diverse atmospheric conditions while mitigating overfitting risks inherent in alternative prediction frameworks.
Materials and methods
Principal component analysis
PCA is a foundational dimensionality reduction technique that transforms complex datasets into interpretable forms while preserving essential information. Originally developed by Pearson, PCA has become indispensable across diverse fields including structural engineering, materials research, and power systems analysis.
PCA employs orthogonal transformation to convert correlated variables into linearly uncorrelated components (Jolliffe and Cadima, 2016). The technique generates new orthogonal variables, principal components, specifically constructed to capture maximum variance in the data. This mathematical approach involves solving for eigenvalues and corresponding eigenvectors, with each component ordered by its contribution to total variance.
In meteorological applications, PCA effectively reduces complex multidimensional weather data into fewer significant components, facilitating solar radiation prediction research. Implementation requires data normalization (zero mean, unit variance) before computing the correlation or covariance matrix. The resulting principal components represent uncorrelated linear combinations that maximize explained variation, enabling efficient dimensionality reduction while preserving the most informative patterns within the original dataset (Mohanty et al., 2025).
Implementing PCA requires normalizing the data by centering around the mean and scaling by standard deviation to ensure uniform distributions. PCA creates orthogonal, uncorrelated linear combinations that maximize explained common variation. The analysis can be conducted using either covariance or correlation matrices, with both approaches becoming equivalent when data is normalized to zero mean and unit variance (Gewers et al., 2022).
Consider a data matrix X where n represents the total number of observations and m denotes the number of variables (grid points in forecasting applications). The correlation matrix eigenvectors, denoted by matrix Γ, allow transformation of the original variables into new uncorrelated variables, as shown in Equation 1.
This transformation creates new uncorrelated data without reducing dimensionality. To achieve dimensionality reduction to a k-dimensional space (where k < m), the original data matrix is multiplied by only the first k eigenvectors, shown in Equation 2:
Each column of the resulting Z_reduced matrix represents a principal component, also referred to as a score vector (Davò et al., 2016). When implementing PCA for structural monitoring, the technique effectively addresses multicollinearity issues while reducing noise in measurement data, resulting in more robust models for predicting structural behavior.
The dataset was partitioned with 70% allocated for training and 30% for testing. To ensure methodological rigor and prevent information leakage, the PCA transformation was fit solely on the training data within each cross-validation fold, and the resulting parameters were subsequently applied to the corresponding validation or test sets. The training segment was used to develop five distinct models: SVR_Gaussian, SVR_Tanh, SVR_Polynomial, SVR_Linear, and Artificial Neural Network (ANN). Through PCA application, the original seven components were condensed to three while maintaining 86.484% of the explained variance. Examples of PCA-derived features and other component characteristics can be found in Table 4.
Support vector machine
Vapnik introduced SVM in 1995 (Vapnik, 1995) to address classification challenges, building upon Statistic Learning Theory and Structural Risk Minimization principles. Researchers later expanded this approach to handle regression and prediction tasks (Drucker et al., 1996). SVMs have grown increasingly popular among data scientists because of their unique capabilities and impressive real-world results. What makes SVM density estimation particularly valuable is its use of the Structural Risk Minimization principle, which researchers have found superior to the traditional Empirical Risk Minimization approach used in conventional methods like neural networks (Parveen et al., 2017). The key difference is that SVM focuses on minimizing the upper boundary of generalization error rather than simply reducing training data errors, a distinction that makes SVMs particularly valuable for statistical learning applications. In recent years, the research community has embraced SVMs as powerful tools for numerous machines learning challenges, applying them successfully across diverse research domains (Basha and Rao, 2025).
At its core, SVM’s strength lies in its innovative use of kernel functions, which perform a remarkable transformation: they take input data from simpler, lower dimensions and cleverly map it into more complex, higher-dimensional spaces without explicitly calculating the transformation (Vapnik, 2013). What sets SVM apart from ANNs is its mathematical elegance - while ANNs often grapple with multiple local minima, SVM’s convex optimization framework ensures it reaches a single, definitive solution. This unique characteristic makes SVM particularly reliable for pattern recognition and data analysis tasks (Chen et al., 2013).
When presented with a training dataset
In this Equations 3, 4,
where w represents the weight vector and b denotes the bias term.
Through implementation of the “kernel trick,” SVR has been extended to address nonlinear regression problems using linear methodologies in appropriate feature spaces (Shawe-Taylor and Cristianini, 2004). The efficacy of SVR is therefore contingent upon both kernel function selection and parameter optimization. In relevant applications, four kernel functions are predominantly utilized:
The linear kernel:
The hyperbolic tangent (tanh) kernel:
The polynomial kernel:
The Gaussian kernel:
where γ represents the positive scalar slope parameter of the tanh kernel, c denotes the offset parameter for polynomial and tanh kernels (typically negative for tanh), d signifies the polynomial kernel degree (positive scalar), and σ represents the width parameter of the Gaussian kernel (positive scalar) (Che, 2013). The methodological framework of the hybrid PCA-SVR model is illustrated in Figure 2. Notably, our results supported by recent literature, show that the Gaussian kernel function in SVR excels at capturing the intricate, nonlinear patterns in SR data, and consistently delivers superior predictive performance over other kernel options (ÖNAL, 2022).

Figure 2. The structured process detailing the methodology employed in this study.
Artificial neural network
Artificial neural networks represent sophisticated computational models structured to mimic the neural architecture of the human brain, functioning as powerful predictive tools while maintaining their characteristic “black-box” nature (Gholami and Sahour, 2022). Among various learning paradigms, the multilayer feedforward network, particularly when implemented with the backpropagation algorithm as established by Hornik et al. (1989), has emerged as a predominant methodological approach. These networks effectively serve as nonlinear statistical frameworks capable of modeling complex relationships between input and output variables. What distinguishes neural networks is their inherent adaptability—they evolve dynamically as information traverses the network architecture, continuously refining their predictive capabilities through learning processes (Eskandari-Naddaf and Kazemi, 2017).
The architectural foundation of neural networks consists of neurons arranged in distinct layers, with a notable absence of intra-layer connections but robust inter-layer connectivity patterns. A typical ANN comprises three fundamental components: an input layer that receives and processes initial data, one or more hidden layers that perform complex transformations, and an output layer that generates the final predictions (Adil et al., 2022). The input layer houses neurons corresponding numerically to the input variables, while the output layer contains neurons matching the number of target variables. Between these boundary layers lie the hidden layers, whose optimal configuration—both in terms of quantity and neuronal density, remains problem-specific and often requires empirical determination through iterative experimentation (Garzón-Roca et al., 2013).
A significant challenge in neural network development involves mitigating overfitting, a phenomenon where the model exhibits excellent performance on training data but fails to generalize effectively to novel data. Contemporary approaches to address this challenge include weight regularization techniques and normalization procedures that constrain weight magnitudes, thereby achieving an optimal balance between the model’s variance and bias components (Ruiz-Aguilar et al., 2021). The operational mechanism underlying most ANNs involves gradient descent optimization, wherein weights and thresholds undergo continuous refinement through backpropagation to minimize the Mean Square Error (MSE) between predicted outputs and observed values (Kara et al., 2016).
Equation 10 represents the activation mechanism across network nodes, employing the Sigmoid function.
where z represents the input variable, serves as the standard nonlinear transformation mechanism facilitating complex pattern recognition.
The model’s training efficacy is primarily evaluated using the Mean Square Error (MSE), in Equation 11.
where N1 represents the total number of input patterns in the dataset. This metric provides a quantitative assessment of prediction accuracy while penalizing larger deviations more severely than smaller ones, thereby encouraging the model to achieve consistent performance across the entire data spectrum.
k-fold cross-validation
k-Fold cross-validation stands as a prevalent resampling strategy for the empirical assessment of predictive modeling techniques. In this procedure, the dataset is systematically divided into k mutually exclusive and approximately equal-sized subsets, known as folds. For each cycle, the learning algorithm is fitted using the data from k−1 folds, while the omitted fold serves as the validation set. This rotation continues until every fold functions as the validation set exactly once. The aggregate performance of the model is then obtained by calculating the arithmetic mean of the metrics recorded across all iterations.
This methodology leverages the full dataset for both model training and evaluation phases, which aids in minimizing overfitting and promoting model generalizability. Furthermore, by averaging results over multiple folds, k-Fold cross-validation yields more reliable and less biased estimations of model efficacy, which is especially advantageous for evaluating predictive accuracy, tuning hyperparameters, and comparing algorithms (Fushiki, 2011).
Pseudocode for k-fold cross-validation
1. Divide the dataset into k distinct folds.
2. For each fold iii from 1 to k:
a. Train the model using all folds except i.
b. Assess performance using fold i and record the selected metric.
3. Calculate the mean value of the recorded metrics over all k folds.
Standard analytical metrics
In evaluating the efficacy of the predictive model for solar radiation assessment and enhancing predictive accuracy, several statistical evaluation metrics were employed. These comprised the root mean squared error (RMSE), mean absolute error (MAE), mean absolute percentage error (MAPE), and coefficient of determination (R2). The mathematical formulations of these evaluation criteria are subsequently delineated.
In this context, let
Result and discursion
In this section, we detail the methods and tools utilized in this research. Principal Component Analysis (PCA) was employed for dimensionality reduction, while Support Vector Regression (SVR) was used for prediction. Various software tools were utilized for model implementation and analysis. Microsoft Excel 2021 was used for data-related tasks, including statistical error metric calculations. MATLAB R2023A was employed for implementing the PCA method. For data preprocessing, the pandas (v2.3.2) and numpy (v2.3.1) libraries in Python were used, while scikit-learn (v1.7.1) facilitated dataset splitting, feature scaling, and model implementation. Additionally, matplotlib (v3.10.1) and seaborn (v0.13.0) were employed for data visualization. The SVR model was implemented using scikit-learn (v1.7.1). All computations and analyses were performed on a system equipped with an Intel Core i5-1145G7 (11th generation) processor and 16 GB RAM.
Feature selection performed via the PCA technique
Principal Component Analysis (PCA) was initially employed as a dimensionality reduction technique. This step is essential as the optimal feature selection directly impacts prediction algorithm performance. Incorporating all variables as input would unnecessarily increase model complexity and extend training duration. Conversely, insufficient feature selection would compromise performance, yielding poor prediction accuracy. The relationships between weather parameters are visualized in the heat map presented in Figure 3.
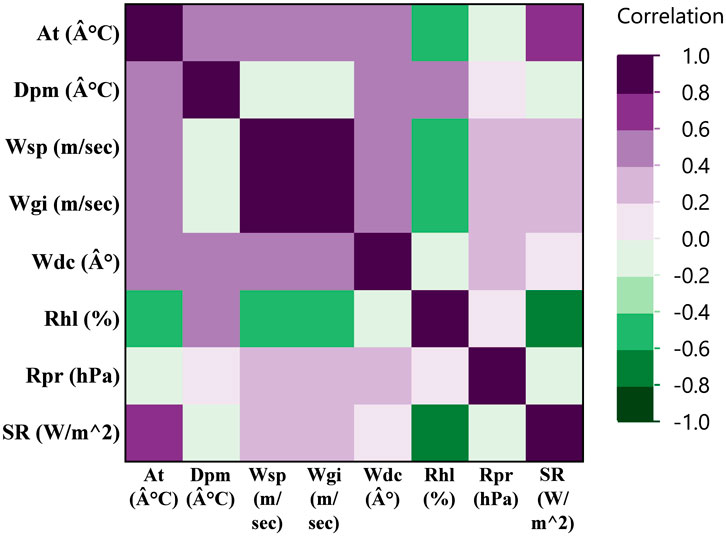
Figure 3. The Pearson correlation analysis performed between meteorological parameters as input and solar radiation as the output.
The data’s suitability for principal component analysis was evaluated using two statistical tests. First, the Kaiser-Meyer-Olkin (KMO) test was applied to assess sampling adequacy by measuring what proportion of variance among the variables might be common variance. Second, Bartlett’s test of sphericity was conducted to determine if the correlation matrix was significantly different from an identity matrix. These preliminary tests help ensure that the dataset meets the necessary assumptions before proceeding with principal component analysis (Cerny and Kaiser, 1977).
The Kaiser-Meyer-Olkin (KMO) test values range from 0 to 1, with values approaching 1 indicating excellent sampling adequacy. According to established guidelines, KMO values exceeding 0.6 are considered acceptable for proceeding with analysis. Concurrently, Bartlett’s test of sphericity evaluates the following hypothesis at a 95% confidence interval, where rejection of the null hypothesis is necessary for conducting Principal Component Analysis (PCA):
Null hypothesis: The correlation matrix represents an identity matrix (α = 0.05 > p indicates acceptance). Alternative hypothesis: The correlation matrix differs from an identity matrix (α = 0.05 < p indicates rejection of the null hypothesis).
As evidenced in Table 3, our analysis yielded a KMO value of 0.734, substantially above the 0.6 threshold, demonstrating meritorious sampling adequacy. Additionally, the significance value obtained from Bartlett’s test (0.000) fell below α = 0.05, with a chi-square value of 3347.172 and 21 degrees of freedom, confirming rejection of the null hypothesis and validating our dataset’s suitability for PCA.
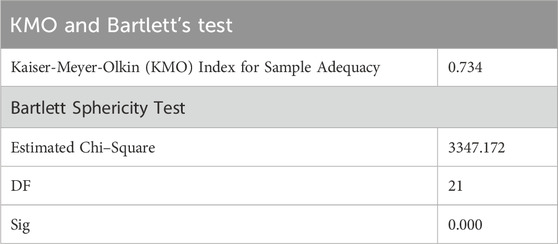
Table 3. The results of the Kaiser-Meyer-Olkin (KMO) test and Bartlett’s test of sphericity for the SR dataset.
Table 3 presents the total variance explained by seven Principal Components. Following standard practice, we retained only those PCs with eigenvalues equal to or greater than 1, as illustrated in the scree plot (Figure 4). The relative contributions of variables to each Principal Component are quantified as loading scores. Eigenvalues mathematically represent the sum of squared distances from the origin to projected points, while their square roots yield the corresponding singular values for each PC. Table 5 displays the loading scores for the first three Principal Components retained in our analysis.

Figure 4. The scree plot illustrating the relationship between eigenvalues and principal components, alongside the proportion of variance (%) explained by each principal component.
The scree plot illustrating the relationship between eigenvalues and principal components, alongside the proportion of variance (%) explained by each principal component. The first principal component retains maximum variance, with variance progressively decreasing through subsequent components. Notably, the initial three principal components encapsulate most of the dataset variance, with minimal variance changes observed beyond these components, as demonstrated in Figure 4.
This investigation utilized the first three principal components, selected according to the Kaiser Criterion (eigenvalues > 1), which collectively retain the majority of variance (exceeding 86%) in the dataset. These selected components were subsequently utilized as inputs for Support Vector Regression (SVR) in solar radiation prediction. Specifically, the first principal component accounted for 46.54% of the variance, while the second and third components represented 24.04% and 15.89% respectively, as detailed in Table 3. The contributions from remaining principal components were negligible by comparison.
The analysis revealed that the three primary components collectively explained over 86.48% of the total dataset variance. Table 4 presents the PCA results, showing eigenvalues, variance explained, and cumulative variance percentages for each principal component, along with extraction sums of squared loadings. The first three components demonstrate the highest eigenvalues and collectively account for most of the dataset’s variability.

Table 4. Total variance explained.
Table 5 displays the eigenvectors from the PCA, with each row showing variable loadings on the first three principal components (PC1, PC2, and PC3). These loadings indicate the correlation strength between variables and components, revealing the underlying data structure. The highlighted variables represent those with the greatest contribution to each component, informing feature selection for subsequent predictive modeling.

Table 5. Outcomes of PCA.
Building upon these principal components, we employed SVR models to predict solar radiation (SR). Various kernel functions, including linear, polynomial, hyperbolic tangent (Tanh), and Gaussian (RBF), were explored to evaluate their effectiveness in modeling complex nonlinear relationships within the transformed feature space. Each kernel was fine-tuned using appropriate hyperparameters, including the regularization parameter (C), epsilon-insensitive loss (ϵ), and kernel-specific parameters (e.g., degree (d), coefficient (c), gamma (γ)). A systematic hyperparameter tuning process ensured that each SVR configuration was optimized for predictive performance while maintaining consistent input dimensionality. The parameter settings and corresponding SVR kernel configurations that achieved the best results are summarized in Table 6.

Table 6. Summary of parameters utilized in the SVR models.
The quantitative performance metrics obtained during both the training and testing phases of the proposed model are presented in Table 7, alongside a comprehensive comparative analysis with alternative models. The recommended model demonstrated superior performance across all evaluation criteria, including RMSE, MAE, MAPE, and R2. After applying principal component analysis (PCA) to the dataset, the solar radiation prediction models were evaluated seasonally to capture the distinct climatic influences affecting model performance in Tamil Nadu. The data was partitioned into three major seasonal groups: summer (March to May), monsoon (June to September), and winter (October to February). Table 8 summarizes the training and testing performance metrics, including R2 and RMSE, for each predictive model across these seasonal intervals.

Table 7. Summary of results of the predictive models with PCA.
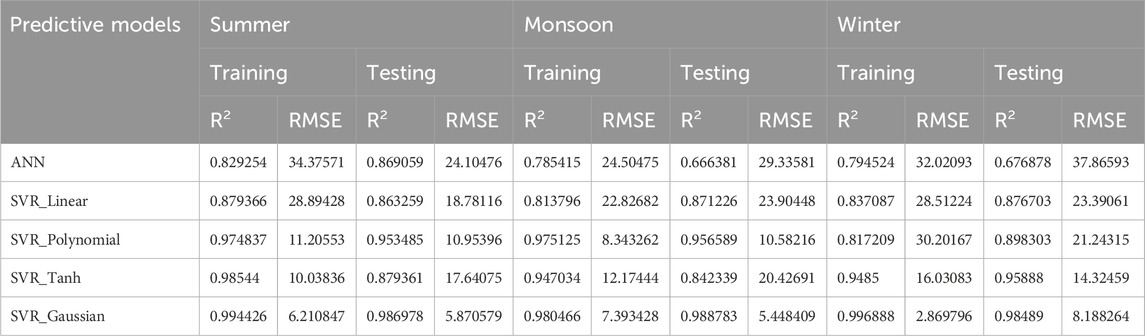
Table 8. Summary of results of the predictive models with PCA.
The results demonstrate pronounced seasonal variability in prediction accuracy. During the summer months, while all models showed reasonable performance, the SVR_Gaussian kernel consistently achieved the highest R2 and lowest RMSE, indicating superior fit and error reduction compared to other approaches. The monsoon period, characterized by increased variability in solar radiation, saw a similar trend, with SVR_Gaussian and SVR_Polynomial models producing robust results. In the winter season, where atmospheric conditions fluctuate less dramatically, SVR_Gaussian once again yielded the highest accuracy in both training and testing, reflecting its strong generalization capabilities. Overall, these findings highlight the importance of season-wise model evaluation and the effectiveness of non-linear SVR kernels in capturing complex patterns after dimensionality reduction by PCA.
To assess the impact of dimensionality reduction, the predictive models were also evaluated using the original dataset without PCA, as detailed in Table 9. While the SVR_Gaussian model continued to outperform other approaches, the overall efficiency and accuracy of all models were notably lower compared to those observed with PCA-based analysis. Specifically, error metrics such as RMSE and MAE were higher, and R2 values decreased across both training and testing phases, indicating reduced predictive performance. These findings clearly demonstrate that applying PCA enhances model efficiency by improving accuracy and minimizing error, underscoring the importance of dimensionality reduction in optimizing predictive modeling outcomes.

Table 9. Summary of results of the predictive models without PCA.
Figure 5 provides a graphical representation illustrating the correlation between experimental measurements and predicted values of solar radiation for the various models under consideration: ANN, SVR_Linear, SVR_Polynomial, SVR_Tanh, and SVR_Gaussian. Additionally, the variation of SVR model loss (MSE) as a function of the epsilon parameter is shown in Figure 6, demonstrating the sensitivity of model performance to epsilon, highlighting how fine-tuning epsilon directly influences model accuracy and error reduction during training. This comprehensive visualization underscores the importance of epsilon selection in SVR optimization. The comparative performance of the proposed predictive models, based on MAPE and R2, is depicted in Figure 7.

Figure 5. Regression analysis of observed vs. Predicted solar irradiation using ANN and SVR Kernels. (a) ANN (b) SVR_Linear (c) SVR_Polynomial (d) SVR_Tanh (e) SVR_Gaussian.

Figure 6. Effect of epsilon parameter on SVR model loss (MSE).

Figure 7. Comparative analysis of MAPE and R2 for the proposed predictive models.
An in-depth analysis of the results presented in the Table 10 reveals pronounced differences in Support Vector Regression (SVR) performance as influenced by the choice of kernel function and the number of k-folds used during cross-validation. The Gaussian kernel consistently demonstrates superior predictive accuracy, as evidenced by its notably lower RMSE and MAE values, combined with higher R2 coefficients across all k-fold settings. Particularly, with 50-fold cross-validation, the Gaussian kernel achieves its optimal performance, reaching an RMSE of 8.3507, an MAE of 4.8422, and an R2 of 0.9853, indicating its strong capability to capture underlying data patterns with minimal error. The polynomial kernel also shows robust results, especially at lower k values, though it does not surpass the Gaussian kernel at higher k values. In contrast, the tanh kernel produces moderate outcomes, with gradual improvements observed as the k value increases, but it remains consistently less effective than the polynomial and Gaussian kernels. The linear kernel exhibits the weakest performance, resulting in the highest error metrics and the lowest R2 values, highlighting its limitations in modeling the nonlinearities present in the dataset. Overall, these results demonstrate the critical importance of kernel selection and cross-validation strategy, with the Gaussian kernel emerging as the most effective choice for ensuring both model accuracy and generalizability in this context.

Table 10. Performance of SVR with various kernel functions and K-folds.
Conclusion
Accurately forecasting solar radiance levels is critical for harnessing the manifold benefits of solar energy, from driving renewable energy advancement and sustainable growth to mitigating climate change. However, prediction poses complex challenges due to the nonlinear mapping between inputs and solar power output. This study proposes a novel approach combining PCA for dimension reduction and SVR for predicting solar radiation.
Our methodology effectively addresses the complexity of solar radiation forecasting by employing Principal Component Analysis (PCA) to reduce the original seven meteorological parameters to three principal components, preserving 86.484% of the explained variance. This dimensionality reduction mitigates noise and multicollinearity, enhancing model efficiency. The refined feature set was then utilized to develop five predictive models, including Support Vector Regression (SVR) with different kernel functions (Gaussian, Tanh, Polynomial, and Linear) and an Artificial Neural Network (ANN) for comparative analysis.
Among the models, the Gaussian kernel-based SVR (SVR_Gaussian) demonstrated superior predictive performance, significantly outperforming the ANN and other SVR variants. This superiority was validated through key statistical metrics: RMSE (9.111125), MAE (3.765607), MAPE (0.013853), and R2 (98.37%). The strength of the SVR_Gaussian model lies in its ability to effectively capture nonlinear relationships within complex datasets, positioning it as a robust approach for solar radiation estimation. The results further confirm that, regardless of the number of k-folds used in cross-validation, the Gaussian kernel consistently delivers the most accurate and generalizable predictions, underscoring its effectiveness for solar radiation forecasting tasks.
These findings highlight the potential of advanced machine learning techniques in addressing environmental prediction challenges. The proposed model, with its robust predictive capability, can be practically implemented for real-time solar photovoltaic (PV) power forecasting and smart grid management, thereby supporting improved grid reliability and energy resource allocation. Additionally, real-world applications such as dynamic load balancing, energy trading, and demand response programs can greatly benefit from accurate solar radiation predictions. Future research should explore hybrid models that integrate multiple machine learning methodologies to mitigate overfitting and further enhance predictive accuracy. Such advancements would contribute to more reliable solar radiation forecasting, benefiting grid operators and energy planners by improving grid stability and facilitating seamless renewable energy integration into power systems. To further enhance the portability and applicability of the proposed model to other climates or geographic locations, retraining with local data may be necessary. We will incorporate a comprehensive assessment of generalization and retraining needs across diverse regions in future work. These accurate solar radiation forecasts can be directly integrated into PV system control, microgrid management, and energy dispatch workflows, providing actionable insights that enable operators to optimize real-time energy generation, storage, and distribution.
Data availability statement
The raw data supporting the conclusions of this article will be made available by the authors, without undue reservation.
Author contributions
SSB: Validation, Writing – original draft, Methodology, Project administration, Conceptualization, Visualization, Investigation, Software, Writing – review and editing, Formal Analysis, Resources, Data curation. AN: Writing – review and editing, Validation, Investigation, Supervision. TN: Visualization, Software, Writing – original draft.
Funding
The authors declare that no financial support was received for the research and/or publication of this article.
Acknowledgements
We conducted this project under Vellore Institute of Technology’s (VIT) green campus initiatives. The authors deeply appreciate the leadership, motivation and support of VIT’s Honorable Vice Presidents. We also thank Vijesh V. Joshi for supplying meteorological data. Additionally, the first author acknowledges the fellowship from VIT administration that enabled conducting this research. We would like to thank Nida Fariz T K for helping in data analysis and paper writing.
Conflict of interest
The authors declare that the research was conducted in the absence of any commercial or financial relationships that could be construed as a potential conflict of interest.
Generative AI statement
The authors declare that no Generative AI was used in the creation of this manuscript.
Any alternative text (alt text) provided alongside figures in this article has been generated by Frontiers with the support of artificial intelligence and reasonable efforts have been made to ensure accuracy, including review by the authors wherever possible. If you identify any issues, please contact us.
Publisher’s note
All claims expressed in this article are solely those of the authors and do not necessarily represent those of their affiliated organizations, or those of the publisher, the editors and the reviewers. Any product that may be evaluated in this article, or claim that may be made by its manufacturer, is not guaranteed or endorsed by the publisher.
References
Abdelhafidi, N., Bachari, N. E. I., and Abdelhafidi, Z. (2021). Estimation of solar radiation using stepwise multiple linear regression with principal component analysis in Algeria. Meteorol. Atmos. Phys. 133, 205–216. doi:10.1007/s00703-020-00739-0
Adam, K. B., Silalahi, D. K., Aprillia, B. S., and Adhari, H. A. (2022). Support vector regression method for predicting off-grid photovoltaic output power in the short term. J. RESTI Rekayasa Sist. Dan Teknol. Inf. 6, 548–554. doi:10.29207/resti.v6i4.4134
Adil, M., Ullah, R., Noor, S., and Gohar, N. (2022). Effect of number of neurons and layers in an artificial neural network for generalized concrete mix design. Neural Comput. and Applic 34, 8355–8363. doi:10.1007/s00521-020-05305-8
Agatonovic-Kustrin, S., and Beresford, R. (2000). Basic concepts of artificial neural network (ANN) modeling and its application in pharmaceutical research. J. Pharmaceutical Biomedical Analysis 22, 717–727. doi:10.1016/s0731-7085(99)00272-1
Alam, S., Kang, M., Pyun, J.-Y., and Kwon, G.-R. (2016). “Performance of classification based on PCA, linear SVM, and Multi-kernel SVM,” in 2016 eighth international conference on ubiquitous and future networks (ICUFN) (IEEE), 987–989. Available online at: https://ieeexplore.ieee.org/abstract/document/7536945/ (Accessed October 29, 2025).
Alrashidi, M., Alrashidi, M., and Rahman, S. (2021). Global solar radiation prediction: application of novel hybrid data-driven model. Appl. Soft Comput. 112, 107768. doi:10.1016/j.asoc.2021.107768
Amith, M. G., Joshi, V. V., and Siddegowda, K. B. (2022). Thermal performance of two enclosed rooms with different phase change materials under different weather conditions. Mater. Today Proc. 51, 1489–1502. doi:10.1016/j.matpr.2021.10.277
Assaf, A. M., Haron, H., Abdull Hamed, H. N., Ghaleb, F. A., Dalam, M. E., and Elfadil Eisa, T. A. (2023). Improving solar radiation forecasting utilizing data augmentation model generative adversarial networks with convolutional support vector machine (GAN-CSVR). Appl. Sci. 13, 12768. doi:10.3390/app132312768
Atheeque, A. M., and Basha, S. S. (2024). Enhancing expert decision-making for wastewater treatment plants with seidel laplacian energy and cosine similarity measure in intuitionistic fuzzy graphs. Int. J. Comput. Intell. Syst. 17, 269. doi:10.1007/s44196-024-00672-9
Atheeque, A. M., Basha, S. S., Pratyusha, N., Reddy, C. R., Alam, M. N., Ahmad, H., et al. (2024). The application of cosine similarity measures with Laplacian energy to q-rung orthopair fuzzy graphs in decision-making problems. AIP Adv. 14, 055132. doi:10.1063/5.0202907
Ayesha, S., Hanif, M. K., and Talib, R. (2020). Overview and comparative study of dimensionality reduction techniques for high dimensional data. Inf. Fusion 59, 44–58. doi:10.1016/j.inffus.2020.01.005
Baghanam, A. H., Nourani, V., Bejani, M., Pourali, H., Kantoush, S. A., and Zhang, Y. (2024). A systematic review of predictor screening methods for downscaling of numerical climate models. Earth-Science Rev. 253, 104773. doi:10.1016/j.earscirev.2024.104773
Basha, S. S., and Rao, A. N. (2025). Optimizing solar radiation prediction: a novel SVM approach for renewable energy systems. Int. J. Inf. Tecnol. doi:10.1007/s41870-025-02469-1
Bashir, M., Khuroo, N. S., Dar, Z. A., Wani, A., Rashid, Z., and Shikar, A. B. (2024). Multivariate analysis of fodder maize (zea mays L.) germplasm lines under temperate niches. Indian J. Plant Genet. Resour. 37, 473–481.
Cerny, B. A., and Kaiser, H. F. (1977). A study of A measure of sampling adequacy for factor-analytic correlation matrices. Multivar. Behav. Res. 12, 43–47. doi:10.1207/s15327906mbr1201_3
Che, J. (2013). Support vector regression based on optimal training subset and adaptive particle swarm optimization algorithm. Appl. Soft Comput. 13, 3473–3481. doi:10.1016/j.asoc.2013.04.003
Chen, J.-L., Li, G.-S., and Wu, S.-J. (2013). Assessing the potential of support vector machine for estimating daily solar radiation using sunshine duration. Energy Conversion Management 75, 311–318. doi:10.1016/j.enconman.2013.06.034
Couto, A., and Estanqueiro, A. (2022). Enhancing wind power forecast accuracy using the weather research and forecasting numerical model-based features and artificial neuronal networks. Renew. Energy 201, 1076–1085. doi:10.1016/j.renene.2022.11.022
Dahmani, A., Ammi, Y., and Hanini, S. (2023). A novel non-linear model based on bootstrapped aggregated support vector machine for the prediction of hourly global solar radiation. Smart Grids Sustain. Energy 9, 3. doi:10.1007/s40866-023-00179-w
Davò, F., Alessandrini, S., Sperati, S., Delle Monache, L., Airoldi, D., and Vespucci, M. T. (2016). Post-processing techniques and principal component analysis for regional wind power and solar irradiance forecasting. Sol. Energy 134, 327–338. doi:10.1016/j.solener.2016.04.049
Djeldjeli, Y., Taouaf, L., Alqahtani, S., Mokaddem, A., Alshammari, B. M., Menni, Y., et al. (2024). Enhancing solar power forecasting with machine learning using principal component analysis and diverse statistical indicators. Case Stud. Therm. Eng. 61, 104924. doi:10.1016/j.csite.2024.104924
Drucker, H., Burges, C. J., Kaufman, L., Smola, A., and Vapnik, V. (1996). Support vector regression machines. Adv. Neural Information Processing Systems 9. Available online at: https://proceedings.neurips.cc/paper/1996/hash/d38901788c533e8286cb6400b40b386d-Abstract.html (Accessed March 12, 2025).
Eskandari-Naddaf, H., and Kazemi, R. (2017). ANN prediction of cement mortar compressive strength, influence of cement strength class. Constr. Build. Mater. 138, 1–11. doi:10.1016/j.conbuildmat.2017.01.132
Fariz, T. N., and Basha, S. S. (2024). Enhancing solar radiation predictions through COA optimized neural networks and PCA dimensionality reduction. Energy Rep. 12, 341–359. doi:10.1016/j.egyr.2024.06.025
Fariz, T. N., and Basha, S. S. (2025). Enhanced crop yield prediction using a hybrid artificial neural network with coati optimization algorithm. Results Eng. 28, 107529. doi:10.1016/j.rineng.2025.107529
Fushiki, T. (2011). Estimation of prediction error by using K-fold cross-validation. Stat. Comput. 21, 137–146. doi:10.1007/s11222-009-9153-8
Garzón-Roca, J., Marco, C. O., and Adam, J. M. (2013). Compressive strength of masonry made of clay bricks and cement mortar: estimation based on neural networks and fuzzy logic. Eng. Struct. 48, 21–27. doi:10.1016/j.engstruct.2012.09.029
Ge, Z., Song, Z., Ding, S. X., and Huang, B. (2017). Data mining and analytics in the process industry: the role of machine learning. Ieee Access 5, 20590–20616. doi:10.1109/access.2017.2756872
George, A., and Vidyapeetham, A. (2012). Anomaly detection based on machine learning: dimensionality reduction using PCA and classification using SVM. Int. J. Comput. Appl. 47, 5–8. doi:10.5120/7470-0475
Gewers, F. L., Ferreira, G. R., Arruda, H. F. D., Silva, F. N., Comin, C. H., Amancio, D. R., et al. (2022). Principal component analysis: a natural approach to data exploration. ACM Comput. Surv. 54, 1–34. doi:10.1145/3447755
Gholami, V., and Sahour, H. (2022). Prediction of groundwater drawdown using artificial neural networks. Environ. Sci. Pollut. Res. 29, 33544–33557. doi:10.1007/s11356-021-18115-9
Gnanadesikan, R. (2011). Methods for statistical data analysis of multivariate observations. John Wiley and Sons. Available online at: https://books.google.com/books?hl=en&lr=&id=2h4oWPpMm2kC&oi=fnd&pg=PR7&dq=Methods+for+Statistical+Data+Analysis+of+Multivariate+Observations.&ots=zh6S42lgnE&sig=gtG2hrPoE2eD65HZOToMYAZmhE4 (Accessed March 3, 2025).
Gumus, E., Kilic, N., Sertbas, A., and Ucan, O. N. (2010). Evaluation of face recognition techniques using PCA, wavelets and SVM. Expert Syst. Appl. 37, 6404–6408. doi:10.1016/j.eswa.2010.02.079
Hair, J. F. (2009). Multivariate data analysis. Available online at: https://digitalcommons.kennesaw.edu/facpubs/2925/ (Accessed April 22, 2024).
Hornik, K., Stinchcombe, M., and White, H. (1989). Multilayer feedforward networks are universal approximators. Neural Networks, 2(5), 359–366.
Jiang, Y. (2009). Computation of monthly mean daily global solar radiation in China using artificial neural networks and comparison with other empirical models. Energy 34, 1276–1283. doi:10.1016/j.energy.2009.05.009
Jolliffe, I. T., and Cadima, J. (2016). Principal component analysis: a review and recent developments. Phil. Trans. R. Soc. A. 374, 20150202. doi:10.1098/rsta.2015.0202
Joshi, V. V. (2018). Thermal performance of various roof elements under different weather conditions. Available online at: http://etd.iisc.ac.in/handle/2005/3531 (Accessed August 28, 2024).
Kabir, E., Kumar, P., Kumar, S., Adelodun, A. A., and Kim, K.-H. (2018). Solar energy: potential and future prospects. Renew. Sustain. Energy Rev. 82, 894–900. doi:10.1016/j.rser.2017.09.094
Kannan, N., and Vakeesan, D. (2016). Solar energy for future world:-A review. Renew. Sustainable Energy Reviews 62, 1092–1105. doi:10.1016/j.rser.2016.05.022
Kara, F., Aslantaş, K., and Cicek, A. (2016). Prediction of cutting temperature in orthogonal machining of AISI 316L using artificial neural network. Appl. Soft Comput. 38, 64–74. doi:10.1016/j.asoc.2015.09.034
Katz, M. H. (2003). Multivariable analysis: a primer for readers of medical research. Ann. Intern Med. 138, 644–650. doi:10.7326/0003-4819-138-8-200304150-00012
Keddouda, A., Ihaddadene, R., Boukhari, A., Atia, A., Arıcı, M., Lebbihiat, N., et al. (2023). Solar photovoltaic power prediction using artificial neural network and multiple regression considering ambient and operating conditions. Energy Convers. Manag. 288, 117186. doi:10.1016/j.enconman.2023.117186
Kiesecker, J., Baruch-Mordo, S., Heiner, M., Negandhi, D., Oakleaf, J., Kennedy, C., et al. (2019). Renewable energy and land use in India: a vision to facilitate sustainable development. Sustainability 12, 281. doi:10.3390/su12010281
Krishnan, N., Kumar, K. R., and Inda, C. S. (2023). How solar radiation forecasting impacts the utilization of solar energy: a critical review. J. Clean. Prod. 388, 135860. doi:10.1016/j.jclepro.2023.135860
Kumar, D. (2020). Satellite-based solar energy potential analysis for southern states of India. Energy Rep. 6, 1487–1500. doi:10.1016/j.egyr.2020.05.028
Latinne, P., Debeir, O., and Decaestecker, C. (2001). “Limiting the number of trees in random forests,” in Multiple classifier systems. Editors J. Kittler, and F. Roli (Berlin, Heidelberg: Springer Berlin Heidelberg), 178–187. doi:10.1007/3-540-48219-9_18
Li, L., Cheng, S., and Wen, Z. (2021). Landslide prediction based on improved principal component analysis and mixed kernel function least squares support vector regression model. J. Mt. Sci. 18, 2130–2142. doi:10.1007/s11629-020-6396-5
Mahesh, P. V., Meyyappan, S., and Alla, R. (2023). Support vector regression machine learning based maximum power point tracking for solar photovoltaic systems. Int. Journal Electrical Computer Engineering Systems 14, 100–108. doi:10.32985/ijeces.14.1.11
Mohanty, P., Subhadarshini, K., Nayak, R., Pati, U. C., and Mahapatra, K. (2025). “Exploring data-driven multivariate statistical models for the prediction of solar energy,” in Computer vision and machine intelligence for renewable energy systems (Elsevier), 85–101. Available online at: https://www.sciencedirect.com/science/article/pii/B9780443289477000057 (Accessed March 20, 2025).
Nadeem, T. B., Ali, S. U., Asif, M., and Suberi, H. K. (2024). Forecasting daily solar radiation: an evaluation and comparison of machine learning algorithms. AIP Adv. 14, 075010. doi:10.1063/5.0211723
Önal, Y. (2022). Gaussian kernel based SVR model for short-term photovoltaic MPP power prediction. Comput. Syst. Sci. Eng. 41, 141–156. doi:10.32604/csse.2022.020367
Parveen, N., Zaidi, S., and Danish, M. (2017). Development of SVR-Based model and comparative analysis with MLR and ANN models for predicting the sorption capacity of Cr (VI). Process Saf. Environ. Prot. 107, 428–437. doi:10.1016/j.psep.2017.03.007
Paudel, S., Elmitri, M., Couturier, S., Nguyen, P. H., Kamphuis, R., Lacarrière, B., et al. (2017). A relevant data selection method for energy consumption prediction of low energy building based on support vector machine. Energy Build. 138, 240–256. doi:10.1016/j.enbuild.2016.11.009
Paulescu, M., Paulescu, E., Gravila, P., and Badescu, V. (2013). “Solar radiation measurements,” in Weather modeling and forecasting of PV systems operation. Editors M. Paulescu, E. Paulescu, P. Gravila, and V. Badescu (London: Springer), 17–42. doi:10.1007/978-1-4471-4649-0_2
Ramedani, Z., Omid, M., Keyhani, A., Shamshirband, S., and Khoshnevisan, B. (2014). Potential of radial basis function based support vector regression for global solar radiation prediction. Renew. Sustain. Energy Rev. 39, 1005–1011. doi:10.1016/j.rser.2014.07.108
Ray, P., Reddy, S. S., and Banerjee, T. (2021). Various dimension reduction techniques for high dimensional data analysis: a review. Artif. Intell. Rev. 54, 3473–3515. doi:10.1007/s10462-020-09928-0
Ruiz-Aguilar, J. J., Turias, I., González-Enrique, J., Urda, D., and Elizondo, D. (2021). A permutation entropy-based EMD–ANN forecasting ensemble approach for wind speed prediction. Neural Comput. Appl. 33, 2369–2391. doi:10.1007/s00521-020-05141-w
Scholkopf, B., and Smola, A. J. (2018). Learning with kernels: support vector machines, regularization, optimization, and beyond. MIT press. Available online at: https://books.google.com/books?hl=en&lr=&id=7r34DwAAQBAJ&oi=fnd&pg=PR13&dq=Scholkopf+B,+Smola+AJ.+Learning+with+kernels&ots=pxP_w9iITY&sig=Gy2XXzXHaJP3JUssMa-zyBgoOm4 (Accessed March 15, 2025).
Seidlitz, H. K., Thiel, S., Krins, A., and Mayer, H. (2001). Solar radiation at the Earth’s surface. Compr. Series Photosciences 3, 705–738.
Sen, S., and Ganguly, S. (2017). Opportunities, barriers and issues with renewable energy development–A discussion. Renew. Sustainable Energy Reviews 69, 1170–1181. doi:10.1016/j.rser.2016.09.137
Shadab, A., Ahmad, S., and Said, S. (2020). Spatial forecasting of solar radiation using ARIMA model. Remote Sens. Appl. Soc. Environ. 20, 100427. doi:10.1016/j.rsase.2020.100427
Shahcheraghian, A., Madani, H., and Ilinca, A. (2024). From white to black-box models: a review of simulation tools for building energy management and their application in consulting practices. Energies 17, 376. doi:10.3390/en17020376
Shawe-Taylor, J., and Cristianini, N. (2004). Kernel methods for pattern analysis. Cambridge, United Kingdom: Cambridge University Press. Available online at: https://books.google.com/books?hl=en&lr=&id=MX0hAwAAQBAJ&oi=fnd&pg=PR8&dq=Shawe-Taylor+J,+Cristianini+N.+Kernel+methods+for+pattern+analysis&ots=EIynfHwrIJ&sig=ioTmXS9hYM0JopJPj1aSotDhqyk (Accessed March 15, 2025).
Shimpi, A. V., Chandrasekar, A., and Keshava, A. (2022). “Support vector regression based forecasting of solar irradiance,” in 2022 2nd Asian conference on innovation in technology (ASIANCON) (IEEE), 1–5. Available online at: https://ieeexplore.ieee.org/abstract/document/9908853/ (Accessed February 8, 2025).
Smedley, A. R., Evatt, G. W., Mallinson, A., and Harvey, E. (2020). Solar radiative transfer in antarctic blue ice: spectral considerations, subsurface enhancement, inclusions, and meteorites. Cryosphere 14, 789–809. doi:10.5194/tc-14-789-2020
Tawn, R., and Browell, J. (2022). A review of very short-term wind and solar power forecasting. Renew. Sustain. Energy Rev. 153, 111758. doi:10.1016/j.rser.2021.111758
Thangavelu, M., Parthiban, V. J., Kesavaraman, D., and Murugesan, T. (2023). Forecasting of solar radiation for a cleaner environment using robust machine learning techniques. Environ. Sci. Pollut. Res. 30, 30919–30932. doi:10.1007/s11356-022-24321-w
Vapnik, V. (2013). The nature of statistical learning theory. Springer science and business media. Available online at: https://books.google.com/books?hl=en&lr=&id=EqgACAAAQBAJ&oi=fnd&pg=PR7&dq=The+nature+of+statistical+learning+theory.+Berlin:+Springer-Verlag&ots=g5G6gz6U34&sig=_1ING35q1CJGCdR1PvbV68Mk7kM (Accessed February 10, 2025).
Vapnik, V., and Vapnik, V. (1995). Support-vector networks. Mach. Learning 20, 273–297. doi:10.1007/bf00994018
Verma, S. K., and Joshi, V. V. (2021). Thermal environment inside single shade-net, double shade-net, and polythene sheet houses and effect on wheat seedling growth. J. Agrometeorology 23, 344–347. doi:10.54386/jam.v23i3.42
Yu, X. (2023). Evaluating parallelized support vector regression and nearest neighbor regression with different input variations for estimating daily global solar radiation of the humid subtropical region in China. Int. J. Low-Carbon Technol. 18, 95–110. doi:10.1093/ijlct/ctad005
Zhang, C., Bengio, S., Hardt, M., Recht, B., and Vinyals, O. (2021). Understanding deep learning (still) requires rethinking generalization. Commun. ACM 64, 107–115. doi:10.1145/3446776
Zhang, L., Hu, J., Meng, X., and Jin, P. (2022). An efficient optimization method for periodic lattice cellular structure design based on the K-fold SVR model. Eng. Comput. 38, 1095–1109. doi:10.1007/s00366-021-01300-2
Zhao, M., Zhang, Y., Hu, T., and Wang, P. (2022). Interval prediction method for solar radiation based on kernel density estimation and machine learning. Complexity 2022, 7495651. doi:10.1155/2022/7495651
Zhou, W., Yan, Z., and Zhang, L. (2024). A comparative study of 11 non-linear regression models highlighting autoencoder, DBN, and SVR, enhanced by SHAP importance analysis in soybean branching prediction. Sci. Rep. 14, 5905. doi:10.1038/s41598-024-55243-x
Keywords: support vector regression (SVR), artificial neural network (ANN), solar radiation forecasting (SRF), principal component analysis (PCA), predictive modeling
Citation: Sharief Basha S, Nagaraja Rao A and Nida Fariz TK (2025) Dimensionality reduction in solar radiation forecasting: a combined PCA-SVM framework for renewable energy applications. Front. Environ. Sci. 13:1692076. doi: 10.3389/fenvs.2025.1692076
Received: 25 August 2025; Accepted: 26 November 2025;
Published: 18 December 2025.
Edited by:
Esther Rivas Ramos, Medioambientales y Tecnológicas, SpainReviewed by:
Hari Kumar Suberi, Trier University of Applied Sciences, GermanyBurhan U. Din Abdullah, Sharda University, India
Copyright © 2025 Sharief Basha, Nagaraja Rao and Nida Fariz. This is an open-access article distributed under the terms of the Creative Commons Attribution License (CC BY). The use, distribution or reproduction in other forums is permitted, provided the original author(s) and the copyright owner(s) are credited and that the original publication in this journal is cited, in accordance with accepted academic practice. No use, distribution or reproduction is permitted which does not comply with these terms.
*Correspondence: A. Nagaraja Rao, bmFnYXJhamFyYW9hQHZpdC5hYy5pbg==