 Huashuang Li1
 Yingnan Zhao
- 1Sichuan Branch of China Huadian Corporation Ltd., Chengdu, China
- 2Sichuan Yanyuan Huadian New Energy Corporation Ltd., Liangshan, China
- 3Chengdu Institute of Biology, Chinese Academy of Sciences, Chengdu, China
- 4University of Chinese Academy of Sciences, Beijing, China
Utility-scale solar photovoltaic (PV) are expanding across the Qinghai–Tibet Plateau, yet their ecological consequences for alpine grasslands remain poorly quantified. We integrated the Remote-Sensing Ecological Index (RSEI) with a Long Short-Term Memory (LSTM) network to examine spatiotemporal responses of alpine grasslands to a 1.2 GW PV plant constructed in 2016. The results indicated that relative to the pre-construction period (1990–2015), the mean RSEI within PV system increased significantly by 33.4% (p < 0.01) in the post-construction period (2016–2024), and the proportion of pixels exhibiting positive RSEI anomalies rose from 44.1% to 77.6%. Ecological improvements propagated beyond the panel arrays, producing statistically significant effects (p < 0.05) within 120 m and detectable influences up to 720 m. Elevation and slope modulated the magnitude of these spill-over effects. Our findings demonstrate that PV system can enhance grassland quality in this alpine region and provide a transferable framework for evaluating renewable-energy impacts in fragile ecosystems.
1 Introduction
Rapid decarbonisation has elevated solar photovoltaic (PV) to the forefront of renewable-energy strategies (Olabi and Abdelkareem, 2022), yet the ecological consequences of utility-scale PV expansion—particularly in climatically sensitive alpine grasslands—remain poorly quantified. Global PV capacity surged from 402.5 GW in 2017 to 1,185 GW in 2022 (Wang et al., 2024), with China contributing 44% of new additions (Guo et al., 2019; Liu and Huo, 2024).
Utility-scale PV installations are now the dominant modality for large-scale solar-energy deployment (Yu et al., 2023). Once deployed, these engineered systems fundamentally reconfigure land-surface properties and trigger a cascade of environmental effects (Guerin, 2017). Specifically, land-use conversion, altered albedo, and modified surface-energy partitioning combine with micro-climatic feedbacks—driven by panel shading and runoff harvesting—to influence soil moisture, plant–soil interactions, and ecosystem water-use efficiency. Collectively, these changes reverberate through multiple ecosystem-service pathways and have attracted sustained scholarly scrutiny (Pu et al., 2021; Tawalbeh et al., 2021). During construction, the removal and compaction of native soils degrade vegetation cover and elevate erosion risk (Luo et al., 2023). Mechanical compaction, foot traffic, and grading further alter soil physical structure and hydrology (Iyer and Scott, 2001). Once operational, panel shading generates sharp micro-environmental gradients: soil beneath arrays is cooler and moister than adjacent sunlit areas (Yue et al., 2021). Notably, vegetation responses to these gradients remain equivocal. Some studies report that increased surface roughness and reduced wind speed beneath panels lower evapotranspiration and foster plant growth (Luo et al., 2023; Chen et al., 2025). Conversely, others observe light limitation and lower canopy temperatures that suppress photosynthetic efficiency, increase habitat heterogeneity, and ultimately reduce plant diversity and shift community composition (Wu et al., 2025).
The ecological disturbance effects associated with PV systems have attracted sustained scholarly attention (Pu et al., 2021; Tawalbeh et al., 2021). Field studies consistently document construction-phase impacts: vegetation removal, soil compaction and accelerated erosion (Liu et al., 2023). Moreover, construction activities such as mechanical compaction, human trampling, and land leveling further alter the physical properties of the original soil matrix (Iyer and Scott, 2001). Post-construction, the shading effects of PV panels create significant disparities in soil temperature and moisture between areas beneath the panels and adjacent external zones, which further reshape community composition (Yue et al., 2021). Such discrepancies reflect methodological constraints: plot-level measurements are spatially limited and temporally discontinuous, hindering regional generalization (Zheng et al., 2023).
Remote-sensing approaches overcome these limitations by enabling continuous, large-scale monitoring. The Remote-Sensing Ecological Index (RSEI) integrates vegetation cover, soil moisture, land-surface temperature and dryness into a single metric, providing a robust proxy for ecosystem health that is well-suited to detect PV-induced perturbations (Boegh et al., 1999). Although the RSEI was originally developed for urban ecosystems, it has been successfully applied to various natural ecosystems in recent years, including alpine grasslands (Du et al., 2025) and forests (Wang et al., 2022). Coupling RSEI with deep-learning temporal models—specifically Long Short-Term Memory (LSTM) model—further allows disentanglement of PV effects from background climate variability.
The northwestern Sichuan region of China, located on the eastern Qinghai-Tibet Plateau, boasts abundant solar energy resources, with a theoretical PV power generation potential exceeding 85,000 MW (Hu et al., 2016). Since the 2010s, the large-scale construction of centralized PVs in this area has created a significant contradiction with the vulnerability of alpine grasslands. Existing studies have shown that the harsh environment in alpine areas often results in extremely fragile local ecosystems, with limited self-regulation and recovery capabilities, and high sensitivity to external disturbances and climate change (Dong et al., 2020). Therefore, the construction of PV systems may cause disturbances to alpine ecosystems (Wang et al., 2025). Specifically, after the power stations are built, PV modules alter the original albedo of the ground surface—with the degree of this alteration varying by underlying surface type; at the same time, changes in local microclimate conditions, wind speed, and wind direction may also have significant impacts on the community structure and soil physicochemical properties of alpine steppes. However, to date, most studies on the ecological impacts of PV systems have focused on desert or Gobi landscapes (Ashraf et al., 2020), while relevant research targeting alpine ecosystems remains largely unexplored.
Here we quantify the multi-decadal ecological response to utility-scale PV in alpine grasslands using a 35-year Landsat-derived RSEI time series (1990–2024) and an LSTM counterfactual model. Our objectives are threefold: (i) to characterise spatiotemporal changes in RSEI before and after PV construction; (ii) to isolate the PV impacts on alpine grasslands from climatic variability using LSTM-driven counterfactuals; and (iii) to delineate the spatial extent of PV influence via buffer-zone analysis. The findings provide a rigorous evidence base for reconciling PV expansions with conservation of alpine grassland ecosystems in similar regions.
2 Materials and methods
2.1 Study area
This study focuses on the Meixing photovoltaic plant, situated at 102°22′36.43″E, 31°1′45.08″N in Xiaojin County, Aba Tibetan and Qiang Autonomous Prefecture, Sichuan, China. The Meixing photovoltaic plant was constructed in 2016, with an installed capacity of 50 megawatts (MW) and an annual power generation capacity of 70 million kilowatt-hours (kWh). It occupies a total area of approximately 107.15 hectares with elevation range from 3,510 m to 3,621 m. The PV modules are fixed in bracket mode and the groups of panels were 1.2 m × 2.2 m, with a tilt angle of 42 ° relative to the ground. The spacing between rows of panels was around 3 m. The grasslands both inside and outside the photovoltaic power station are alpine grasslands. Additionally, free grazing is permitted on all these grasslands, with the grazing intensity being basically consistent across them (Figure 1).
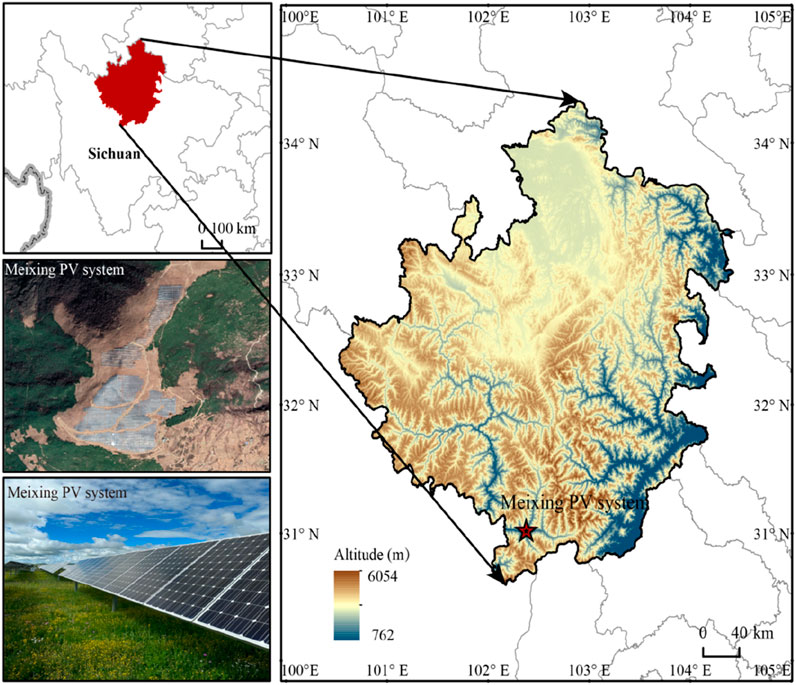
Figure 1. Location of the study area.
The region experiences a cold-temperate plateau monsoon climate, characterized by an average annual temperature of approximately 0.9 °C and annual precipitation ranging between 600 and 800 mm, primarily concentrated from May to September. The analytical domain of this study encompasses a 5 km buffer around the plant perimeter to capture potential ecological spill-over effects.
2.2 Data sources
This study utilized long-term Landsat series satellite observations (1990–2024) from the Google Earth Engine (GEE) platform, specifically including Surface Reflectance (Tier 1) products from Landsat 5 Thematic Mapper (TM), Landsat 7 Enhanced Thematic Mapper Plus (ETM+), and Landsat 8 Operational Land Imager/Thermal Infrared Sensor (OLI/TIRS). All datasets underwent radiometric calibration, atmospheric correction, and geometric precision correction. The data feature a spatial resolution of 30 m and a nominal temporal resolution of 16 days. To ensure data representativeness and accuracy, 280 cloud-minimized images acquired during the vegetation growing season (May–August) were selected for analysis. The remote sensing data employed in this study are characterized by highly stable orbital and transit times, typically concentrated between 10:00 and 11:00 a.m. local time. This ensures relatively consistent solar illumination conditions (such as solar altitude and azimuth angles) across images acquired on different dates, thereby substantially reducing variations in illumination and shadow effects caused by observational time differences (e.g., morning vs. afternoon). This consistency guarantees comparability in pixel reflectance and land surface temperature retrieval across multi-temporal datasets.
2.3 Methodological framework
The methodological framework of this study is illustrated in Figure 2, comprising four key steps.
1. RSEI Calculation: Based on the Google Earth Engine (GEE) platform, Landsat 5/7/8 imagery was integrated to extract four ecological indicators: greenness (Normalized Difference Vegetation Index, NDVI) for vegetation health, wetness (tasseled cap wetness component) and heat (Land Surface Temperature, LST) for temperature, and dryness (Normalized Difference Bare Soil Index, NDBSI). Principal Component Analysis (PCA) was applied to determine indicator weights and construct the RSEI index (Xu, 2013).
2. Trend Analysis: Theil-Sen slope estimation and Mann-Kendall significance tests were employed to conduct pixel-wise trend analyses of RSEI time series during pre-construction (1990–2015) and post-construction (2016–2024) periods. This approach revealed ecological trajectory shifts in alpine grasslands induced by PV power plant development.
3. Scenario Comparison: Historical RSEI data from 1990 to 2015 (unaffected by PV system) were used to train a Long Short-Term Memory (LSTM) network. The model simulated natural-state RSEI trajectories in 2016–2024 without PV impact. Observed RSEI values were compared against LSTM predictions to quantify the ecological changes caused by PV system.
4. Impact Boundary: The spatial influence boundary of PV system on RSEI variations was calculated to identify the maximum ecological impact extent. A multi-threshold buffer analysis was implemented to determine the influence boundary and identify the maximum spatial extent of PV system impacts on RSEI variations.
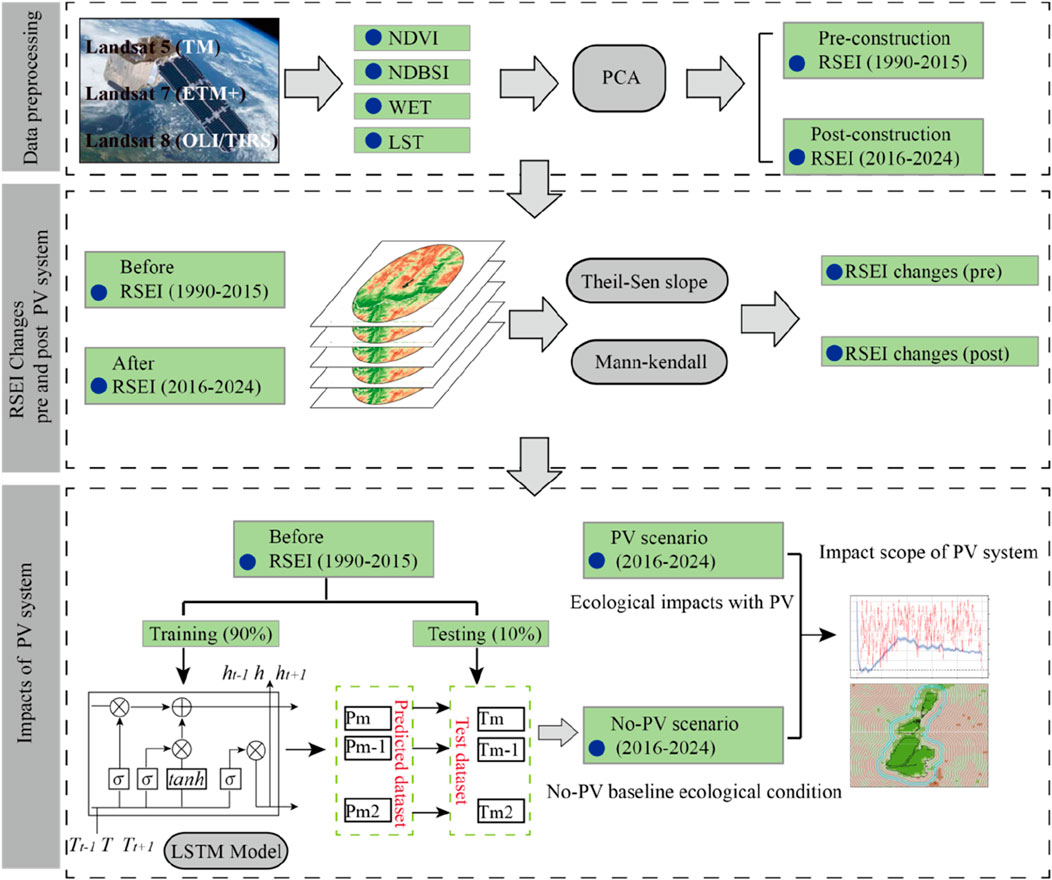
Figure 2. Methodological framework for quantifying the ecological impact of PV system.
2.3.1 Calculation of RSEI
To eliminate the influence caused by different dimensions of various indicators, this study standardized the four indices (NDVI, WET, LST, NDBSI) using the mean and variance of the overall time series data to ensure the consistency throughout the entire research period (Wen et al., 2025). Meanwhile, this study adopts the method of fixing the direction of eigenvectors to address the inconsistency between the results of principal component analysis (PCA) and the expected RSEI values (Zheng et al., 2022), which arises from the uncertainty in the direction of eigenvectors during the PCA process. In addition, to ensure that RSEI values are positive, the eigenvectors of the four components in this study follow the following rules: 1) The eigenvector directions of the greenness and wetness components should be positive; 2) The eigenvector directions of the heat and dryness components should be negative (Ning et al., 2020). The specific calculation formula for RSEI is shown in Formula 1:
where
In addition, to minimize the impact of temporal variations in image acquisition on other ecological factors, this study restricted the image acquisition window to the peak months of the vegetation growing season and their adjacent months, namely, May to August each year (Zheng et al., 2022).
The principal component analysis based on the four indicators (Table 1), showed that the first principal component (PC1) accounted for an average of 76.8% of the total variance across the 35-year period, indicating that PC1 captures the majority of the characteristics represented by the four indicators and can effectively reflect the ecological conditions of the study area. NDVI and WET showed high average correlation coefficients with positive loadings, suggesting their positive contributions to ecological quality. In contrast, NDBSI and LST exhibited negative loadings, reflecting their adverse effects on ecological quality assessment, which aligns with the actual conditions observed in the study area.
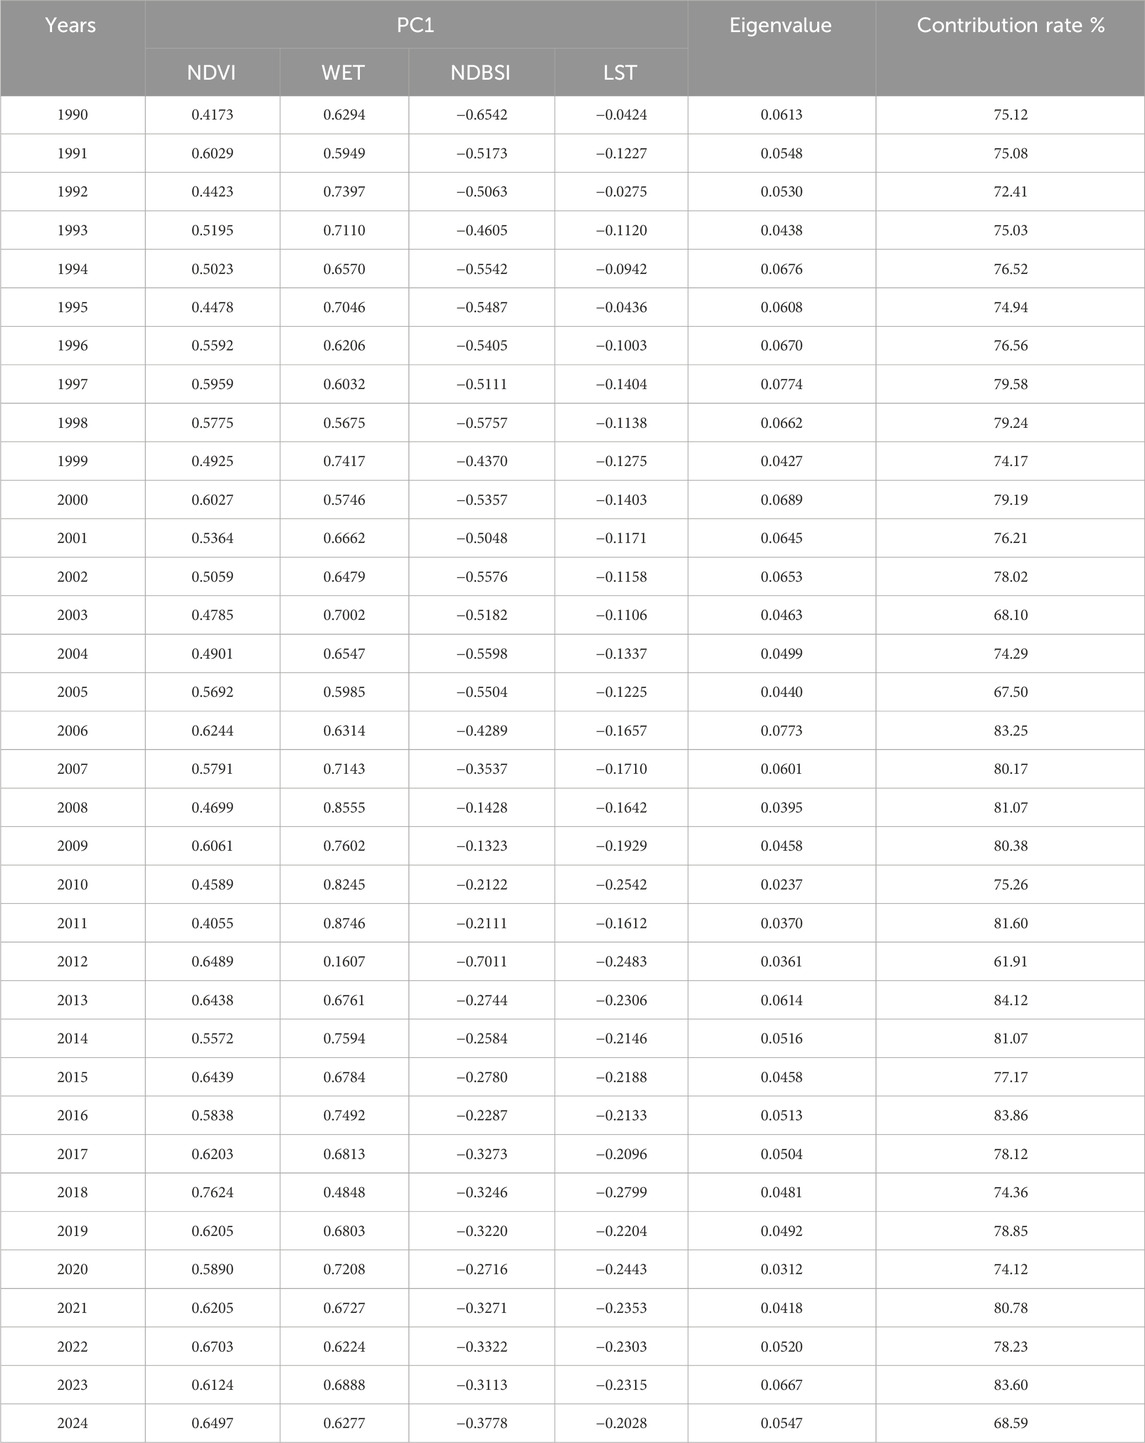
Table 1. Principal component analysis results of RSEI.
2.3.2 Theil-sen slope and Mann-Kendall analysis
The Theil-Sen slope method quantifies trend magnitude and direction by calculating the median slope of all paired data points, offering robust trend evaluation while mitigating outlier influences (Zheng et al., 2021; Zhang et al., 2022). The Mann-Kendall (MK) trend test, a non-parametric statistical test, evaluates the significance of monotonic trends in RSEI time series without assuming specific data distributions. This approach demonstrates strong robustness against outliers, with smaller p-values indicating higher probabilities of statistically significant trends (Ren et al., 2022).
This study synergistically applied Theil-Sen slope estimation and MK testing to analyze pixel-scale RSEI trends during pre-construction (1990–2015) and post-construction (2016–2024) periods. This combined methodology enables comprehensive characterization of ecological evolution patterns in alpine grasslands under PV system scenarios.
2.3.3 LSTM model
LSTM is a specialized deep learning model designed for processing long-term sequential data, capable of capturing nonlinear features in time series while avoiding the vanishing and exploding gradient problems common in traditional Recurrent Neural Networks (RNNs) (Gers et al., 2000). This study developed a two-layer LSTM model architecture. The output from the first LSTM layer serves as direct input to the second layer, enhancing the model’s capacity to model complex temporal patterns (Wang et al., 2018). The model consists of two hidden layers with 128 hidden units each. The input sequence length was set to 26 years to predict the RSEI value for the subsequent year. Model training was performed using the Adam optimizer with a learning rate of 0.001 over 50 epochs and a batch size of 16. To mitigate overfitting, the training set was randomly reshuffled each epoch, and model performance was monitored on a held-out validation set. Additionally, we implemented dropout regularization (rate = 0.2) within the LSTM architecture and employed early stopping with a patience of 5 epochs, automatically terminating training when validation performance ceased to improve to ensure optimal generalization capability.
As shown in the Table 2, the input dataset for the LSTM model aggregates 26 RSEI sequence samples extracted from actual observations during 1990–2015 in areas unaffected by photovoltaic development,, totaling 50,000 samples. These samples were divided into a 90% training set and a 10% testing set for model training and performance evaluation, respectively. The trained LSTM model was subsequently employed to simulate RSEI data for 2016–2024 under a hypothetical scenario without PV system impacts.
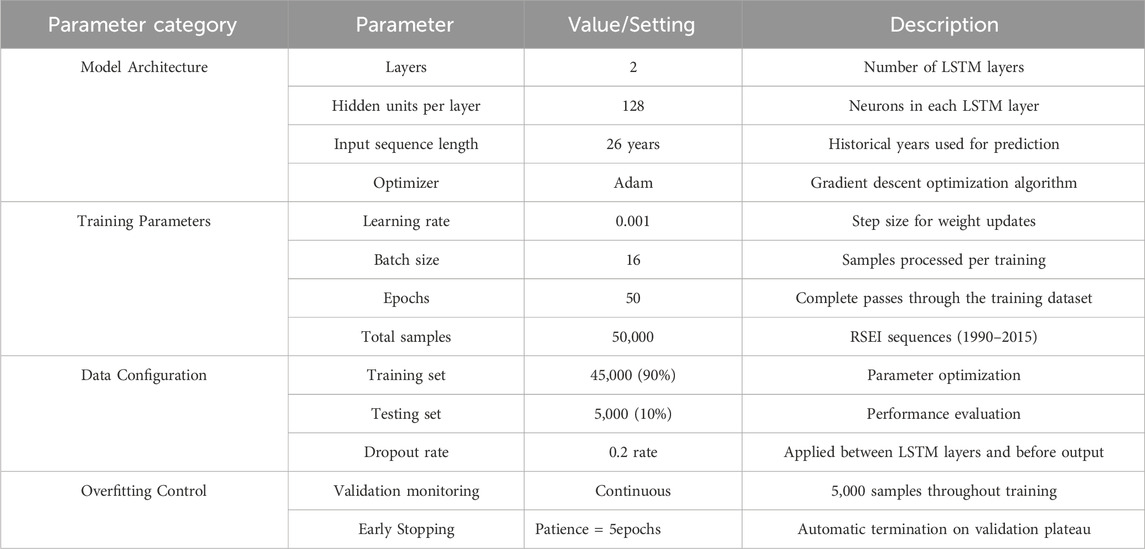
Table 2. Configuration parameters of LSTM model.
3 Results
3.1 RSEI changes before and after PV construction
Figure 3 illustrates the spatiotemporal evolution of the RSEI index across the PV system and its 5 km buffer before (1990–2015) and after (2016–2024) construction. Spatially, pre-construction, 52.4% of the study area exhibited declining trends, primarily located in high-altitude canyon regions, which are characterized by sparse grassland. Whereas 47.6% displayed increasing trends, mainly along riparian corridors. Within PV panel zones, 55.9% of areas displayed declining RSEI trends and 44.1% showed increases. However, neither trend was significant, indicating ecological stability in before construction period.
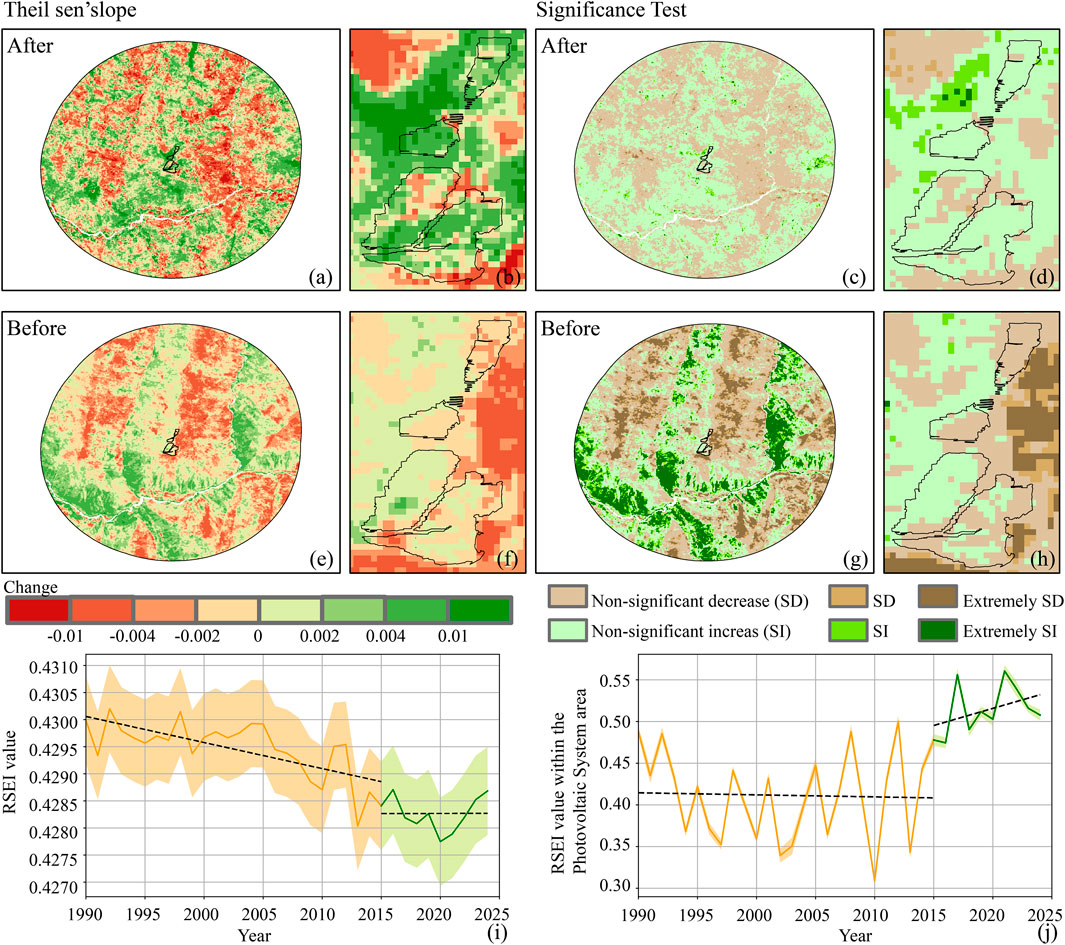
Figure 3. Spatial and temporal variations of RSEI and significance tests pre (1990–2015) and post (2016–2024) the construction of the PV system: Spatial variations (a,b,e,f); Significance tests (c,d,g,h); Temporal variations (i,j).
Post-construction, the regional balance shifted: declining RSEI pixels fell to 48.3%, while rising pixels increased to 51.7%. Notably, within the panel zones, 77.6% of pixels exhibited significant increasing trends and only 22.4% showed declines, demonstrating a marked ecological enhancement attributable to the PV system.
Temporally, the study area exhibited fluctuating declines in mean RSEI values. During the pre-construction period (1990–2015), mean RSEI declined modestly from 0.430 in 1990 to 0.428 in 2015. A parallel trend occurred in PV panel zones, where mean RSEI declined from 0.488 to 0.478. After 2016, the entire study area demonstrated modest ecological recovery, with mean RSEI rising to 0.429 by 2024. Notably, the temporal analysis revealed a distinct “short-term disturbance and long-term recovery” dynamic pattern (Figure 3k). Specifically, within the PV panel area, the mean RSEI decreased from 0.436 in 2015 (pre-construction) to 0.423 in 2016 (construction year), reflecting the short-term adverse impact of construction activities on the ecological environment. However, during the operational phase (2016–2024), the RSEI showed a continuous recovery, ultimately reaching 0.508 by 2024, which exceeded the pre-construction level. This divergence underscores PV system’s capacity to reverse prior ecological decline trends within their immediate operational areas.
3.2 Evaluation of the LSTM model performance
To comprehensively evaluate the performance of the LSTM model’s performance in predicting RSEI, this study conducted simulation experiments using 50,000 samples from the 1990–2015 period. Among these, 45,000 samples were used for model training, and the remaining 5,000 samples were utilized to test the model’s predictive capability. Simulation results demonstrated a mean absolute error (MAE) of 0.038, indicating an average deviation between predicted and observed RSEI values. The root mean square error (RMSE) of 0.051 further confirmed the concentration of error distribution. A coefficient of determination (R2) of 0.878 revealed that the model effectively explained the data variability, highlighting its superior nonlinear fitting capacity. From the loss curve, it can be observed that the model fits well, with training and validation losses converging stably without significant overfitting (Figure 4). These robust performance metrics underscore the exceptional robustness of the LSTM model.
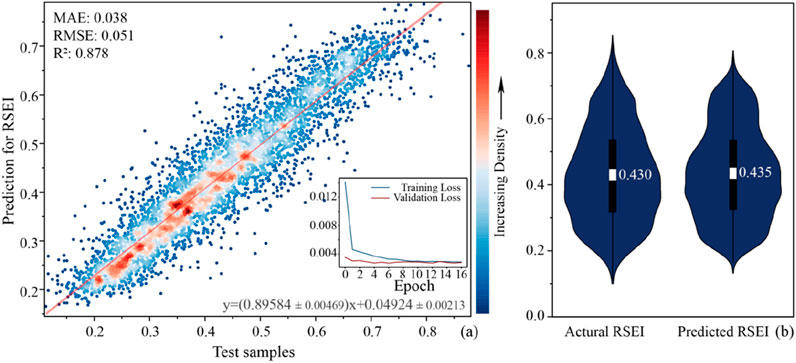
Figure 4. Evaluations of the LSTM model for RSEI prediction. (a) Linear Fit Plot; (b) Violin plot.
Model fidelity was further corroborated through ordinary least-squares regression between observed and predicted RSEI values. The fitted slope of 0.896 ± 0.005 (mean ± SE, p < 0.001) indicates a marginal overestimation, yet the slope is statistically indistinguishable from unity, confirming high predictive accuracy. Violin plots reinforced this conclusion: the kernel-density curves of predicted and observed distributions overlap almost completely across the primary interval [0.18, 0.75]. These non-parametric results demonstrate that the LSTM model not only captures individual RSEI values with minimal bias but also preserves the full distributional characteristics.
3.3 Impacts of PV system on alpine grasslands
Figure 5 contrasts the observed post-construction RSEI distribution with a counterfactual simulation in which the PV system was never installed. As shown in Figure 5a, after construction, RSEI exhibits a clear south-to-north gradient, with the highest values (RSEI >0.60) concentrated along river corridors, valley floors and beneath PV panels (mean = 0.52). In the no-PV simulation (Figure 5b), the same south-high-north-low pattern is evident, but mean RSEI in the PV system is markedly lower (mean = 0.38). This divergence indicates a net ecological benefit attributable to the PV system.
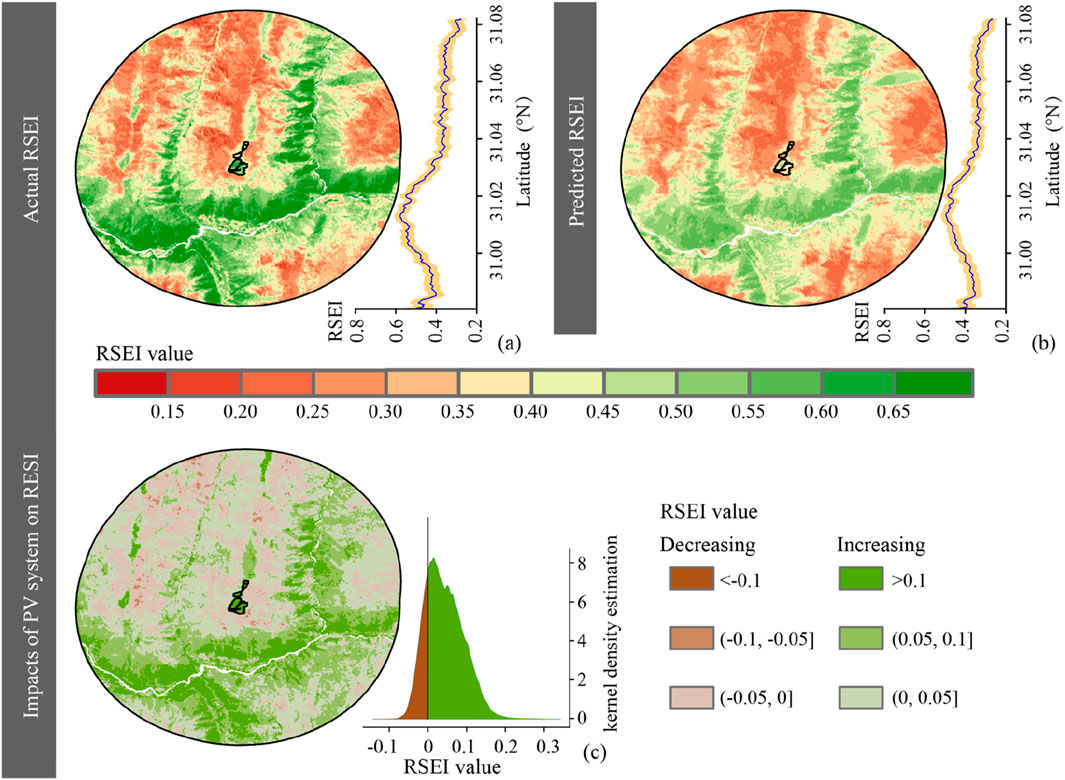
Figure 5. Spatial distribution patterns of RSEI after the PV system construction: (a) Actual RSEI; (b) Predicted RSEI based on LSTM model; (c) Net impact of the PV system on RSEI.
Figure 5c quantifies the spatial difference between the two scenarios. While both positive and negative RSEI anomalies occur, most variations lie within the −0.10 to +0.10 range. Overall, positive deviations dominate within the panel zones, confirming that PV infrastructure has enhanced rather than degraded alpine grassland conditions, and highlights the spatially heterogeneous nature of these interactions.
3.4 Impact scope of PV system
By using a counterfactual framework, the study derived the net ecological effect of the PV system by differencing post-construction (2016–2024) RSEI observations against LSTM-predicted values for a no-construction scenario (Figure 6). Results demonstrate that PV system generated significant positive ecological effects on surrounding grasslands, though these effects exhibited distinct spatial decay patterns. Specifically, the core PV panel-covered area showed a statistically significant increase of 0.14 in mean RSEI compared to pre-construction baseline levels, indicating a pronounced ecological improvement.
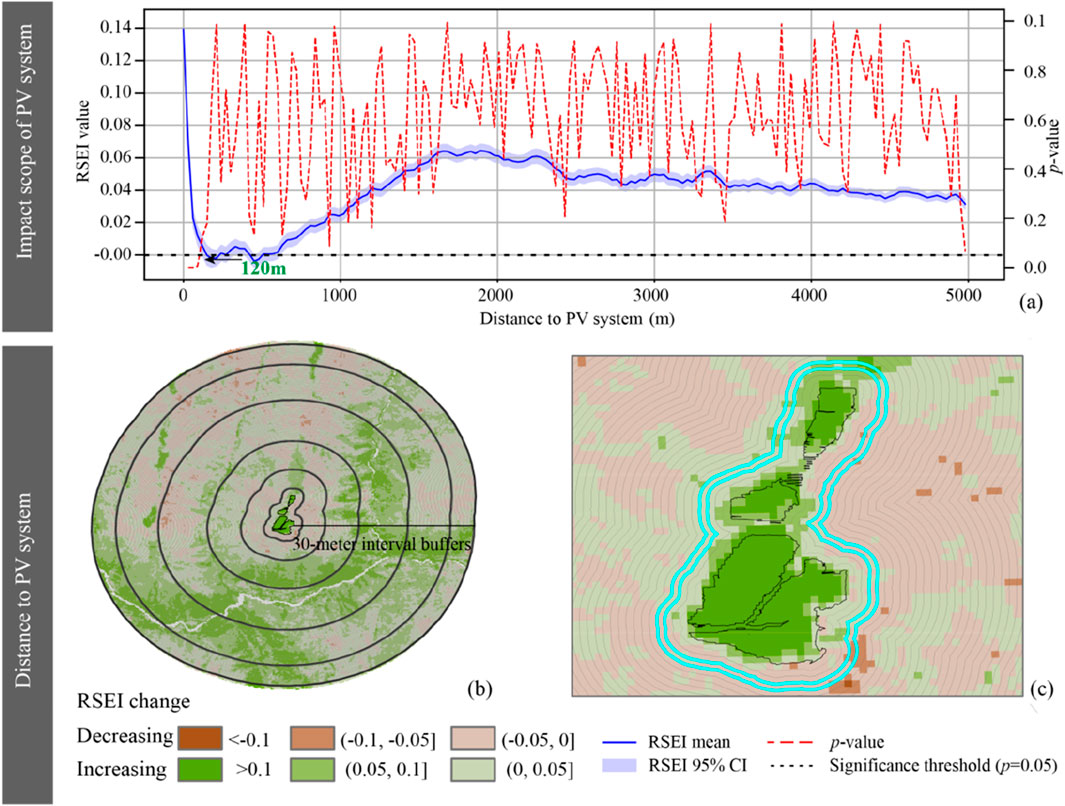
Figure 6. Impact scope of PV system: (a) Impact scope; (b) 30-m interval buffers; (c) Variations of RSEI with distance to PV system.
T-test analyses confirmed that RSEI increments within 120 m of the PV system were statistically significant (p < 0.05). Beyond 120 m, the influence gradually weakened, and the previously observed stabilization trend ceased beyond 720 m, establishing a clear spatial boundary for the ecological impacts of PV system (Figure 6a). Furthermore, the study incorporated topographic factors to analyze the spatial distribution patterns of PV system impacts on the grasslands along elevation gradients.
Moreover, the ecological benefit attenuated exponentially with distance from the PV system. RSEI increments declined by 50% within 30 m (0.07), reached 0.02 at 60 m, and became negligible (0.005) at 120 m (Figures 6b,c). T-test analyses confirmed significance (p < 0.05) out to 120 m; beyond this radius the effect gradually weakened and effectively disappearing after 720 m.
4 Discussion
4.1 Impacts of PV system on alpine grasslands
This study validates the applicability of RSEI in the alpine grasslands through principal component analysis. The results show that the contribution rate of the first principal component consistently exceeds 70%, indicating that the model effectively integrates information from the four core ecological indicators—greenness, wetness, heat, and dryness. This finding not only confirms the reliability of the RSEI model for assessing ecologically fragile areas but also provides empirical support for its use in monitoring the ecological effects of photovoltaic power stations in this study.
Comparative analysis of RSEI before and after PV system construction reveals that post-construction areas with increasing RSEI slightly exceeded pre-construction levels, while regions exhibiting declining RSEI decreased. This indicates improved ecological conditions following PV system, particularly within PV panel zones. These ecological impacts exhibit a dynamic pattern characterized by short-term degradation followed by long-term improvement. During the construction phase, photovoltaic power stations inevitably cause surface disturbance through excavation, filling, stacking, and compaction, significantly impacting the original topsoil, vegetation, and surface crust. This leads to the destruction of the surface crust, reduced vegetation coverage, ecological deterioration, and decreased plant community diversity (Zhou and Wang, 2019). However, research findings indicate that after the power station becomes operational, ecological quality gradually recovers and improves. The microclimatic effects generated by PV arrays, such as the shading effect of panels that effectively reduces surface water evaporation and wind speed, thereby improving soil physicochemical properties (Jiang et al., 2021), along with the function of PV panels as rainwater collection surfaces (Myyas et al., 2022), create microclimatic conditions in inter-panel areas that may be more conducive to plant growth. These factors are likely key reasons for the continuous recovery of RSEI values during the operational period (2016–2024) and their eventual surpassing of pre-construction levels. Therefore, this study concludes that alpine grassland ecosystems demonstrate significant potential for ecological recovery after the initial disturbance phase of photovoltaic construction.
Counterfactual simulations based on the LSTM model demonstrate that PV system generates both positive and negative ecological effects, though net positive impacts dominate. The observed RSEI enhancement in PV panel areas may be attributed to the PV panel’s capacity to substantially increase vegetation and soil carbon/nitrogen stocks (Zhang et al., 2024), thereby boosting grassland aboveground productivity and plant species diversity (Bai et al., 2022). For instance, the PV system in Qinghai Gonghe Basin exhibits significantly higher vegetation diversity indices, soil moisture content, organic matter, and total nitrogen levels compared to adjacent areas, effectively promoting vegetation recovery and wind-sand stabilization (Wu et al., 2024). PV panels reduce wind speed through physical obstruction while their shading effects decrease evaporation and evapotranspiration, enhancing soil moisture retention (Liu et al., 2019). Precipitation concentrated along panel edges flows into inter-array spaces, increasing soil moisture via water redistribution (Armstrong et al., 2014). Furthermore, elevated photosynthetically active radiation in inter-panel gaps stimulates plant photosynthesis (Bai et al., 2012; Zhang et al., 2023). The combined effects of improved soil moisture and photosynthetic efficiency promote grassland growth, while increased biomass generates more litter input to soils, enhancing nutrient supply, soil structure, and water-holding capacity (Deutsch et al., 2010). These interconnected mechanisms collectively drive the significant positive ecological impacts of PV system on local environments.
This study found that ecological conditions in areas adjacent to PV system also experienced notable improvements. Specifically, the ecological enhancement effects of PV system were most pronounced within 120 m of the facilities, gradually diminishing with increasing distance and ceasing beyond 720 m. This demonstrates that PV system impacts on ecosystems exhibit both spillover and boundary effects. The observed spillover effects may be attributed to the cold island effect induced by PV system (Li et al., 2021), with its spatial extent simultaneously constrained by topographic gradients particularly including elevation and slope. The significant impact zone within 120 m reflects direct ecological responses to PV system, while the attenuation transition belt between 120 and 720 m likely results from interactions between artificial facility effects and natural topographic-ecological process. Topographic analysis revealed that this distance-dependent decay is partly governed by elevation. The elevation gradually decreases with increasing distance from the PV system: at 120 m—the distance of significant ecological impact—the elevation drops to 3,508 m, representing a decline of 38.2 m. At the critical distance of 720 m, the elevation further decreases to 3,218 m, resulting in a total elevation difference of 328 m. This elevational gradient has likely influenced the observed spatial pattern of ecological effects by altering local hydrothermal conditions (Okland et al., 2008; Moeslund et al., 2013). Notably, impact extents may vary depending on site-specific factors including geographical location, plant scale, array layout, and technical specifications such as panel height, orientation, and tilt angles. Nevertheless, the proposed framework effectively quantifies the magnitude and spatial boundaries of PV system’s ecological impacts, providing a reliable methodological foundation for analogous environmental assessments in renewable energy development.
4.2 Limitations and future directions
While this study has systematically evaluated the impacts of PV systems on alpine grasslands, our research still has the following limitations: First, due to technical constraints of remote sensing detection, the reflectivity and shading effects of PV panels may lead to the underestimation of vegetation changes beneath the panels. Additionally, the limitation of remote sensing image resolution prevents comparative studies on grasslands between “areas beneath panels” and “inter-array gaps”—both issues introduce uncertainty into ecological assessments (Xu et al., 2024). Furthermore, the shading from PV panels also hinders the accurate acquisition of key ecological parameters, which may in turn compromise the accuracy of the RSEI. Second, this study did not consider the applicability of the RSEI in alpine grassland ecosystems, which may result in the relevant findings failing to reflect the true changes in environmental quality before and after the construction of PV systems. Third, the 8-year post-construction monitoring period can only capture mid-term ecological responses and is insufficient to assess long-term processes such as soil biogeochemical transformations and community succession (Li et al., 2023). Fourth, this study did not account for the short-term impacts during the construction phase of PV systems. Therefore, the ecological changes monitored in this study are actually a comprehensive reflection of short-term disturbances and long-term adaptations. Additionally, our understanding of the spillover effects of PV systems may not be accurate. This is because slope itself influences the construction of PV systems; for instance, PV facilities cannot be built in areas with excessively steep slopes. Finally, this study relies primarily on remote sensing data and model simulations, with a lack of ground validation. Although remote sensing technology enables large-scale and continuous monitoring, its accuracy is limited by cloud/snow cover, atmospheric correction errors, and sensor performance (Zhu et al., 2015), thus, ground validation is essential. To address these limitations, we suggest that future studies should extend the monitoring period, integrate simultaneous ground observations, and adopt satellite images with higher resolution to improve the accuracy and reliability of research results.
5 Conclusion
This study presents an integrated framework that couples the RSEI index with LSTM network to quantify the ecological consequences of utility-scale PV system in alpine grasslands. Results indicate a 4.08% reduction in grassland degradation areas during the post-construction period (2016–2024) compared to the pre-construction baseline (1990–2015). Within the panel area, the pixels exhibiting positive RSEI change rose from 44% in the pre-construction period to 77.5% in the post-construction period. Counterfactual simulations corroborate these gains, revealing statistically significant ecological spill-over effects extending 120 m from the PV system, with perceptible influences up to 720 m. These results provide a robust scientific basis for siting and managing PV infrastructure in fragile alpine environments. We call for the implementation of ecological impact assessments and long-term monitoring in and around photovoltaic power stations, and urge policymakers to conduct ecological compensation when constructing photovoltaic facilities in alpine grassland areas.
Data availability statement
The raw data supporting the conclusions of this article will be made available by the authors, without undue reservation.
Author contributions
HL: Writing – original draft. QY: Methodology, Writing – review and editing. YL: Investigation, Writing – review and editing. BY: Data curation, Writing – review and editing. LZ: Validation, Writing – review and editing. BX: Investigation, Writing – review and editing. YR: Data curation, Writing – review and editing. YZ: Conceptualization, Supervision, Writing – review and editing.
Funding
The author(s) declare that financial support was received for the research and/or publication of this article. The author(s) declare that financial support was received for the research and/or publication of this article. This research was supported by Sichuan Yanyuan Huadian New Energy Corporation Limited. (grant no. YYHC-JJ/FW-2025-01 and CHDTDZ046/18-QT-063).
Conflict of interest
Authors LHS, YQZ, LYY and XBW were employed by Sichuan Branch, China Huadian Corporation Limited, YB, ZLQ, RYJ were employed by Sichuan Yanyuan Huadian New Energy Corporation Limited.
The authors declare that this study received funding from the Sichuan Yanyuan Huadian New Energy Corporation. The funder had the following involvement in the study: study design, collection, analysis, interpretation of data, the writing of this article, or the decision to submit it for publication.
Generative AI statement
The author(s) declare that no Generative AI was used in the creation of this manuscript.
Any alternative text (alt text) provided alongside figures in this article has been generated by Frontiers with the support of artificial intelligence and reasonable efforts have been made to ensure accuracy, including review by the authors wherever possible. If you identify any issues, please contact us.
Publisher’s note
All claims expressed in this article are solely those of the authors and do not necessarily represent those of their affiliated organizations, or those of the publisher, the editors and the reviewers. Any product that may be evaluated in this article, or claim that may be made by its manufacturer, is not guaranteed or endorsed by the publisher.
References
Armstrong, A., Waldron, S., Whitaker, J., and Ostle, N. J. (2014). Wind farm and solar park effects on plant–soil carbon cycling: uncertain impacts of changes in ground-level microclimate. Glob. change Biol. 20 (6), 1699–1706. doi:10.1111/gcb.12437
Ashraf, M. A., Liu, Z., Alizadeh, A. A., Nojavan, S., Jermsittiparsert, K., and Zhang, D. (2020). Designing an optimized configuration for a hybrid PV/Diesel/Battery energy system based on metaheuristics: a case study on gobi desert. J. Clean. Prod. 270, 122467. doi:10.1016/j.jclepro.2020.122467
Bai, Y., Wang, J., Zhang, B., Zhang, Z., and Liang, J. (2012). Comparing the impact of cloudiness on carbon dioxide exchange in a grassland and a maize cropland in northwestern China. Ecol. Res. 27, 615–623. doi:10.1007/s11284-012-0930-z
Bai, Z., Jia, A., Bai, Z., Qu, S., Zhang, M., Kong, L., et al. (2022). Photovoltaic panels have altered grassland plant biodiversity and soil microbial diversity. Front. Microbiol. 13, 1065899. doi:10.3389/fmicb.2022.1065899
Boegh, E., Soegaard, H., Hanan, N., Kabat, P., and Lesch, L. (1999). A remote sensing study of the NDVI–Ts relationship and the transpiration from sparse vegetation in the Sahel based on high-resolution satellite data. Remote Sens. Environ. 69 (3), 224–240. doi:10.1016/S0034-4257(99)00025-5
Chen, H., Wu, W., Li, C., Lu, G., Ye, D., Ma, C., et al. (2025). Ecological and environmental effects of global photovoltaic power plants: a meta-analysis. J. Environ. Manag. 373, 123785. doi:10.1016/j.jenvman.2024.123785
Deutsch, E., Bork, E., and Willms, W. (2010). Soil moisture and plant growth responses to litter and defoliation impacts in Parkland grasslands. Agric. Ecosyst. Environ. 135 (1-2), 1–9. doi:10.1016/j.agee.2009.08.002
Dong, S., Shang, Z., Gao, J., and Boone, R. B. (2020). Enhancing sustainability of grassland ecosystems through ecological restoration and grazing management in an era of climate change on Qinghai-Tibetan Plateau. Agric. Ecosyst. Environ. 287, 106684. doi:10.1016/j.agee.2019.106684
Du, Z., Ji, X., Liu, J., Zhao, W., He, Z., Jiang, J., et al. (2025). Ecological health assessment of Tibetan alpine grasslands in Gannan using remote sensed ecological indicators. Geo-Spatial Inf. Sci. 28 (1), 246–264. doi:10.1080/10095020.2024.2311862
Gers, F. A., Schmidhuber, J., and Cummins, F. (2000). Learning to forget: continual prediction with LSTM. Neural Comput. 12 (10), 2451–2471. doi:10.1162/089976600300015015
Guerin, T. F. (2017). Evaluating expected and comparing with observed risks on a large-scale solar photovoltaic construction project: a case for reducing the regulatory burden. Renew. Sustain. Energy Rev. 74, 333–348. doi:10.1016/j.rser.2017.02.040
Guo, R., Zhou, J., Zhong, X., Gu, F., Liu, Q., and Li, H. (2019). Effect of simulated warming on the functional traits of Leymus chinensis plant in Songnen grassland. AoB Plants 11 (6), plz073. doi:10.1093/aobpla/plz073
Hu, Y., Huang, W., Wang, J., Chen, S., and Zhang, J. (2016). Current status, challenges, and perspectives of Sichuan׳ s renewable energy development in Southwest China. Renew. Sustain. Energy Rev. 57, 1373–1385. doi:10.1016/j.rser.2015.12.138
Iyer, R., and Scott, J. (2001). Power station fly ash—a review of value-added utilization outside of the construction industry. Resour. conservation Recycl. 31 (3), 217–228. doi:10.1016/S0921-3449(00)00084-7
Jiang, J., Gao, X., Lv, Q., Li, Z., and Li, P. (2021). Observed impacts of utility-scale photovoltaic plant on local air temperature and energy partitioning in the barren areas. Renew. Energy, 174: 157–169. doi:10.1016/j.renene.2021.03.148
Li, G., Hernandez, R. R., Blackburn, G. A., Davies, G., Hunt, M., Whyatt, J. D., et al. (2021). Ground-mounted photovoltaic solar parks promote land surface cool islands in arid ecosystems. Renew. Sustain. Energy Transition 1, 100008. doi:10.1016/j.rset.2021.100008
Li, X., Zhou, J., Huang, Y., Wang, R., and Lu, T. (2023). Quantifying water impoundment-driven air temperature changes in the Dammed Jinsha River, Southwest China. Remote Sens. 15 (17), 4280. doi:10.3390/rs15174280
Liu, B., and Huo, X. (2024). Prediction of photovoltaic power generation and analyzing of carbon emission reduction capacity in China. Renew. Energy 222, 119967. doi:10.1016/j.renene.2024.119967
Liu, Y., Zhang, R. Q., Huang, Z., Cheng, Z., López-Vicente, M., Ma, X. R., et al. (2019). Solar photovoltaic panels significantly promote vegetation recovery by modifying the soil surface microhabitats in an arid sandy ecosystem. Land Degrad. Dev. 30 (18), 2177–2186. doi:10.1002/ldr.3408
Liu, H., Wu, C., Yu, Y., Zhao, W., Liu, J., Yu, H., et al. (2023). Effect of solar farms on soil erosion in hilly environments: a modeling study from the perspective of hydrological connectivity. Water Resour. Res. 59 (12), e2023WR035067. doi:10.1029/2023WR035067
Luo, L., Zhuang, Y., Liu, H., Zhao, W., Chen, J., Du, W., et al. (2023). Environmental impacts of photovoltaic power plants in northwest China. Sustain. Energy Technol. Assessments 56, 103120. doi:10.1016/j.seta.2023.103120
Moeslund, J. E., Arge, L., Bocher, P. K., Dalgaard, T., Odgaard, M. V., Nygaard, B., et al. (2013). Topographically controlled soil moisture is the primary driver of local vegetation patterns across a lowland region. Ecosphere 4 (7), 1–26. doi:10.1890/es13-00134.1
Myyas, R. E. N., Al-Dabbasa, M., Tostado-Véliz, M., and Jurado, F. (2022). A novel solar panel cleaning mechanism to improve performance and harvesting rainwater. Sol. Energy 237, 19–28. doi:10.1016/j.solener.2022.03.068
Ning, L., Jiayao, W., and Fen, Q. (2020). The improvement of ecological environment index model RSEI. Arabian J. Geosciences 13 (11), 403. doi:10.1007/s12517-020-05414-7
Okland, R. H., Rydgren, K., and Okland, T. (2008). Species richness in boreal swamp forests of SE Norway: the role of surface microtopography. J. Veg. Sci. 19 (1), 67–74. doi:10.3170/2007-8-18330
Olabi, A., and Abdelkareem, M. A. (2022). Renewable energy and climate change. Renew. Sustain. Energy Rev. 158, 112111. doi:10.1016/j.rser.2022.112111
Pu, Y., Wang, P., Wang, Y., Qiao, W., Wang, L., and Zhang, Y. (2021). Environmental effects evaluation of photovoltaic power industry in China on life cycle assessment. J. Clean. Prod. 278, 123993. doi:10.1016/j.jclepro.2020.123993
Ren, Z., Tian, Z., Wei, H., Liu, Y., and Yu, Y. (2022). Spatiotemporal evolution and driving mechanisms of vegetation in the Yellow River Basin, China during 2000–2020. Ecol. Indic. 138, 108832. doi:10.1016/j.ecolind.2022.108832
Tawalbeh, M., Al-Othman, A., Kafiah, F., Abdelsalam, E., Almomani, F., and Alkasrawi, M. (2021). Environmental impacts of solar photovoltaic systems: a critical review of recent progress and future outlook. Sci. Total Environ. 759, 143528. doi:10.1016/j.scitotenv.2020.143528
Wang, Q., Liu, S., Chanussot, J., and Li, X. (2018). Scene classification with recurrent attention of VHR remote sensing images. IEEE Trans. Geoscience Remote Sens. 57 (2), 1155–1167. doi:10.1109/TGRS.2018.2864987
Wang, J., Li, G. X., and Chen, F. Y. (2022). Eco-environmental effect evaluation of Tamarix chinesis forest on coastal saline-alkali land based on RSEI model. Sensors 22 (13), 5052. doi:10.3390/s22135052
Wang, Y., Liu, B., Xing, Y., Peng, H., Wu, H., and Zhong, J. (2024). Ecological construction status of photovoltaic power plants in China’s deserts. Front. Environ. Sci. 12, 1406546. doi:10.3389/fenvs.2024.1406546
Wang, S., Meng, X., Li, Q., Li, Z., Yang, P., Niu, W., et al. (2025). Environmental impacts of pastoral-integrated photovoltaic power plant in an alpine meadow on the eastern Tibetan Plateau. Atmos. Chem. Phys. 25 (18), 11301–11315. doi:10.5194/acp-25-11301-2025
Wen, C., Long, T., He, G., Jiao, W., and Jiang, W. (2025). Temporally enhanced RSEI and nighttime lights reveal long-term ecological changes and effective protection in China’s inaugural national parks. Ecol. Indic. 170, 112981. doi:10.1016/j.ecolind.2024.112981
Wu, W., Chen, H., Li, C., Lu, G., Ye, D., Ma, C., et al. (2024). Assessment of the ecological and environmental effects of large-scale photovoltaic development in desert areas. Sci. Rep. 14 (1), 22456. doi:10.1038/s41598-024-72860-8
Wu, C., Liu, H., Wei, L., Yu, Y., Zhao, W., Guo, L., et al. (2025). Diverse vegetation responses to solar farm installation are also driven by climate change. Commun. Earth Environ. 6 (1), 118. doi:10.1038/s43247-025-02121-7
Xu, H. (2013). A remote sensing urban ecological index and its application. Acta Ecol. Sin. 33 (24), 7853–7862. doi:10.5846/stxb201208301223
Xu, Z., Li, Y., Qin, Y., and Bach, E. (2024). A global assessment of the effects of solar farms on albedo, vegetation, and land surface temperature using remote sensing. Sol. Energy 268, 112198. doi:10.1016/j.solener.2023.112198
Yu, S., Han, R., and Zhang, J. (2023). Reassessment of the potential for centralized and distributed photovoltaic power generation in China: on a prefecture-level city scale. Energy 262, 125436. doi:10.1016/j.energy.2022.125436
Yue, S., Guo, M., Zou, P., Wu, W., and Zhou, X. (2021). Effects of photovoltaic panels on soil temperature and moisture in desert areas. Environ. Sci. Pollut. Res. 28, 17506–17518. doi:10.1007/s11356-020-11742-8
Zhang, Y., She, J., Long, X., and Zhang, M. (2022). Spatio-temporal evolution and driving factors of eco-environmental quality based on RSEI in Chang-Zhu-Tan metropolitan circle, central China. Ecol. Indic. 144, 109436. doi:10.1016/j.ecolind.2022.109436
Zhang, B., Zhang, R., Li, Y., Wang, S., and Xing, F. (2023). Ignoring the effects of photovoltaic array deployment on greenhouse gas emissions may lead to overestimation of the contribution of photovoltaic power generation to greenhouse gas reduction. Environ. Sci. Technol. 57 (10), 4241–4252. doi:10.1021/acs.est.3c00479
Zhang, B., Zhang, R., Li, Y., Wang, S., Zhang, M., and Xing, F. (2024). Deploying photovoltaic arrays in degraded grasslands is a promising win-win strategy for promoting grassland restoration and resolving land use conflicts. J. Environ. Manag. 349, 119495. doi:10.1016/j.jenvman.2023.119495
Zheng, Z., Wu, Z., Chen, Y., Guo, G., Cao, Z., Yang, Z., et al. (2021). Africa's protected areas are brightening at night: a long-term light pollution monitor based on nighttime light imagery. Glob. Environ. Change 69, 102318. doi:10.1016/j.gloenvcha.2021.102318
Zheng, Z., Wu, Z., Chen, Y., Guo, C., and Marinello, F. (2022). Instability of remote sensing based ecological index (RSEI) and its improvement for time series analysis. Sci. Total Environ. 814, 152595. doi:10.1016/j.scitotenv.2021.152595
Zheng, J., Luo, Y., Gao, X., and Chang, R. (2023). Study on impact of large-scaled photovoltaic development on local climate and ecosystem. Acta Energiae Solaris Sin. 44 (8), 253–265. doi:10.19912/j.0254-0096.tynxb.2022-0530
Zhou, M., and Wang, X. (2019). Influence of photovoltaic power station engineering on soil and vegetation: taking the Gobi Desert Area in the Hexi corridor of Gansu as an example. Sci. Soil Water Conservation 17, 132–138. doi:10.16843/j.sswc.2019.02.016
Keywords: grassland ecosystem, solar photovoltaic system, remote sensing image, ecological impact, LSTM model
Citation: Li H, Yang Q, Li Y, Yang B, Zhang L, Xia B, Ren Y and Zhao Y (2025) Quantifying utility-scale photovoltaic impacts on eastern Tibetan alpine grasslands through RSEI and LSTM approaches. Front. Environ. Sci. 13:1693677. doi: 10.3389/fenvs.2025.1693677
Received: 27 August 2025; Accepted: 13 October 2025;
Published: 29 October 2025.
Edited by:
Shuisen Chen, Guangzhou Institute of Geography, ChinaReviewed by:
Jianhua Xiao, Chinese Academy of Sciences (CAS), ChinaSameer Algburi, Al-Kitab University, Iraq
Copyright © 2025 Li, Yang, Li, Yang, Zhang, Xia, Ren and Zhao. This is an open-access article distributed under the terms of the Creative Commons Attribution License (CC BY). The use, distribution or reproduction in other forums is permitted, provided the original author(s) and the copyright owner(s) are credited and that the original publication in this journal is cited, in accordance with accepted academic practice. No use, distribution or reproduction is permitted which does not comply with these terms.
*Correspondence: Yingnan Zhao, emhhb3luQGNpYi5hYy5jbg==