 Xiaoming Li
 Chenchen Fan2
 Guanglong Bao
- 1Agricultural College, Yangzhou University, Yangzhou, China
- 2Art and Design College, Yangzhou University, Yangzhou, China
- 3School of Landscape and Architecture, Dong-a University, Busan, Republic of Korea
- 4School of Architectural Engineering, Shandong Polytechnic College, Jining, China
Clarifying the contribution of urban blue-green spaces to the cooling effect on surface temperature is crucial for rationalizing urban land use and ensuring sustainable urban development. This study examined how blue-green spaces have changed over time and how these changes affect land surface temperature (LST) in 41 prefecture-level cities in China’s Yangtze River Delta (YRD) region from 2000 to 2024. The researchers used remote sensing data and landscape indices, employing Moran’s I and Geographically and temporally weighted regression (GTWR) models, to analyze the relationship between blue-green spaces and LST in the YRD. During the study period, LST increased significantly in most cities, notably in Hefei and Nanjing. Blue-green space areas decreased and fragmented; for instance, Hefei’s green space area shrank from 9,665.44 km2 to 5,726.63 km2. The GTWR model revealed that blue-green space landscape indices (such as PD, ED, and CONTAG) influence LST spatial heterogeneity. Highly fragmented blue-green spaces in the southern region may reduce LST, while those in the northwestern region may increase it. In the southern YRD, the presence of abundant water bodies alongside highly fragmented blue-green spaces may reduce LST by enhancing evapotranspiration and creating cooling islands. By contrast, in the northwestern YRD, where water bodies are fewer, fragmentation of blue-green spaces is associated with an increase in LST, since the cooling capacity of green spaces alone is insufficient. Optimizing the layout of blue-green spaces and integrating their synergistic effects could significantly enhance cooling capacity and reduce inequalities in contributions to cooling effects.
1 Introduction
Global climate change and rapid urbanization have intensified the urban heat island (UHI) effect (Li et al., 2024a). This has led to higher land surface temperatures (LST) and more frequent and intense heat waves, which threaten public health, biodiversity, and ecosystem services. Changes in land use are a key driver of the UHI effect (Yuan et al., 2025). Urban expansion encroaches on farmland, forests, and wetlands, altering surface thermal properties and significantly intensifying heat accumulation in urban centers (Huang et al., 2025). Increased land development intensity in the global urbanization process has caused surface temperatures to rise, particularly in low-latitude regions where thermal environmental issues are especially pronounced.
China has experienced the world’s fastest process of urbanization, with surface temperatures rising above the global average. This makes the region highly sensitive to thermal environmental issues (Yu et al., 2024). Urbanization has transitioned from a period of rapid growth to a phase of stable development. Urban development is shifting from large-scale expansion to improving the quality and efficiency of existing urban areas (Han D. et al., 2024). Guided by the National Territorial Space Planning Outline (2021–2035), China has fully implemented national urban territorial space planning, which is characterized by inward-oriented, intensive, and green development. From 2021 to 2024, land consumption per unit of GDP decreased by 15.97%, surpassing the target set by the 14th Five-Year Plan ahead of schedule. The “Opinions on Continuously Promoting Urban Renewal Actions” emphasize lifecycle management and the coordination of production, living, and ecological space layouts to optimize existing land use and alleviate the UHI effect (Shui et al., 2025). The Yangtze River Delta (YRD), the core economic area of China, has a complex water system and high urbanization density. This results in a significant UHI effect, making the YRD a prime region for studying thermal environment governance (Yang and Zeng, 2025).
Blue-green spaces, which include green spaces such as forests, parks, and farmland, as well as blue spaces such as rivers, lakes, and wetlands, significantly mitigate the UHI effect through shading, evapotranspiration, and high thermal capacity evaporation cooling. This makes them the core of urban green infrastructure (Norton et al., 2015). Studies indicate that blue-green spaces can reduce LST by 1 °C–4 °C (Yu et al., 2020). Integrating water bodies with green spaces can lower temperatures by an additional 0.99 °C–1.45 °C (Shi et al., 2020). This improves microclimates, promotes ventilation corridors, and maintains biodiversity (Zhang et al., 2017).
Some research has demonstrated that integrating strategies such as green infrastructure and water-sensitive design can effectively mitigate the urban heat island effect and enhance urban resilience (Pritipadmaja et al., 2023). Li et al. quantify the complexity of the relationship between the configuration of urban green spaces (UGS) and urban cooling through landscape indicators. They propose that green spaces that are more clustered, larger and more complex in shape contribute to enhanced cooling effects (Li et al., 2023b). A study used the GTWR model to analysis the spatiotemporal relationship between the built environment and thermal conditions. It verified the positive correlation between the vegetation index (EVI) and the water index (MNDWI) in mitigating the urban heat island effect (Chen et al., 2024).
However, urbanization has reduced and fragmented blue-green spaces, which weakens their cooling function, especially in high-density urban areas (Bekele et al., 2022). Existing studies have primarily focused on individual cities or regions based on economic and climatic attributes (Peng et al., 2020). These studies use static models to analyze cooling effects and lack a multi-scale, cross-regional perspective or an in-depth exploration of landscape patterns and the dynamic spatial heterogeneity of LST (Zhu et al., 2025). During China’s “stock-based” development era, optimizing blue-green space patterns through intensive land use is crucial for mitigating the UHI; however, systematic research on the YRD urban agglomeration remains insufficient.
This study analyzes the evolution of blue-green space patterns in 41 prefecture-level cities in the YRD region from 2000 to 2024. Using Landsat remote sensing data, the study employs Moran’s I to analyze spatial autocorrelation and combines geographic weighted regression (GWR) and geographically and temporally weighted regression (GTWR) models to evaluate the cooling impact of blue-green spaces on LST.
The aim of this study is to address three scientific questions: 1. How do spatiotemporal variations affect the cooling effect of blue-green spaces on surface temperatures?2. The relationship between blue-green space landscape indices and the spatial heterogeneity of surface temperatures.3. The role of optimizing the layout of blue-green spaces in mitigating the urban heat island effect. This study provides government authorities with practical evidence to scientifically regulate the rational use of land in economically core regions undergoing rapid urbanization. Additionally, it offers a foundation for case studies in global urban thermal environment governance and sustainable development.
2 Materials and methods
2.1 Overview of the research area
The YRD is located in the lower reaches of the Yangtze River in China. Its geographical coordinates are 27°12′–35°20′ north latitude and 114°54′–122°12′ east longitude (Figure 1). It stretches from Yancheng in Jiangsu Province in the north to Taizhou in Zhejiang Province in the south and from Anqing in Anhui Province in the west to the Yellow Sea and the East China Sea in the east. According to the “Yangtze River Delta Regional Integration Development Plan Outline” released by China’s National Development and Reform Commission in 2019, the region encompasses all of Shanghai Municipality and parts of Jiangsu, Zhejiang, and Anhui provinces, covering 358,000 square kilometers (Chen et al., 2025; Zhang et al., 2025).
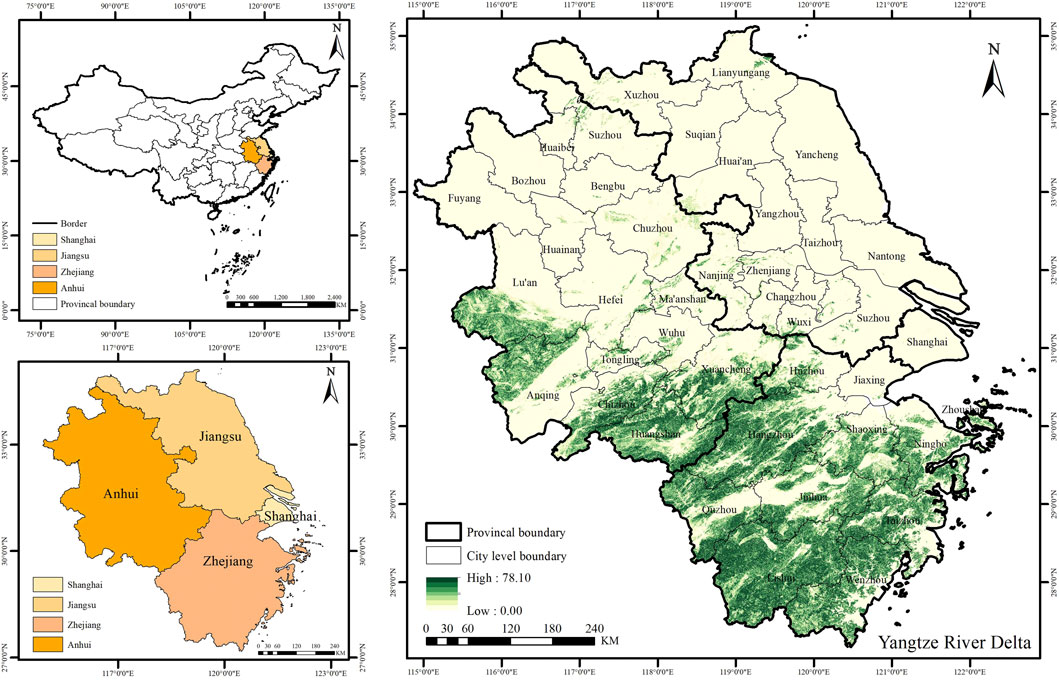
Figure 1. Study area.
It is one of China’s most economically vibrant and open regions, with a regional GDP of 33.1691 trillion yuan in 2024. The region has a subtropical monsoon climate, and urbanization has exacerbated the urban heat island effect (Duan S. et al., 2025). Its complex water network and low-lying terrain pose challenges for ecological and environmental management. With the implementation of the YRD integration strategy, coordinated economic and ecological development among the region’s cities has become particularly important. This study focuses on the evolution of the blue-green space pattern and its impact on the urban heat island effect, which has significant theoretical and practical implications.
2.2 Data sources and processing
This study utilizes LST and blue-green space information from the YRD between 2000 and 2024. Since 2000, China, particularly the YRD, has undergone rapid urbanization. This has led to land development, urban expansion and ecological changes that directly impact blue-green spaces, land use and surface temperatures. The high quality and standardization of remote sensing data from this period makes it suitable for analyzing the influence of blue-green spaces on surface temperatures and correlating these effects with urbanization processes. To capture trend changes occurring approximately every 5 years, this study selected the year of the latest data update as its endpoint, thereby enhancing the persuasiveness of the findings.
Land use data was primarily obtained through the USGS Earth Explorer platform, with an image resolution of 30 m. All remote sensing image data was processed using ENVI 5.0 and ArcGIS 10.8 software, including steps such as radiometric correction, atmospheric correction, and geometric correction, to ensure that the image data accurately reflects surface features. Remote sensing images have been selected as cloudless data sources in summer. Blue-green space pattern data were derived from land use data, with classification methods used to extract blue-green spaces, categorized into blue spaces (water bodies) and green spaces (farmland, forestland, grassland, shrubland, etc.) (Han et al., 2025; Li et al., 2025). The landscape pattern index was calculated using Fragstats 4.2. , Surface temperature data were derived from Landsat satellite imagery using the Single Window Algorithm for temperature inversion (Lv et al., 2025). LST data source: NASA, data name: MOD11 A1, time resolution: 2000–2024, data resolution: 1,000 m, data format: daytime average. The Global Moran’s I index and Anselin Local Moran’s I index were employed to analyze the spatial autocorrelation of surface temperature and blue-green space pattern changes, assessing similarity and spatial clustering patterns across different regions (Bečić and Gašparović, 2025).
2.3 Research methods
2.3.1 LST inversion and classification
This study uses the thermal infrared band (Band 10) of Landsat satellite imagery to derive LST (Tang et al., 2024). The LST calculation is based on the following Equation 1:
Where: Lλ is the radiation value of the thermal infrared band (derived from satellite imagery), K1 and K2 are sensor-specific calibration constants (obtained from satellite metadata), LST is the land surface temperature, expressed in degrees Celsius (°C), The derived land surface temperature data is subsequently classified using the mean−standard deviation method, as follows Equation 2:
Where μ is the mean surface temperature, and σ is the standard deviation. This study divides surface temperature into five categories: low-temperature zone (0 °C–14 °C), sub-moderate temperature zone (14 °C–18 °C), moderate temperature zone (18 °C–22 °C), sub-high temperature zone (22 °C–26 °C), and high temperature zone (>26 °C).
2.3.2 Analysis of blue-green space landscape patterns
This study used Fragstats 4.2 software to calculate landscape pattern indices for blue-green spaces in order to assess their spatiotemporal evolution and their impact on surface temperature changes (Wu et al., 2024). The following landscape pattern indices were selected and calculated in this study (Table 1).
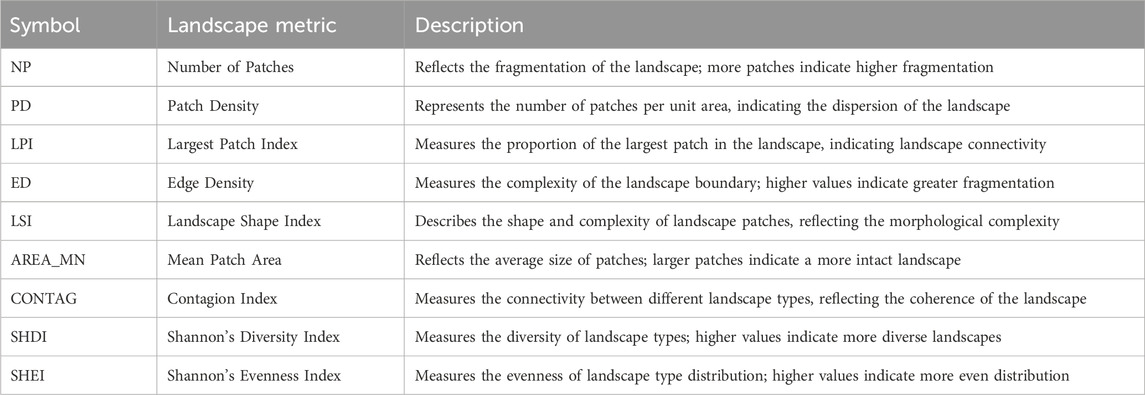
Table 1. Landscape pattern index.
2.3.3 Spatial autocorrelation analysis
Spatial autocorrelation analysis can be used to study the spatial relationship between surface temperature and the spatial pattern of blue-green space (Uyan and Ertunç, 2024). This study uses global and local Moran’s I analysis to examine the spatial clustering patterns of surface temperature, thereby laying the groundwork for subsequent spatial regression models (GWR and GTWR).
(1) Global Moran’s I (Equation 3)
Where N is the sample size, xi and xj are the values of the i (th) and j (th) units, respectively,
(2) Anselin Local Moran’s I (Equation 4)
Anselin Local Moran’s I is used for local spatial autocorrelation analysis and can identify areas of spatial similarity or dissimilarity. The formula is as follows:
This study identifies hotspots and coldspots of blue-green space and surface temperature changes by calculating local Moran’s I values.
2.3.4 GWR and GTWR models
In order to explore the dynamic relationship between changes in blue-green space landscape patterns and surface temperature, this study used GWR and GTWR models (Liu and Wang, 2024). The GWR model analyses the spatial heterogeneity of surface temperature influenced by blue-green spaces, while the GTWR model incorporates the temporal dimension, revealing spatiotemporal variations in the relationship between blue-green spaces and surface temperature. Integrating these two models provides a thorough evaluation of the cooling impact of blue-green spaces on surface temperature and its regional variations, thus helping to achieve the research objectives.
(1) GWR model
The GWR model is an extension of the traditional regression model that can handle spatial heterogeneity and reveal the local relationship between blue-green space and surface temperature in different regions. The basic form of the GWR model is Equation 5:
In this equation, yi is the surface temperature of the i (th) observation, βk is the regression coefficient of the i (th) location, xik is the corresponding independent variable, and ϵi is the error term.
(2) GTWR model
The GTWR model combines spatial and temporal weighted regression to analyze the interactive effects of blue-green space and surface temperature in temporal and spatial dimensions. Its basic form is Equation 6:
Where t represents the time variable, and the meanings of the other symbols are the same as in the GWR model. The GTWR model provides a more detailed analysis, revealing the impact of blue-green spaces on surface temperature changes during different time periods.
2.3.5 Research process flowchart
This research process flowchart is shown in Figure 2 as below.
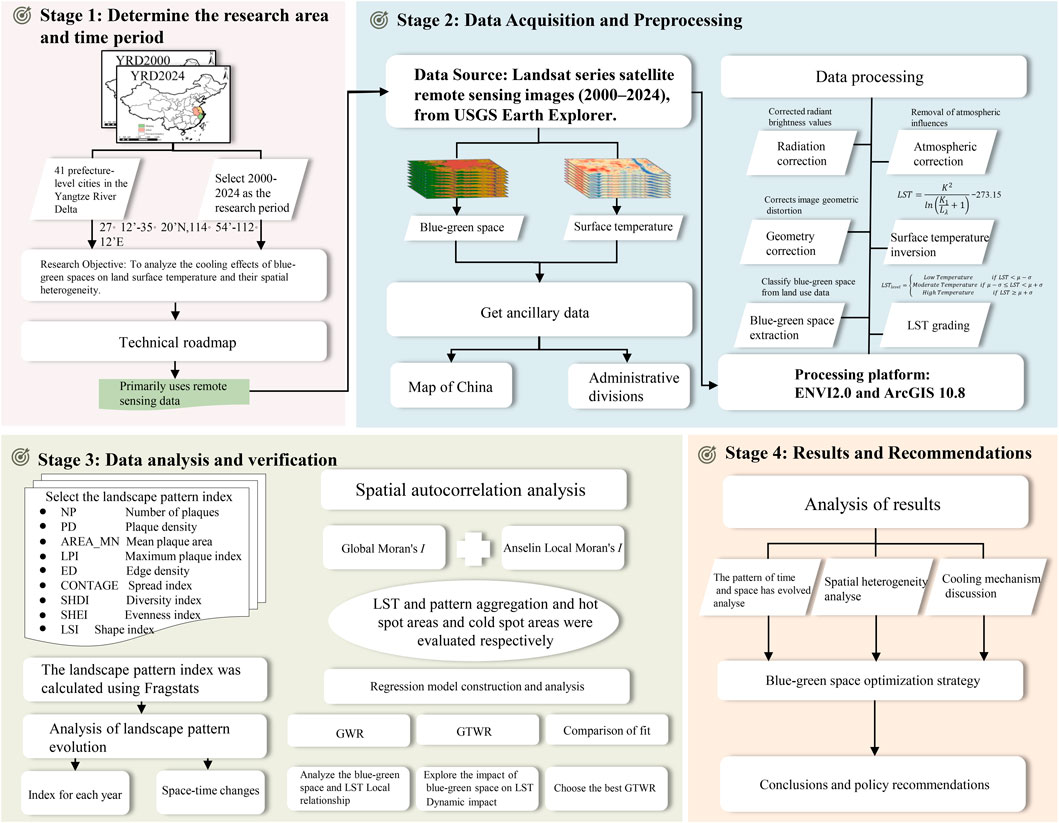
Figure 2. Research process flowchart.
3 Results
3.1 Analysis of the spatiotemporal pattern evolution of LST
This study conducted a systematic analysis of LST data from 41 prefecture-level cities in the YRD region from 2000 to 2024. By comparing the minimum (MIN), maximum (MAX), temperature range (RANGE), mean (MEAN), standard deviation (STD), and total (SUM) temperatures of each city, the study revealed the spatiotemporal trends of the urban heat island effect in the region (Figure 3; Figure 4).
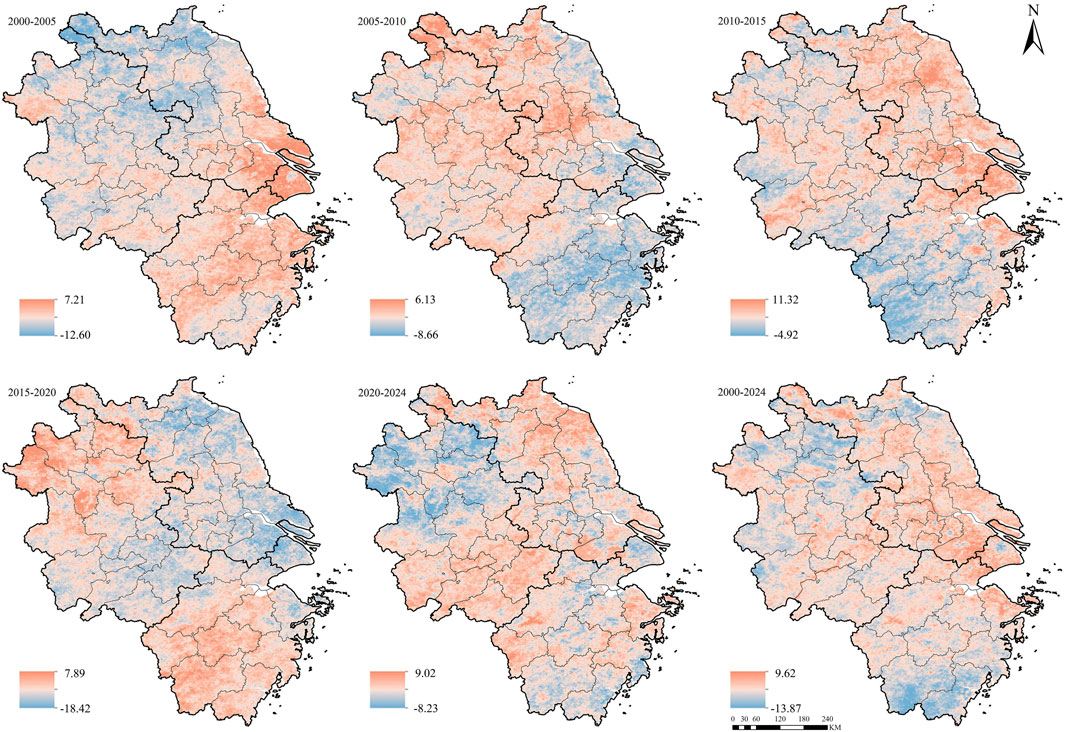
Figure 3. Spatio-temporal patterns of surface temperature: YRD, 2000–2024.
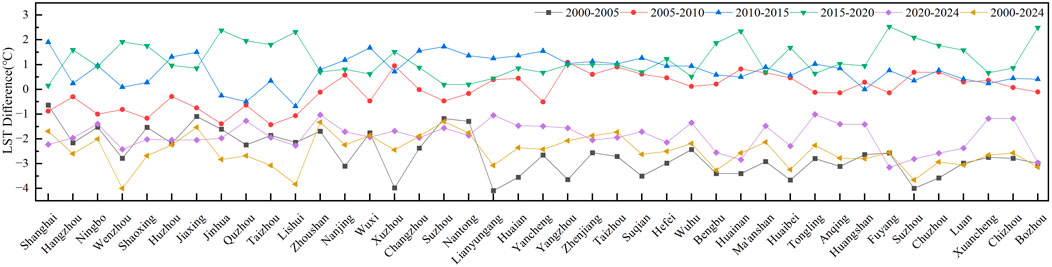
Figure 4. Spatio-temporal variations of LST Differences: YRD, 2000–2024.
Overall, the surface temperature in the YRD region increased from 2000 to 2024, with the most significant changes observed in major cities and economically developed areas, especially in 2020 and 2024. Most cities experienced an annual increase in surface temperature. For instance, Hefei in Anhui Province experienced an increase in mean temperature from 16.58 °C in 2000 °C to 28.08 °C in 2024. Meanwhile, fluctuations in maximum and minimum temperatures exhibit similar trends. Hefei’s maximum temperature was 29.7 °C in 2000 and increased to 31.61 °C by 2024. However, minimum temperatures in some cities, such as Nanjing and Changzhou, showed a slight increase between 2020 and 2024. This indicates that the intensity of the urban heat island effect varies across different regions.
Secondly, annual changes in the standard deviation and temperature range of surface temperatures reveal variability in surface temperatures. An increase in standard deviation usually means an expansion in the range of temperature variations, which reflects an increase in temperature differences between cities. For instance, Hefei’s temperature range increased from 13.12 °C in 2000 °C to 14.99 °C in 2024, reflecting a gradual increase in temperature differences between urban and suburban areas. This indicates a widening gap between urban centers and suburbs. Other cities, such as Wuxi, Nanjing, and Hangzhou, also showed an increasing trend in standard deviation over the years.
3.2 Spatio-temporal pattern evolution analysis of different LST levels
From 2000 to 2024, the proportion of low-temperature zones in cities throughout the YRD increased steadily. The sub-moderate temperature zone fluctuated and increased. The moderate temperature zone expanded significantly, rising by 55.78% in area proportion. Meanwhile, the sub-high temperature zone shrank significantly, with its proportion of the total area decreasing by 5.58%. The high-temperature zone gradually shrank. The temperature structure underwent a three-stage evolution: “medium-temperature dominance—expansion of the sub-high-temperature zone—adjustment of the medium-temperature zone” (Figure 5).
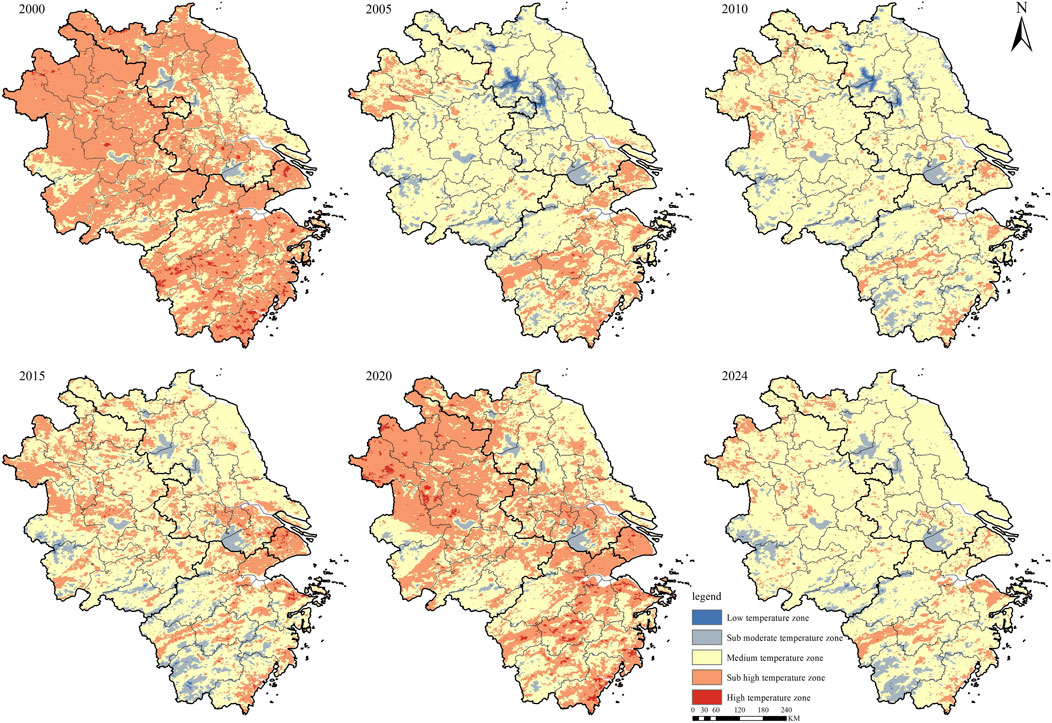
Figure 5. Spatio-temporal pattern evolution of surface temperature levels: YRD, 2000–2024.
In 2000, the sub-high-temperature zone dominated the YRD, accounting for 69.88% of the total area. Anhui Province had the largest sub-high-temperature zone, spanning approximately 110,000 square kilometers. In 2005, the proportion of the moderate-temperature zone in the YRD had increased by 48.98%. This zone was primarily concentrated in Anhui Province. The low-temperature zone also increased by 0.54%, primarily in Huai’an, Jiangsu Province. In 2010, the sub-high-temperature zone in the YRD continued to shrink, while the moderate-temperature zone continued to grow. In 2015, surface temperatures in the region had increased slightly, and the area of the sub-high-temperature zone had grown by 15.20%. The area of the moderate-temperature zone decreased. In 2020, the sub-high-temperature zone had grown by 41.16% compared to 2010. Meanwhile, the areas of the sub-medium-temperature and medium-temperature zones decreased significantly. In 2024, surface temperatures in the region decreased. Compared to 2020, the sub-high-temperature zone shrank by 142,000 square kilometers (a 41.06% decrease). Meanwhile, the proportion of the medium-temperature zone increased significantly by 129,300 square kilometers.
3.3 Spatio-temporal pattern evolution of blue-green space
From 2000 to 2024, the total area of blue-green spaces gradually changed. Green spaces have generally decreased in most cities, particularly in economically developed cities with accelerated urbanization. Changes in blue spaces have been more complex. For instance, Hefei’s green space area decreased from 9,665.44 km2 in 2000 to 5,726.63 km2 in 2024 due to urbanization, while changes in blue space were relatively minor. Some cities, such as Hangzhou and Wenzhou, saw an increase in blue space; however, this growth typically failed to offset the reduction in green space. This led to a more pronounced trend of overall ecological degradation (Figure 6).
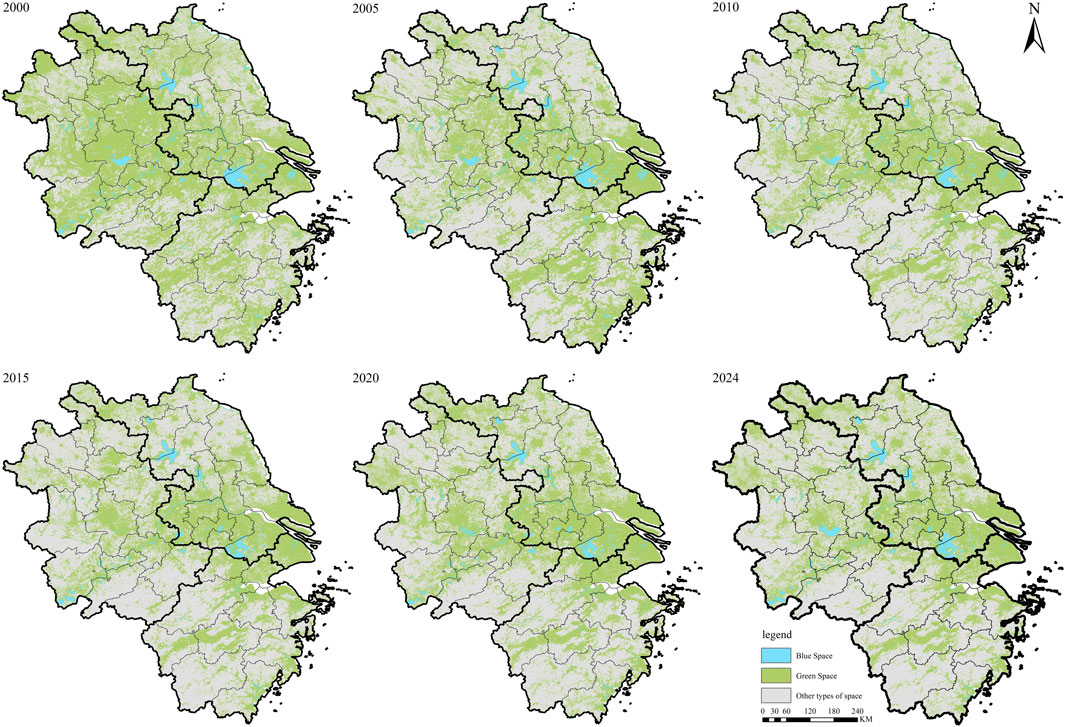
Figure 6. Spatio-temporal pattern evolution of blue-green space: YRD, 2000–2024.
Some cities experienced more dramatic changes in blue and green spaces. Anqing’s green space, for instance, shrank from 8,491 km2 in 2000 to 4,940.31 km2 in 2024, reflecting the compression of ecological space due to urban expansion in the region. Additionally, the ratio of blue and green spaces has changed in some cities, such as Hangzhou and Shanghai. Between 2000 and 2024, the ratio of blue and green spaces fluctuated significantly, with increases or decreases in blue spaces contrasting with reductions in green spaces. This further illustrates the ecological and environmental challenges the region faces during its modernization process.
3.4 Spatio-temporal evolution of the blue-green space landscape pattern index
During the study period, blue-green spaces became more fragmented, and the number of patches increased significantly. Indicators of spatial concentration, such as landscape fragmentation and maximum patch index, generally decreased. There is significant heterogeneity in the mean values and standard deviations of the landscape pattern index across different provinces and prefecture-level cities (Figure 7; Figure 8).
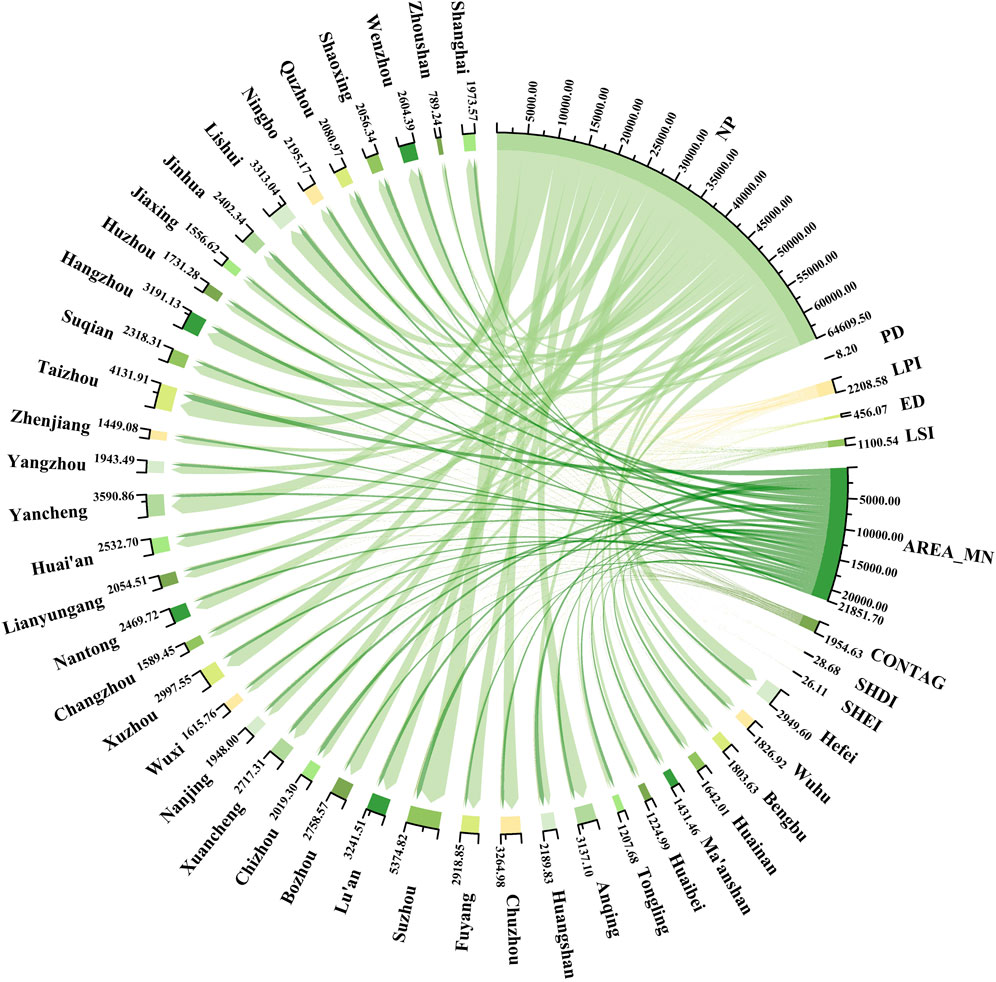
Figure 7. Mean values of landscape pattern indices: YRD, 2000–2024.
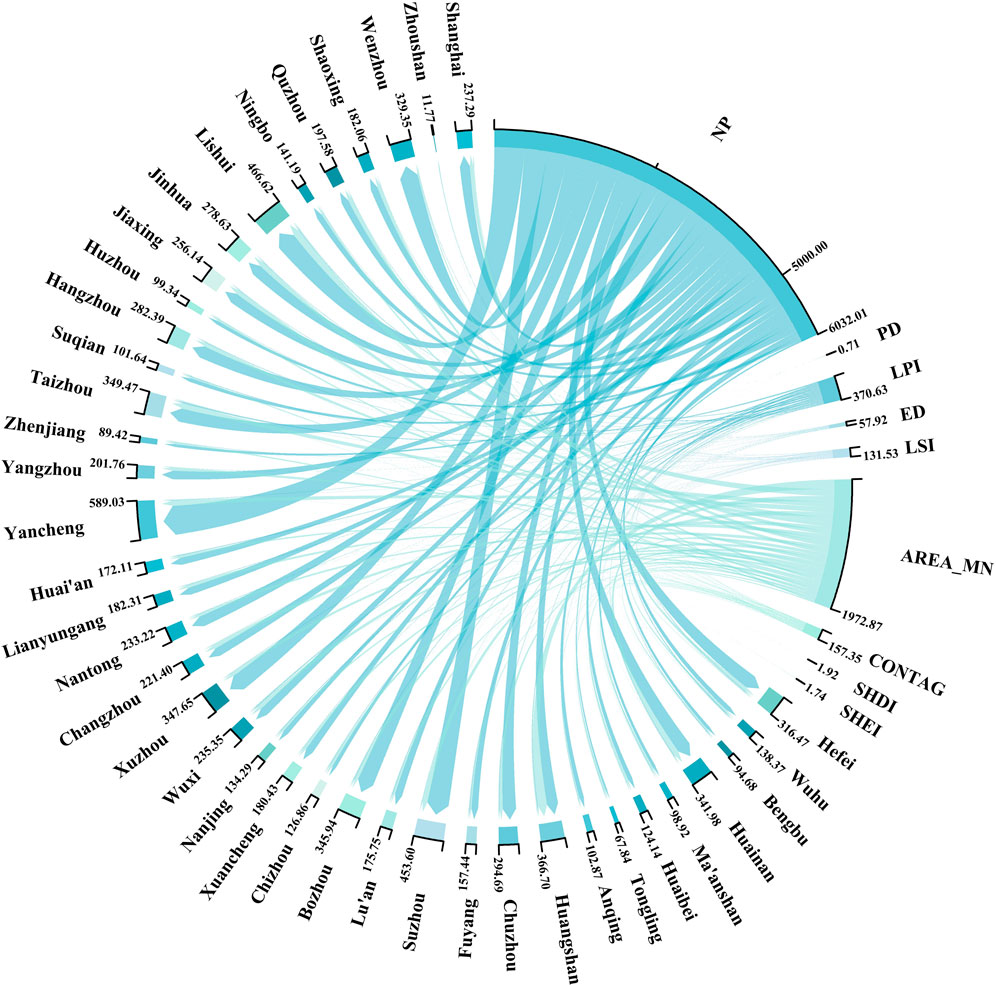
Figure 8. Standard deviation of landscape pattern index: YRD, 2000–2024.
For instance, Hefei in Anhui Province transitioned from fragmented blue-green spaces to recovered ones between 2000 and 2024. In 2000, Hefei’s LPI was 84.24. However, due to accelerated urbanization in subsequent years, the division and fragmentation of blue-green spaces gradually became evident. This resulted in the LPI dropping to 61.79 by 2005, a 26.6% decrease. Nevertheless, Hefei’s blue-green space pattern recovered in 2010, with the LPI rising to 60.57. Despite the continued increase in NP, the quality of blue-green spaces improved. By 2020, the LPI had risen again, reaching 63.19. The number of patches had slightly decreased, indicating that Hefei had optimized its ecological spaces despite urbanization.
Similar trends were observed in multiple cities across Jiangsu and Zhejiang provinces. For example, during the period from 2000 to 2005, the fragmentation of blue-green spaces in Suzhou was severe, with the LPI declining from 63.87 to 24.21, reflecting the significant degradation of these spaces. However, the LPI rebounded to 35.16 in 2010 and continued to increase, reaching 36.09 and 38.67 in 2015 and 2020, respectively. Throughout this period, although NP continued to grow, the overall quality of blue-green spaces improved.
Hangzhou is another typical case in Zhejiang Province. Between 2000 and 2005, the city’s LPI declined from 41.59 to 38.87 due to fragmentation of its blue-green spaces. After 2010, however, the quality of these spaces began to improve, with the LPI rising to 47.75 by 2020 and reaching 50.65.
The situation in Shanghai is relatively unique. As the core city of the YRD, it experienced significant compression and fragmentation of blue-green spaces between 2000 and 2024. During this period, Shanghai’s LPI decreased from 61.83 to 71.89, and the number of patches (NP) decreased from 1,598 to 1,144. In 2015, the LPI rebounded slightly to 70.24; however, overall, the quality of blue-green spaces did not significantly improve. By 2020, Shanghai’s LPI had risen to 73.08; however, it declined slightly again in 2024. Nevertheless, the number of patches (NP) gradually increased, indicating that Shanghai’s blue-green spaces remain under pressure from high-intensity urbanization.
3.5 Spatial autocorrelation between surface temperature levels and changes in landscape pattern index
A larger adjusted R2 value indicates a better model fit, as it corresponds to smaller AICc and RS values. A comparison of the GWR and GTWR models shows that the GTWR model has a higher adjusted R2 value, making it the optimal explanatory model (Table 2). Values with p < 0.05 were selected for visualization to analyze the range and extent of significant correlations among various indicators. Figures 9, 10 show the regression coefficients for changes in landscape indices, indicating that the impact of landscape index changes on LST grade changes exhibits spatial heterogeneity.
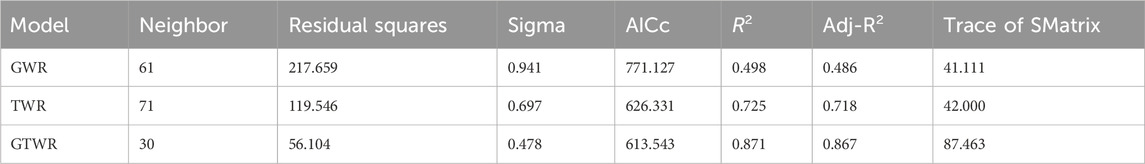
Table 2. Comparison of the goodness-of-fit of the GWR, TWR, and GTWR models.
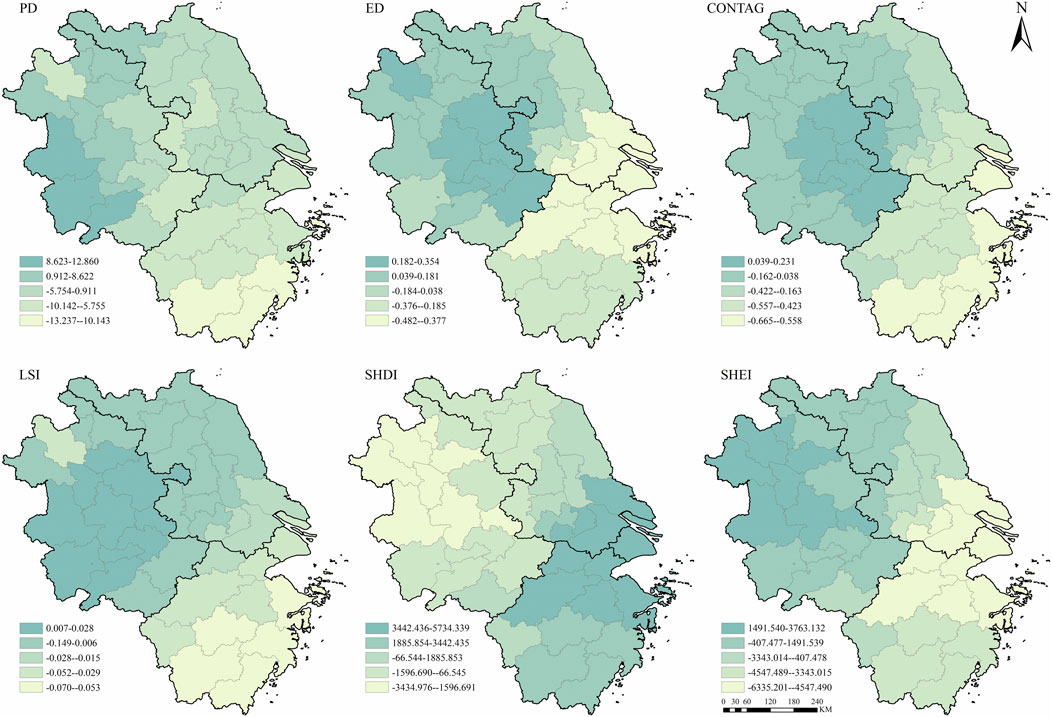
Figure 9. GTWR index: YRD 2000.
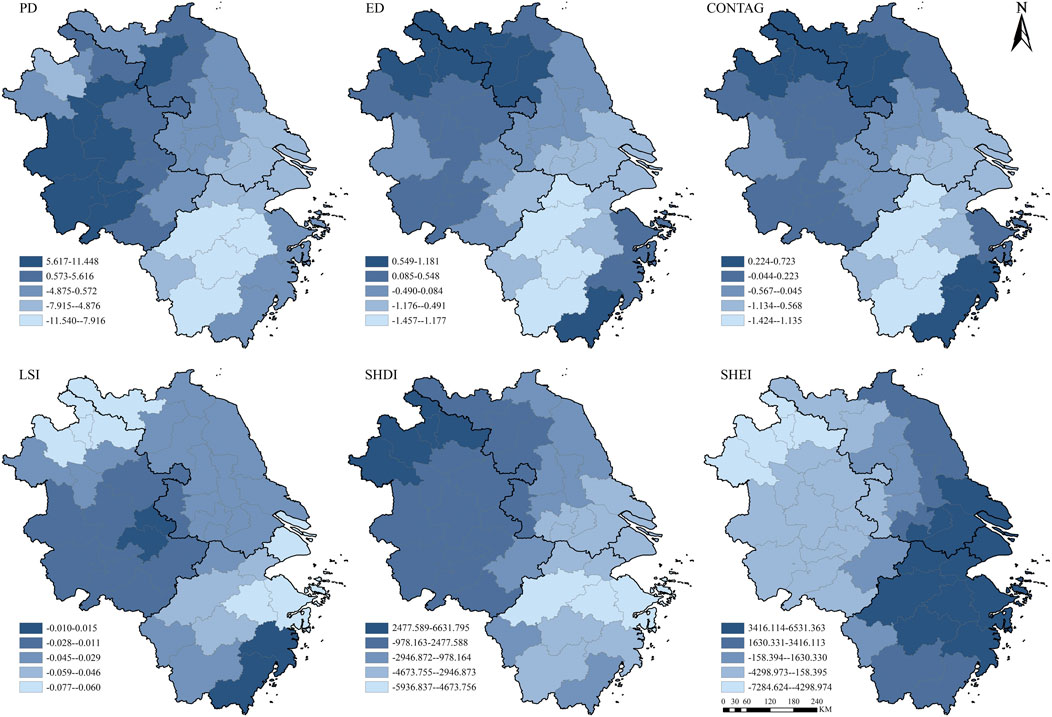
Figure 10. GTWR index: YRD 2024.
From a temporal perspective, the independent variables ED, CONTAG, SHDI, and SHEI have a greater impact on changes in LST levels, while PD and LSI have a smaller impact. From a spatial perspective, changes in surface temperature levels are significantly influenced by changes in indices such as PD, ED, CONTAG, LSI, SHDI, and SHEI.
In the southern part of the YRD, PD, ED, CONTAG, LSI, and SHDI are negatively correlated with changes in surface temperature levels. This means that a higher density of blue-green space patches, greater edge density, greater spread, greater shape complexity, and greater spatial diversity result in lower surface temperature levels. SHEI is positively correlated with changes in surface temperature levels. This means that the more complex the distribution of landscape types, the higher the surface temperature level. In the northwestern part of the YRD, PD, ED, CONTAG, and SHDI are positively correlated with changes in surface temperature levels. This means that higher landscape fragmentation, boundary complexity, connectivity, and diversity of landscape types correspond to higher surface temperature levels. LSI and SHEI are negatively correlated with changes in surface temperature, meaning that the more complex the landscape shape and distribution of landscape types are, the lower the surface temperature.
4 Discussion
4.1 Heterogeneity of landscape indices for urban blue-green spaces
Landscape indices of blue-green spaces in the YRD exhibit significant spatial heterogeneity in their influence on LST across southern and northwestern areas. In the southern regions (e.g., Shanghai, Suzhou, and Hangzhou), a higher PD, ED, CONTAG, LSI, and SHDI are associated with a lower LST. This suggests that greater fragmentation and diversity may contribute to a cooling effect. However, the SHEI is positively correlated with LST, suggesting that overly uniform landscape distribution may hinder cooling. In contrast, in northwestern regions (e.g., Hefei and Wuhu), PD, ED, CONTAG, and SHDI are positively correlated with LST. This indicates that high fragmentation levels may lead to increased LST. Meanwhile, LSI and SHEI are negatively correlated with LST. This suggests that complex shapes and uniform landscape distribution may aid in cooling (Li et al., 2023b).
The results show that an increase in urban blue-green space is associated with a decrease in regional surface temperature, while the temperature in areas of blue-green space degradation shows an upward trend. For instance, the blue-green spaces in Chuzhou, Anhui Province (Figure 11a) and Huai’an, Jiangsu Province (Figure 11b) underwent significant changes from 2000 to 2024, transforming into large areas of construction land. As the area and proportion of blue-green spaces decreased, the surface temperature increased, and the heat island effect intensified. This trend can be attributed to the loss of cooling services provided by green spaces. These spaces absorb sunlight and contribute to evapotranspiration, both of which are critical in lowering local temperatures (Li et al., 2024b). In Yancheng, Jiangsu Province (Figure 11c), the blue-green space area increased significantly. The cooling effect was enhanced, and the surface temperature decreased after large-scale greening and vegetation restoration. This decrease in surface temperature is due to an increase in evapotranspiration and the shading effect of the newly restored green areas. These factors help reduce the amount of heat retained by the urban surface (Wong et al., 2021). These results demonstrate that increasing the area and proportion of urban blue-green spaces significantly improves the urban thermal environment.
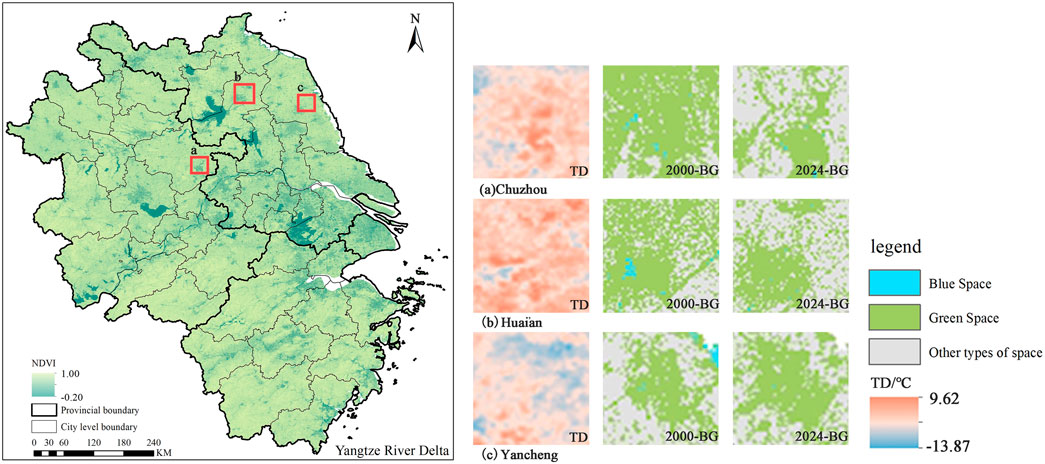
Figure 11. Areas where changes in blue-green space area have a significant impact on surface temperature [(a) Chuzhou, (b) Huai’an, (c) Yancheng].
This heterogeneity is likely related to the distribution of water bodies and urbanization patterns within the region. The southern region has many lakes and rivers, such as Taihu Lake and the Yangtze River. These bodies of water enhance the cooling effect of fragmented green spaces through evaporation and microclimate regulation. Not only do water bodies cool the surrounding environment directly through evaporation, they also provide moisture that enhances the cooling capacity of green spaces by boosting evapotranspiration (Qiu et al., 2017). Cui studied 375 green spaces and water bodies in the YRD and found that water bodies reduced the average daily temperature by 3.04 °C. This is significantly higher than the 0.57 °C reduction achieved by green spaces alone, indicating that water bodies have a stronger cooling effect in the southern region (Cui et al., 2023). In contrast, the northwestern region has fewer water bodies, such as smaller-scale ones near Hefei, and green spaces may require larger scales and higher connectivity to effectively cool the area. The lack of significant bodies of water in northwestern regions reduces the cooling effect of blue and green spaces, resulting in a reduced cooling potential for highly fragmented landscapes in these areas. Furthermore, vegetation types may influence cooling effects. Evergreen broadleaf forests (e.g., camphor trees) and subtropical bamboo forests in the south may be more effective than deciduous forests or shrubs in the north (Su et al., 2022; Zhang et al., 2023). Additionally, climatic factors, such as humidity, may enhance the cooling effect of blue-green spaces in southern regions (Li et al., 2023a). Higher humidity in the south contributes to higher evapotranspiration rates, increasing the cooling effect.
However, lower humidity in northwestern regions may limit evapotranspiration efficiency. This difference in humidity levels between regions contributes to the distinct cooling effects of green spaces across the YRD. Future research should quantify these contributions further to clarify the driving mechanisms behind such heterogeneity (Paschalis et al., 2021).
4.2 Mechanism of blue-green space on surface temperature
Blue-green spaces reduce LST through various mechanisms. Green spaces reduce direct solar radiation through shading, which lowers surface and air temperatures. Green spaces also release water vapor through evapotranspiration and absorb surrounding heat, thereby cooling the environment. Blue spaces, such as lakes and rivers, have high thermal capacity. They absorb large amounts of heat without significantly increasing temperature and provide continuous cooling effects through evaporation (Yang et al., 2020). Studies have shown that integrating blue-green spaces can produce significant synergistic effects. Liang et al.’s research on the cooling effect of green space in Beijing shows that scattered green space less than 9 ha has a strong connection with the health and wellbeing of local residents, and the cooling difference is as high as about 6 °C (Yan et al., 2021). Additionally, Yu et al. (2020) reviewed the cooling mechanisms of blue-green spaces. They noted that the threshold sizes of water bodies and green spaces are critical to cooling effects and that the degree of contact between riverside green spaces and water bodies, as well as river width, significantly influence cooling effects (Yu et al., 2020).
This study used the GTWR model to analysis the impact of landscape indices such as PD, ED and CONTAG on LST, revealing significant regional variations. Examining the regional differences in landscape patterns and their cooling effects can help to understand the mechanisms behind this spatial heterogeneity. In the southern part of the YRD, high fragmentation of blue-green spaces, indicated by higher PD and ED values, is associated with a cooling effect on surface temperature. This is because the fragmentation of green spaces in this region is often accompanied by the presence of numerous water bodies, which enhance evapotranspiration and provide additional moisture to the environment. These combined effects lead to the formation of multiple “cooling islands,” which effectively reduce the UHI effect (Nasar-U-Minallah et al., 2024). However, the reduction and fragmentation of green and blue spaces can be attributed to various urbanization drivers, including rapid urban expansion, changes in land use, and increased human activity, such as construction and infrastructure development (Biswas et al., 2025; Duan Z. et al., 2025). These factors often result in the conversion of green and blue spaces into built-up areas, reducing their size and connectivity. Furthermore, land-use policies and urban planning strategies may not priorities the protection and integration of green and blue spaces, exacerbating fragmentation (Perera et al., 2024). Additionally, converting green spaces into impervious surfaces reduces their natural cooling effect, rendering them less effective in mitigating the urban heat island effect (Han L. et al., 2024).
It is important to note that the cooling effects of blue-green spaces may be affected by anthropogenic heat emissions, which are common in urban areas. The urban heat island (UHI) effect is often exacerbated by human activities such as industrial processes, transport and energy consumption, all of which release substantial amounts of heat into the environment. If this heat is not accounted for, it could lead to an overestimation of the cooling effect of blue-green spaces (Wang et al., 2025). In contrast, the northwestern region, which has fewer water bodies and more fragmented landscapes, exhibits a different relationship. The same high fragmentation (PD and ED) in the northwestern part of the YRD leads to higher LST, as the lack of sufficient water bodies limits the cooling capacity of green spaces. Furthermore, the presence of anthropogenic heat in these areas could increase LST even further, thereby reducing the cooling effect of green spaces. In these areas, the cooling effect is hindered because green spaces alone, without the supplementary cooling from water bodies, are less effective in regulating temperature.
The mechanisms of the synergistic effects include the following.
1. Water bodies provide additional moisture to green spaces, enhancing evapotranspiration efficiency.
2. Green spaces stabilize temperatures around water bodies by regulating microclimates (e.g., reducing wind speed and increasing humidity).
3. The combination of blue and green spaces alters airflow patterns, promoting heat dispersion. The large green space has a stable cooling and humidification effect in summer, while the small green space has a variable cooling effect (Xiao et al., 2018). These findings are consistent with the results from the GTWR model, where the southern YRD showed a stronger negative correlation between fragmentation indices (e.g., CONTAG) and surface temperature, while the northern regions exhibited the opposite trend.
The cooling effect of blue-green spaces depends heavily on regional landscape characteristics. In the southern YRD, for example, water bodies play a crucial role in enhancing the cooling effect of fragmented green spaces. In contrast, in the northwestern region, the absence of water bodies leads to weaker cooling effects, even with high fragmentation.
4.3 Blue-green space optimization strategy
Based on research findings and regional differences, strategies for optimizing blue-green spaces must be tailored to local conditions. In water-rich southern regions, such as Shanghai and Suzhou, urban planning should prioritize integrating green spaces with water bodies. For instance, small green spaces could be arranged along riverbanks or lakeshores to take advantage of the evaporative cooling effect of water. Cui et al. (2023) found that water bodies in the YRD significantly reduce LST, suggesting synergistic effects can be enhanced through wetland restoration or constructing ecological shorelines, such as the 90% ecological shoreline target in the demonstration zone plan (Cui et al., 2023). Water bodies play a vital role in regulating LST (Xu et al., 2025),in northwestern regions with fewer water bodies, such as Hefei and Wuhu, priority should be given to constructing large, connected green spaces, such as urban parks or green corridors, to compensate for the lack of water-body cooling. Zhou et al. (2023) studied threshold strategies for green space planning under different climate conditions and proposed that optimizing landscape morphology can enhance cooling effects (Zhou et al., 2023). For instance, expanding green spaces to over 10 ha can extend the cooling distance to 300 m.
Improving the quality of green spaces is also crucial. Selecting vegetation with high NDVI values, such as evergreen broadleaf forests, and diverse plant species can enhance evapotranspiration efficiency and the cooling effect. Bartesaghi-Koc et al. (2020) discovered through their study in Rome that incorporating green spaces with water features can greatly enhance thermal comfort in public areas (Bartesaghi-Koc et al., 2020). Additionally, maintaining green spaces (e.g., through irrigation and pruning) ensures their long-term functionality. The optimized water body size, shape and integration with blue-green infrastructure can enhance the cooling effect of urban parks and promote sustainable urban renewal (Qiao et al., 2025). These strategies align with the objectives of the “2019 YRD Integration Development Plan Outline” and the “2021–2035 Demonstration Zone Ecological Environment Special Plan.” The demonstration zone, for example, aims to achieve a 12% forest coverage rate by 2035 and maintain wetland protection rates at 2020 levels, aligning with the study’s findings. This research provides a scientific basis for policy implementation and can serve as a benchmark for evaluating ecological protection outcomes.
5 Conclusion
From 2000 to 2024, the LST increased significantly in 41 prefecture-level cities in the YRD, particularly in cities such as Hefei and Nanjing. The UHI intensified during this period, and the average temperature increase was notably pronounced in these cities. The area of blue-green spaces decreased, and fragmentation intensified. The GTWR model revealed that blue-green space landscape indices (such as PD, ED, and CONTAG) have a spatially heterogeneous impact on LST. Highly fragmented blue-green spaces in the southern region may reduce LST, while highly fragmented blue-green spaces in the northwestern region may increase it.
Blue-green spaces mitigate the UHI effect through shading, evapotranspiration, and evaporative cooling. Integrating water bodies with green spaces can significantly enhance the cooling effect. In particular, integrating blue-green spaces in southern regions and constructing large-scale, connected green spaces in the northwest is recommended.
As some urban morphological data (e.g., various landscape pattern variables and elevation) and socioeconomic data (e.g., population density and GDP per capita) are only released annually, it is unlikely that this study will meet the requirements for a detailed analysis of LST variations at seasonal and daily scales. However, future research will comprehensively examine, quantify and categories the contributions of different blue-green space types (such as water bodies and green spaces) to the cooling effect at various levels. It will also explore cross-regional collaborative governance mechanisms to promote green, high-quality and sustainable urban development.
Data availability statement
The original contributions presented in the study are included in the article/supplementary material, further inquiries can be directed to the corresponding author.
Author contributions
XL: Formal Analysis, Conceptualization, Writing – review and editing, Data curation, Writing – original draft. CF: Validation, Writing – original draft, Formal Analysis, Resources, Software, Visualization. XS: Resources, Visualization, Investigation, Software, Writing – original draft. WL: Visualization, Resources, Software, Writing – original draft, Investigation. JL: Writing – original draft, Data curation, Validation. GB: Project administration, Supervision, Writing – review and editing, Conceptualization, Writing – original draft. FY: Writing – review and editing, Methodology, Writing – original draft, Funding acquisition, Supervision, Project administration.
Funding
The author(s) declare that no financial support was received for the research and/or publication of this article.
Conflict of interest
The authors declare that the research was conducted in the absence of any commercial or financial relationships that could be construed as a potential conflict of interest.
Generative AI statement
The author(s) declare that no Generative AI was used in the creation of this manuscript.
Any alternative text (alt text) provided alongside figures in this article has been generated by Frontiers with the support of artificial intelligence and reasonable efforts have been made to ensure accuracy, including review by the authors wherever possible. If you identify any issues, please contact us.
Publisher’s note
All claims expressed in this article are solely those of the authors and do not necessarily represent those of their affiliated organizations, or those of the publisher, the editors and the reviewers. Any product that may be evaluated in this article, or claim that may be made by its manufacturer, is not guaranteed or endorsed by the publisher.
References
Bartesaghi-Koc, C., Osmond, P., and Peters, A. (2020). Quantifying the seasonal cooling capacity of ‘green infrastructure types’ (GITs): an approach to assess and mitigate surface urban heat island in Sydney, Australia. Landsc. Urban Plan. 203, 103893. doi:10.1016/j.landurbplan.2020.103893
Bečić, D., and Gašparović, M. (2025). Urban heat islands and land-use patterns in Zagreb: a composite analysis using remote sensing and spatial statistics. Land 14 (7), 1470. doi:10.3390/land14071470
Bekele, N. K., Hailu, B. T., and Suryabhagavan, K. V. (2022). Spatial patterns of urban blue-green landscapes on land surface temperature: a case of addis Ababa, Ethiopia. Curr. Res. Environ. Sustain. 4, 100146. doi:10.1016/j.crsust.2022.100146
Biswas, P., Kumar, A., Upreti, M., Kumar, G., and Saikia, P. (2025). Kolkata’s green oasis: a comprehensive analysis of urban green spaces for ecosystem sustainability. Environ. Sci. Pollut. Res. 32 (9), 5040–5061. doi:10.1007/s11356-024-35756-8
Chen, R., Wang, C., Que, X., Liao, F. H., Ma, X., Wang, Z., et al. (2024). Exploring urban heat distribution and thermal comfort exposure using spatiotemporal weighted regression (STWR). Buildings 14 (6), 1883. doi:10.3390/buildings14061883
Chen, A., Chang, L., Zhao, P., Sun, X., Zhang, G., Li, Y., et al. (2025). Spatiotemporal variations and drivers of the ecological footprint of water resources in the yangtze river Delta. Water 17 (15), 2340. doi:10.3390/w17152340
Cui, Y., Guo, B., Li, W., and Kong, X. (2023). Assessment of urban blue-green space cooling effect linking maximum and accumulative perspectives in the yangtze river Delta, China. Environ. Sci. Pollut. Res. 30 (58), 121834–121850. doi:10.1007/s11356-023-30892-z
Duan, S., Chen, H., and Han, J. (2025a). Green innovation quality in center cities and economic growth in peripheral cities: evidence from the yangtze river Delta urban agglomeration. Systems 13 (8), 642. doi:10.3390/systems13080642
Duan, Z., Huang, L., Zhu, Z., Long, S., and Liu, Y. (2025b). Transformation and inequity of urban green space in guangzhou: drivers and policy implications under rapid urbanization. Sustainability 17 (5), 2217. doi:10.3390/su17052217
Han, D., Cai, H., Wang, F., Wang, M., Xu, X., Qiao, Z., et al. (2024a). Understanding the role of urban features in land surface temperature at the block scale: a diurnal cycle perspective. Sustain. Cities Soc. 111, 105588. doi:10.1016/j.scs.2024.105588
Han, L., Zhang, R., Wang, J., and Cao, S.-J. (2024b). Spatial synergistic effect of urban green space ecosystem on air pollution and heat island effect. Urban Clim. 55, 101940. doi:10.1016/j.uclim.2024.101940
Han, M., Zhang, T., and Si, Z. (2025). Optimizing urban blue-green space in climate adaptive planning: a systematic review of threshold value of efficiency thresholds. Landsc. Ecol. 40 (1), 13. doi:10.1007/s10980-024-02036-2
Huang, C., Liu, K., Ma, T., Xue, H., Wang, P., and Li, L. (2025). Analysis of the impact mechanisms and driving factors of urban spatial morphology on urban heat islands. Sci. Rep. 15 (1), 18589. doi:10.1038/s41598-025-04025-0
Li, Y., Li, Z. L., Wu, H., Zhou, C., Liu, X., Leng, P., et al. (2023a). Biophysical impacts of Earth greening can substantially mitigate regional land surface temperature warming. Nat. Commun. 14, 121. doi:10.1038/s41467-023-35799-4
Li, Y., Ren, C., Ho, J. Y. E., and Shi, Y. (2023b). Landscape metrics in assessing how the configuration of urban green spaces affects their cooling effect: a systematic review of empirical studies. Landsc. Urban Plan. 239, 104842. doi:10.1016/j.landurbplan.2023.104842
Li, D., Wang, L., Liao, W., Sun, T., Katul, G., Bou-Zeid, E., et al. (2024). Persistent urban heat. Sci. Adv. 10 (15), eadj7398. doi:10.1126/sciadv.adj7398
Li, Y., Svenning, J.-C., Zhou, W., Zhu, K., Abrams, J. F., Lenton, T. M., et al. (2024). Green spaces provide substantial but unequal urban cooling globally. Nat. Commun. 15 (1), 7108. doi:10.1038/s41467-024-51355-0
Li, G., Wang, W., Li, B., Duan, Z., Hu, L., and Liu, J. (2025). Spatiotemporal simulation of blue-green space pattern evolution and carbon storage under different SSP-RCP scenarios in wuhan. Sci. Rep. 15 (1), 4017. doi:10.1038/s41598-025-88299-4
Liu, J., and Wang, J. (2024). Research on the driving factors of PM_(2.5) in the yangtze river Delta based on GTWR model combined with geographical detector. Resour. Environ. Yangtze Basin 33 (1), 139–149. doi:10.11870/cjlyzyyhj202401012
Lv, G., Wang, Y., Ma, X., Han, Y., Luo, C., Yu, W., et al. (2025). Trade-offs and synergies of ecosystem services in terminal Lake basins of arid regions under environmental change: a case study of the ebinur Lake basin. Land 14 (6), 1240. doi:10.3390/land14061240
Nasar-U-Minallah, M., Haase, D., and Qureshi, S. (2024). Evaluating the impact of landscape configuration, patterns and composition on land surface temperature: an urban heat island study in the megacity lahore, Pakistan. Environ. Monit. Assess. 196 7, 627. doi:10.1007/s10661-024-12758-0
Norton, B. A., Coutts, A. M., Livesley, S. J., Harris, R. J., Hunter, A. M., and Williams, N. S. G. (2015). Planning for cooler cities: a framework to prioritise green infrastructure to mitigate high temperatures in urban landscapes. Landsc. Urban Plan. 134, 127–138. doi:10.1016/j.landurbplan.2014.10.018
Paschalis, A., Chakraborty, T., Fatichi, S., Meili, N., and Manoli, G. (2021). Urban forests as main regulator of the evaporative cooling effect in cities. AGU Adv. 2, e2020AV000303. doi:10.1029/2020AV000303
Peng, J., Liu, Q., Xu, Z., Lyu, D., Du, Y., Qiao, R., et al. (2020). How to effectively mitigate urban heat island effect? A perspective of waterbody patch size threshold. Landsc. Urban Plan. 202, 103873. doi:10.1016/j.landurbplan.2020.103873
Perera, A. C. S., Davies, P. J., and Graham, P. L. (2024). A global review of urban blue-green planning tools. Land Use Policy 140, 107093. doi:10.1016/j.landusepol.2024.107093
Pritipadmaja, P., Garg, R. D., and Sharma, A. K. (2023). Assessing the cooling effect of blue-green spaces: implications for urban heat island mitigation. Water 15 (16), 2983. doi:10.3390/w15162983
Qiao, Y., Sun, H., Qi, J., Liu, S., Li, J., Ji, Y., et al. (2025). Examining water bodies' cooling effect in urban parks with buffer analysis and random forest regression. Urban Clim. 59, 102301. doi:10.1016/j.uclim.2025.102301
Qiu, G. Y., Zou, Z., Li, X., Li, H., Guo, Q., Yan, C., et al. (2017). Experimental studies on the effects of green space and evapotranspiration on urban heat island in a subtropical megacity in China. Habitat Int. 68, 30–42. doi:10.1016/j.habitatint.2017.07.009
Shi, D., Song, J., Huang, J., Zhuang, C., Guo, R., and Gao, Y. (2020). Synergistic cooling effects (SCEs) of urban green-blue spaces on local thermal environment: a case study in chongqing, China. Sustain. Cities Soc. 55, 102065. doi:10.1016/j.scs.2020.102065
Shui, C., Shan, B., Li, W., Wang, L., and Liu, Y. (2025). Investigating the influence of land cover on land surface temperature. Adv. Space Res. 75 (3), 2614–2631. doi:10.1016/j.asr.2024.11.016
Su, Y., Wu, J., Zhang, C., Wu, X., Li, Q., Liu, L., et al. (2022). Estimating the cooling effect magnitude of urban vegetation in different climate zones using multi-source remote sensing. Urban Clim. 43, 101155. doi:10.1016/j.uclim.2022.101155
Tang, W. B., Zhou, J., Ma, J., Wang, Z. W., Ding, L. R., Zhang, X. D., et al. (2024). TRIMS LST: a daily 1 km all-weather land surface temperature dataset for China's landmass and surrounding areas (2000-2022). Earth Syst. Sci. Data 16 (1), 387–419. doi:10.5194/essd-16-387-2024
Uyan, M., and Ertunç, E. (2024). Investigating the impact of urban growth on land use using spatial autocorrelation methods in konya/Türkiye. Environ. Monit. Assess. 196 (8), 740. doi:10.1007/s10661-024-12911-9
Wang, W., He, J., and Yang, S. (2025). Planning for a cooler metropolitan area: a perspective on the long-term interaction of urban expansion, surface urban heat islands and blue-green spaces’ cooling impact. Int. J. Biometeorology 69 (2), 367–381. doi:10.1007/s00484-024-02814-2
Wong, N. H., Tan, C. L., Kolokotsa, D. D., and Takebayashi, H. (2021). Greenery as a mitigation and adaptation strategy to urban heat. Nat. Rev. Earth and Environ. 2 (3), 166–181. doi:10.1038/s43017-020-00129-5
Wu, C. X., Gao, P., Xu, R. R., Mu, X. M., and Sun, W. Y. (2024). Influence of landscape pattern changes on water conservation capacity: a case study in an arid/semiarid region of China. Ecol. Indic. 163, 112082. doi:10.1016/j.ecolind.2024.112082
Xiao, X., Dong, L., Yan, H., Yang, N., and Xiong, Y. (2018). The influence of the spatial characteristics of urban green space on the urban heat island effect in suzhou industrial park. Sustain. Cities Soc. 40, 428–439. doi:10.1016/J.SCS.2018.04.002
Xu, C., Wang, X., Hu, Y., Zou, Z., Zhu, Z., Li, M., et al. (2025). Global-local driving mechanisms of land surface temperature in cities along the Jiangsu section of the yangtze river. Hum. Settlements Sustain. 1 (3), 237–247. doi:10.1016/j.hssust.2025.08.001
Yan, L., Jia, W., and Zhao, S. (2021). The cooling effect of urban green spaces in metacities: a case study of beijing, China’s capital. Remote Sens. 13 (22), 4601. doi:10.3390/rs13224601
Yang, H., and Zeng, H. (2025). Impact of changes in blue and green spaces on the spatiotemporal evolution of the urban heat island effect in ningbo and its implications for sustainable development. Sustainability 17 (9), 4156. doi:10.3390/su17094156
Yang, G., Yu, Z., Jørgensen, G., and Vejre, H. (2020). How can urban blue-green space be planned for climate adaption in high-latitude cities? A seasonal perspective. Sustain. Cities Soc. 53, 101932. doi:10.1016/j.scs.2019.101932
Yu, Z., Yang, G., Zuo, S., Jørgensen, G., Koga, M., and Vejre, H. (2020). Critical review on the cooling effect of urban blue-green space: a threshold-size perspective. Urban For. and Urban Green. 49, 126630. doi:10.1016/j.ufug.2020.126630
Yu, S., Zhu, Z., Zhang, Z., Cai, S., Liu, F., Zhao, X., et al. (2024). Land surface temperature changes in different urbanization increments in China since 2000. Land 13 (4), 417. doi:10.3390/land13040417
Yuan, Y., Santamouris, M., Xu, D., Geng, X., Li, C., Cheng, W., et al. (2025). Surface urban heat island effects intensify more rapidly in lower income countries. Npj Urban Sustain. 5 (1), 11. doi:10.1038/s42949-025-00198-9
Zhang, Y., Murray, A. T., and Turner, B. L. (2017). Optimizing green space locations to reduce daytime and nighttime urban heat island effects in phoenix, Arizona. Landsc. Urban Plan. 165, 162–171. doi:10.1016/j.landurbplan.2017.04.009
Zhang, Y., Wang, Y. C., Ding, N., and Yang, X. Y. (2023). Assessing the contributions of urban green space indices and spatial structure in mitigating urban thermal environment. Remote Sens. 15 (9), 2414. doi:10.3390/rs15092414
Zhang, Z., Chang, Y., and Yao, C. (2025). The multiscale spatiotemporal heterogeneity of ecosystem service trade-Offs/Synergies and bundles and socioecological drivers in the yangtze river Delta region of China. Sustainability 17 (16), 7200. doi:10.3390/su17167200
Zhou, W., Yu, W., Zhang, Z.-Y., Cao, W., and Wu, T. (2023). How can urban green spaces be planned to mitigate urban heat island effect under different climatic backgrounds? A threshold-based perspective. Sci. total Environ. 890, 164422. doi:10.1016/j.scitotenv.2023.164422
Keywords: blue-green space, surface temperature, landscape pattern, cooling effect, YangtzeRiver delta
Citation: Li X, Fan C, Sun X, Li W, Lu J, Bao G and Yan F (2025) The unequal contribution of urban blue-green space to the cooling effect. Front. Environ. Sci. 13:1697649. doi: 10.3389/fenvs.2025.1697649
Received: 03 September 2025; Accepted: 09 October 2025;
Published: 24 October 2025.
Edited by:
Bao-Jie He, Chongqing University, ChinaReviewed by:
Kun Jia, Shandong Jianzhu University, ChinaKe Xiong, China Three Gorges University, Yichang, China
Copyright © 2025 Li, Fan, Sun, Li, Lu, Bao and Yan. This is an open-access article distributed under the terms of the Creative Commons Attribution License (CC BY). The use, distribution or reproduction in other forums is permitted, provided the original author(s) and the copyright owner(s) are credited and that the original publication in this journal is cited, in accordance with accepted academic practice. No use, distribution or reproduction is permitted which does not comply with these terms.
*Correspondence: Guanglong Bao, MDA3MTY0QHl6dS5lZHUuY24=