 Ghada A. Khdery1*
 I. M. El-Metwally2
 Mohamed S. Shokr3Jose Emilio Meroño de Larriva4Ali Abdullah Aldosari5*
- 1National Authority for Remote Sensing and Space Sciences (NARSS), Cairo, Egypt
- 2Botany Department, National Research Centre, Cairo, Egypt
- 3Soil and Water Department, Faculty of Agriculture, Tanta University, Tanta, Egypt
- 4Department of Graphic Engineering and Geomatics, University of Cordoba, Cordoba, Spain
- 5Geography Department, College of Humanities and Social Sciences, King Saud University, Riyadh, Saudi Arabia
Introduction: Zinc (Zn) deficiency is a major limiting factor for crop productivity, particularly in sandy soils where nutrient retention and bioavailability are poor. The field experiment was conducted at the Agricultural Experimental Station, Cairo University (Giza, Egypt) during the 2022–2024 winter seasons. This study aimed to analyze the spectral responses of faba bean (Vicia faba L.) under different foliar Zn concentrations (0, 0.5, 1.0, 1.5, and 2.0 g L−1 ZnSO4·7H2O) using a Randomized Complete Block Design (RCBD) with three replications, and to identify vegetation indices sensitive to Zn nutrition.
Methods: Growth traits, biochemical attributes, seed yield, hyperspectral reflectance, and soil spectral properties were integrated to establish robust vegetation–soil indicators.
Results and discussion: Foliar Zn application increased chlorophyll content by 24.5%, protein by 18.3%, and seed yield by 27.6% compared with the control (p ≤ 0.05). Results revealed that foliar Zn application significantly enhanced chlorophyll content, protein accumulation, soluble sugars, and seed yield, with the optimum response observed at 2.0 g L−1. Spectral signatures demonstrated that Zn enrichment decreased red reflectance (∼670 nm), sharpened the red-edge slope (700–750 nm), and increased near-infrared reflectance (∼800 nm), indicating improved canopy structure and photosynthetic activity. Vegetation indices such as Normalized Difference Vegetation Index (NDVI), Green NDVI (GNDVI), Photochemical Reflectance Index (PRI), Normalized Difference Red-Edge Index (NDRE), Red-Edge Position (REP), and Modified Chlorophyll Absorption Ratio Index (MCARI) were highly responsive to Zn levels, showing strong correlations with physiological traits and closely aligned with growth and yield performance. Soil-based spectral indices, including the Clay Ratio Index (CRI) and the Normalized Difference Soil Index (NDSI), also differentiated among soil samples, linking soil spectral features with Zn-associated crop responses. These findings confirm that hyperspectral reflectance and derived indices provide reliable, non-destructive tools for monitoring Zn nutrition in faba bean. The integration of spectral traits with agronomic and biochemical data emphasizes the potential of hyperspectral sensing for optimizing micronutrient management in sandy soils. Moreover, the outcomes highlight the role of hyperspectral tools in precision agriculture, enabling site-specific nutrient strategies that enhance productivity, resource-use efficiency, and sustainable food security.
1 Introduction
Faba bean (Vicia faba L.) is a vital legume crop globally, recognized for its high protein content, nitrogen-fixing ability, and multifunctional roles in sustainable agriculture systems. It is emerging as a valuable source of plant-based bioactive compounds—including antioxidants and functional peptides—and its adaptability to diverse agro-environments underscores its importance amid growing food and nutrition security concerns. Recent projections estimate global dry faba bean production at over 7 million tonnes in 2022, with substantial utilization in temperate and Mediterranean diets (Martineau-Côté et al., 2022). In Egypt, faba bean serves as a key winter crop, yet its cultivated area and productivity have declined, calling for improved agronomic strategies to close the production gap (Singh et al., 2013). However, faba bean cultivation in sandy soils presents serious challenges. Such soils prevalent in many Egyptian agricultural zones are characterized by low water retention, poor nutrient availability, high leaching potential, and elevated pH/calcium carbonate levels that reduce the bioavailability of key micronutrients like zinc (Zn). Zn deficiency remains a widespread soil constraint, severely limiting legume growth and yield under such conditions (Kihara et al., 2020; Abdel Kader, 2025). Zinc plays a pivotal role in plant physiological and biochemical processes, including chlorophyll synthesis, enzyme activation, hormone regulation, and protein metabolism. Zn deficiency leads to reduced chlorophyll, impaired photosynthesis, stunted growth, and lower yields. Conversely, Zn supplementation can restore chlorophyll levels, enhance sugar production, and improve yield and water-use efficiency in legumes (Gupta et al., 2024).
Despite significant progress in understanding Zn nutrition in legumes, most existing studies have focused on conventional agronomic or physiological responses, while few have integrated hyperspectral indicators to diagnose Zn-related variations under field conditions (Vukadinović et al., 2025). This gap is particularly evident for faba bean grown in sandy soils, where micronutrient limitations remain underexplored in relation to spectral behavior (Vidican et al., 2023; Bourriz et al., 2025). Therefore, combining hyperspectral reflectance with biochemical and yield data provides an innovative path for precise Zn assessment and management.
Remote sensing especially hyperspectral reflectanceprovides a powerful, non-destructive method for monitoring plant nutrient status. Narrow-band vegetation indices derived from visible to near-infrared (VNIR) wavebands (such as NDVI, NDRE, GNDVI, PRI, MCARI, and red-edge position indices) are highly sensitive to changes in leaf pigments and canopy structure (Clemente et al., 2023). Moreover, indices cantered on the red-edge region reduce saturation issues common with broadband indices (Khdery, 2020). These spectral tools are increasingly integral to precision agriculture approaches that aim to optimize fertilization at sub-field scales (Sishodia et al., 2020; Belgiu et al., 2023).
Vegetation indices have been developed as effective tools to assess plant condition, map land cover, analyse seasonal growth dynamics, monitor the impacts of climate and land-use changes, and evaluate drought stress (Padilla et al., 2011). In the field of remote sensing, several indices have been proposed, with the Normalized Difference Vegetation Index (NDVI) standing out as the most widely applied in global research on environmental and climatic change (Bhandari et al., 2012). NDVI is derived from the contrast between reflectance in the red and near-infrared regions, providing a sensitive measure of canopy greenness and photosynthetic activity (Khdery et al., 2025). Recent studies underscore the value of hyperspectral monitoring for nutritional diagnostics in crops. For instance, hyperspectral imaging has accurately predicted protein content in faba bean-fortified products, while multi-spectral satellite data (e.g., Sentinel-2) has been used to monitor faba bean growth in Egypt (Fouda and Abdelsalam, 2024). These applications affirm the potential for translating spectral data into agronomic insights in legumes. Nevertheless, despite these advances, research specifically linking Zn nutrition to hyperspectral vegetation indices in faba bean under sandy soils remains limited. Most Zn deficiency studies in legumes focus on physiological traits or conventional agronomy, with few integrating canopy spectral traits to diagnose Zn status. This gap is particularly relevant to Egyptian environments, where faba bean yields remain suboptimal due to micronutrient limitations (Hasan et al., 2023). Accordingly, we hypothesized that foliar zinc sulfate (ZnSO4·7H2O) applications would induce measurable spectral and biochemical changes in faba bean canopies, which can be quantitatively detected using hyperspectral vegetation indices.
The specific objectives were to (1) characterize the canopy hyperspectral signatures of faba bean under graded foliar Zn treatments in sandy soil, (2) identify the most Zn-sensitive vegetation indices linking spectral responses with biochemical and yield parameters, and (3) evaluate the feasibility of integrating hyperspectral diagnostics into precision Zn management frameworks.
To guide this investigation, three measurable hypotheses were formulated:
1. Foliar application of ZnSO4·7H2O enhances growth, yield, and biochemical composition of faba bean grown under sandy soil conditions.
2. Hyperspectral vegetation indices (NDVI, GNDVI, NDRE, PRI, and MCARI) can sensitively detect Zn-induced variations in canopy physiology and pigment content.
3. Integrating hyperspectral indicators with agronomic and biochemical data enables reliable discrimination of Zn nutrition levels and supports precision Zn management in sandy-soil systems.
2 Materials and methods
2.1 Experimental site and design
Two field experiments were conducted during the two successive seasons (2023/24 and 2024/25) at the Experimental Research and Production Station of the National Research Centre (NRC), Nubaria region, Egypt (latitude 30°30′N, longitude 30°18′E, 21 m above sea level) (Figure 1). The station is located in an arid zone characterized by hot, dry summers and mild winters. The soil of the experimental site is classified as sandy soil, with low fertility and limited water-holding capacity. The detailed physical and chemical characteristics of the soil during the two growing seasons are presented in Table 1.

Figure 1. Location map of the experimental site (Nubaria region, Egypt).

Table 1. Physical and chemical analysis of the experimental soil in 2023/24 and 2024/25 seasons.
The experiment was arranged in a randomized complete block design (RCBD) with four replicates. Treatments included four foliar zinc concentrations (0.5, 1.0, 1.5, and 2.0 g L-1 ZnSO4·7H2O), and plots were randomly assigned within each block to minimize field heterogeneity and edge effects. Each replicate (plot) contained approximately 30–35 plants, from which five were randomly selected for spectral and biochemical analyses. Zinc sulfate (ZnSO4·7H2O) was applied as a foliar spray at 35 and 50 days after sowing (DAS) using a hand-held sprayer until full leaf wetness.The same layout was maintained across the two successive growing seasons (2023/24 and 2024/25). Each plot measured 3.5 × 3.0 m, and all agronomic practices were uniformly applied. Similar RCBD-based designs for zinc foliar application under sandy soil conditions. The experimental soil was classified as sandy, characterized by low organic matter and moderate salinity. The same experimental layout was maintained across both seasons, and all agronomic practices were uniformly applied following local recommendations for faba bean cultivation under sandy-soil conditions.
2.2 Crop husbandry
Before sowing, the field was deep ploughed, disk-harrowed, and leveled. Each experimental plot measured 3.5 × 3.0 m. Certified faba bean (V. faba) seeds were inoculated with the specific Rhizobium strain before sowing. Seeds were sown in hills 25 cm apart on both sides of ridges at a seeding rate of 100 kg ha−1. Planting dates were 15 November 2023 and 20 November 2024 for the two respective seasons. All plots received uniform basal fertilization. Nitrogen was applied as ammonium nitrate (33.5% N) at 50 kg N ha−1 at 20 DAS. Phosphorus was supplied as single superphosphate (15.5% P2O5) at 357 kg ha−1 during land preparation. Potassium was applied as potassium sulfate (48% K2O) at 150 kg ha−1 at 35 DAS. Standard cultural practices for weed, pest, and disease management were followed.
2.3 Growth traits
At 80 DAS, five plants were sampled randomly from each plot to determine:
1. Plant height (cm).
2. Stem dry weight (g).
3. Leaf dry weight (g).
4. Leaf chlorophyll content using a SPAD-502 m (Konica Minolta, Osaka, Japan).
5. Leaf area index (LAI).
This sample size was chosen as it provides a representative estimate of within-plot variability while maintaining operational feasibility for field spectral measurements.
2.4 Yield and yield attributes
At harvest, the following parameters were measured from central ridges of each plot:
1. Number of pods plant−1.
2. Pod dry weight plant-1 (g).
3. Seed weight plant−1 (g).
4. 100-seed weight (g).
5. Seed yield (t ha−1).
2.5 Seed chemical composition
1. Total soluble carbohydrates were determined as described by Bogdan et al., Slominski et al. (1993).
2. Total nitrogen was determined following (A.O.A.C, 1990), and crude protein was calculated as N × 6.25. Zinc content in seeds was measured according to Cottenie et al. (1982).
2.6 Spectral data collection and indices calculation
Canopy spectral reflectance of faba bean plants was measured at 80 days after sowing (DAS), coinciding with the vegetative stage at which nutrient effects are most pronounced. Measurements were taken under clear sky conditions between 10:00 and 12:00 local time to minimize solar angle variation. A portable spectroradiometer (ASD FieldSpec® 4, Analytical Spectral Devices Inc., Boulder, CO, United States), covering the 350–1,200 nm spectral range with a 1-nm sampling interval, was used. The instrument was calibrated against a white Spectralon® reference panel before each set of measurements.
For each treatment plot, canopy reflectance was recorded from five randomly selected plants and averaged to represent plot-level reflectance. The fiber optic probe was held at nadir (0° angle) at 50 cm above the canopy with a 25° field of view, ensuring adequate coverage of the plant canopy while minimizing soil background effects.
Prior to calculating the vegetation indices, the raw reflectance spectra were pre-processed to minimize noise and ensure signal reliability. The spectral data were calibrated against a white Spectralon® reference panel before each set of measurements, and the noisy regions below 400 nm and above 1,200 nm were excluded from analysis. The reflectance curves were smoothed using a moving average filter to reduce random fluctuations and normalized reflectance values were used for index computation. The mean reflectance of five randomly selected plants per treatment was computed to represent the canopy-level response.
For the optimal zinc sulfate treatment, seven individual plant samples were measured to capture within-plot variability, and their averaged spectral signature was used for subsequent index computation and statistical analysis.
From the reflectance data, a series of vegetation and soil indices (VIs) known to be sensitive to pigment content, canopy structure, and nutrient status were computed (Tables 2, 3). These included conventional broadband indices as well as narrow-band indices exploiting the red-edge region, which is particularly sensitive to micronutrient stress.

Table 2. Vegetation indices employed in this study, their mathematical formulations, and relevant references.

Table 3. Soil indices used in this study, their equations, references, and sensitivities.
These indices were selected because they capture different spectral regions:
• Visible (550–670 nm): sensitive to chlorophyll absorption.
• Red-edge (700–740 nm): highly responsive to stress and nutrient status.
• Near-infrared (780–800 nm): correlated with canopy density and structure.
Thus, combining indices enhances the ability to discriminate Zn nutrition effects in faba bean under sandy soil conditions.
2.7 Statistical analysis
All agronomic, spectral, and biochemical data were analyzed using the one-way analysis of variance (ANOVA) model in JMP® Pro 16 software (SAS Institute Inc., Cary, NC, United States). Zinc sulfate concentration was considered as the main factor, and treatment means were compared using Fisher’s Least Significant Difference (LSD) and Tukey–Kramer tests at significance levels of p ≤ 0.05 and p ≤ 0.01. Results are presented as means ± standard deviation (SD), while graphical outputs include error bars representing the standard error (SE) to visualize variability among replicates.
Additionally, Pearson’s correlation coefficients (r) were calculated to quantify relationships between spectral vegetation indices (e.g., NDVI, PRI, NDRE) and physiological or biochemical parameters (SPAD, protein, sugars, and Zn content). Correlations were considered significant at p < 0.05. These procedures followed standardized approaches for evaluating spectral–biochemical interactions in agronomic datasets.
3 Results
3.1 Growth traits of faba bean at 80 DAS as affected by zinc concentrations (2023/24–2024/25 seasons)
Table 4 shows the average growth parameters of faba bean plants at 80 days after sowing (DAS) as affected by different concentrations of zinc sulfate (ZnSO4·H2O, 35% Zn) during the 2023/24 and 2024/25 seasons. Application of zinc sulfate significantly improved all recorded growth traits compared with the untreated control. Plant height, stem dry weight, leaf dry weight, SPAD values, and LAI increased progressively with higher concentrations of foliar-applied zinc sulfate. The highest values were consistently observed at 2.0 g ZnSO47H2O L-1, which recorded 4.43–4.55 for LAI, 42.4–43.2 for SPAD, 32.22–33.54 g for leaf dry weight, 35.52–38.74 g for stem dry weight, and 73.42–80.35 cm for plant height across the two seasons. Thus, 2.0 g ZnSO47H2O L-1 can be considered the optimal foliar concentration for enhancing vegetative growth of faba bean under sandy soil conditions.

Table 4. Mean (±SD) of faba bean growth traits at 80 days after sowing (DAS) as affected by zinc concentrations during the 2023/24 and 2024/25 seasons (p ≤ 0.05).
Values represent the means of four replicates (± standard deviation). Differences among ZnSO4·7H2O treatments were significant according to one-way ANOVA (Table 4). LSD at 5% and 1% levels are indicated.
The canopy spectral reflectance patterns of faba bean plants (Figure 2) supported the growth results shown in Table 4. Control plants displayed the highest reflectance in the visible region (400–700 nm), reflecting their lower chlorophyll content and weaker photosynthetic capacity. With increasing zinc sulfate concentrations, particularly at 1.5 and 2.0 g ZnSO4·7H2O L-1, reflectance in the visible region declined markedly, indicating enhanced pigment accumulation and improved chlorophyll status. In contrast, in the near-infrared (NIR) region (700–1,200 nm), treated plants exhibited progressively higher reflectance values compared to the control. This pattern reflects greater leaf area index (LAI), enhanced canopy density, and improved internal leaf structure. The spectral “fingerprints” clearly separated the treatments, with the 2.0 g ZnSO4·7H2O L-1 treatment showing the most pronounced divergence—aligning with its superior growth traits (highest LAI, SPAD, biomass, and plant height).These findings highlight the sensitivity of canopy reflectance to zinc nutrition, where both visible and NIR regions provided reliable signatures of physiological responses, confirming the potential of hyperspectral sensing for early and accurate detection of Zn status in faba bean plants.

Figure 2. Spectral reflectance of faba bean plants under different ZnSO4 concentrations at 80 DAS.
The one-way ANOVA (Figure 3) revealed significant (p ≤ 0.05) differences among zinc sulfate concentrations across the blue, green, near-infrared (NIR), and red bands. Reflectance values in the blue and green regions decreased progressively with increasing zinc concentration, indicating stronger chlorophyll absorption and enhanced pigment density under zinc application. In contrast, the NIR reflectance increased markedly, reflecting improved internal leaf structure and canopy vigor, while the red band followed a similar decreasing trend to the blue–green region. The treatment of 1.0 g L-1 ZnSO4·7H2O consistently recorded the lowest reflectance in the visible spectrum and the highest in NIR, confirming it as the optimum concentration for improving pigment accumulation, structural integrity, and overall photosynthetic efficiency of faba bean plants grown under sandy soil conditions.

Figure 3. ANOVA of spectral reflectance bands (blue, green, red, NIR) under ZnSO4 treatments (p ≤ 0.05).
The statistical analysis confirmed that all growth parameters were significantly affected by ZnSO4·7H2O concentration (p ≤ 0.05), as shown in the corresponding ANOVA summary (Table 5). These results verify the reliability of the observed increases in LAI, SPAD, and biomass with increasing zinc levels.

Table 5. One-way ANOVA for growth traits of faba bean as affected by ZnSO4 concentrations (2023/24–2024/25 seasons).
A set of vegetation indices derived from canopy reflectance was used to evaluate the spectral response of faba bean plants to foliar application of zinc sulfate (ZnSO4·7H2O). These indices provided quantitative confirmation of the physiological and structural improvements observed in growth traits (Table 6).

Table 6. Vegetation indices of faba bean growth traits as influenced by foliar application of zinc sulfate (ZnSO4) concentrations.
NDVI (Normalized Difference Vegetation Index): NDVI values increased markedly from 0.61 in the control to 0.74 under 2.0 g L-1 ZnSO4·7H2O. This increment reflects enhanced chlorophyll density and canopy greenness, consistent with the higher SPAD values and LAI observed under ZnSO4·7H2O treatments. GNDVI (Green NDVI): GNDVI rose from 0.55 in the control to 0.70 at 2.0 g L-1 ZnSO4·7H2O. This trend indicates improved chlorophyll concentration, as GNDVI is particularly sensitive to the green region of the spectrum, confirming the role of zinc in pigment biosynthesis and nutrient uptake. NDRE (Normalized Difference Red Edge): NDRE showed a progressive increase from 0.42 in the control to 0.63 at 2.0 g L-1 ZnSO4·7H2O. The red-edge region is highly responsive to chlorophyll variation, and this result highlights the capacity of NDRE to detect micronutrient-induced physiological improvements before they are visible in broadband indices. PRI (Photochemical Reflectance Index): PRI values doubled across treatments, increasing from 0.021 in the control to 0.045 under 2.0 g L-1 ZnSO4·7H2O. This significant change reflects improved photosynthetic light-use efficiency and greater capacity for photochemical energy conversion under adequate zinc nutrition. MCARI (Modified Chlorophyll Absorption Ratio Index): MCARI increased strongly from 1.12 in the control to 2.05 under 2.0 g L-1 ZnSO4·7H2O. This pronounced rise demonstrates the enhancement of pigment absorption and canopy vigor, confirming the ability of MCARI to discriminate nutrient-induced differences in faba bean plants.
Overall, the spectral indices clearly separated the control from zinc-treated plants, with consistent upward trends across all indices. The maximum values were consistently recorded at 2.0 g L-1 ZnSO4·7H2O, establishing this concentration as the optimal treatment under sandy soil conditions.
Moreover, correlation analysis showed that NDVI and GNDVI were strongly associated with SPAD and LAI values (r > 0.85), while NDRE and MCARI were particularly sensitive in detecting subtle physiological responses. Statistical analysis confirmed that the differences among treatments were significant at p ≤ 0.05. These findings demonstrate that vegetation indices derived from canopy reflectance provide a reliable, non-destructive tool to monitor zinc nutrition in faba bean, and their strong correlations with growth parameters validate their agronomic relevance. Importantly, such hyperspectral indicators can be integrated into precision agriculture systems for real-time monitoring and targeted Zn management in sustainable faba bean production.
3.2 Yield attributes of faba bean at harvest as affected by zinc sulfate concentrations (2023/24–2024/25 seasons)
Table 7 shows the averages of yield attributes of faba bean plants at harvest as influenced by foliar application of zinc sulfate (ZnSO4·H2O, 35% Zn) during the 2023/24 and 2024/25 seasons. Foliar application of ZnSO4·7H2O significantly enhanced all measured yield traits compared with the untreated control. Plant height, number of pods per plant, pod weight per plant, seed weight per plant, and 100-seed weight increased progressively with higher ZnSO4·7H2O concentrations, confirming the essential role of zinc in improving reproductive growth and yield formation.

Table 7. Mean (±SD) of yield attributes of faba bean plant at harvest as affected by zinc concentrations during 2023/24 and 2024/25 seasons (p ≤ 0.05).
Plant height increased from 85.7 to 83.2 cm in the control to 97.9–93.2 cm with 2.0 g ZnSO4·7H2O L−1. Similarly, the number of pods per plant improved from 29.6 to 27.8 pods in the control to 42.7–39.1 pods at 2.0 g ZnSO4·7H2O L−1. Pod weight per plant rose from 37.1 to 36.2 g in the control to 46.2–43.9 g under the highest ZnSO4·7H2O treatment, while seed weight per plant increased from 39.9–37.8 g to 49.7–46.2 g across the same treatments. A consistent improvement was also recorded in 100-seed weight, which rose from 52.0 to 51.7 g in the control to 55.8–55.1 g with 2.0 g ZnSO4·7H2O L−1.
The statistical analysis revealed that these differences were significant at both the 5% and 1% levels for most traits, except for seed weight per plant and 100-seed weight where variations were less pronounced. Overall, the results indicate that 2.0 g ZnSO4·7H2O L−1 was the optimal concentration for maximizing faba bean yield attributes under sandy soil conditions, as it consistently recorded the highest values across both seasons.
Values represent the means of four replicates (± standard deviation). Differences among ZnSO4·7H2O treatments were significant according to one-way ANOVA (Table 7). LSD at 5% and 1% levels are indicated.
The canopy reflectance curves at harvest (Figure 4) show clear, treatment-dependent separation that mirrors the yield improvements reported in Table 7. In the visible (VIS, 400–700 nm), the control spectrum exhibits the highest reflectance—especially around the green peak (∼550 nm) and within the red absorption trough (∼670 nm)—indicating lower chlorophyll density. As ZnSO4·7H2O concentration increases, VIS reflectance declines slightly, and the red minimum deepens, consistent with higher pigment concentration in the treated canopies.

Figure 4. Spectral reflectance of faba bean at harvest as influenced by foliar ZnSO4 concentrations.
Across the red-edge (≈700–750 nm), all spectra show the characteristic steep rise, but the slope becomes progressively steeper with ZnSO4·7H2O, with the 2.0 g L−1 treatment showing the sharpest transition. A subtle right-shift of the red-edge position is also apparent under higher ZnSO4·7H2O, indicating an increase in chlorophyll content and photosynthetically active leaf area.
In the near-infrared (NIR, 750–1,200 nm), reflectance increases monotonically with ZnSO4·7H2O rate. The ranking is consistent over the 780–1,050 nm plateau (ZnSO4·7H2O 2.0 g L−1 > 1.5 g L−1 > 1.0 g L−1 > 0.5 g L−1 > Control), with the highest treatment showing an additional ≈0.03–0.05 absolute reflectance above the control throughout the plateau. This NIR enhancement reflects greater LAI, denser canopy structure, and higher internal leaf scattering, all of which match the observed increases in pods plant−1, pod/seed weights, and 100-seed weight. The water-absorption feature near ∼970 nm is present in all treatments with minor depth differences, indicating broadly similar leaf water status at harvest.
The one-way ANOVA (Figure 5) showed significant (p ≤ 0.05) variations among the five zinc sulfate concentrations across all four spectral bands (Blue, Green, NIR, and Red). Reflectance in the Blue and Green bands decreased as zinc concentration increased, indicating stronger chlorophyll absorption and higher pigment activity in zinc-treated plants. Conversely, the NIR band exhibited a marked increase in reflectance, reflecting enhanced internal leaf structure and canopy density, while the Red band decreased following a similar pattern to the visible region.
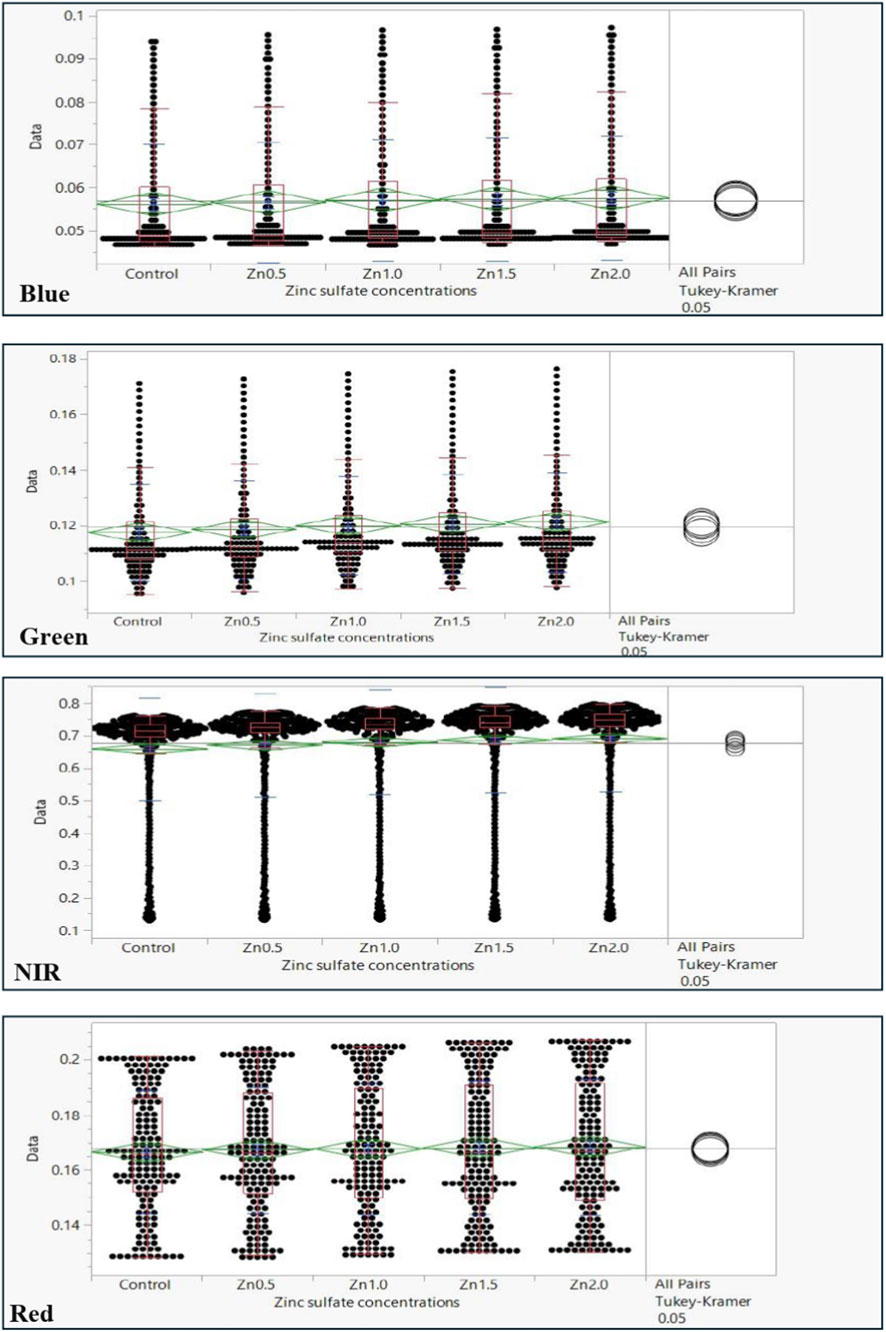
Figure 5. ANOVA of spectral reflectance bands (blue, green, red, NIR) at harvest under ZnSO4 treatments (p ≤ 0.05).
Among all treatments, 1.0 g L−1 ZnSO4·7H2O consistently produced the lowest reflectance in visible bands and the highest in NIR, confirming it as the optimum zinc concentration that maximizes chlorophyll accumulation, leaf structural integrity, and overall photosynthetic efficiency under sandy soil conditions.
According to the one-way ANOVA results (Table 8), significant differences (p ≤ 0.01) were detected among the zinc sulfate concentrations for all yield traits. This confirms that foliar Zn application exerted a consistent and statistically robust effect on reproductive performance and yield formation in faba bean.

Table 8. One-way ANOVA for yield attributes of faba bean as affected by ZnSO4 concentrations (2023/24–2024/25 seasons).
Overall, Figure 5 confirms the agronomic results: higher ZnSO4·7H2O doses particularly 2.0 g L−1 produce canopies with lower VIS reflectance, steeper red-edge slopes, and higher NIR reflectance, signatures that are typical of greener, denser, and more productive stands. These spectral behaviors underpin the increases expected in vegetation indices at harvest (e.g., higher NDVI/GNDVI/EVI2 and red-edge slope), which will be presented in the subsequent indices table for the yield stage.
To complement the yield data, a series of vegetation indices were calculated from canopy reflectance to capture the spectral response of faba bean plants to foliar zinc sulfate (ZnSO4·7H2O) application (Table 9). These indices provided additional evidence of the positive impact of ZnSO4·7H2O on plant performance and yield outcomes (Table 9). NDVI (Normalized Difference Vegetation Index) values increased steadily from 0.62 in the control to 0.75 under 2.0 g L−1 ZnSO4·7H2O. This increase reflects enhanced canopy greenness and chlorophyll density, which were closely associated with higher pod and seed weights at harvest. Similarly, GNDVI (Green NDVI) rose from 0.56 in the control to 0.71 at 2.0 g L−1 ZnSO4·7H2O, indicating improved pigment accumulation and nitrogen assimilation, strongly correlating with the number of pods per plant and 100-seed weight.

Table 9. Vegetation indices of faba bean yield traits as influenced by foliar application of zinc sulfate (ZnSO4) concentrations.
NDRE (Normalized Difference Red Edge) also exhibited a notable increase, from 0.43 in the control to 0.64 under 2.0 g L−1 ZnSO4·7H2O. Given its sensitivity to chlorophyll concentration and canopy structure, NDRE effectively captured the Zn-induced yield improvements earlier than broadband indices. In parallel, PRI (Photochemical Reflectance Index) doubled across treatments, increasing from 0.022 in the control to 0.046 at 2.0 g L−1 ZnSO4·7H2O. This improvement reflects enhanced photosynthetic light-use efficiency, which directly contributed to higher biomass accumulation and final yield.
The strongest response was observed for MCARI (Modified Chlorophyll Absorption Ratio Index), which rose sharply from 1.15 in the control to 2.09 at 2.0 g L−1 ZnSO4·7H2O. This pronounced change demonstrates improved pigment absorption and canopy vigor, with direct links to pod dry weight and seed productivity. Collectively, all indices showed consistent upward trends with increasing ZnSO4·7H2O concentration, with the highest values consistently recorded at 2.0 g L−1. These findings confirm 2.0 g L−1 ZnSO4 as the optimal foliar concentration for enhancing faba bean yield under sandy soil conditions. Furthermore, the results validate the potential of hyperspectral vegetation indices as non-destructive, reliable tools for yield prediction and nutrient monitoring in sustainable crop management systems.
3.3 Yield and chemical composition of faba bean as affected by zinc sulfate
Table 10 presents the averages of seed yield and chemical composition (Zn content, protein percentage, and soluble sugars) of faba bean plants at harvest under foliar application of zinc sulfate (ZnSO4·H2O, 35% Zn) during the 2023/24 and 2024/25 seasons.

Table 10. Mean (±SD) of yield and chemical composition of faba bean plant as affected by zinc sulfate (ZnSO4⋅7H2O 35% Zn) concentrations during the 2023/24 and 2024/25 seasons (p ≤ 0.05).
Application of ZnSO4·7H2O significantly enhanced all measured parameters compared with the untreated control. Seed yield increased progressively with higher ZnSO4·7H2O concentrations, reaching 5.22–5.35 t ha−1 at 2.0 g L−1 compared with 4.56–4.60 t ha−1 in the control. Similarly, soluble sugars rose from 50.13 to 50.22 mg g−1 in the control to 54.97–55.75 mg g−1 under 2.0 g L−1 ZnSO4·7H2O. Protein content also showed consistent improvement, with the maximum values of 24.02%–24.82% recorded at 2.0 g L−1, compared with 20.45%–20.71% in the control. Zinc accumulation in seeds increased markedly from 25.72 to 26.12 mg g−1 in the control to 33.40–34.05 mg g−1 at 2.0 g L−1 ZnSO4, confirming the direct role of foliar Zn in enhancing grain nutritional quality. Overall, the results indicate that foliar application of zinc sulfate at 2.0 g L−1 provided the highest improvements in both yield and nutritional composition of faba bean under sandy soil conditions, establishing it as the optimal treatment.
Values are expressed as mean (± standard deviation) of four replicates. Differences among zinc treatments were statistically significant according to one-way ANOVA (Table 10).
The canopy spectral reflectance patterns of faba bean plants under different ZnSO4·7H2O concentrations are shown in Figure 6. The curves exhibited clear differences between the control and ZnSO4·7H2O treated plants, reflecting the strong influence of zinc nutrition on canopy optical properties.

Figure 6. Spectral reflectance of faba bean related to yield and biochemical composition under ZnSO4 treatments.
In the visible region (400–700 nm), the control treatment recorded the highest reflectance values, which is consistent with its lower chlorophyll and pigment concentrations, as confirmed by the reduced SPAD values, protein content, and soluble sugars. Increasing ZnSO4·7H2O levels, particularly at 2.0 g L−1, significantly reduced reflectance in this region, indicating improved chlorophyll accumulation and enhanced photosynthetic activity.
In the near-infrared region (700–1,200 nm), reflectance increased progressively with ZnSO4·7H2O concentration. The highest reflectance was observed at 2.0 g L−1 ZnSO4·7H2O, reflecting greater canopy density, enhanced internal leaf structure, and improved biomass accumulation. These findings are consistent with the higher seed yield, protein content, and Zn concentration observed in the chemical composition data (Table 10). Overall, the spectral “fingerprints” clearly separated the treatments, with the 2.0 g L−1 ZnSO4·7H2O treatment showing the strongest divergence from the control, confirming its superiority in improving both yield and nutritional quality under sandy soil conditions.
The analysis of variance (Figure 7) showed significant differences (p ≤ 0.05) among the five zinc sulfate concentrations for all vegetation indices (NDVI, NDRE, PRI, and SAVI). The indices increased gradually with zinc application up to 1.0 g L−1 ZnSO4·7H2O, followed by a slight decline at higher levels. This pattern indicates that moderate zinc application improved canopy greenness, pigment content, and photosynthetic efficiency. The highest mean values of NDVI and NDRE were obtained from 1.0 g L−1, confirming the strong positive impact of this concentration on chlorophyll density and canopy vigor. Similarly, PRI and SAVI values were significantly higher at the same level, indicating more efficient light-use and better soil–vegetation interaction.

Figure 7. ANOVA of vegetation indices (NDVI, NDRE, PRI, SAVI) for faba bean yield and biochemical traits (p ≤ 0.05).
Overall, these results confirm that 1.0 g L−1 ZnSO4·7H2O represents the optimum concentration, producing the best physiological and spectral response of faba bean plants under sandy soil conditions.
The one-way ANOVA results (Table 11) demonstrated significant (p ≤ 0.05) improvements in all measured biochemical traits and seed yield with increasing ZnSO4·7H2O concentration. These findings support the strong nutritional and physiological impact of zinc application under sandy soil conditions.

Table 11. One-way ANOVA for seed yield and chemical composition of faba bean as affected by ZnSO4 concentrations.
The analysis of vegetation indices (Table 12) derived from canopy reflectance revealed clear responses of faba bean plants to foliar application of zinc sulfate (ZnSO4·7H2O), supporting the yield and biochemical traits presented in (Table 10). NDVI values increased steadily from 0.60 in the control to 0.75 at 2.0 g L−1 ZnSO4, reflecting improved canopy greenness and photosynthetic activity, which was consistent with the superior seed yield observed at the highest zinc level (5.35 ton/ha). Similarly, GNDVI rose from 0.54 in the control to 0.70 at 2.0 g L−1 ZnSO4·7H2O, confirming enhanced chlorophyll concentration and efficient nutrient uptake, in line with the marked rise in soluble sugars (from 50.22 to 55.75 mg/g). The NDRE index also exhibited a progressive increase (0.41–0.62), which closely mirrored improvements in protein content (from 20.71% to 24.82%), highlighting the sensitivity of red-edge indices in detecting zinc-induced physiological and biochemical enhancements. Moreover, PRI showed a substantial improvement, rising from 0.020 in the control to 0.046 under 2.0 g L−1 ZnSO4·7H2O, indicating better photosynthetic light-use efficiency and photochemical performance. MCARI further demonstrated a strong response, increasing from 1.10 to 2.04, reflecting enhanced pigment absorption and canopy vigor, consistent with the higher zinc concentration in seeds (34.05 mg/g). Collectively, these findings confirm that vegetation indices effectively captured both structural and biochemical responses of faba bean plants, with the most pronounced effects recorded at 2.0 g L−1 ZnSO4·7H2O, thereby establishing it as the optimal foliar treatment under sandy soil conditions.

Table 12. Vegetation indices of faba bean yield and biochemical traits as influenced by foliar application of zinc sulfate (ZnSO4) concentrations.
3.4 Spectral signatures of (plant and soil) of faba bean samples under optimal zinc sulfate concentration
3.4.1 Spectral signatures of faba bean leaves
The spectral reflectance curves of the seven faba bean samples under the optimal zinc sulfate concentration exhibited distinct patterns across the visible (400–700 nm) and near-infrared (700–1,200 nm) regions (Figure 8). In the visible domain, clear differences among samples were detected, with lower reflectance values indicating higher chlorophyll content and more efficient light absorption, particularly in Bean Sample 1 and Bean Sample 3. These samples demonstrated enhanced photosynthetic pigment accumulation, reflecting their superior physiological status. Conversely, Bean Sample 5 showed markedly higher reflectance in the visible range, suggesting reduced chlorophyll density and weaker photosynthetic performance.

Figure 8. Spectral reflectance curves of faba bean leaf samples under the optimal ZnSO4 concentration (1.0 g L−1).
In the near-infrared region, the divergence among samples became more pronounced, reflecting differences in canopy structure and internal leaf organization. Bean Sample 1 and Bean Sample 6 recorded the highest reflectance values in the NIR, indicating denser leaf canopies and greater biomass accumulation. By contrast, Bean Sample 5 maintained the lowest NIR reflectance, consistent with its weaker growth performance. The overall separation of spectral fingerprints among the seven samples underlines the strong capability of hyperspectral sensing to differentiate plant responses, even under the same zinc sulfate level, and highlights the variability of physiological adaptation within faba bean populations.
Results of one-way ANOVA (Figure 9) showed clear and significant differences (p ≤ 0.05) among the studied samples in all spectral bands. In the blue and green regions, reflectance values varied noticeably between samples, with the lowest values observed in Sample 3 and Sample 5, indicating higher chlorophyll absorption and pigment density. The NIR band displayed higher reflectance for Samples 3 and 4, reflecting better internal leaf structure and canopy development. In contrast, the red band exhibited the lowest reflectance in Sample 5, confirming its strong light absorption by chlorophyll.

Figure 9. ANOVA of spectral reflectance bands among faba bean leaf samples under the optimal ZnSO4 concentration (p ≤ 0.05).
Overall, the analysis demonstrates that Sample 3 and Sample 5 recorded the most balanced spectral behavior—lower reflectance in the visible bands and higher values in NIR—indicating more vigorous plants with improved photosynthetic performance under the 1.0 g L−1 ZnSO4·7H2O treatment.
Statistical validation using one-way ANOVA (Table 13) showed significant differences (p ≤ 0.001) among the seven faba bean leaf samples under the optimal 1.0 g L−1 ZnSO4·7H2O treatment. This confirms detectable spectral variability within the same treatment level, reflecting physiological diversity among plants.

Table 13. One-way ANOVA for spectral reflectance of faba bean leaf samples under optimal ZnSO4 treatment.
The vegetation indices confirmed the spectral differentiation among faba bean samples under the optimal foliar ZnSO4·7H2O concentration (Table 14). Sample 4 recorded the highest values for NDVI (0.747), GNDVI (0.677), and NDRE (0.648), indicating superior chlorophyll density, canopy greenness, and structural integrity. This agrees with the higher NIR reflectance and lower VIS reflectance observed in its spectral signature. Samples 2 and 3 also showed relatively high values, reflecting good photosynthetic performance and pigment concentration, though slightly lower than sample 4. By contrast, samples 5 and 7 showed the lowest NDVI, GNDVI, and NDRE values, suggesting weaker canopy vigor and less efficient pigment accumulation.

Table 14. Vegetation indices of faba bean plants under different ZnSO4 concentrations (spectral bands in parentheses).
PRI values were negative across all samples, which is typical for this index, but sample 4 exhibited the most pronounced negative value (−0.263), reflecting a stronger engagement of the xanthophyll cycle and higher photosynthetic light-use efficiency. MCARI values were small but positive in most cases, peaking at 0.002 in sample 4, which supports enhanced chlorophyll absorption near 670–700 nm. Overall, the indices clearly distinguished the best-performing sample (Sample 4) from the weaker ones (5 and 7). These results confirm that vegetation indices derived from hyperspectral reflectance are highly effective in detecting subtle physiological differences among plants, even under the same ZnSO4·7H2O treatment, and can be used as reliable non-destructive tools for monitoring zinc nutrition in faba bean.
3.4.2 Spectral signatures of faba bean soil samples
Figure 10 indicate the spectral reflectance patterns of the soil samples associated with the best-performing ZnSO4·7H2O treatment showed clear differences across the visible (400–700 nm) and near-infrared (700–1,100 nm) regions. In the visible range, soils with higher zinc availability exhibited lower reflectance, particularly between 450 and 550 nm, reflecting increased absorption due to organic matter and nutrient enrichment. This reduction in reflectance is a strong indicator of improved soil fertility status.
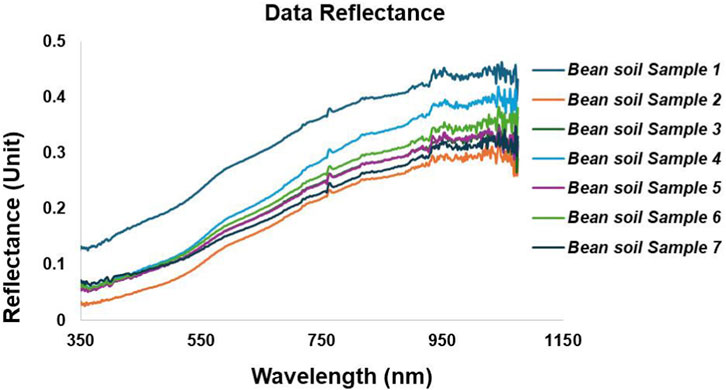
Figure 10. Spectral reflectance of soil samples under the optimal ZnSO4 concentration.
In the red-edge region (680–750 nm), a distinct separation among soil samples was observed. Soils associated with the optimal Zn treatment displayed smoother transitions and lower reflectance values, indicating higher micronutrient content and better soil–plant interactions. In the NIR region (750–1,100 nm), reflectance values increased across all soil samples, but those linked to optimal Zn concentration (Bean soil Sample 1 and Sample 4) exhibited relatively higher reflectance. This behavior suggests improved soil structure and moisture retention capacity, which enhance the physical environment for plant growth.
Overall, the spectral soil signatures confirm that zinc fertilization not only influenced plant canopy reflectance but also altered soil spectral behavior, especially in the red and NIR regions. These changes highlight the sensitivity of hyperspectral sensing in detecting soil fertility variations and its potential as a non-destructive tool for monitoring nutrient dynamics in agricultural systems.
The one-way ANOVA results (Figure 11) revealed significant variations (p ≤ 0.05) among the soil samples for all spectral bands. In the blue and green regions, reflectance values were generally higher in Sample 1, indicating lower pigment and organic matter content in that soil. Reflectance gradually decreased in Samples 3 and 5, which were associated with the highest plant vigor and chlorophyll density, suggesting better soil structure and nutrient availability.
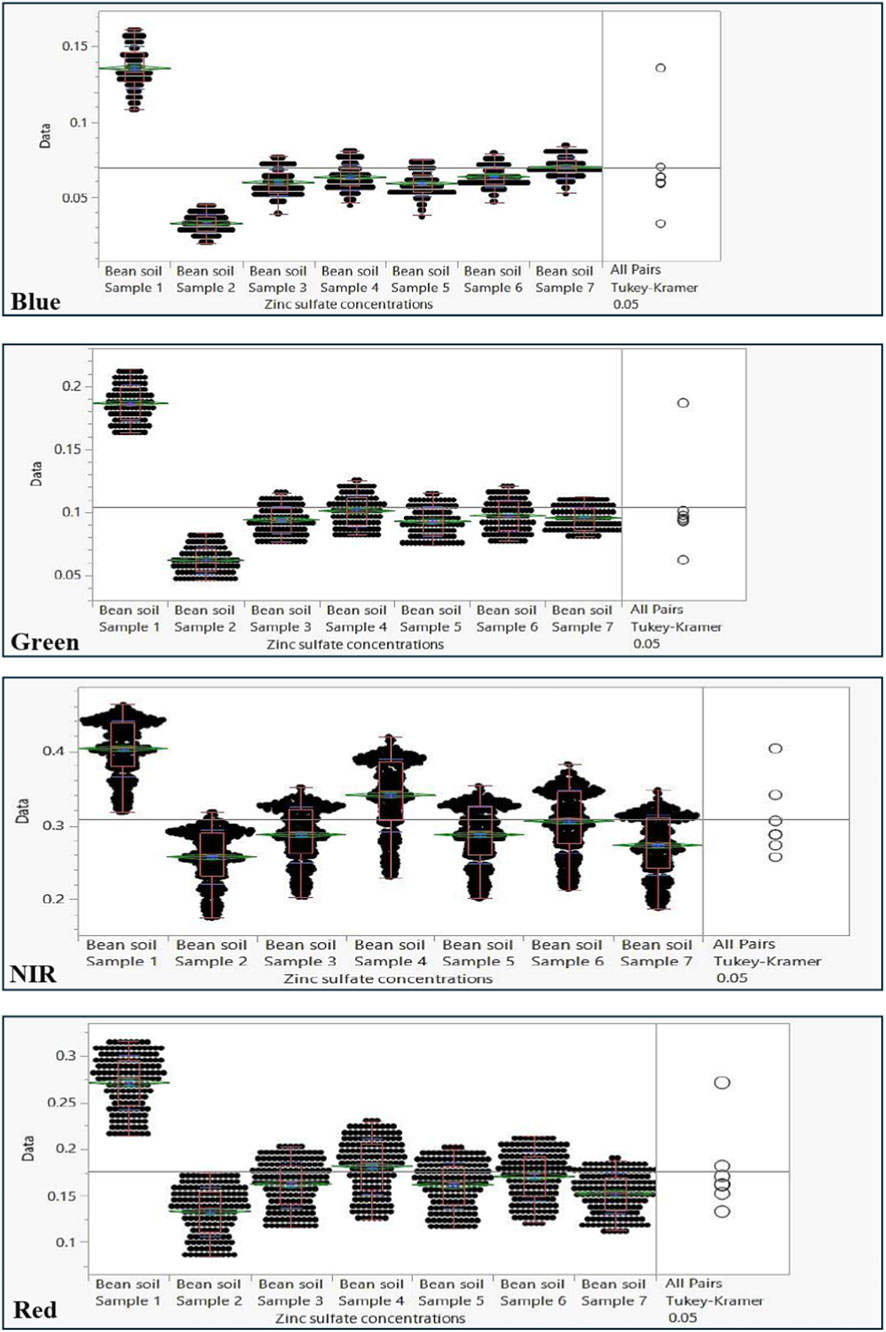
Figure 11. ANOVA of spectral reflectance bands among soil samples under the optimal ZnSO4 concentration (p ≤ 0.05).
The NIR band showed higher reflectance for Samples 3 and 4, corresponding to improved soil aggregation and moisture retention, both favoring higher vegetative growth. Conversely, the red band exhibited the lowest reflectance in Sample 5, reflecting higher absorption by soil organic components and potential root–soil interaction at this zinc level.
These results confirm that the spectral behavior of soil samples closely matches the corresponding plant response, particularly for Sample 3 and Sample 5, which are linked to the 2.0 g L−1 ZnSO4·7H2O treatment—identified as the optimal zinc concentration promoting both soil quality and plant performance.
As indicated by the ANOVA summary (Table 15), significant (p ≤ 0.05) variations were observed among the soil samples across all spectral regions. These statistical results confirm that soil reflectance characteristics are highly responsive to zinc enrichment and correlate with the observed plant responses.
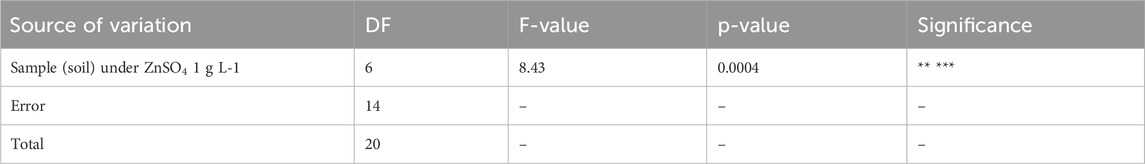
Table 15. One-way ANOVA for spectral reflectance of soil samples under optimal ZnSO4 treatment.
The soil vegetation indices calculated from spectral reflectance under the optimal ZnSO4·7H2O concentration revealed clear variations among the seven soil samples (Table 16). Soil-adjusted indices such as SAVI and OSAVI also peaked in Sample 4 (0.136 and 0.156, respectively), indicating reduced soil background interference and better canopy vigor potential.

Table 16. Soil spectral indices of faba bean soils under optimal foliar ZnSO4 concentration.
EVI2 values were highest in Sample 4 (0.128), confirming the improved biophysical conditions of this soil under zinc supplementation. Although ARVI values was negative, as expected for soil spectra, Sample 7 exhibited the least negative ARVI (−0.058), suggesting favorable soil–plant interactions compared with other samples. RDVI reached its maximum in Sample 4 (0.129), aligning with the other indicators of improved soil spectral behavior. Overall, the indices consistently pointed to Sample 4 as the most favorable soil condition, with additional strong responses in Samples 2, 6, and 7. These results confirm that zinc fertilization not only influences plant canopy traits but also improves soil spectral characteristics, demonstrating the value of hyperspectral indices as reliable tools for monitoring soil fertility under sandy soil conditions.
Overall, the results clearly demonstrate that foliar application of zinc sulfate (ZnSO4·7H2O) significantly enhanced faba bean growth, yield, and biochemical composition under sandy soil conditions. The optimum response was consistently achieved at 2.0 g L−1 ZnSO4, which produced the highest LAI, SPAD, biomass, seed yield, and protein content. Hyperspectral data confirmed these findings through distinct changes in the visible, red-edge, and NIR regions, validating the strong association between canopy reflectance and zinc nutrition. These results provide a solid foundation for integrating hyperspectral monitoring into precision zinc management strategies, enabling more efficient nutrient use and sustainable faba bean production in sandy soils.
4 Discussion
Faba bean performance responded consistently and positively to foliar zinc sulfate (ZnSO4·7H2O) across both seasons and trait domains (Tables 4, 5; Figure 2). The stepwise increases in LAI, SPAD, leaf and stem dry weights, and plant height with higher ZnSO4 doses—culminating at 2.0 g L−1—are physiologically coherent with zinc’s central roles in chlorophyll biosynthesis, enzyme activation, and regulation of photosynthetic metabolism. Numerous recent studies show that foliar Zn improves chlorophyll status and boosts biomass and yield formation under field conditions, including in legumes and cereals; similar magnitudes of improvement in chlorophyll and grain yield following Zn sprays were reported for wheat and beans under contrasting environments, emphasizing the robustness of the foliar route (El-Metwally et al., 2015; El-Metwally et al., 2018; Fallah et al., 2022; Hamzah Saleem et al., 2022; Irmes et al., 2023; Ghanem et al., 2025).
At harvest, yield components (pods plant−1, pod and seed weights, 100-seed weight) and final seed yield showed the same monotonic ranking, with 2.0 g L−1 ZnSO4·7H2O outperforming the control in both seasons (Tables 7, 8; Figure 3). Improvements in soluble sugars, protein percentage, and seed Zn concentration further indicate that Zn nutrition enhanced both assimilate production and partitioning as well as grain nutritional quality (Tables 10, 11; Figure 4). Comparable enhancements in seed yield and protein under foliar Zn (and nano-Zn) have been documented for faba bean and related systems, with optimal foliar doses producing the largest gains (Kadhim et al., 2024).
Statistical validation using one-way ANOVA and Fisher’s LSD test confirmed that the differences among zinc sulfate concentrations were highly significant (p ≤ 0.05) for all measured traits and spectral responses (Tables 5, 8, 11, 13, 15). The analysis consistently separated the treatments, with the 1.0 g L−1 and 2.0 g L−1 ZnSO4·7H2O levels showing distinct clusters in post hoc comparisons (Figures 5, 6). These findings reinforce that the observed improvements in chlorophyll content, canopy reflectance, and vegetation indices are statistically robust and not due to random variation. The ANOVA patterns across the blue, green, NIR, and red bands further demonstrated clear spectral discrimination among treatments, confirming the sensitivity of visible–NIR reflectance to zinc-induced physiological changes. The parallel significance observed in NDVI, NDRE, PRI, and SAVI validates the reliability of these indices as quantitative indicators of zinc response, consistent with previous multispectral analyses of nutrient stress in legumes (Table 6) (Lazarević et al., 2024). Correlation analyses revealed strong positive associations (r > 0.85, p < 0.05) between NDRE and protein content, confirming the reliability of red-edge indices for biochemical prediction.
The canopy spectral signatures corroborate the agronomy (Figures 7, 8). In the VIS (400–700 nm), treated canopies—especially 1.5–2.0 g L−1—exhibited lower reflectance (deeper red trough), consistent with increased chlorophyll and SPAD; in the NIR (700–1,200 nm), reflectance rose with dose, reflecting denser, thicker leaves and higher internal scattering consistent with the observed LAI and biomass gains (Table 4; Figure 2). The steeper red-edge slope and subtle right-shift of the red-edge position under higher ZnSO4·7H2O align with increased chlorophyll content and photosynthetically active foliage—classic markers captured by narrow-band red-edge indices (Tables 6, 9, 12; Figures 7, 8) (Li et al., 2017; Wang et al., 2023).
Vegetation indices distilled these spectral responses into quantitative diagnostics that tracked physiology and yield. NDVI, GNDVI, and EVI-type indices are well-known proxies for greenness/LAI and were strongly elevated at 2.0 g L−1 in your data; this is consistent with broad evidence that these indices scale with canopy vigor and are operationally robust in field monitoring (Tables 6, 9, 12; Figure 9) (Zou and Mõttus, 2017; Vidican et al., 2023). Importantly, NDRE and red-edge chlorophyll indices—less prone to VIS saturation—showed the clearest separation among Zn treatments and the closest alignment with biochemical traits (protein, seed Zn). That behavior matches recent findings that red-edge metrics are particularly sensitive to nutrient-driven chlorophyll variation and translate to improved yield prediction and early stress detection (Tables 6, 9, 12; Figures 8, 9) (Bourriz et al., 2025; Panda et al., 2025). PRI also increased with Zn in your results, indicating improved light-use efficiency—again in line with literature linking PRI to dynamic xanthophyll-cycle regulation and photosynthetic performance under improved nutrition (Irmes et al., 2023; Bourriz et al., 2025). Finally, MCARI—sensitive to chlorophyll absorption near 670–700 nm—rose sharply with Zn, reinforcing the pigment-centric interpretation and echoing reports that MCARI responds strongly to changes in pigment pools and canopy vigor (Table 6; Figure 9) (Yu et al., 2022).
Soil spectra and soil-derived indices under the optimal ZnSO4·7H2O condition added a complementary layer (Tables 15, 16; Figures 10, 11). Although soil NDVI/GNDVI magnitudes are intrinsically low for bare soils, your soils with better spectral quality (e.g., Samples 2, 4, 7) showed higher NDVI/GNDVI and OSAVI/SAVI, consistent with reduced background noise and improved organic matter/nutrient status. Shifts in the red-edge position (REP) toward longer wavelengths (up to ∼721 nm in Samples 4–6) parallel the plant-side evidence for higher chlorophyll and micronutrient availability, and agree with recent reports that VNIR hyperspectral data can capture soil Zn variability and fertility proxies reliably (Table 16; Figures 10, 11) (Sun et al., 2022). The coherence between soil indices (e.g., OSAVI, RDVI, CIgreen) and canopy-level gains in LAI/yield suggests that Zn fertilization improved both the soil spectral milieu and plant nutrient acquisition, tightening soil–plant coupling under sandy conditions (Sun et al., 2022; Khdery et al., 2023; Vidican et al., 2023).
Taken together, the agronomic, spectral, and index-based evidence points to 2.0 g L−1 ZnSO4·7H2O as an operational optimum for faba bean on sandy soils in this study (Tables 4–16; Figures 2–11). The convergence of growth, yield, and grain-quality improvements with diagnostic shifts in VIS–red-edge–NIR behavior—and their expression in NDVI/GNDVI/NDRE/PRI/MCARI—provides a strong basis for spectral Zn nutrition monitoring. From a precision-agriculture perspective, these findings are actionable: red-edge-centric indices (e.g., NDRE, chlorophyll indices) and EVI2-type metrics are well-suited for scalable sensing (proximal or Sentinel-2 derived), enabling within-field diagnosis and site-specific Zn management (Figures 9–11) (Khdery and Yones, 2021; Vidican et al., 2023).
Two caveats frame future work. First, genotypic differences in faba bean can modulate Zn responses; recent studies show cultivar-by-Zn interactions for growth and yield (Kadhim et al., 2024; Sarhan et al., 2024).Second, environmental variability (e.g., moisture, atmosphere) can alter index behavior—EVI2 often shows better stability than EVI and can reduce atmospheric/soil background effects—supporting your use of a diversified index panel that includes EVI2/OSAVI for robustness (Zou and Mõttus, 2017). Incorporating multi-temporal spectra, red-edge feature extraction, and simple machine-learning regressions could further strengthen predictive links between indices and Zn-sensitive traits in future seasons (Li et al., 2017; Khdery et al., 2019).
Data demonstrate that foliar ZnSO4·7H2O at 2.0 g L−1 simultaneously improved canopy structure and photosynthetic capacity (VIS decrease, red-edge steepening, NIR increase), elevated yield and seed-quality attributes (sugars, protein, grain Zn), and produced coherent increases in NDVI/GNDVI/NDRE/PRI/MCARI (Tables 4–12; Figures 2–9). The alignment between plant and soil spectral indicators underlines a practical pathway to embed hyperspectral diagnostics within precision Zn management for faba bean on sandy soils (Tables 13–16; Figures 10, 11).
Integrating the hyperspectral vegetation indices demonstrated in this study within precision agriculture frameworks offers a pragmatic route for targeted zinc management. Technologies such as remote sensing platforms, sensor-equipped drones, IoT networks, and AI-driven analytics collectively enable data-informed, site-specific interventions, optimizing input applications while conserving resources. As reviewed by Sishodia et al. (2020), remote sensing tools, including UAVs and satellite imagery, are already being used to guide variable-rate fertilization and monitor crop nutritional status. Similarly, (Saha et al., 2025) highlights the transformative potential of machine learning integrated with remote sensing to enhance yield predictions and decision support systems in precision agriculture. Smart sensors—enabled by IoT and advanced analytics—have become integral in capturing real-time field data, supporting adaptive management in modern farming operations. Together, these innovations not only improve nutrient use efficiency and yield (Reduce over-application and wastage) but also support sustainable intensification—a key component of climate-smart agriculture. This aligns with the goals of smart agriculture, where spectral tools like NDRE and PRI can be operationalized for real-time crop diagnostics and adaptive Zn fertilization at sub-field scales (Figures 9–11).
5 Conclusion
This study demonstrated that foliar application of zinc sulfate (ZnSO4·H2O, 35% Zn) markedly improved the growth, yield, and biochemical composition of faba bean (V. faba L.) cultivated under sandy soil conditions affected by salinity. Progressive increases in LAI, SPAD, biomass, and plant height were observed with rising ZnSO4·7H2O concentrations, with the 2.0 g L−1 treatment consistently achieving the best performance. Yield components, including pod number, seed weight, and 100-seed weight, also showed significant enhancement, establishing this concentration as the optimal foliar dose for maximizing productivity under low-fertility sandy soils.
Spectral reflectance patterns revealed distinct treatment-dependent shifts across the visible, red-edge, and near-infrared domains. Higher ZnSO4·7H2O levels reduced red reflectance, steepened the red-edge slope, and increased NIR reflectance, consistent with greater chlorophyll density and canopy vigor. Vegetation indices such as NDVI, GNDVI, NDRE, PRI, and MCARI effectively reflected these physiological changes and were strongly correlated with growth and biochemical parameters, confirming the utility of hyperspectral sensing as a non-destructive diagnostic tool for micronutrient monitoring.Overall, the findings highlight 2.0 g L−1 ZnSO4·7H2O as an effective agronomic strategy for improving both yield and nutritional quality of faba bean under arid sandy soils. The practical implication lies in integrating hyperspectral vegetation indices within precision agriculture systems to guide site-specific Zn management and enhance resource-use efficiency. As this study was conducted on a single cultivar and site, further validation under diverse environments and seasons is recommended. The results underscore the significance of combining foliar micronutrient supplementation with hyperspectral diagnostics to advance sustainable crop monitoring and climate-smart agriculture.
Data availability statement
The original contributions presented in the study are included in the article/supplementary material, further inquiries can be directed to the corresponding author.
Author contributions
GK: Conceptualization, Data curation, Formal Analysis, Investigation, Methodology, Resources, Software, Validation, Visualization, Project administration, Writing – original draft, Writing – review and editing. IE-M: Conceptualization, Data curation, Formal Analysis, Investigation, Methodology, Resources, Software, Validation, Visualization, Project administration, Writing – original draft, Writing – review and editing. MS: Investigation, Visualization, Writing – original draft. JMdL: Investigation, Visualization, Writing – review and editing. AA: Funding acquisition, Project administration, Validation, Writing – original draft.
Funding
The authors declare that financial support was received for the research and/or publication of this article. This publication has been supported by Ongoing Research Funding program, (ORF-2025-1156), King Saud University X, Riyadh, Saudi Arabia.
Acknowledgements
The authors would thank the National Authority of Remote Sensing and Space Science (NARSS) in Cairo, Egypt and the National Research Centre (NRC). The authors would thank the Ongoing Research Funding program, (ORF-2025-1156), King Saud University, Riyadh, Saudi Arabia for its support.
Conflict of interest
The authors declare that the research was conducted in the absence of any commercial or financial relationships that could be construed as a potential conflict of interest.
Generative AI statement
The authors declare that no Generative AI was used in the creation of this manuscript.
Any alternative text (alt text) provided alongside figures in this article has been generated by Frontiers with the support of artificial intelligence and reasonable efforts have been made to ensure accuracy, including review by the authors wherever possible. If you identify any issues, please contact us.
Publisher’s note
All claims expressed in this article are solely those of the authors and do not necessarily represent those of their affiliated organizations, or those of the publisher, the editors and the reviewers. Any product that may be evaluated in this article, or claim that may be made by its manufacturer, is not guaranteed or endorsed by the publisher.
References
Abdel Kader, H. (2025). Response of faba bean (Vicia faba L.) growth and productivity to foliar application of salicylic acid and zinc application methods under upper Egypt conditions. J Assiut J. Agric. Sci. 56 (3), 1–13. doi:10.21608/ajas.2025.345819.1439
A.O.A.C (1990). Official methods of analysis. 15th Edition. Washington DC: Association of Official Analytical Chemist.
Barnes, E., Clarke, T., Richards, S., Colaizzi, P., Haberland, J., Kostrzewski, M., et al. (2000). “Coincident detection of crop water stress, nitrogen status and canopy density using ground based multispectral data,” in Proceedings of the fifth international conference on precision agriculture. Bloomington, MN, USA.
Belgiu, M., Marshall, M., Boschetti, M., Pepe, M., Stein, A., and Nelson, A. (2023). PRISMA and Sentinel-2 spectral response to the nutrient composition of grains. J Remote Sens. Environ. 292, 113567. doi:10.1016/j.rse.2023.113567
Bhandari, A., Kumar, A., and Singh, G. (2012). Feature extraction using normalized difference vegetation index (NDVI): a case study of jabalpur city. J. Procedia Technology 6, 612–621. doi:10.1016/j.protcy.2012.10.074
Bourriz, M., Hajji, H., Laamrani, A., Elbouanani, N., Abdelali, H. A., Bourzeix, F., et al. (2025). Integration of hyperspectral imaging and AI techniques for crop type mapping: present status, trends, and challenges. J Remote Sensing Environment 17 (9), 1574. doi:10.3390/rs17091574
Clemente, A. A., Maciel, G. M., Siquieroli, A. C., Gallis, R., Luz, J., Sala, F. C., et al. (2023). Nutritional characterization based on vegetation indices to detect anthocyanins, carotenoids, and chlorophylls in mini-lettuce. J. Agron. 13 (5), 1403. doi:10.3390/agronomy13051403
Cottenie, A., Verloo, M., Kiekens, L., Velghe, G., and Camerlynck, R. (1982). “Chemical analysis of plants and soils,”, 63. Belgium, 44–45.J. Lab. Agroch. State Univ. Gent, Belg.
Daughtry, C. S., Walthall, C., Kim, M., De Colstoun, E. B., and McMurtrey Iii, J. J. R. s.o.E. (2000). Estimating corn leaf chlorophyll concentration from leaf and canopy reflectance. J Remote Sensing Environ. 74 (2), 229–239. doi:10.1016/S0034-4257(00)00113-9
El-Metwally, I., Abd El Salam, M., and Ali, O. (2015). Effect of zinc application and weed control on wheat yield and its associated weeds grown in zinc-deficient soil. J Int. J. ChemTech Res. 8 (4), 1588–1600.
El-Metwally, I., Doaa, M., Abo-Basha, A., and Abd El-Aziz, M. (2018). Response of peanut plants to different foliar applications of nano-iron, manganese and zinc under sandy soil conditions. J. Middle East J. Appl. Sci. 8 (2), 474–482.
Fallah, S., Azizi, K., Eisvand, H. R., Akbarpour, O., and Akbari, N. (2022). Effect of zinc sulfate foliar application on morphological characteristics and yield of red beans (Phaseolus vulgaris L.) under different carbon dioxide-temperature and water stress. J Environ. Stresses Crop Sci. 15 (3), 641–656. doi:10.22077/escs.2021.4016.1953
Fouda, T., and Abdelsalam, A. (2024). Integrating image processing techniques with vegetation indices for monitoring growth stages and general health for faba bean crop. J Sci. Pap. Ser. Manag. Econ. Eng. Agric. Dev. 24 (3).
Gamon, J. A., Penuelas, J., and Field, C. (1992). A narrow-waveband spectral index that tracks diurnal changes in photosynthetic efficiency. J Remote Sens. Environment 41 (1), 35–44. doi:10.1016/0034-4257(92)90059-S
Ghanem, H. E., Hamza, D. A., Zain El-Abdeen, A., Elbatrawy, W. S., and El-Habashy, H. (2025). Influence of zinc foliar spray on growth, some important physiological processes, yield and yield attributes of bread wheat under water stress. J. Sci. Rep. 15 (1), 14943. doi:10.1038/s41598-025-94728-1
Gitelson, A. A., Kaufman, Y. J., and Merzlyak, M. (1996). Use of a green channel in remote sensing of global vegetation from EOS-MODIS. J Remote Sensing Environ. 58 (3), 289–298. doi:10.1016/S0034-4257(96)00072-7
Gupta, A., Bharati, R., Kubes, J., Popelkova, D., Praus, L., Yang, X., et al. (2024). Zinc oxide nanoparticles application alleviates salinity stress by modulating plant growth, biochemical attributes and nutrient homeostasis in Phaseolus vulgaris L. J Front. Plant Sci. 15, 1432258. doi:10.3389/fpls.2024.1432258
Hamzah Saleem, M., Usman, K., Rizwan, M., Al Jabri, H., and Alsafran, M. (2022). Functions and strategies for enhancing zinc availability in plants for sustainable agriculture. J Front. Plant Sci. 13, 1033092. doi:10.3389/fpls.2022.1033092
Hasan, A. I., AbdulKafoor, A. H., Aahmed, Y., Al-Falahi, A. S. I., and Ghaffoori, T. (2023). “The effect of chelated nano zinc on growth and yield of several genotypes of faba bean Vicia faba L,” in IOP Conference Series: Earth and Environmental Science (Bristol, United Kingdom: IOP Publishing), 1252, 012036. doi:10.1088/1755-1315/1252/1/012036
Huete, A. (1988). A soil-adjusted vegetation index (SAVI). J Remote Sensing Environment 25 (3), 295–309. doi:10.1016/0034-4257(88)90106-X
Irmes, K., Kristó, I., Szentpéteri, L., Rácz, A., Vályi-Nagy, M., Kassai, M. K., et al. (2023). The effect of foliar zinc application on the leaf chlorophyll concentrations and grain yields of the winter wheat (Triticum aestivum L.) in the field experiments of two seasons. J. Agron. 13 (6), 1640. doi:10.3390/agronomy13061640
Jiang, Z., Huete, A. R., Didan, K., and Miura, T. (2008). Development of a two-band enhanced vegetation index without a blue band. J Remote Sensing Environ. 112 (10), 3833–3845. doi:10.1016/j.rse.2008.06.006
Jw, R. (1973). “Monitoring vegetation systems in the Great Plains with ERTS,” in Third NASA Earth resources technology satellite symposium, 1973, 309–317.
Kadhim, J., Altai, D., Alsaedi, N., and Seadh, S. (2024). Effect of foliar spraying with nano-zinc on growth and productivity some faba bean varieties. J Anbar J. Agric. Sci. 22 (2), 1094–1109. doi:10.32649/ajas.2024.184469
Kaufman, Y. J., Tanre, D., and Sensing, R. (1992). Atmospherically resistant vegetation index (ARVI) for EOS-MODIS. J IEEE Transactions Geoscience 30 (2), 261–270. doi:10.1109/36.134076
Khdery, G. A. (2020). “Remote sensing technology and its applications in pathology,” in Emerging trends in plant pathology. Editors K. P. Singh, S. Jahagirdar, and B. K. Sarma (Singapore: Springer).
Khdery, G., and Yones, M. (2021). Innovative spectral library for identification common wild plants using hyperspectral technology in northwestern Coast, Egypt. J Egypt. J. Remote Sensingsp. Sci. 24 (3), 485–491. doi:10.1016/j.ejrs.2020.08.002
Khdery, G. A., Farg, E., and Arafat, S. (2019). Natural vegetation cover analysis in wadi hagul, Egypt using hyperspectral remote sensing approach. J Egypt. J. Remote Sens. Space Sci. 22 (3), 253–262. doi:10.1016/j.ejrs.2019.09.002
Khdery, G. A., Helal, N., and Saleh, H. (2023). Using hyperspectral indices for investigation polluted plants and soil in abu zabaal area, Egypt. J. Acta Ecol. Sin. 43 (5), 776–784. doi:10.1016/j.chnaes.2022.10.006
Khdery, G. A., Shokr, M., Rebouh, N. Y., and Hewidy, M. (2025). Spectral and morphological discrimination of ficus and moringa species with medical and nutritional relevance: toward sustainable plant utilization. J Front. Sustain. Food Syst. 9, 1652332. doi:10.3389/fsufs.2025.1652332
Kihara, J., Bolo, P., Kinyua, M., Rurinda, J., and Piikki, K. (2020). Micronutrient deficiencies in African soils and the human nutritional nexus: opportunities with staple crops. J. Environ. Geochemistry Health 42 (9), 3015–3033. doi:10.1007/s10653-019-00499-w
Li, D., Cheng, T., Zhou, K., Zheng, H., Yao, X., Tian, Y., et al. (2017). WREP: a wavelet-based technique for extracting the red edge position from reflectance spectra for estimating leaf and canopy chlorophyll contents of cereal crops. J ISPRS J. PhotogrammetryRemote Sens. 129, 103–117. doi:10.1016/j.isprsjprs.2017.04.024
Martineau-Côté, D., Achouri, A., Karboune, S., and L’Hocine, L. J. N. (2022). Faba bean: an untapped source of quality plant proteins and bioactives. J. Nutr. 14 (8), 1541. doi:10.3390/nu14081541
Padilla, F., González-Dugo, M., Gavilán, P., and Domínguez, J. J. H. (2011). Integration of vegetation indices into a water balance model to estimate evapotranspiration of wheat and corn. J. Hydrol. Earth Syst. Sci. 15 (4), 1213–1225. doi:10.5194/hess-15-1213-2011
Panda, D., Mohanty, S., Das, S., Senapaty, J., Sahoo, D., Mishra, B., et al. (2025). From spectrum to yield: advances in crop photosynthesis with hyperspectral imaging. J. Photosynth. 63 (2), 196–233. doi:10.32615/ps.2025.012
Peñuelas, J., and Filella, I. (1998). Visible and near-infrared reflectance techniques for diagnosing plant physiological status. J Trends Plant Science 3 (4), 151–156. doi:10.1016/S1360-1385(98)01213-8
Rondeaux, G., Steven, M., and Baret, F. (1996). Optimization of soil-adjusted vegetation indices. J Remote Sensing Environment 55 (2), 95–107. doi:10.1016/0034-4257(95)00186-7
Roujean, J.-L., and Breon, F. (1995). Estimating PAR absorbed by vegetation from bidirectional reflectance measurements. J Remote Sensing Environ. 51 (3), 375–384. doi:10.1016/0034-4257(94)00114-3
Saha, S., Kucher, O. D., Utkina, A. O., and Rebouh, N. (2025). Precision agriculture for improving crop yield predictions: a literature review. J Front. Agron. 7, 1566201. doi:10.3389/fagro.2025.1566201
Sarhan, I., Yousif, M., and Cheyed, S. (2024). Growth and physiological properties of faba bean genotypes affected by zinc. J. Breed. Genet. 56 (2), 838–845. doi:10.54910/sabrao2024.56.2.34
Singh, A. K., Bharati, R., Manibhushan, N. C., and Pedpati, A. (2013). An assessment of faba bean (Vicia faba L.) current status and future prospect. J Afr. J. Agric. Res. 8 (50), 6634–6641.
Sishodia, R. P., Ray, R. L., and Singh, S. (2020). Applications of remote sensing in precision agriculture: a review. J Remote Sensing Environment 12 (19), 3136. doi:10.3390/rs12193136
Slominski, B. A., Guenter, W., and Campbell, L. (1993). New approach to water-soluble carbohydrate determination as a tool for evaluation of plant cell wall-degrading enzymes. J J. Agric. Food Chem. 41 (12), 2304–2308. doi:10.1021/jf00036a016
Sun, W., Liu, S., Zhang, X., and Zhu, H. (2022). Performance of hyperspectral data in predicting and mapping zinc concentration in soil. J Sci. Total Environ. 824, 153766. doi:10.1016/j.scitotenv.2022.153766
Vidican, R., Mălinaş, A., Ranta, O., Moldovan, C., Marian, O., Ghețe, A., et al. (2023). Using remote sensing vegetation indices for the discrimination and monitoring of agricultural crops: a critical review. J Int. J. Remote Sens. 13 (12), 3040. doi:10.3390/agronomy13123040
Vukadinović, L., Galić, V., Brkić, A., Jambrović, A., and Šimić, D. (2025). Comparing chlorophyll fluorescence and hyperspectral indices in drought-stressed young plants in a maize diversity panel. J. Agron. 15 (7), 1604. doi:10.3390/agronomy15071604
Wang, N., Yang, G., Han, X., Jia, G., Li, Q., Liu, F., et al. (2023). Study of the spectral characters–chlorophyll inversion model of Sabina vulgaris in the Mu us sandy land. J Front. Earth Sci. 10, 1032585. doi:10.3389/feart.2022.1032585
Yu, H., Kong, B., Hou, Y., Xu, X., Chen, T., and Liu, X. (2022). A critical review on applications of hyperspectral remote sensing in crop monitoring. J. Exp. Agric. 58, e26. doi:10.1017/S0014479722000278
Keywords: faba bean, zinc fertilization, hyperspectral reflectance, vegetation indices, soil indices, sandy soils, precision agriculture
Citation: Khdery GA, El-Metwally IM, Shokr MS, Meroño de Larriva JE and Aldosari AA (2025) Analysis of spectral signatures and vegetation indices to assess the response of faba bean plants to varying zinc levels under sandy soil conditions. Front. Environ. Sci. 13:1706260. doi: 10.3389/fenvs.2025.1706260
Received: 17 September 2025; Accepted: 24 November 2025;
Published: 10 December 2025.
Edited by:
Kaishan Song, Chinese Academy of Sciences (CAS), ChinaReviewed by:
Jiban Shrestha, Nepal Agricultural Research Council, NepalTarun Kumar Patel, Sant Guru Ghasidas Government P.G. College, Kurud, India
Copyright © 2025 Khdery, El-Metwally, Shokr, Meroño de Larriva and Aldosari. This is an open-access article distributed under the terms of the Creative Commons Attribution License (CC BY). The use, distribution or reproduction in other forums is permitted, provided the original author(s) and the copyright owner(s) are credited and that the original publication in this journal is cited, in accordance with accepted academic practice. No use, distribution or reproduction is permitted which does not comply with these terms.
*Correspondence: Ghada A. Khdery, Z2hhZGEuYWxpQG5hcnNzLnNjaS5lZw==; Ali Abdullah Aldosari, YWRvc2FyaUBrc3UuZWR1LnNh