 Mingjuan Ma
 Wenwen Gao1
- 1School of Economics, North Minzu University, Yinchuan, Ningxia, China
- 2School of Agricultural and Rural Development, Renmin University of China, Beijing, China
- 3Common Modernization Research Center, Yinchuan, Ningxia, China
- 4School of Computer Science and Engineering, North Minzu University, Yinchuan, Ningxia, China
Developing targeted carbon emissions reduction strategies of the Yellow River Basin (YRB) is essential for achieving sustainable development. At present, nighttime light data provide favorable conditions for studying carbon emissions of large-scale and long-time series. Utilizing nighttime light and statistical data from 2000 to 2022, the spatial-temporal variations of carbon emissions at multi-scale in the YRB are estimated and analyzed. Furthermore, the spatial spillover effects and influencing factors of carbon emissions in the YRB are explored combining Exploratory Spatial Data Analysis (ESDA) and spatial econometric model. The study aims to provide crucial insights for formulating effective carbon emission mitigation strategies in the YRB. Our findings delineate three distinct phases of provincial carbon emissions in the YRB from 2000 to 2022, each marked by unique stages and a converging trend. Urban carbon emissions present distinct spatial distribution characterized by “lower reach > middle reach > upper reach.” Spatial correlation test highlights significant spatial clustering characteristics and spillover effects of carbon emissions. Further decomposition of spatial effects reveals that carbon emissions are influenced by the synergistic interactions of various resource elements. Factors such as economic growth, population density, industrial structure, energy consumption structure, technological progress, and foreign direct investment exert complex interactive effects on carbon emissions.
1 Introduction
Amid growing concerns about climate change, the goal of achieving carbon neutrality is gaining popularity globally, with several countries setting targets to become carbon-neutral (Sierra et al., 2021; Piwowar, 2019). According to statistics from the International Energy Agency (IEA), China’s energy-related carbon dioxide emissions reached 12.1 billion tons in 2022, accounting for 32.88% of global energy-related carbon dioxide emissions (Rao et al., 2024). Regional energy carbon emissions have precipitated environmental challenges that severely threaten the sustainability of human societies. To address these concerns, the 2023 Chinese government work report advocated for “enhancing the balance and coordination of regional development” along with “promoting the ecological protection and high-quality development of the Yellow River Basin (YRB).” The YRB is pivotal for the economic prosperity of northern China and serves as a crucial energy resource hub, often referred to as the “energy basin (Yan et al., 2024).” This region boasts significant deposits of essential minerals such as rare earth elements, niobium, and molybdenum, which constitute more than 32% of the nation’s total mineral resources (Li et al., 2024). Notably, the YRB has been at the center of China’s energy-related carbon emissions and faces one of the highest rates of resource depletion and environmental degradation. This situation is exacerbated by the ambitious national goals for carbon neutrality and ecological sustainability, placing the region under considerable pressure to mitigate emissions and enhance environmental management (Zhu et al., 2024; Liu et al., 2024).
The First Law of Geography asserts the inherent relationality of all phenomena, with closer entities being more strongly related, thereby emphasizing the uneven nature of economic activities across space (Zhou et al., 2023; Liu et al., 2023). The spatial distributions of carbon sources and sinks in the YRB are inversely correlated. Variations in economic and social development and the differing resource endowments among the regions have contributed to significant inter-provincial and local disparities in carbon emissions. Economic growth, technological progress, and policy spillover have further exacerbated the imbalance in carbon emission reduction. To achieve the carbon emission reduction targets, geography should be considered as the foundation and systematically explore the factors influencing carbon emission growth and spatial transmission mechanisms. The combination of heterogeneous factors within each segment should be integrated to devise individualized and coordinated policies for emission reduction (Piwowar, 2019; Sun et al., 2024). An examination from a geographical perspective is imperative to investigate carbon emissions’ spatial clustering effects and their propagation mechanisms.
Accurately quantifying and forecasting carbon emissions (CEs) is an indispensable foundation and prerequisite for formulating effective emission reduction policies. The continuous development of earth observation technology has provided a fundamental means for humans to observe changes in earth’s spatial information from space. Remote sensing data offer ideal conditions for conducting comprehensive studies spanning large geographical areas and extended time periods. Defense Meteorological Satellite Program’s Operational Linescan System (DMSP/OLS) and Suomi National Polar-orbiting Partnership’s Visible Infrared Imaging Radiometer Suite (NPP/VIIRS) nighttime light data, with their advantages of long-term dynamic archiving, wide-area coverage, and open access to data outcomes (Zheng et al., 2024; Levin et al., 2020), have become indispensable information source for studying human nighttime economic and social activities (Dong et al., 2025). This provides theoretical basis and empirical cases for simulating multi-scale carbon emissions of the YRB via nighttime light data. However, existing research on carbon emissions in the YRB has primarily focused on general analyses of regional emissions (Zhu et al., 2024; Zhang et al., 2023). Notably, a multi-scale examination of the spatial-temporal variations, spatial spillover effects and determinants of carbon emissions in the YRB remains absent. Besides, there is a lack of research on utilizing both DMSP/OLS and NPP/VIIRS integrated data for studying carbon emissions in the YRB. As a complex socio-ecological network of interconnected rivers, the YRB exhibits pronounced interconnectivity in resource distribution and environmental characteristics across regions (Xu et al., 2023). These features necessitate the adoption of spatially explicit approaches to more accurately model carbon emissions and analyze their spillover mechanisms. Against this backdrop, the present study aims to achieve the following specific objectives: (1) quantify the spatiotemporal patterns of carbon emissions at the provincial and prefectural levels within the YRB through integration of DMSP/OLS and NPP/VIIRS nighttime light data; (2) empirically examine the spatial spillover effects and key determinants of carbon emissions using spatial econometric modeling; (3) identify emission hotspots and spatial lock-in phenomena associated with high emissions, so as to provide spatially targeted insights for improving the design and efficacy of regional emission mitigation policies.
This study’s most significant contributions are manifested through several key aspects: Primarily, by centering on the YRB, it conducts an in-depth analysis at multi-scale to reveal spatiotemporal disparities and complex interconnections with detailed granularity. Secondly, this research leverages long-term, comparable DMSP/OLS and NPP/VIIRS nighttime light data, to dynamically monitor the recent trends of provincial and urban carbon emissions in the YRB, overcoming the obstacles and bottlenecks associated with the dynamic estimation of regional carbon emissions over extended time series. Thirdly, the study introduces a spatial oriented exploratory framework alongside a spatial econometric model to conduct a thorough examination of the spatial spillover effects and driving factors of carbon emissions. This approach not only maps the spatial distribution of carbon emissions but also elucidates contributing socioeconomic and environmental factors, offering insights for targeted carbon reduction policies.
2 Materials and methods
2.1 Study areas
The Yellow River, known as the “Mother River,” is the second-longest river in China, spanning 5,464 km. The YRB is bounded by the Kunlun Mountains in the west, the Yinshan Mountains in the north, the Qinling Mountains in the south, and the Bohai Sea in the east. Its main tributaries flow through Qinghai, Sichuan, Gansu, Ningxia, Inner Mongolia, Shanxi, Shaanxi, Henan, and Shandong, as shown in Figure 1. The YRB plays a vital role in China’s economic growth, with its resident population, total GDP, industrial value added, and social fixed asset investment accounting for more than 50% of the northern region (Zhu et al., 2024). The economic development of the basin contributes to balancing the south and north and synergizes the east and west. Among China’s seven major river basins, the YRB possesses the most significant energy resources, forming a distribution pattern of “upstream hydropower, midstream coal, and downstream oil,” as shown in Table 1. Coal production in the basin has reached 3.59 billion tons, accounting for 80.67% of national coal production (Feng et al., 2024). Golden Triangle of Energy, which includes Ningdong, Yulin, and Ordos, accounts for 27% of China’s coal reserves. The basin hosts nine of the 14 large coal bases in China, including the Ningdong Base, Shendong Base, Jinbei Base, Jinzhong Base, Shaanbei Base, Jindong Base, Luxi Base, Huanglong Base, and Henan Base (see Figure 1).

Figure 1. Study area. (a) Geographical location of the YRB. (b) Distribution of major energy sources across the YRB.
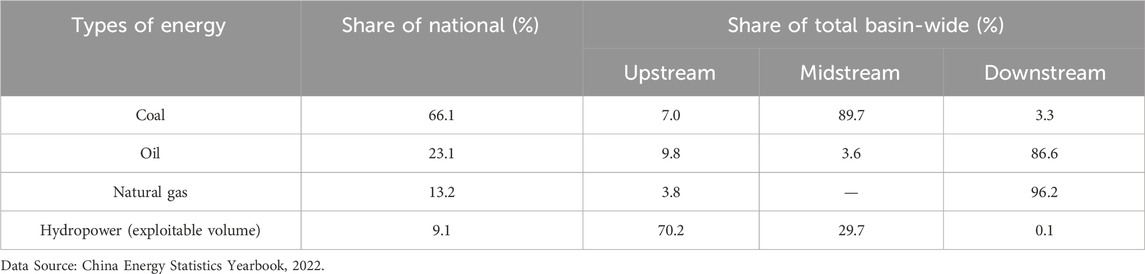
Table 1. Energy statistics for the Yellow River Basin.
2.2 Research methods
2.2.1 Carbon emission estimation model
This study employs the carbon emissions calculation method recommended by the Intergovernmental Panel on Climate Change (IPCC) to estimate the carbon emissions of the YRB (Yuan et al., 2020; Huisingh et al., 2015). The calculation is presented in Equation 1:
where
2.2.2 Constructing long time-series nighttime light dataset
The integration of DMSP-OLS and NPP-VIIRS nighttime light data presents methodological challenges due to fundamental differences in sensor characteristics, radiometric calibration, and data properties. Specifically, DMSP-OLS data exhibits a saturation effect where pixel values are capped at a digital number (DN) of 63, regardless of actual brightness intensity, whereas NPP-VIIRS data employs a continuous radiometric scale without upper limits, measured in nanoWatts/cm2/sr. These inherent differences necessitate systematic calibration and harmonization procedures to construct a consistent long time-series dataset.
This study selects DMSP-OLS data spanning 2000–2013 and NPP-VIIRS data covering 2012–2019, with overlapping years (2012–2013) serving as the calibration period. The construction methodology comprises three sequential stages (Lv et al., 2020; Gibson et al., 2021): (1) data preprocessing, (2) cross-sensor calibration, and (3) simulation of DMSP-OLS-like data from NPP-VIIRS observations.
2.2.2.1 Stage 1: data preprocessing
Both DMSP-OLS and NPP-VIIRS datasets undergo standardized preprocessing procedures including: (i) coordinate system transformation to a unified projection (Albers Equal Area Conic projection); (ii) spatial resampling to a consistent resolution of 1 km × 1 km using bilinear interpolation to preserve radiometric information (Wan et al., 2024; Gibson et al., 2021); (iii) geographic clipping to the study area boundary; and (iv) inter-annual calibration of DMSP-OLS data to eliminate systematic biases arising from sensor degradation and differences between satellite platforms.
2.2.2.2 Stage 2: cross-sensor calibration
Following established methodologies (Zheng et al., 2024; Wan et al., 2024), we establish an empirical regression relationship between DMSP-OLS and NPP-VIIRS brightness values using the overlapping years (2012–2013). The calibration process involves: (i) extracting pixel-level brightness values from both datasets for the overlapping period; (ii) applying logarithmic transformation to NPP-VIIRS data to compress the dynamic range and approximate the DMSP-OLS distribution; (iii) conducting pixel-by-pixel regression analysis; and (iv) validating the regression model using statistical metrics. The regression equation is formulated as Equation 2:
where y represents the simulated DMSP-OLS brightness values (DN); x denotes the original NPP-VIIRS brightness values (nanoWatts/cm2/sr). The logarithmic transformation accounts for the nonlinear relationship between the two sensor systems and mitigates the influence of extreme brightness values in NPP-VIIRS data.
2.2.2.3 Stage 3: model validation and data simulation
The regression model demonstrates robust performance with a coefficient of determination (R2) of 0.907 and statistical significance at p < 0.01, indicating strong explanatory power. The calibrated equation is subsequently applied to NPP-VIIRS data from 2014 to 2019 to generate DMSP-OLS-like brightness values, thereby extending the time series. This approach ensures temporal consistency and enables longitudinal analysis across the entire study period (2000–2019).
2.2.3 Carbon emission panel data model
Panel data, as a dataset with dimensions of cross-section and time series, can establish econometric models in multiple dimensions. Therefore, it is increasingly widely applied in empirical research. Compared to general regression models and spatial regression models, spatial panel data models have the advantages of improving parameter estimation effectiveness, increasing data degrees of freedom, and reducing data collinearity. The expression of panel data models is defined as Equation 3:
where
In this study, a panel data model is employed to establish a regression model between nighttime light DN values (denoted as D) and carbon emission statistics (denoted as C), and the fitted results are used to estimate multi-scale carbon emissions. The establishment of the carbon emission panel data model involves the following four steps: (1) To eliminate data instability and heteroscedasticity, the original data is log-transformed; (2) Unit root tests, cointegration analysis, and selection of panel models are conducted for the two variables of nighttime light DN values and carbon emission statistics in the panel data model; (3) Construction of the carbon emission panel data model; (4) Accuracy verification of simulated carbon emission data.
The carbon emission panel data model comprises two variables: DN values within provincial built-up areas and provincial carbon emission statistics. Unit root tests are conducted using both the same root (LLC test) and different roots (IPS test) to evaluate the variables. If the conclusions of the LLC test and the IPS test are inconsistent, the variables need to undergo differencing tests until the data reaches a stationary state. The results of the unit root tests for the variables are presented in Table 2.

Table 2. Unit root test of panel data model.
The results of the unit root test indicate that there is a stationary relationship between lnD and lnC. Further analysis examines whether there is a long-term cointegration relationship between the variables. This study employs the Pedroni test method to determine the existence of long-term cointegration among the variables, as shown in Table 3. At a significance level of 1%, the statistics and p-values of Modified Phillips-Perron t, Phillips-Perron t, and Augmented Dickey-Fuller t suggest that there is a long-term cointegration relationship between the variables, and the residuals of the regression equation are stationary, allowing for further fitting.

Table 3. Cointegration relationship test of panel data model.
After conducting unit root tests and cointegration analysis on the variables, based on the Hausman test, assuming the original model is a fixed effects model, according to the regression results, the final result is P = 0.1300, which is not significant at the 1% level. Therefore, the null hypothesis of the original fixed effects model is rejected, and the panel data model is ultimately determined to be a random effects model. The goodness of fit is R2 = 0.874. The specific results are presented in Equation 4:
It should be noted that the random effects specification for the carbon emission panel data model serves a distinct purpose from the subsequent spatial econometric analysis. This calibration model is designed specifically to establish a predictive relationship between nighttime light intensity and carbon emissions for estimation purposes, whereas the spatial Durbin model (Section 2.2.5) is employed for causal inference regarding the determinants of carbon emissions. The selection of random versus fixed effects in each case is determined independently through appropriate statistical tests (Hausman test) and is consistent with the specific analytical objectives and data structures of each model.
2.2.4 Exploratory spatial data analysis
2.2.4.1 Global spatial autocorrelation
Global spatial autocorrelation serves as a collective indicator of spatial interdependence among regions. This is often assessed by employing the global Moran’s I along with Z-score tests (Kim and Brown, 2025; Tian et al., 2025). These methods help determine the presence of spatial autocorrelation in regional carbon emissions and evaluate its strength and directional influence. The Global Moran’s I is defined as Equation 5:
where
2.2.4.2 Local spatial autocorrelation
Decomposing the Global Moran’s I into individual study units allows for the identification of local spatial autocorrelation, which is represented by the Local Moran’s I. For a specific spatial study unit i, it is defined in Equation 6:
where
2.2.5 Spatial econometric models
Spatial econometric models, including the Spatial Lag Model (SLM), Spatial Error Model (SEM), and Spatial Durbin model (SDM), are commonly used to analyze the spatial spillover effects of variables. Carbon emissions in the YRB are spatially interdependent; thus, ordinary panel models may produce biased estimates. Based on previous literature (Kopczewska and Elhorst, 2024), we construct a spatial econometric model to explore the influencing factors and spatial effects of carbon emissions in the YRB, as is shown in Equation 7:
where
The coefficients of the spatial econometric model do not directly reflect the effects of the corresponding explanatory variables on the dependent variable. Following Elhorst’s (2012) approach, spatial effects were decomposed into direct and indirect effects (spatial spillover effects) using a decomposition matrix calculation. The decomposition matrix is expressed in Equation 8:
where Y is carbon emissions, and the direct and spatial spillover effects are divided into diagonal and non-diagonal elements in the matrix corresponding to the right end of the equation.
2.3 Variables selection
Given the dynamic spatial and temporal patterns of carbon emissions within the YRB and the intricate multidimensional interplay of influencing factors, we opted to employ carbon emissions as the explanatory variable. Drawing from existing literature (Wu et al., 2024; Ge et al., 2025; Wang and Su, 2020), we select a comprehensive set of explanatory variables, including economic growth (EG), population density (PD), energy consumption structure (ECS), industrial structure (IS), technological progress (TP), and foreign direct investment (FDI). These variables are chosen based on their systematic relevance to carbon emissions dynamics and the availability of reliable data sources.
The selection of explanatory variables reflects the intricate spatial and temporal dynamics of carbon emissions and the multifaceted nature of influencing factors within the YRB. EG serves as a gauge of regional economic advancement and is measured through per capita GDP (Wang and Su, 2020). PD reflects the spatial distribution of inhabitants and is quantified by the number of residents per unit area of land (Shu et al., 2024). ECS is expressed as the ratio of coal consumption to total energy consumption, reflecting the predominance of coal within the region and the imperative of transitioning towards a low-carbon energy framework to mitigate emissions (Wu et al., 2024). IS delineated by the proportion of secondary sector output relative to total economic output, as the secondary sector typically exerts significant influence on carbon emissions (Ge et al., 2025). TP is assessed through the metric of patents granted per 1,000 inhabitants, as it furnishes technical support for regional industrial advancement and structural refinement, ultimately fostering enhanced production efficiency and alleviating pressure on carbon emissions (Pan et al., 2022). FDI is included to scrutinize its potential impact on carbon emissions, contemplating the “pollution halo” and “pollution refuge” effects (Zhang et al., 2025).
2.4 Data source and processing
Utilizing the datasets of DMSP/OLS and NPP/VIIRS nighttime light obtained from the NOAA’s National Geophysical Data Center (NGDC) (NOAA, 2024) and The National Tibetan Plateau/Third Pole Environment Data Center (TPDC, 2024), we perform calibration on these two types of data, resulting in stabilized nighttime light data. The cross-calibration of these two types of nighttime light data addresses the issue of pixel value oversaturation and enhances image clarity, while also filtering out background noise. Utilizing the calibrated nighttime light data, we obtain images of nighttime lights in the YRB, as illustrated in Figure 2. The energy, economic, and social data involved in the study of spatial spillover effects of carbon emissions and their influencing factors primarily derive from the China Statistical Yearbook, China Energy Statistical Yearbook, and provincial Statistical Yearbooks. Basin and municipal-level vector administrative boundaries are sourced from the National Geomatics Center of China (NGCC, 2024). Table 4 provides a comprehensive overview of the variables along with their statistical summaries.
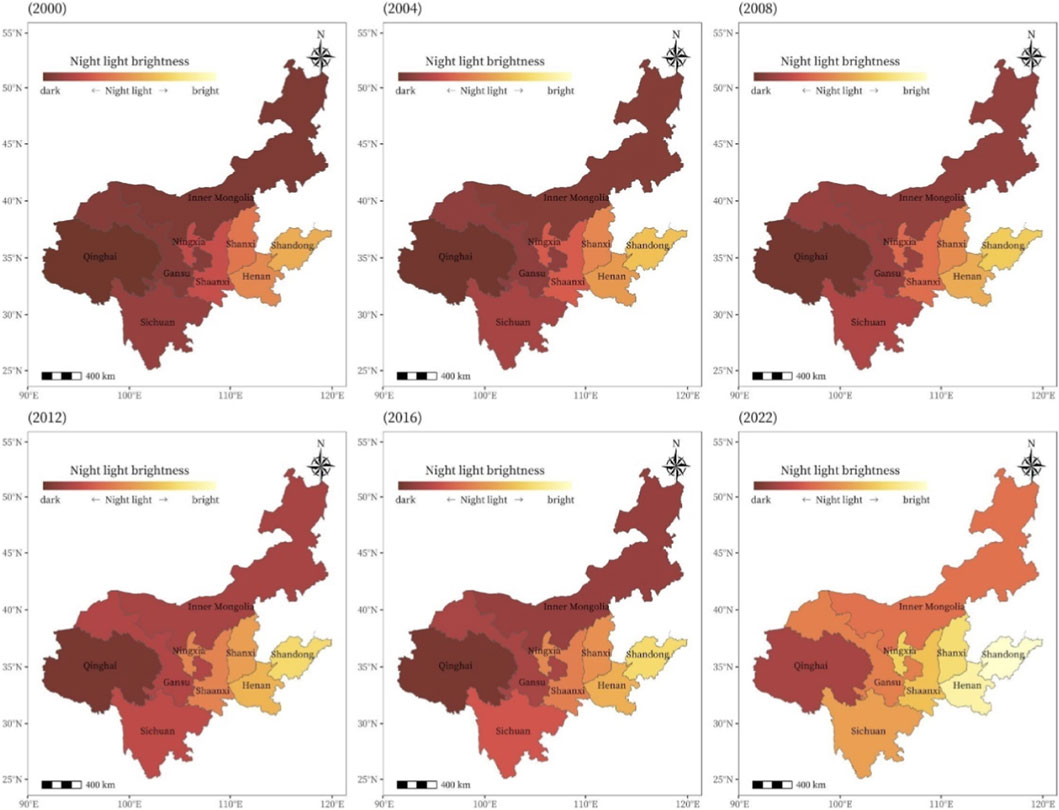
Figure 2. Nighttime light imagery of the YRB from 2000 to 2022.

Table 4. Description of variables and statistics summary.
To address heteroscedasticity and ensure the stability of regression estimates, all continuous variables are transformed using natural logarithms before being incorporated into the spatial econometric models. The descriptive statistics reported in Table 4 reflect the log-transformed values, which are dimensionless. This transformation is a standard practice in econometric analysis when dealing with variables that span multiple orders of magnitude (Wu et al., 2024; Zhou et al., 2023).
3 Results and discussion
3.1 Spatial-temporal patterns and dynamic evolution of carbon emissions
3.1.1 Spatial-temporal characteristics of carbon emissions at provincial level
We conduct an analysis of carbon emissions spanning the nine provinces within the YRB from 2000 to 2022. As illustrated in Figure 3, the spatial evolution of provincial carbon emissions unveils a relatively consistent distribution pattern across the region throughout the study period. At a temporal scale, the trajectory of carbon emissions growth exhibits three distinct phases: rapid escalation (2000–2011), modest stabilization (2012–2016), and renewed growth (2017–2022). During 2012–2016, carbon emissions experienced a slight deceleration rather than a substantial decline, with growth rates slowing from an average of 8.3% annually (2000–2011) to approximately 2.1% annually. This temporary stabilization coincided with the implementation of the National Sustainable Development Plan for Resource-Based Cities (2013–2020) and intensified environmental regulations. However, the limited magnitude and duration of this stabilization suggest that policy effects were insufficient to fundamentally alter the region’s carbon-intensive development trajectory. The subsequent emission rebound after 2016 indicates that structural factors—including continued reliance on coal-based energy (accounting for 66.1% of basin-wide energy consumption), persistent dominance of heavy industries, and renewed economic stimulus measures—outweighed the moderating effects of environmental policies. This pattern underscores the challenge of achieving sustained emission reductions in resource-dependent regions where economic growth remains tightly coupled with fossil fuel consumption. While initiatives such as the Belt and Road Initiative (launched in 2013) brought technological upgrades and industrial modernization to certain areas, these benefits were geographically concentrated and insufficient to offset basin-wide emission pressures (Xu et al., 2023; Wang and Xue, 2023).

Figure 3. Carbon emissions at provincial level of the YRB from 2000 to 2022.
At the spatial scale, various factors, encompassing economic and social development, environmental carrying capacity, resource endowment, and population dynamics, exert influence over the regional heterogeneity of carbon emissions across the YRB. Analysis of average annual carbon emissions reveals a pronounced gradient disparity among these provinces. Inner Mongolia, Shaanxi, Shandong, Shanxi, and Henan emerge as high carbon emission areas characterized by sizable and consistent carbon emission trends throughout the study period. These regions primarily serve as heavy industrial bases, reflecting development patterns marked by high energy consumption and dependency. Moreover, the substantial economic activity and dense population in provinces like Henan and Shandong contribute significantly to their elevated carbon emissions. Sichuan and Inner Mongolia exhibit medium-level carbon emissions during the period from 2000 to 2022. Conversely, Qinghai, Gansu, and Ningxia are categorized as low-carbon emission area. While modest reductions in carbon emissions are achieved across the nine provinces during the study period, their heavy reliance on resource-driven economic development poses challenges in significantly improving their energy-intensive, emission-heavy, and low-efficiency production modes in the near term (Zhu et al., 2024). The unsustainable nature of relying solely on resource exploitation to fuel regional economic growth underscores the necessity for transitioning towards more sustainable development approaches (Chen et al., 2022).
3.1.2 Spatial-temporal characteristics of carbon emissions at city level
As shown in Figure 4, the spatial-temporal distribution trends of urban carbon emissions in the YRB demonstrate remarkable stability, shaped by factors including economic status, policy orientation, and demographic changes. Notably, there is a phase-wise augmentation in carbon emissions, converging towards a distinct spatial distribution characterized by “lower reach > middle reach > upper reach.” This stability is delineated into high and low emission zones, as depicted in Figure 4, with high emission areas such as Ordos-Yinchuan-Hohhot, Xi’an-Weinan, Zhengzhou-Luoyang, and Jining-Jinan-Weifang exceeding annual emissions of 60 million tons. These regions, central to the YRB’s economic and industrial activities, highlight the challenges of managing carbon emissions in areas dominated by coal-based energy and heavy industries. In contrast, low emission zones like Xining and Shangluo, along with the Dingxi-Guyuan-Qingyang-Yan’an-Tongchuan cluster, emit less than 10 million tons annually, underscoring their ecological importance and lower economic activity impacts on energy demand. Notably, the Guyuan area, integral to the “Three Rivers” system of the Yellow River and known as the “Plateau Green Island,” exemplifies effective carbon assimilation and conservation efforts within the Loess Plateau. The consistent spatial configuration between high and low emission zones over time reflects the ongoing balance between regional economic development and ecological preservation efforts.

Figure 4. Carbon emissions at the city level of the YRB from 2000 to 2022 (Unit: 107 tons).
3.1.3 Spatial correlation test of carbon emissions
Referring to previous studies (Zhou et al., 2023), we conduct spatial correlation test utilizing Global Moran’s I to investigate the spatial clustering of carbon emissions within the YRB from 2000 to 2022, as summarized in Table 5. The findings reveal that the Global Moran’s I of carbon emissions from 2000 to 2022 surpasses 0, demonstrating a discernible trend of “rising, then falling, then rising.” Moreover, the associated p-value passes the 1% significant value, affirming significant spatial autocorrelation and an overarching spillover effect and interdependence in the spatial distribution of carbon emissions across provinces in the YRB (Liu et al., 2023). The extent of spatial clustering varies across different years, while the multiyear average value of the Global Moran’s I throughout the observation period stands at 0.3659. This value suggests a relatively stable spatial clustering of carbon emissions within the YRB over time.
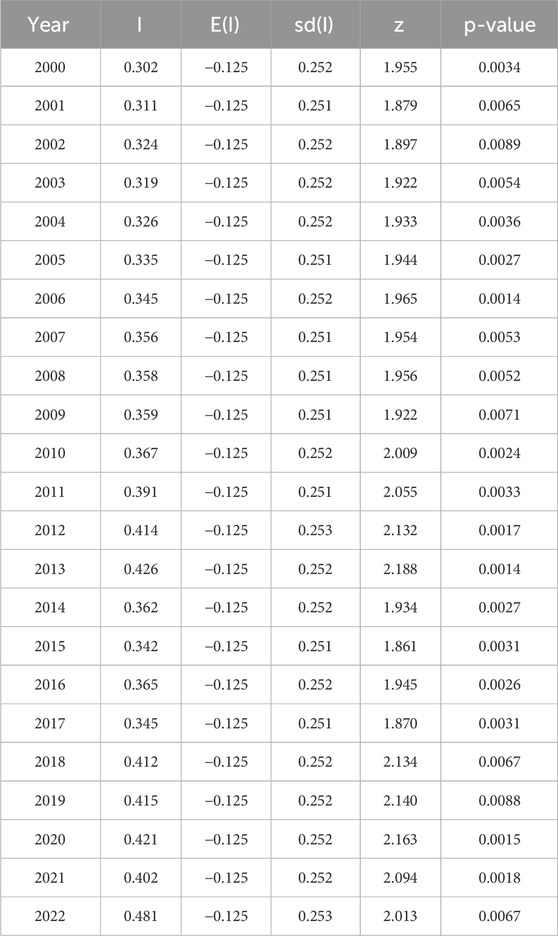
Table 5. Spatial correlation test results of the Global Moran’ I.
Furthermore, we employ Local Moran’s I to assess the spatial variability of carbon emission across the cities within the YRB, categorizing them into four quadrants based on spatial correlation patterns. The first quadrant (High-High, H-H) indicates high-emission provinces surrounded by others with similarly high emissions. Conversely, the second quadrant (Low-High, L-H) shows low-emission provinces surrounded by high-emission ones. The third quadrant (Low-Low, L-L) portrays low-emission provinces surrounded by others with low emissions. Finally, the fourth quadrant (High-Low, H-L) signifies high-emission provinces bordered by low-emission ones (Feng et al., 2020). Moran scatter plots depicting carbon emissions across the nine provinces in 2000, 2007, 2014, and 2021 are selected for analysis, as illustrated in Figure 5. Predominantly, cities within the YRB are situated in the first and third quadrants, accounting for 88.89% of the total sample. This result suggests a homogeneous spatial distribution of carbon emissions. This uniformity may be attributed to the ongoing progress in optimizing energy structures and enhancing economic efficiency in the middle and lower reaches of the YRB. However, despite these efforts, the overall carbon emissions within the region continue to rise. Overall, a robust positive spatial correlation is observed in the layout of carbon emissions within the YRB.

Figure 5. Moran scatterplot for different cities in the YRB from 2000 to 2022.
3.2 Influencing factors and spatial spillover effects of carbon emissions
The spatial dynamics of carbon emissions within the YRB demonstrate obvious fluctuations, reflecting the multifaceted influences and spatial clustering inherent in the emission processes. To accurately quantify the impact of various factors on carbon emissions, it is imperative to account for spatial spillover effects. Table 6 reports the baseline regression results of OLS-FE, SLM, SEM and SDM. Our analysis, detailed in Table 6, underscores the significance of employing a spatial econometric model. In terms of model fitting effectiveness, the regression coefficients of SDM exhibit more significant characteristics compared to those of OLS-FE, SLM, and SEM.
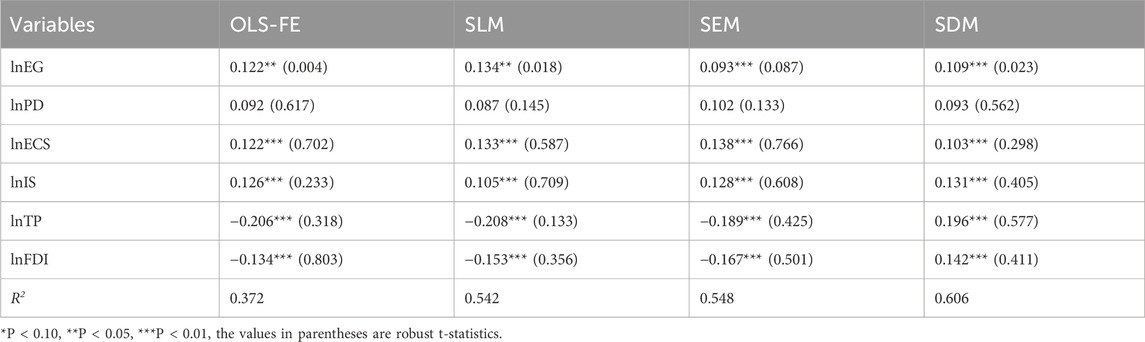
Table 6. Baseline regression results.
In examining the driving forces behind carbon emissions, as depicted in Table 6, it is evident that EG exhibits a significantly positive correlation with carbon emissions at the 1% level, indicating that larger economies tend to produce higher carbon emissions. The coefficient of PD is positive, yet not statistically significant, suggesting a negligible effect of PD on carbon emissions. Notably, ECS and IS demonstrate positive and significant associations at the 1% level, our findings are in line with prior research (Thio et al., 2022). This underscores a robust link between carbon emissions and structural dynamics, with a greater presence of secondary industries and reliance on coal consumption contributing to heightened emissions. Furthermore, TP and FDI exhibit noteworthy negative correlations with carbon emissions of the YRB, significant at the 1% level. These findings suggest that TP and FDI play pivotal roles in curtailing carbon emissions.
In summary, the YRB’s economic and demographic expansion has spurred heightened energy consumption, largely reliant on traditional sources with a limited share of clean energy, thereby escalating carbon emissions. The prevalence of heavy industries within the secondary sector, coupled with coal utilization as a primary energy source, further amplifies emissions. While TP and FDI offer avenues for emissions mitigation through upgraded production methods and enhanced energy efficiency, their current impact remains comparatively modest relative to the scale factor.
3.3 Spatial panel model selection
Referring to existing studies (Kim and Brown, 2025; Tian et al., 2025), we conduct a meticulous selection process to ascertain the most suitable model, as shown in Table 7. Firstly, the LM test can determine whether there are spatial lag and spatial error terms. Secondly, the LR test and Wald test are used to check whether the SDM degenerates into SLM or SEM. Finally, the Hausman test is used to check whether to choose fixed effects model or random effects model. The LM test rejects the null hypothesis of the absence of spatial lag and spatial error terms, indicating that the SDM is more suitable for addressing spatial dependence issues. Furthermore, the LR test rejects the null hypothesis (LR-lag = 98.134) and (LR-error = 44.294), and the LR test indicates that time-fixed effects are significant at the 1% level (LR-Time = 129.44). Moreover, the Hausman test is performed, and the P-value of the Hausman test passes the significance test at the 1% level, strongly rejecting the null hypothesis. Therefore, the fixed effects model is chosen, and the LR test indicates that time-fixed effects are significant at the 1% level, supporting the choice of the time-fixed effects model, thus selecting the time-fixed SDM.

Table 7. Test results of spatial panel model selection.
3.4 Spatial effect decomposition and further discussion
In our study, we utilize a robust analytical framework incorporating both inverse distance weight matrix (W1) and neighboring spatial weight matrix (W2) methodologies to comprehensively assess the direct, spatial spillover, and total effects of individual factors on carbon emissions through spatial effect decomposition. This methodological approach affords a refined elucidation of the magnitude and directional dynamics of specific effects. The direct effect reflects the immediate impact of explanatory variables on carbon emissions, encompassing any feedback mechanisms stemming from these variables’ influence on carbon emissions within neighboring provinces. Meanwhile, the spatial spillover effect quantifies the influence of explanatory variables from adjacent regions on carbon emissions within the focal area of the study (Zhou et al., 2023; Liu et al., 2023). The total effect, representing the cumulative impact, is derived from the summation of direct and spatial spillover effects, providing a holistic estimation of the average effect of explanatory variables on carbon emissions. Table 8 depicts a visual representation of the effect decomposition findings, thereby enhancing the interpret ability and clarity of our analysis.

Table 8. Effects decomposition results.
Regarding direct effects, it is noteworthy that EG, ECS, IS, TP, and FDI exhibit statistically significant impacts on carbon emissions within the YRB at the 1% significance level. This signifies their pivotal roles as primary drivers of carbon emissions in the region. Particularly noteworthy is the significant positive direct effect observed for EG, which also manifests notable spatial spillover effects, as identified through both the inverse distance weight matrix and neighboring spatial weight matrix methodologies (Raihan et al., 2022). These findings underscore the substantial influence of economic development on carbon emissions within the YRB, suggesting that the current resource-intensive economic growth paradigm fails to effectively mitigate carbon emissions, both locally and across neighboring areas, the findings is in line with existing research (Zhou et al., 2023; NGCC, 2024).
Despite exhibiting positive direct and spatial spillover effects, the influence of PD on carbon emissions fails to achieve statistical significance, as evidenced by the results of significance testing. This lack of statistical significance suggests that PD does not exert a significant impact on carbon emissions within the YRB. This phenomenon may be attributed to the clustering effect of regional population within the YRB’s dominant resource-intensive industries (Lohwasser et al., 2020; Lund et al., 2024). While population agglomeration often enhances economic productivity and resource utilization efficiency, it concurrently elevates energy and resource consumption levels. Moreover, demographic trends such as population divergence and aging, particularly evident in upstream and downstream regions, may diminish the overall population size effect, thereby attenuating economies of scale relative to energy consumption growth (Zhao et al., 2021).
Both ECS and IS exhibit significantly positive direct and spatial spillover effects across both weight matrices. This empirical evidence underscores the role of coal-based energy consumption and intensive industrial structure in the YRB as contributors to carbon emissions, with their “greenhouse effect” extending to neighboring regions. This phenomenon is attributed to the relatively lower adoption of low-carbon technologies within the resource-based cities of the YRB, magnifying the impact of ECS and IS on carbon emissions. These findings align with prior research conducted in the region (Lund et al., 2024; Wang and Xue, 2023), reaffirming the importance of these factors to effectively reduce carbon emissions. Mitigating carbon emissions necessitates prioritizing initiatives aimed at optimizing energy utilization and industrial structure. Additionally, breaking down administrative barriers between regions is crucial for fostering cross-regional collaboration and governance, essential for implementing concerted efforts towards carbon emission reduction (Chen et al., 2022).
TP exhibits significant negative direct, indirect, and total effects at the 1% level, implying its efficacy in mitigating carbon emissions through process improvements and innovation. Specifically, TP primarily diminishes carbon emissions by bolstering energy efficiency, resulting in reduced energy consumption per unit of GDP produced (Pan et al., 2022; Habiba et al., 2022). Our empirical findings underscore the negative impact of TP on carbon emissions, emphasizing the critical need to steer corporate research and development activities towards environmentally sustainable innovations to enact substantial emissions reductions. Moreover, the spatial spillover effects engendered by TP play a pivotal role in fostering carbon abatement in neighboring areas, largely attributable to the potent externalities of technological innovation (Adekoya et al., 2023). These effects are achieved through spatial transmission mechanisms, such as factor flow, technology spillover, and policy spillover, creating a positive cycle of emission and carbon reduction. These mechanisms produce a trickle-down effect and a siphon effect. Future endeavors should prioritize expediting the diffusion of technology across diverse regions to amplify carbon reduction efforts (Kuang et al., 2022).
Our analysis reveals a noteworthy pattern regarding FDI: while it exerts a significant negative direct effect on carbon emissions at the 1% significance level, its spatial spillover effect appears positive and less significant. These findings provide empirical support for the “Pollution Haven Hypothesis”, a concept that posits the relocation of highly polluting industries to host countries through FDI, consequently elevating their carbon emissions (Zhang et al., 2025; Demena and Afesorgbor, 2020). The observed negative direct effect of FDI on carbon emissions may stem from several factors, including the introduction of cleaner production technologies or enhanced environmental regulations associated with foreign investment (Ali et al., 2025). However, the positive spatial spillover effect implies that while the direct impact of FDI may lead to localized reductions in carbon emissions within the YRB, the indirect effects may spread pollution-related burdens to adjacent areas. The findings underscore the complexity of the relationship between FDI and carbon emissions, highlighting the need for effective policy interventions to mitigate potential adverse environmental impacts associated with industrial relocation. Moreover, these results emphasize the importance of international cooperation and regulatory frameworks to address the challenges posed by the globalization of polluting industries (Lee and Zhao, 2023). Further research exploring the mechanisms underlying these effects and examining potential policy solutions is warranted to inform sustainable development strategies and mitigate environmental degradation associated with FDI.
4 Conclusions and policy implications
4.1 Conclusions
This study advances the understanding of carbon emission dynamics in the Yellow River Basin through integrated nighttime light remote sensing and spatial econometric analysis spanning 2000–2022. Three key findings emerge with important theoretical and practical implications.
First, we establish a robust methodological framework integrating DMSP/OLS and NPP/VIIRS nighttime light data for multi-scale carbon emission estimation. This approach overcomes traditional data limitations and enables continuous monitoring across provincial and city levels, revealing a persistent “lower reaches > middle reaches > upper reaches” spatial gradient with identifiable emission hotspots requiring prioritized intervention.
Second, our spatial econometric analysis confirms significant spatial autocorrelation (average Moran’s I = 0.3659, p < 0.01) and spillover effects in carbon emissions, challenging the assumption of spatial independence in conventional emission studies. This finding necessitates a paradigm shift from isolated regional policies toward coordinated basin-wide governance mechanisms that account for cross-regional emission transmission.
Third, the decomposition of spatial effects reveals asymmetric impacts of driving factors. Economic growth, energy consumption structure, and industrial structure generate positive spillover effects, amplifying emissions in neighboring regions. Conversely, technological progress demonstrates negative spillover effects, suggesting that innovative investments yield basin-wide emission reduction benefits. Notably, FDI exhibits contradictory effects—reducing local emissions while potentially displacing pollution to adjacent areas—providing empirical evidence for the “Pollution Haven Hypothesis” within China’s regional context.
4.2 Policy implications
Based on the above conclusions, this study proposes the following suggestions to decrease carbon emissions and achieve sustainable development:
Firstly, carbon emissions management necessitates a well-conceived “top-level policy design” that integrates comprehensive industrial restructuring, optimized energy utilization, innovative technological solutions, and strategic utilization of selective FDI to effectively address the complexities of emission reduction and sustainable development. Given the dynamic nature of carbon emissions in the YRB, continuous monitoring of international trends, technological advancements, and policy innovations is essential. Establishing a cross-national platform for learning and exchange is suggested to facilitate the dissemination of experiences and best practices in this domain (Liu et al., 2022).
Secondly, the presence of multi-scale disparities and spatial spillover effects of carbon emissions within the YRB highlights the need for policy interventions that adopt an integrated basin governance approach, formulate cross-regional emission reduction policies, and promote synergistic development mechanisms. Emphasizing integrated river basin governance and cross-regional emission reduction policies should be prioritized in policy design (Aakko-Saksa et al., 2023). Moreover, expanding the scope of the carbon trading system to include more regions and industries within the YRB, coupled with the continuous promotion of carbon trading pilot projects, can leverage market-based instruments to foster low-carbon synergistic development across upstream, midstream, and downstream sectors.
Thirdly, considering the significant influence of ECS, EG, PD, and IS on carbon emissions, future strategies should prioritize several key actions. This entails assessing regional environmental capacity, expediting the transition from fossil energy models, implementing population control measures, targeting high-carbon areas for intervention, and accelerating energy-intensive industry modernization (Xing et al., 2024). Given the noticeable carbon reduction effects of TP and FDI, policymakers should prioritize fostering favorable business environments through preferential policies and attracting technology-intensive and capital-intensive foreign investments, particularly in capital cities and key urban clusters in the YRB. It is recommended to take proactive measures to decrease labor-intensive foreign investments while enhancing investment quality through multilateral cooperation with Belt and Road Initiative countries (Tiwari et al., 2024).
This study encountered several limitations that warrant consideration. The YRB encompasses a vast expanse with varied carbon emission dynamics across diverse spatial and temporal scales, aspects that were not exhaustively captured within the scope of this study. Besides, due to data availability constraints, six indicator variables were selected, thereby limiting the scope of potential solutions to these chosen variables. To deepen the understanding of the factors influencing carbon emissions, future research should expand data sources to include but is not limited to the utilization of clean energy sources such as hydropower and photovoltaic power generation, to further enrich and refine the existing research base.
Data availability statement
The original contributions presented in the study are included in the article/supplementary material, further inquiries can be directed to the corresponding author.
Author contributions
MM: Conceptualization, Data curation, Formal Analysis, Funding acquisition, Project administration, Validation, Visualization, Writing – original draft, Software. WG: Conceptualization, Formal Analysis, Investigation, Project administration, Resources, Writing – original draft. QL: Methodology, Project administration, Software, Validation, Writing – review and editing.
Funding
The authors declare that financial support was received for the research and/or publication of this article. This study was funded by Natural Science Foundation of Ningxia (No. 2024AAC03186), the National Natural Science Foundation (No. 61962002 and No. 72561001), and the National Social Science Fund (No. 21XMZ051).
Acknowledgements
We thank reviewers for their helpful comments and suggestions which led to an improved version of this study.
Conflict of interest
The authors declare that the research was conducted in the absence of any commercial or financial relationships that could be construed as a potential conflict of interest.
Generative AI statement
The authors declare that no Generative AI was used in the creation of this manuscript.
Any alternative text (alt text) provided alongside figures in this article has been generated by Frontiers with the support of artificial intelligence and reasonable efforts have been made to ensure accuracy, including review by the authors wherever possible. If you identify any issues, please contact us.
Publisher’s note
All claims expressed in this article are solely those of the authors and do not necessarily represent those of their affiliated organizations, or those of the publisher, the editors and the reviewers. Any product that may be evaluated in this article, or claim that may be made by its manufacturer, is not guaranteed or endorsed by the publisher.
References
Aakko-Saksa, P. T., Lehtoranta, K., Kuittinen, N., Järvinen, A., Jalkanen, J. P., Johnson, K., et al. (2023). Reduction in greenhouse gas and other emissions from ship engines: current trends and future options. Prog. Energ Combust. 94, 101055. doi:10.1016/j.pecs.2022.101055
Adekoya, O. B., Oliyide, J. A., Kenku, O. T., and Ajayi, O. F. (2023). China's technological spillover effect on the energy efficiency of the BRI countries. Energy Policy 182, 113740. doi:10.1016/j.enpol.2023.113740
Ali, M., Liu, X., Mehmood, S., Khan, M., and Oláh, J. (2025). Assessing the impact of FDI, CO2 emissions, economic growth, and income inequality on renewable energy consumption in Asia. Energy Strategy Rev. 58, 101653. doi:10.1016/j.esr.2025.101653
Chen, X., Meng, Q., Shi, J., Liu, Y., Sun, J., and Shen, W. (2022). Regional differences and convergence of carbon emissions intensity in cities along the yellow river basin in China. Land 11 (7), 1042. doi:10.3390/land11071042
Demena, B. A., and Afesorgbor, S. K. (2020). The effect of FDI on environmental emissions: evidence from a meta-analysis. Energy Policy 138, 111192. doi:10.1016/j.enpol.2019.111192
Dong, B. Y., Zhang, R. Y., Li, S. N., Ye, Y., and Huang, C. H. (2025). A meta-analysis for the nighttime light remote sensing data applied in urban research: key topics, hotspot study areas and new trends. Sci. Remote Sens. 11, 100186. doi:10.1016/j.srs.2024.100186
Feng, T., Du, H., Lin, Z., and Zuo, J. (2020). Spatial spillover effects of environmental regulations on air pollution: evidence from urban agglomerations in China. J. Environ. Manage. 272, 110998. doi:10.1016/j.jenvman.2020.110998
Feng, Y., Wang, J., Ren, X., Zhu, A., Xia, K., Zhang, W., et al. (2024). Impact of water utilization changes on the water-land-energy-carbon nexus in watersheds: a case study of yellow river basin, China. J. Clean. Prod. 443, 141148. doi:10.1016/j.jclepro.2024.141148
Ge, D., Huang, M., Jin, X., Liang, Z., Chang, W., and Yin, X. (2025). Carbon emission of rural household in China: a STIRPAT analysis of 30 provinces 2011–2021. Energy Build. 343, 115953. doi:10.1016/j.enbuild.2025.115953
Gibson, J., Olivia, S., Boe-Gibson, G., and Li, C. (2021). Which night lights data should we use in economics, and where? J. Dev. Econ. 149, 102602. doi:10.1016/j.jdeveco.2020.102602
Habiba, U. M. M. E., Xinbang, C., and Anwar, A. (2022). Do green technology innovations, financial development, and renewable energy use help to curb carbon emissions? Renew. Energy 193, 1082–1093. doi:10.1016/j.renene.2022.05.084
Huisingh, D., Zhang, Z., Moore, J. C., Qiao, Q., and Li, Q. (2015). Recent advances in carbon emissions reduction: policies, technologies, monitoring, assessment and modeling. J. Clean. Prod. 103, 1–12. doi:10.1016/j.jclepro.2015.04.098
Kim, S. W., and Brown, R. D. (2025). Measuring the impact of the urban microclimate on housing price using the spatial hedonic pricing method: the case study of mueller, Austin, TX. Appl. Geogr. 174, 103483. doi:10.1016/j.apgeog.2024.103483
Kopczewska, K., and Elhorst, P. (2024). New developments in spatial econometric modelling. Spat. Econ. Anal. 19 (1), 1–7. doi:10.1080/17421772.2023.2281173
Kuang, H., Akmal, Z., and Li, F. (2022). Measuring the effects of green technology innovations and renewable energy investment for reducing carbon emissions in China. Renew. Energy 197, 1–10. doi:10.1016/j.renene.2022.06.091
Lee, C. C., and Zhao, Y. N. (2023). Heterogeneity analysis of factors influencing CO2 emissions: the role of human capital, urbanization, and FDI. Renew. Sustain. Energy Rev. 185, 113644. doi:10.1016/j.rser.2023.113644
Levin, N., Kyba, C. C., Zhang, Q., De Miguel, A. S., Román, M. O., Li, X., et al. (2020). Remote sensing of night lights: a review and an outlook for the future. Remote Sens. Environ. 237, 111443. doi:10.1016/j.rse.2019.111443
Li, Y., Yang, X., Du, E., Liu, Y., Zhang, S., Yang, C., et al. (2024). A review on carbon emission accounting approaches for the electricity power industry. Appl. Energy 359, 122681. doi:10.1016/j.apenergy.2024.122681
Liu, Z., Deng, Z., Davis, S. J., Giron, C., and Ciais, P. (2022). Monitoring global carbon emissions in 2021. Nat. Rev. Earth Env. 3 (4), 217–219. doi:10.1038/s43017-022-00285-w
Liu, M., Guo, T., Ping, W., and Luo, L. (2023). Sustainability and stability: will ESG investment reduce the return and volatility spillover effects across the Chinese financial market? Energy Econ. 121, 106674. doi:10.1016/j.eneco.2023.106674
Liu, Q., Qiao, J., Li, M., and Huang, M. (2024). Spatiotemporal heterogeneity of ecosystem service interactions and their drivers at different spatial scales in the yellow river basin. Sci. Total Environ. 908, 168486. doi:10.1016/j.scitotenv.2023.168486
Lohwasser, J., Schaffer, A., and Brieden, A. (2020). The role of demographic and economic drivers on the environment in traditional and standardized STIRPAT analysis. Ecol. Econ. 178, 106811. doi:10.1016/j.ecolecon.2020.106811
Lund, I. H., Shaikh, F., Harijan, K., Kumar, L., and Dagar, V. (2024). Prospects of natural gas consumption in Pakistan: based on the LMDI-STIRPAT PLSR framework. Environ. Sci. Pollut. R. 31 (2), 2090–2103. doi:10.1007/s11356-023-31274-1
Lv, Q., Liu, H., Wang, J., and Shang, Y. (2020). Multiscale analysis on spatiotemporal dynamics of energy consumption CO2 emissions in China: utilizing the integrated of DMSP-OLS and NPP-VIIRS nighttime light datasets. Sci. Total Environ. 703, 134394. doi:10.1016/j.scitotenv.2019.134394
National Geomatics Center of China (2024). National fundamental geographic information services. Available online at: http://www.ngcc.cn (accessed May 5, 2024).
National Oceanic and Atmospheric Administration’s National Geophysical Data Center [NOAA NGDC] (2024). Global nighttime light data archive. Available online at: https://www.ngdc.noaa.gov/eog/download.html (accessed May 5, 2024).
National Tibetan Plateau/Third Pole Environment Data Center (2024). Scientific data resources of the Tibetan Plateau and the third pole. Available online at: https://poles.tpdc.ac.cn (accessed May 5, 2024).
Pan, X., Wang, Y., Shen, Z., and Song, M. (2022). Technological progress on embodied carbon emissions in G7 countries' exports: a structural decomposition analysis. J. Clean. Prod. 372, 133800. doi:10.1016/j.jclepro.2022.133800
Piwowar, A. (2019). Low-carbon agriculture in Poland: theoretical and practical challenges. Pol. J. Environ. Stud. 28 (4), 2785–2792. doi:10.15244/pjoes/92211
Raihan, A., Muhtasim, D. A., Khan, M. N. A., Pavel, M. I., and Faruk, O. (2022). Nexus between carbon emissions, economic growth, renewable energy use, and technological innovation towards achieving environmental sustainability in Bangladesh. Clean. Energy Syst. 3, 100032. doi:10.1016/j.cles.2022.100032
Rao, A., Hossain, M. R., Gupta, M., Parihar, J. S., and Sharma, G. D. (2024). Carbon conundrums: geopolitical clashes and market mayhem in the race for sustainability. J. Environ. Manage. 350, 119631. doi:10.1016/j.jenvman.2023.119631
Shu, X., Usman, M., Ahmad, P., and Irfan, M. (2024). Analyzing the asymmetric FinTech services under natural resources, and renewable energy in the future environmental performance: new insights from STIRPAT model framework. Resour. Policy 92, 104984. doi:10.1016/j.resourpol.2024.104984
Sierra, C. A., Metzler, H., Müller, M., and Kaiser, E. (2021). Closed-loop and congestion control of the global carbon-climate system. Clim. Change 165 (1), 15. doi:10.1007/s10584-021-03040-0
Sun, J., Qi, Y., Guo, J., Zheng, J., Zhang, L., and Yang, X. (2024). Impact of nighttime light data saturation correction on the application of carbon emissions spatialization: a comparative study of the correction effect and application effect based on five methods in China. J. Clean. Prod. 438, 140815. doi:10.1016/j.jclepro.2024.140815
Thio, E., Tan, M., Li, L., Salman, M., Long, X., Sun, H., et al. (2022). The estimation of influencing factors for carbon emissions based on EKC hypothesis and STIRPAT model: evidence from top 10 countries. Environ. Dev. Sustain. 24, 11231–11250. doi:10.1007/s10668-022-02221-w
Tian, L., Wei, C., and Wu, M. (2025). Statistical inference of partially linear time-varying coefficients spatial autoregressive panel data model. Spat. Stat-NETH. 66, 100887. doi:10.1016/j.spasta.2025.100887
Tiwari, T., Kaur, G. A., Singh, P. K., Balayan, S., Mishra, A., and Tiwari, A. (2024). Emerging bio-capture strategies for greenhouse gas reduction: navigating challenges towards carbon neutrality. Sci. Total Environ. 929, 172433. doi:10.1016/j.scitotenv.2024.172433
Wan, R., Qian, S., Ruan, J., Zhang, L., Zhang, Z., Zhu, S., et al. (2024). Modelling monthly-gridded carbon emissions based on nighttime light data. J. Environ. Manage. 354, 120391. doi:10.1016/j.jenvman.2024.120391
Wang, Q., and Su, M. (2020). Drivers of decoupling economic growth from carbon emission–an empirical analysis of 192 countries using decoupling model and decomposition method. Environ. Impact Asses. 81, 106356. doi:10.1016/j.eiar.2019.106356
Wang, L., and Xue, W. (2023). Analysis of carbon emission drivers and multi-scenario projection of carbon peaks in the yellow river basin. Sci. Rep-UK 13 (1), 13684. doi:10.1038/s41598-023-40998-6
Wu, C., Ge, M., Huang, Z., Wang, L., and Liu, T. (2024). An extended STIRPAT model and forecast of carbon emission based on green consumption behaviors: evidence from China. Environ. Dev. Sustain. 26 (4), 8955–8977. doi:10.1007/s10668-023-03077-4
Xing, P., Wang, Y., Ye, T., Sun, Y., Li, Q., Li, X., et al. (2024). Carbon emission efficiency of 284 cities in China based on machine learning approach: driving factors and regional heterogeneity. Energy Econ. 129, 107222. doi:10.1016/j.eneco.2023.107222
Xu, C., Zhang, Q., Yu, Q., Wang, J., Wang, F., Qiu, S., et al. (2023). Effects of land use/cover change on carbon storage between 2000 and 2040 in the yellow river basin, China. Ecol. Indic. 151, 110345. doi:10.1016/j.ecolind.2023.110345
Yan, Z., Wang, T., Ma, T., and Yang, D. (2024). Water-carbon-sediment synergies and trade-offs: multi-Faceted impacts of large-scale ecological restoration in the middle yellow river basin. J. Hydrol. 634, 131099. doi:10.1016/j.jhydrol.2024.131099
Yuan, X., Sheng, X., Chen, L., Tang, Y., Li, Y., Jia, Y., et al. (2020). Carbon footprint and embodied carbon transfer at the provincial level of the yellow river basin. Sci. Total Environ. 803, 149993. doi:10.1016/j.scitotenv.2021.149993
Zhang, Q., Li, J., Li, Y., and Huang, H. (2023). Coupling analysis and driving factors between carbon emission intensity and high-quality economic development: evidence from the yellow river basin, China. J. Clean. Prod. 423, 138831. doi:10.1016/j.jclepro.2023.138831
Zhang, Y., Liu, J., and Wang, S. (2025). The impact of carbon trading policy on embodied carbon emission in China's construction industry: evidence from a quasi-natural experiment. J. Clean. Prod. 522, 146354. doi:10.1016/j.jclepro.2025.146354
Zhao, K., Zhang, R., Liu, H., Wang, G., and Sun, X. (2021). Resource endowment, industrial structure, and green development of the yellow river basin. Sustainability-BASEL 13 (8), 4530. doi:10.3390/su13084530
Zheng, Y., Fan, M., Cai, Y., Fu, M., Yang, K., and Wei, C. (2024). Spatio-temporal pattern evolution of carbon emissions at the city-county-town scale in Fujian province based on DMSP/OLS and NPP/VIIRS nighttime light data. J. Clean. Prod. 442, 140958. doi:10.1016/j.jclepro.2024.140958
Zhou, K., Yang, J., Yang, T., and Ding, T. (2023). Spatial and temporal evolution characteristics and spillover effects of China's regional carbon emissions. J. Environ. Manage. 325, 116423. doi:10.1016/j.jenvman.2022.116423
Keywords: carbon emissions, Yellow River Basin, spatial-temporal variations, driving factors, spatial spillover effects, nighttime light data
Citation: Ma M, Gao W and Li Q (2025) What drives carbon emissions in the Yellow River Basin: new insights from multi-scale analysis based on nighttime light data. Front. Environ. Sci. 13:1711394. doi: 10.3389/fenvs.2025.1711394
Received: 24 September 2025; Accepted: 12 November 2025;
Published: 24 November 2025.
Edited by:
Qitao Xiao, Chinese Academy of Sciences (CAS), ChinaReviewed by:
Yuqing Miao, Anhui Normal University, ChinaWeixiao Han, Chinese Academy of Sciences (CAS), China
Copyright © 2025 Ma, Gao and Li. This is an open-access article distributed under the terms of the Creative Commons Attribution License (CC BY). The use, distribution or reproduction in other forums is permitted, provided the original author(s) and the copyright owner(s) are credited and that the original publication in this journal is cited, in accordance with accepted academic practice. No use, distribution or reproduction is permitted which does not comply with these terms.
*Correspondence: Mingjuan Ma, bWFtaW5nanVhbjIwMDlAMTYzLmNvbQ==