 Wan Youwei
 Xu Yaru
 Tang Xinfa
- School of Economic Management and Law, Jiangxi Science and Technology Normal University, Nanchang, China
Southwest China, an ecologically fragile region, faces acute dual challenges of sustaining economic growth while achieving carbon mitigation targets. This study employs the Generalized Divisia Index Method (GDIM) to quantify interactions among eight drivers of CO2 emissions in Yunnan, Guizhou, and Sichuan (2012–2023). Results reveal that GRP growth remains the dominant driver (32%–39% contribution) but with declining influence, signaling partial decoupling. Crucially, output carbon intensity (CO2/GDP) emerges as the strongest inhibitor (−26 to −30%), primarily due to industrial upgrading and clean energy transitions. Notable regional divergence is observed: per capita emissions rise in coal-dependent Guizhou but decline in hydropower-rich Yunnan and Sichuan. We propose province-specific pathways: (1) optimizing the energy structure and increasing the proportion of clean electricity; (2) Strengthen energy efficiency improvement in key industries; (3) Innovative regional collaborative emission reduction mechanism; (4) Promote low-carbon transformation of daily consumption; (5) Strengthen data foundation and capacity building. These findings provide actionable insights for low-carbon governance in developing regions with high ecological vulnerability.
1 Introduction
1.1 Research background
As global climate change problems become increasingly serious, countries have regarded climate change response as an important part of their national strategies and actively taken measures to reduce greenhouse gas emissions. China is the country with the largest carbon dioxide emissions in the world, and China’s research on carbon emissions plays a crucial role in the global climate governance process. China actively responds to the call of the international community and promises to achieve carbon peak by 2030 and achieve carbon neutrality by 2060. To achieve this goal, the National Development and Reform Commission officially launched the national low-carbon city pilot work in 2010, and further expanded the pilot scope in 2012 and 2017. The construction of low-carbon cities can be achieved by improving energy efficiency, optimizing energy structure, promoting the transformation of high carbon industries to low-carbon industries, and achieving more environmentally friendly resource allocation, thereby promoting the transformation of cities towards a green economy (Tang and Li, 2022). The policy measures for the pilot projects of low-carbon cities provide rich practical background and policy basis for studying the decomposition of carbon emission factors. There are differences in carbon emission characteristics in different regions. By decomposing carbon emission factors, we can deeply understand the degree of impact and mechanism of action of various factors on carbon emissions, so as to provide a scientific basis for formulating more targeted and effective emission reduction strategies to better adapt to national emission reduction goals and international response to climate change.
Yunnan, Guizhou and Sichuan are important regions in southwestern China with unique geographic locations and climatic conditions. The region is characterized by a plateau monsoon climate, complex and varied topography and fragile ecosystems, and is also one of the regions in China with a large number of impoverished people. Due to its special natural conditions and economic structure, a balance needs to be found between the development needs of Yunnan, Guizhou and Sichuan and environmental protection, while the study of carbon emissions and its factor decomposition helps to understand the main sources and drivers of carbon emissions in the region, so as to provide a basis for the formulation of scientifically sound regional development planning, industrial policies. By implementing energy conservation and consumption reduction measures, we can ensure stable economic growth while promoting ecological protection, and ultimately achieve the coordinated progress of development and sustainability.
1.2 Research significance
The study of factor decomposition of carbon emissions is a key topic in the field of environmental economics. In recent years, many scholars have used the index decomposition method to explore the driving factors of carbon emission changes. Among them, the Logarithmic Mean Divisi Index (LMDI) method is the most widely used due to its zero residuals and complete decomposability. A large amount of research has focused on the national level or developed provinces in the east, revealing the dominant role of technological factors such as economic scale and energy intensity. However, existing research has paid insufficient attention to the key region of Southwest China, where ecological vulnerability and development needs coexist, and is mostly limited to analyzing a single province, lacking a cross regional comparative perspective. More importantly, the LMDI method itself relies on the assumption of factor independence, which may result in bias when dealing with the interaction of multiple factors in complex systems.
Based on this, the marginal contribution of this article is mainly reflected in three aspects: Firstly, in terms of methodology, the GDIM system is applied for the first time to the study of carbon emissions in the Southwest region. This model can better handle the non independent effects between factors and improve the robustness of the decomposition results. Secondly, from a perspective, a comparative analysis will be conducted on Yunnan, Guizhou, and Sichuan provinces to delve into how the heterogeneity of resource endowment, industrial structure, and policy processes leads to the differential performance of driving factors. Thirdly, in terms of policy implications, the research findings can provide more targeted scientific support for the differentiated development of carbon peak pathways, optimization of energy policies, and strengthening regional collaborative emission reduction in the Southwest region.
Therefore, this article uses the GDIM method to decompose the carbon emissions of Yunnan, Guizhou, and Sichuan from 2012 to 2023. This not only helps to understand the dynamic driving mechanism of carbon emissions in the region, but also aims to fill the regional and methodological gaps in existing research, providing theoretical references and practical guidelines for promoting regional green and low-carbon development.
2 Analysis of carbon emissions in Yunnan, Guizhou and Sichuan
China has a vast territory, and there are significant differences in resource endowment, energy structure and economic conditions among provinces (Guan et al., 2024). The energy consumption and carbon emissions of urbanization and economic development show obvious regional characteristics according to different regions. Therefore, in the planning and implementation process of the “dual carbon” policy, it is not advisable to adopt a unified standard and generalized approach. It is extremely necessary to conduct in-depth analysis of carbon emissions in specific regions (Liu et al., 2025). The carbon emissions in Yunnan, Guizhou and Sichuan from 2012 to 2023 are shown in Figure 1.
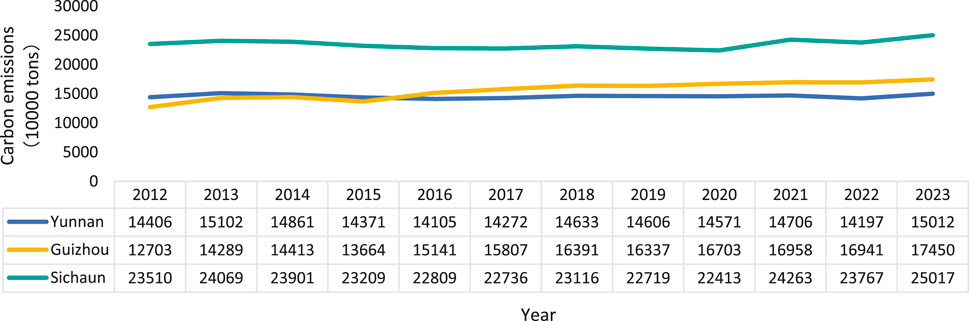
Figure 1. Carbon emissions in Yunnan, Guizhou and Sichuan in 2012–2023 (Data source: EDGAR database, GHG dataset released in October 2024) (Data description: The extracted carbon emission data covers the years 2012–2023).
2.1 Analysis of carbon emissions in Yunnan Province
Examining the carbon emission data of Yunnan Province from 2012 to 2023, its trajectory profoundly reflects the complex interactions and balance between the province’s economic development, energy structure transformation, and the national “dual carbon” goals. Overall, the province’s carbon emissions did not show a unilateral increase, but fluctuated within a range of 141–151 million tons, exhibiting a distinct characteristic of “overall stability with periodic fluctuations”.
The high fluctuation in 2012–2014 was consistent with the economic stage when the province relied on resource advantages to develop heavy chemical industry and fixed assets investment grew rapidly. The consecutive 3-year decline in carbon emissions since 2014 is attributed to two key factors: firstly, China’s economic development has entered a “new normal”, with a shift in growth rate; Secondly, Yunnan Province steadfastly promotes the green energy strategy. As the largest province in terms of hydropower in China, with the successive commissioning of giant hydropower stations such as Xiluodu and Wudongde, clean electricity has not only replaced thermal power in the province, but also supported emission reduction in the eastern region through the “West East Power Transmission”, greatly optimizing the local energy consumption structure. After 2017, carbon emissions entered a 5-year stable period, marking the initial decoupling of Yunnan’s economic growth from carbon emissions. While advanced manufacturing clusters such as green aluminum and green silicon are rapidly rising, carbon emissions have not increased significantly in sync, thanks to the fact that these industries consume “green electricity”. The fact that the 2020 data did not significantly decline due to the pandemic also indirectly proves that the economic structure supported by green energy has strong resilience (Chen et al., 2021). However, the strong rebound in 2023 is undoubtedly an important warning signal. This indicates that in the context of comprehensive economic recovery after the epidemic, the model of driving economic growth through major project investment will still bring about rigid growth in total energy consumption in the short term. When renewable energy sources such as hydropower encounter dry periods or insufficient water supply, thermal power still needs to be used for peak shaving and replenishment, leading to a rebound in carbon emissions.
In summary, Yunnan’s carbon emission history over the past 12 years has proven that its green energy advantage is the core ballast to curb the rapid growth of carbon emissions. However, the future path of emission reduction still faces enormous challenges. While consolidating the advantages of clean energy, it is necessary to further develop energy storage technology, optimize industrial structure, and deepen the electrification and low-carbon development of end use energy fields such as industry, construction, and transportation. Only then can we overcome the impact of economic fluctuations and ultimately move towards a high-quality low-carbon development path (Tang and Luo, 2022).
2.2 Analysis of carbon emissions in Guizhou Province
From the carbon emission data of Guizhou Province from 2012 to 2023, the overall trend shows a fluctuating upward trend, with carbon emissions increasing from 127 million tons in 2012 to 174 million tons in 2023, a cumulative increase of 37.4%. This change is closely related to the particularity of the economic development stage in Guizhou Province. As an important province in the national western development strategy and ecological civilization pilot zone, Guizhou is facing dual challenges of economic development and ecological protection against the backdrop of accelerated industrialization and urbanization. At the same time, as an energy and resource intensive province, Guizhou has a large proportion of high carbon industries, high total carbon emissions, and high carbon intensity, facing severe pressure to reduce carbon emissions (Cui et al., 2024).
The carbon emission trajectory shows significant stage characteristics: from 2012 to 2014, it was a period of rapid growth with an annual growth rate of 10.7%, which is closely related to the industrial structure and energy consumption structure of Guizhou. The main energy sources in Guizhou are coal and hydropower, and the coal processing loss for thermal power generation and heating is the largest in the energy consumption of processing and conversion. Therefore, during the processing, the highest carbon emissions are used for thermal power generation and heating, as shown in Figure 2 (He et al., 2017). In 2015–2016, there was a short-term correction with a 5.6% decrease in carbon emissions, which may be due to the implementation of the national “overcapacity reduction” policy and the initial effects of industrial restructuring. From 2017 to 2023, it entered a period of stable fluctuations, with an average annual growth rate slowing down to 1.2%. Especially after 2021, the growth rate has significantly slowed down, reflecting the beginning of green transformation measures such as the construction of ecological civilization pilot zones and the development of big data industries.
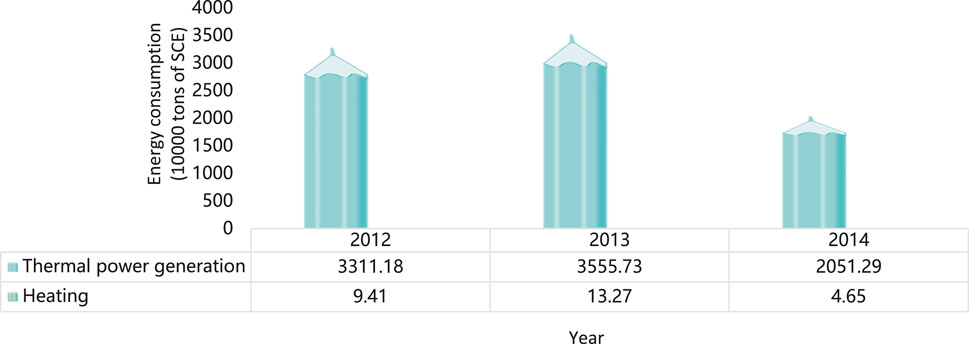
Figure 2. Consumption of thermal power generation and heating energy in Guizhou Province from 2012 to 2014 (Data source: China energy statistical yearbook).
2.3 Analysis of carbon emissions in Sichuan Province
The carbon emissions in Sichuan Province from 2012 to 2023 exhibit a phased characteristic of “first increasing, then decreasing, and then fluctuating and rebounding”, which deeply reflects the dynamic game between regional economic development, industrial structure adjustment, and the “dual carbon” strategy. From the perspective of industrial structure, although the carbon emissions of the agricultural sector are not the dominant factor, its unique production methods also have a certain impact on the carbon emissions of the entire province. Sichuan’s hilly and mountainous areas are widely distributed, and the level of agricultural mechanization is relatively low. With the outflow of rural labor in the process of urbanization, in order to maintain agricultural output, operators often supplement the shortage of labor by increasing inputs of production materials such as fertilizers, pesticides, and diesel, and improving the land replanting index. This mode of relying on chemical inputs and high-intensity land use not only ensures yield but also increases the carbon emissions level of the agricultural sector (Lang et al., 2019). However, overall, the main drivers of carbon emissions in Sichuan Province are still concentrated in the areas of industrial expansion and energy consumption, with relatively limited impact from agriculture.
From 2012 to 2013, carbon emissions increased from 235.1 million tons to 240.69 million tons, an increase of about 2.38%. During this period, Sichuan was transitioning from the middle to the late stage of industrialization, and the expansion of traditional fields such as energy and chemical engineering and infrastructure construction drove the growth of energy demand. Carbon emissions naturally expanded with the scale of the economy, showing a growth inertia of “development priority” stage. From 2014 to 2017, we entered a continuous carbon reduction cycle, during which the policies of “energy conservation and emission reduction” and “supply side structural reform” were deepened and implemented. Sichuan relied on the advantage of being the “largest hydropower base in the country” to promote clean energy structure, synchronously phasing out outdated production capacity such as steel and cement. The proportion of high energy consuming industries in the industrial sector significantly decreased, and the “dual optimization” of energy and industrial structure became the core driving force for emission reduction, demonstrating the deep integration of ecological responsibility and policy implementation. From 2018 to 2023, it entered a period of fluctuation and adjustment, with a slight rebound to 231.16 million tons in 2018, due to the balance between the recovery of the manufacturing industry under the background of stable growth and the flexibility of the “development emission reduction” policy. The continuous decline from 2019 to 2020 is driven by both the inertia of industrial upgrading and the emission reduction effect of economic activity contraction amplified by the impact of the epidemic. In 2021, carbon emissions surged to 242.63 million tons, an increase of 8.25%, due to the rebound in carbon emissions caused by the dual drive of traditional and emerging industries. The continuous game between policy tightening and high-quality economic growth in 2022–2023 highlights the policy resilience of “emission reduction in development” as carbon emissions slow down with the expansion of economic scale.
At present, carbon emissions in Sichuan Province still face challenges such as the lack of fundamental reversal in the traditional heavy chemical industry background and the need to strengthen the long-term support of emerging industries for emission reduction. In the future, it is necessary to anchor the three major directions of industrial green and intelligent upgrading, multi energy complementary synergy of energy systems, and market-oriented transformation of ecological value. Only by accurately balancing economic quality and efficiency improvement with stable carbon emissions reduction can we achieve long-term synergy between “stable growth” and “carbon neutrality”.
3 Research methodology
After clarifying the evolution characteristics of carbon emissions in the three provinces, it is necessary to further reveal the driving mechanisms behind them. Therefore, this study adopts the Generalized Divisia Index Decomposition method (GDIM) to construct a multi factor analysis framework, systematically identifying the key factors that affect carbon emissions and their contribution levels.
3.1 Method selection criteria and innovation
This study chooses the Generalized Divisia Index Decomposition (GDIM) as the core method for analyzing carbon emission driving factors, mainly based on the following three aspects: firstly, GDIM overcomes the limitations of LMDI in dealing with multiple factor interactions and non independent effects (such as factor independence assumptions), and is particularly suitable for regions with complex energy structures and significant regional heterogeneity, such as Yunnan, Guizhou, and Sichuan. Secondly, GDIM can more accurately capture nonlinear relationships and dynamic contributions through path integration and hierarchical decomposition frameworks, making it suitable for long-term (2012–2023) panel data analysis. Thirdly, GDIM can handle both absolute quantity and intensity indicators simultaneously, which is more in line with the evaluation needs of restrictive indicators such as energy consumption intensity and carbon intensity in the “dual carbon” policy.
Although previous studies have initially introduced GDIM into carbon emission analysis, its research subjects are mostly countries or developed provinces in the east, and there is still a lack of systematic comparative research on multiple provinces and driving mechanisms in the southwest. The decomposition method in this article refers to the literature on carbon emission factor decomposition based on GDIM by Yan Qingyou and Yin Jieting in 20171. On this basis, this article has deepened and innovated in terms of research object, temporal and spatial scope, policy background, and regional characteristics. The paper is the first to apply the GDIM system to the long-term carbon emission driving mechanism research of typical provinces in southwestern China (Yunnan, Guizhou, Sichuan) from 2012 to 2023, covering the key policy periods from the 12th Five Year Plan to the 14th Five Year Plan, which is an important spatiotemporal extension of existing research. Moreover, the clean energy structure dominated by hydropower, the transformation path of high carbon industries, and the positioning of ecological functional zones in the southwest region are in sharp contrast to other high-density urbanization areas. This study reveals the driving mechanism of regional differentiation through comparison among multiple provinces. Based on the framework of 8 variables and combined with the characteristics of the Southwest region, this study focuses on examining the indirect effects of hidden variables such as the proportion of hydropower, the proportion of high energy consuming industries, and carbon sink resources, and analyzes the contribution of “green electricity” to the output carbon intensity through hierarchical decomposition. At the same time, by combining regional specific policies such as “West East Electricity Transmission”, “Ecological Compensation Mechanism”, and “National Ecological Civilization Pilot Zone”, the dynamic contributions of various factors under policy intervention are quantified, providing empirical evidence for differentiated emission reduction policies.
3.2 Generalized Divisia index decomposition method
Originally proposed by Divisia in 1925, the Dee’s exponential decomposition method (Ang, 2003; Ang, 2015; Balezentis et al., 2011; Lin and Tan, 2017; Chong et al., 2017) is mainly used to analyze the decomposition relationship between economic variables. Subsequently, some scholars improved it and proposed the logarithmic mean Dirchard’s exponential decomposition (LMDI) method (Ang and Choi, 1997), which solves the problem of the difficulty of removing the residual term in the traditional Dirchard’s exponential decomposition method and can completely decompose the data, avoiding the problem of negative zero values. However, although the LMDI method has been widely applied in the fields of energy and environmental economics, it still has certain limitations. To overcome these limitations, researchers have proposed the generalized Divisia index decomposition method (GDIM) (Li et al., 2023; Vaninsky, 2014).
The generalized Divisia index decomposition method is a decomposition method used to analyze the impact of factors in the economy, environment and other fields. The method extends and improves upon the traditional Dee’s exponential decomposition method to address some of the limitations of the traditional method.
The basic idea of GDIM is to represent the target variable (such as carbon emissions) as a function of several influencing factors (such as regional GRP, energy consumption, population, etc.), and decompose the “contribution rate” of each factor to the total change during a certain period through mathematical methods. Simply put, just like the impact of breaking down the total weight of a basket of fruits into the weight changes of apples, oranges, and pears, GDIM helps us quantify the “credit” or “responsibility” of each factor for the overall change.
Assuming that the target variable
The total change
Among them,
Expressed in vector form as Equation 6:
where:
Since there is a certain relationship among each decomposition variable, when studying such problems, it is necessary to fully consider the relationship among the decomposition variables. Therefore, Equation 7 needs to be added:
Finally, the decomposition formula can be written in vector form, as shown in Equation 8:
where:
3.3 Decomposition of carbon emission factors
This article uses the generalized Divisia index decomposition method to decompose carbon emissions (Yan and Yin, 2017; Shao et al., 2017; Ang and Zhang, 2000) into the following Equation 9:
The variables thus involved and the corresponding specific concepts are shown in Table 1, with Equation 10:
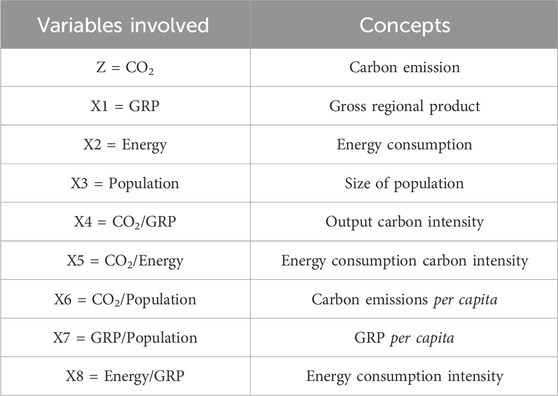
Table 1. Variables involved in the model and corresponding specific concepts.
Among them, Table 1 selects eight variables including GRP, energy consumption, population size, output carbon intensity, energy consumption carbon intensity, per capita carbon emissions, per capita GRP, and energy consumption intensity, which can systematically reveal the composite driving mechanism of carbon emissions. GRP and energy consumption respectively represent the core driving forces of economic scale expansion and rigid growth in energy demand, directly related to the increase in carbon emissions during industrialization and urbanization processes. The population size affects carbon emissions through a dual pathway of consumption expansion and labor supply, especially in areas with net population inflows and the formation of interactive effects with industrial structure. The output carbon intensity and energy consumption carbon intensity reflect the synergistic effect of technological efficiency and energy structure optimization. The former reflects the low-carbon transformation potential of unit economic output, while the latter quantifies the emission reduction contribution of clean energy substitution to fossil energy dependence. The per capita indicators (X6, X7) reveal regional development differences from the perspective of fairness, reflecting the carbon footprint characteristics of residents’ lifestyles and providing a basis for cross regional ecological compensation mechanisms. Energy consumption intensity, as a key variable linking the economy and energy system, can decompose the contributions of technological progress and industrial upgrading to energy efficiency improvement. Studying these 8 variables not only clarifies the multidimensional pathways of economic growth, energy structure, population dynamics, and technological innovation, but also provides scientific support for differentiated carbon peak pathways, optimized energy policies, and balanced ecological protection and economic development in the Southwest region.
According to the generalized Divisia index decomposition method, Equations 11, 12 are obtained:
For absolute factors
Then there is Equation 14:
4 Research results and analysis
4.1 Results of the research
In this paper, the data of Yunnan, Guizhou and Sichuan for the period of 2012–2023 are selected to analyze the influencing factors of carbon emission by using the generalized Divisia index decomposition method, and the data are mainly obtained from the statistical yearbooks of each province and the China Carbon Accounting Database. The accounting method of carbon emission adopts the method given in the 2006 IPCC Guidelines for National Greenhouse Gas Inventories, in which the carbon emission coefficients of various types of energy are taken from the data published by the Energy Research Institute of the National Development and Reform Commission (NDRC) in 2003, which can be seen in Table 2 (Zheng and Xu, 2012). The carbon emission coefficient system in the article strictly follows the methodology of the 2006 IPCC National Greenhouse Gas Inventory Guidelines, and maintains international comparability in key parameter settings such as fossil fuel carbon oxidation rate and low calorific value. For example, the coal carbon emission coefficient of 0.7476 t (C)/t is highly consistent with the IPCC recommended range of 0.726–0.756. At the same time, as a national level energy policy research institution, the Energy Research Institute of the National Development and Reform Commission’s data sources are based on localized calculations of China’s energy consumption structure, taking into account national characteristics such as the high proportion of coal and regional energy structure differences. Compared to international agency data (such as IEA or IPCC recommended values), this data is closer to the reality of energy consumption in the Southwest region, which is mainly based on coal. The standard deviation between the carbon emission coefficient released in 2003 and the updated data in recent years is less than 2%, indicating temporal stability, which is particularly important for longitudinal studies over a 12-year span (2012–2023).
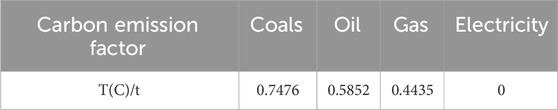
Table 2. Carbon emission factors for various energy sources.
With the help of the R software, the contribution of the eight factors, such as GDP, energy consumption and population size, to carbon emission in Yunnan, Guizhou and Sichuan is calculated. The detailed results are shown in Tables 3–5. The eight factors are divided into three categories for analysis, and the detailed classification and the average contribution rate are shown in Table 6, and the specific analysis results are as follows (Wang and Yu, 2019).
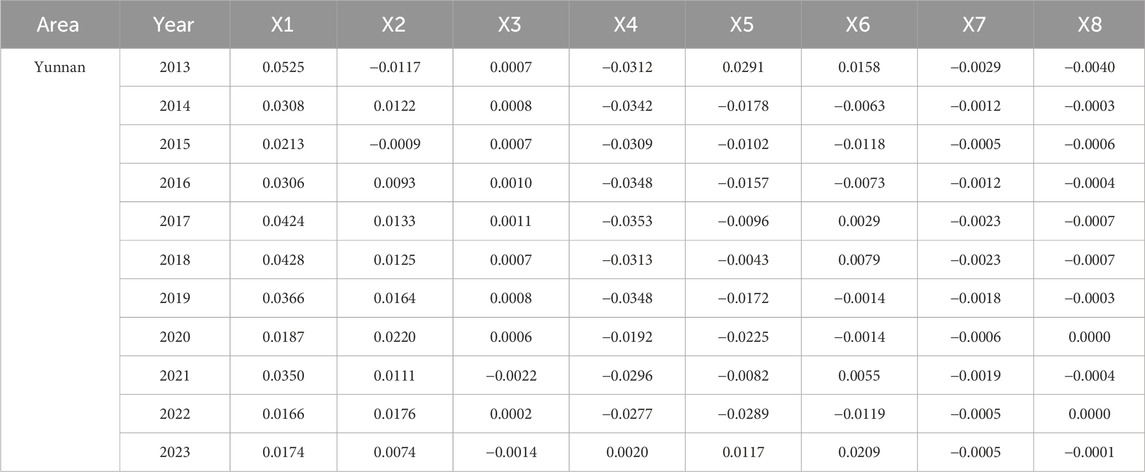
Table 3. Carbon emission contribution of Yunnan region in 2013–2023.
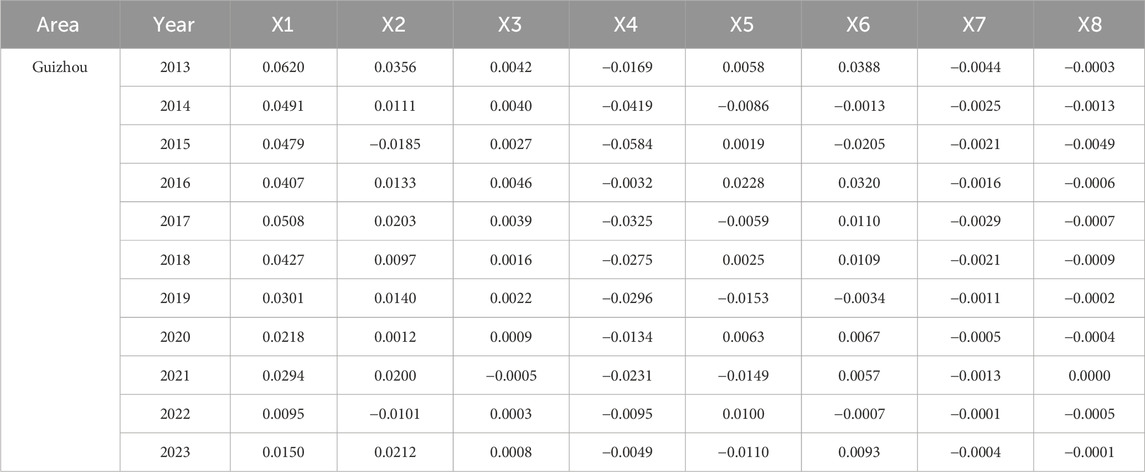
Table 4. Carbon emission contribution of Guizhou region in 2013–2023.
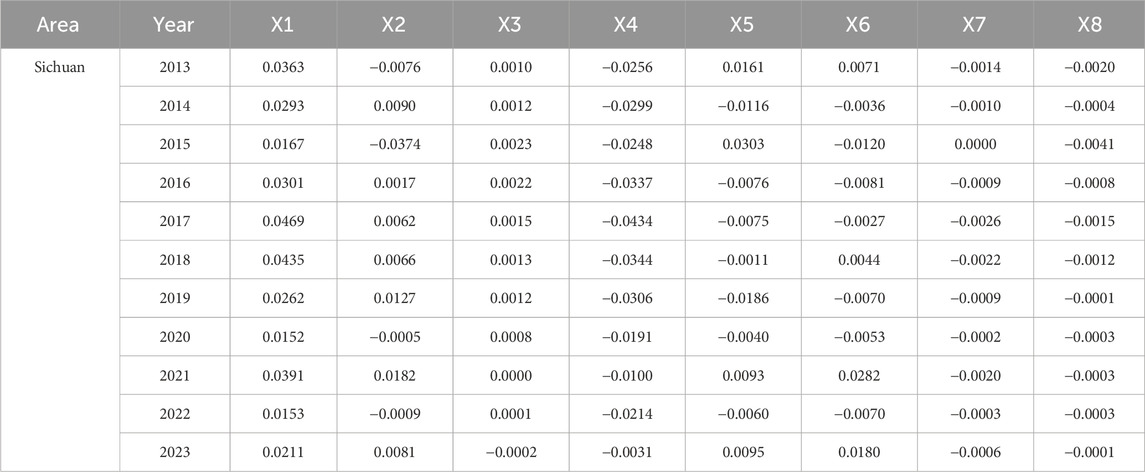
Table 5. Carbon emission contribution of Sichuan region in 2013–2023.
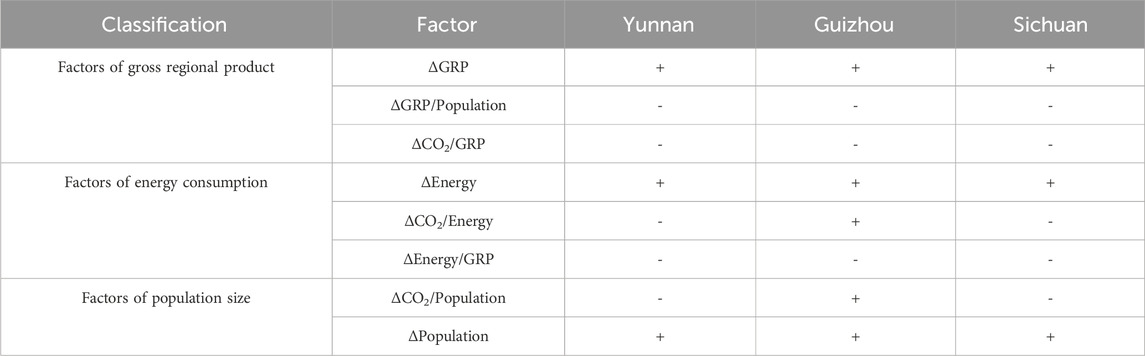
Table 6. Categorization and average contribution of carbon emission factors in Yunnan, Guizhou and Sichuan in 2013–2023.
4.2 Research analysis
4.2.1 Factor analysis of gross regional product
Gross regional product (GRP) is an important indicator for measuring the total economic activity of a region, which can measure the scale and development level of the regional economy, and visualize the regional economic achievements and scale size. The Gross Regional Product (GRP) of Yunnan, Guizhou and Sichuan is shown in Figure 3, from which it can be found that the total value of Sichuan’s GRP is much higher than that of Guizhou and Yunnan, while Guizhou’s GRP is the smallest, and the GRPs of all three provinces are increasing year by year. By 2023, the GDP of Yunnan, Guizhou and Sichuan will reach the maximum value of 3,002.1 billion yuan, 2,091.3 billion yuan and 6,013.3 billion yuan.
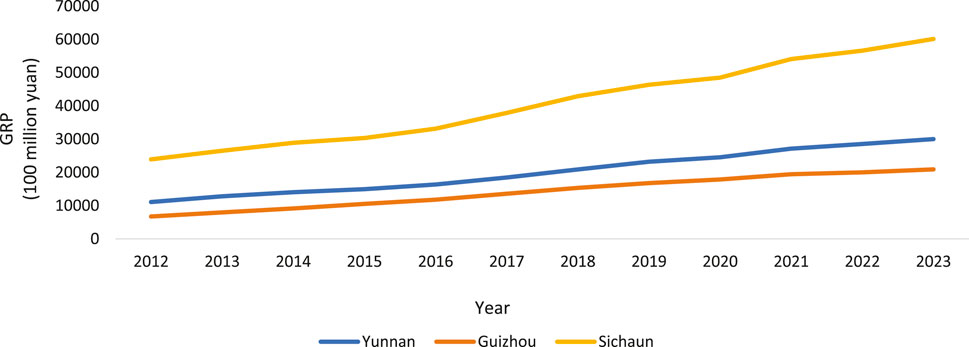
Figure 3. Gross domestic product of Yunnan, Guizhou and Sichuan for the period 2012–2023 (Data source: Statistical yearbook of each province).
The gross regional product of Sichuan region is significantly higher than that of Yunnan and Guizhou provinces, and its core advantage lies in its unique geographical conditions and population size. Located in the fertile Sichuan Basin, with a population of 83.68 million (2023), it provides ample labor and forms a huge consumer market. At the industrial level, Sichuan focuses on high-end industrial clusters such as electronic information and equipment manufacturing, relying on the radiation effect of Chengdu (accounting for nearly 40% of the province’s GRP) to build a complete industrial chain system, while Yunnan relies on traditional industries such as tobacco and tourism. Although Guizhou has laid out emerging industries such as big data and new energy vehicles, its industrial foundation is relatively weak. Combined with the policy dividends of the Chengdu Chongqing economic circle and the dense transportation network, Sichuan’s development momentum is even stronger. Yunnan slightly surpasses Guizhou due to its characteristic agriculture (such as coffee and tea) and cross-border trade advantages, and there is still room for improvement in Guizhou’s industrial transformation efficiency.
The cumulative incremental contributions of various factors to carbon emissions in Yunnan, Guizhou, and Sichuan are shown in Figures 4–6, respectively. It can be clearly concluded that GRP has the largest cumulative incremental contribution to carbon emissions in Yunnan, Guizhou, and Sichuan, reaching 34.47%, 39.9%, and 31.97%, respectively, as of 2023. For Yunnan and Sichuan, their contribution rates have shown a trend of first decreasing and then increasing year by year. Among them, the maximum contribution rate of Yunnan Province appeared in 2013, reaching 5.25%, while the minimum contribution rate appeared in 2022, reaching 1.66%. The fluctuation of Yunnan Province’s contribution rate is closely related to its unique “green energy green manufacturing” collaborative development model. The maximum contribution rate of Sichuan Province was 4.69% in 2017, which was consistent with the increase of infrastructure construction investment and the phased recovery of high energy consuming industries under the “the Belt and Road” initiative at that time. The minimum contribution rate occurred in 2020, reaching 1.52%, due to the combined impact of the pandemic on economic activity and the increase in the proportion of clean energy. From 2012 to 2023, the contribution rate of GRP to carbon emissions in Guizhou Province remained positive but overall showed a downward trend. As of 2023, the contribution rate of GRP to carbon emissions in Guizhou Province was 1.5%, a decrease of 4.7% from 2013. The underlying mechanism is that Guizhou’s industrialization and urbanization process lags behind the country. In recent years, by vigorously developing basic industries such as electrolytic aluminum and building materials to undertake the transfer of industries from the east, the path dependence of economic growth on energy intensive industries remains strong, resulting in relatively higher carbon costs for economic growth. Overall, the driving force on carbon emissions in Yunnan, Guizhou, and Sichuan is gradually decreasing. This change may be related to the gradual promotion of high-end industrial structure, the increase in the proportion of service industry, and green technology innovation in the three provinces, reflecting the transformation of economic growth mode towards low-carbon.
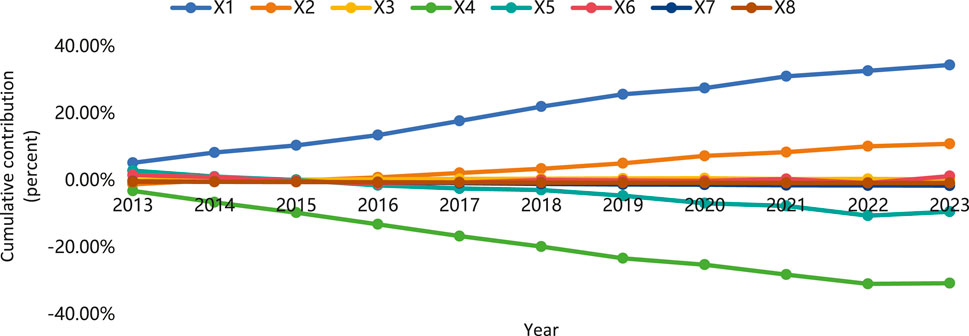
Figure 4. Cumulative incremental contribution of factors to carbon emissions in Yunnan Province over the period 2013–2023.
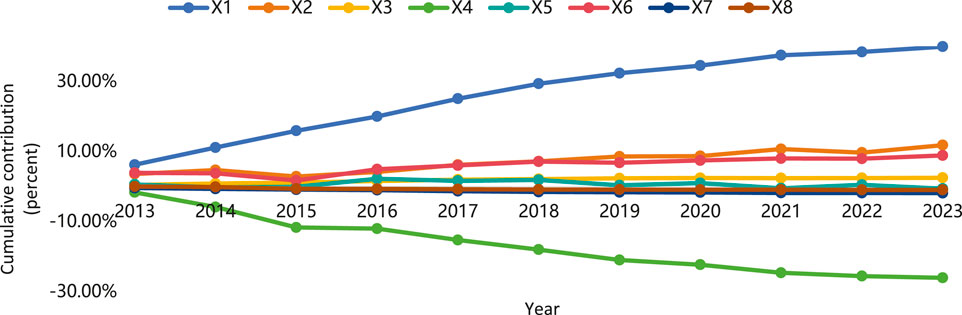
Figure 5. Cumulative incremental contribution of factors to carbon emissions in Guizhou Province over the period 2013–2023.
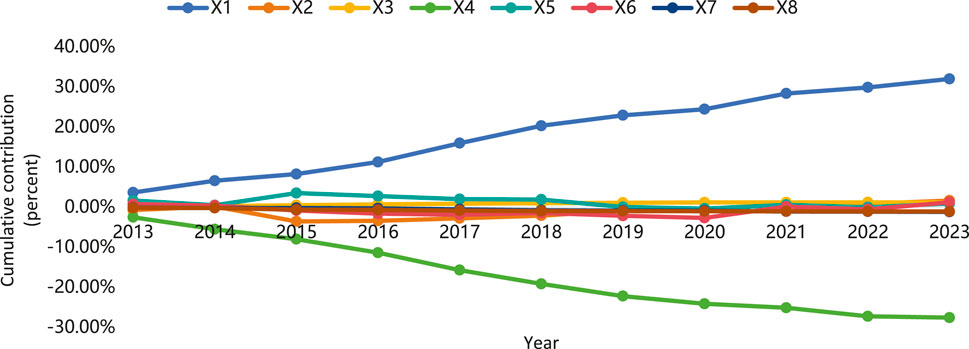
Figure 6. Cumulative incremental contribution of factors to carbon emissions in Sichuan Province over the period 2013–2023.
GRP per capita is an important macroeconomic indicator of regional economic development, which can reflect the level of economic output enjoyed by each resident on average, and is an important indicator of people’s living standard. From the decomposition results of ΔGRP/Population, it can be concluded that the contribution of GRP per capita to carbon emissions always shows a weak negative effect, and the cumulative contribution of Yunnan, Guizhou and Sichuan is −1.57%, −1.9% and −1.21% respectively. This is a positive signal, indicating that the fruits of economic growth have not been proportionally translated into an increase in residents’ carbon emissions, implying that the low-carbon transformation of lifestyles (such as green consumption and widespread public transportation) and the development of the sharing economy have to some extent suppressed the expansion of per capita carbon footprint. Due to the profound correlation between economic development level and carbon emissions, this indicates that the economic growth mode of Yunnan, Guizhou and Sichuan has, to a certain extent, shown a trend of relative decarbonization. In recent years, Yunnan, Guizhou and Sichuan have focused on the adjustment and optimization of the industrial structure, and increased the support and development of the tertiary industry, with the proportion of tourism and service industries in the economy gradually increasing. These industries consume less energy and emit less carbon, thus lowering the overall carbon emission level to a certain extent, so that while the per capita GRP grows, the carbon emission does not grow in the same proportion, and even has a weak negative effect.
The output carbon intensity reflects the degree of impact on the environment in the process of economic development and is an important indicator for measuring energy consumption and carbon emission efficiency in the process of regional economic development. From the decomposition results of Δ CO2/GRP, it can be concluded that the output carbon intensity of Yunnan, Guizhou, and Sichuan has always been negative from 2013 to 2023, showing an overall trend of first increasing and then decreasing. Moreover, the change in output carbon intensity has the greatest inhibitory effect on the increase of carbon emissions among all factors. As of 2023, the cumulative contribution rates have reached −30.7%, −26.09%, and −27.6%, respectively, which exceeds the sum of all other inhibitory factors. This is not only a result of technological progress, but also a reflection of profound changes in the energy structure. Yunnan, Guizhou, and Sichuan focus on industrial upgrading and technological transformation in industrial development, improving energy utilization efficiency, reducing energy consumption and carbon emissions. The core advantages of Yunnan and Sichuan lie in the green cycle model of “hydropower cascade development + high-end energy carrying industry”, where abundant hydropower resources provide clean electricity and attract and cultivate industries such as green aluminum, green silicon, and big data. Although these industries are high energy consuming, their energy consumption side has almost zero carbon emissions, greatly reducing the per unit GRP carbon emission intensity of the province. This is a emission reduction path dominated by “energy structure substitution”. The decrease in carbon intensity of Guizhou’s output relies more on “traditional industry technology transformation and energy efficiency improvement”. Due to the high proportion of coal in the energy structure, its emission reduction is mainly achieved through phasing out outdated production capacity, promoting energy-saving technologies, and partially replacing water and wind power. This also explains why the suppression of its carbon intensity output (−26.09%) is slightly lower than that of Yunnan and Sichuan, as the difficulty of energy structure transformation is greater.
4.2.2 Factor analysis of energy consumption
Energy consumption is the total amount of energy required for production, life, science and technology in a certain period of time, and it is an important indicator for measuring the efficiency of regional energy utilization and the degree of environmental protection. The energy consumption of Yunnan, Guizhou and Sichuan is shown in Figure 7, and it is also found that the energy consumption of Sichuan is much higher than that of Guizhou and Yunnan provinces, and the energy consumption of Yunnan province is more than that of Guizhou province. In the period of 2012–2023, the energy consumption of Sichuan Province is first declining and then rising, while Yunnan Province and Guizhou Province is a rising trend year by year, this is because of Sichuan Province’s large economic output, large industrial scale and large population, so that its energy demand base is large, in the early stage of industrial restructuring, energy consumption first declined, and then rose with the development of new industries and the recovery of traditional industries. Yunnan Province, tourism, special agriculture and part of the industrial development, Guizhou big data and other emerging industries, and the two provinces in the total population is relatively stable, economic development to promote energy consumption increases year by year. At the same time, the development of Sichuan started early, large-scale, early high-energy-consuming industries accounted for a large proportion of the adjustment and transformation process is complex, so there is a decline followed by a rise, while Yunnan, Guizhou, energy consumption in the early stages of the base is small, with the development of energy consumption is on the rise (Zhang et al., 2021).
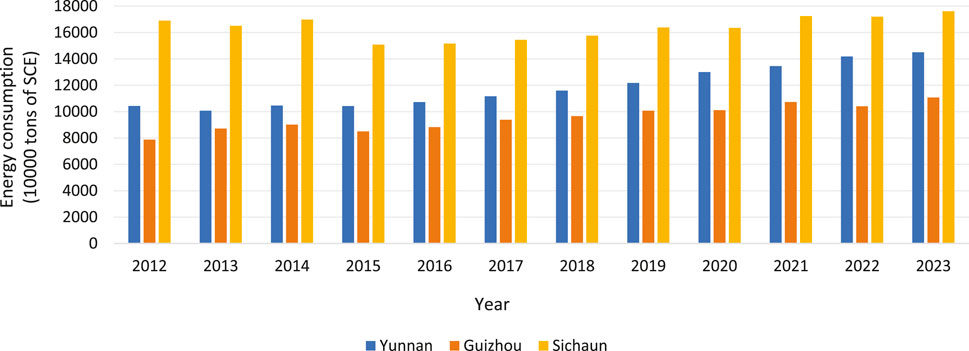
Figure 7. Yunnan, Guizhou and Sichuan Energy Consumption in 2012–20232 (Data source: Statistical Yearbook of Each Province).
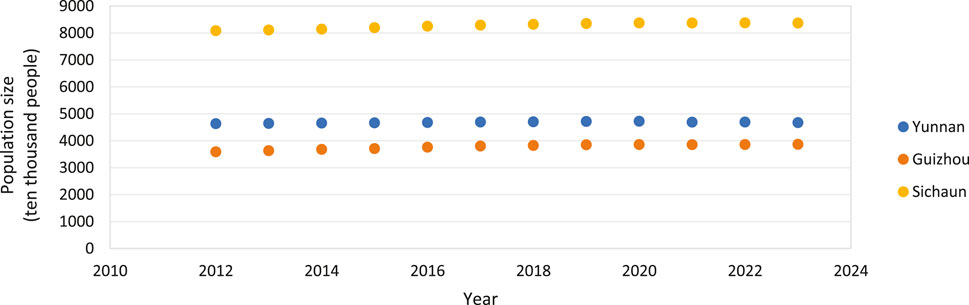
Figure 8. Population size of Yunnan, Guizhou and Sichuan in the period 2012–2023 (Data source: National Bureau of Statistics).
The contribution of energy consumption to carbon emissions in Yunnan, Guizhou and Sichuan and the cumulative contribution are both positive and negative at times, mostly positive but with a small amount of negative values, and the cumulative contribution is 10.92%, 11.78% and 1.61%, respectively, as of 2023. Although Yunnan, Guizhou and Sichuan have abundant clean energy resources, traditional energy sources (e.g., coal, etc.) still occupy a certain proportion in the energy structure, and the use of coal is difficult to be completely replaced in a short period of time in some remote areas or in specific industrial production, and its combustion process releases a large amount of carbon dioxide. Moreover, the accelerated urbanization of Yunnan, Guizhou and Sichuan has increased the demand for energy in terms of urban construction and improvement of the living standards of the residents, and energy is consumed in the construction of urban infrastructure, the development of the construction industry, and the daily life of the residents (e.g., heating, electricity, etc.).
The carbon intensity of energy consumption refers to the carbon dioxide emissions per unit of energy consumption, reflecting the impact of changes in the degree of low-carbon in energy consumption on carbon emissions (Xue et al., 2025). From the decomposition results of ΔCO2/Energy, it can be concluded that the contribution of carbon intensity of energy consumption to carbon emissions is sometimes positive and sometimes negative, but in general, energy consumption has an inhibiting effect on the increase of carbon emissions. As of 2023, the cumulative contribution rates of Yunnan, Guizhou and Sichuan are −9.36%, −0.64% and −0.88%, respectively. Yunnan, Guizhou and Sichuan have been actively promoting the optimization of the energy structure, increasing the proportion of clean energy sources, such as hydropower, wind power and solar energy, and decreasing the reliance on high-carbon energy sources, such as coal. As the installed capacity of clean energy continues to increase, the intensity of carbon emissions from energy consumption will gradually decrease, thus inhibiting the increase in carbon emissions. And Yunnan, Guizhou and Sichuan are constantly improving energy utilization efficiency through technological innovation, equipment renewal and strengthening energy management. For example, the promotion of energy-saving technologies and equipment in the industrial sector and the implementation of energy-saving standards in the construction sector have reduced the carbon emissions per unit of energy consumption, thereby reducing the intensity of carbon emissions.
Energy consumption intensity refers to the amount of energy consumed per unit of GDP, and is an important indicator of the efficiency of the comprehensive utilization of energy in different economies, reflecting the extent to which economic development utilizes energy. From the decomposition results of ΔEnergy/GRP, it can be concluded that the contribution rate of energy consumption intensity to carbon emissions is always negative, and the absolute value of the contribution rate shows a decreasing trend from year to year. Up to 2023, the cumulative contribution rates of Yunnan, Guizhou and Sichuan are −0.75%, −0.99% and −1.11%, respectively, which indicates that the contribution rate of energy consumption intensity to carbon emissions is always inhibited. Among them, the cumulative contribution rate of Yunnan is a bit higher compared with Guizhou and Sichuan, indicating that the industrial structure of Guizhou and Sichuan is more optimized compared with Yunnan, and the proportion of high energy-consuming industries is relatively low. Although Yunnan has abundant hydropower resources, the degree of development and utilization of hydropower in terms of energy use is not yet sufficient, coupled with the existence of instability in the supply of hydropower, resulting in the need to still rely on a certain proportion of fossil energy sources, such as coal and petroleum, which have a high carbon emission factor. Guizhou and Sichuan have done a better job of optimizing their energy mix, for example, by increasing the proportion of relatively cleaner energy sources such as natural gas, and have been more effective in the development and utilization of renewable energy.
4.2.3 Factor analysis of population size
Population size is a basic indicator reflecting the demographic resources of a region, the basic data for predicting future population development, and an important reference for formulating socio-economic development planning as well as relevant policies. From 2012 to 2023, the population of Yunnan, Guizhou, and Sichuan has shown a slow upward trend year by year, as shown in Figure 8. As of 2023, the population is 46.73 million, 38.65 million, and 83.68 million respectively.Population growth leads to increased demand for various resources, with each additional person creating more demand for food, housing, and transportation, among other things. Globally, historical data show that population growth is basically synchronized with increases in energy consumption and carbon emissions. Since the population of Sichuan Province is much larger than that of Yunnan and Guizhou Provinces, the population size of Sichuan Province has the greatest effect on carbon emissions.
Per capita carbon emission is an important indicator for assessing the contribution of GHG emission of a region, which is of great significance for promoting emission reduction and coping with climate change. From the decomposition results of ΔCO2/Population, it can be concluded that the contribution of per capita carbon emissions in Yunnan, Guizhou and Sichuan to carbon emissions is both positive and negative at times, while Guizhou cumulatively shows a pulling effect and Yunnan and Sichuan cumulatively show a suppressing effect. Guizhou is in the stage of rapid economic development and industrialization, and some high-energy-consuming and high-emission industries are developing rapidly, such as heavy industry, which leads to a large increase in energy consumption, thus increasing per capita carbon emissions. For Yunnan and Sichuan, in recent years, they have actively promoted the optimization and upgrading of their industrial structure, and vigorously developed low-energy-consuming and low-emission emerging industries, such as the service industry and high-technology industries, which have relatively reduced their reliance on high-emission industries, thus curbing the growth of per capita carbon emissions. At the same time, these two regions have also implemented more stringent environmental protection policies and emission reduction measures to strictly control the carbon emissions of enterprises, promoting energy conservation and emission reduction, and helping to reduce per capita carbon emissions.
4.3 Comparison of research results
To further verify the reliability and representativeness of the research results in this article, this section compares and analyzes the GDIM decomposition results of Yunnan, Guizhou, and Sichuan provinces with relevant studies in the Beijing Tianjin Hebei region (Yan and Yin, 2017). As a national strategic core region, the Beijing Tianjin Hebei region stands in stark contrast to the Southwest region in terms of economic development level, policy intervention intensity, and energy structure characteristics. Through comparison, the commonalities and differences in carbon emission driving mechanisms among different regions can be revealed.
4.3.1 Comparison of economies of scale effects
The cumulative contribution rates of economic growth (GRP) to carbon emissions in the Beijing Tianjin Hebei region from 2006 to 2015 were 37.08% (Beijing), 48.08% (Tianjin), and 34.08% (Hebei), respectively, all higher than those in the Yunnan Guizhou Sichuan region (34.47% in Yunnan, 39.9% in Guizhou, and 31.97% in Sichuan). It is worth noting that the contribution rate of GRP in the Beijing Tianjin Hebei region significantly decreased during the 12th Five Year Plan period, especially in Beijing, which dropped from 6.17% in 2006 to 2.48% in 2015, indicating that its economic growth decoupled from carbon emissions earlier than the Yunnan Guizhou Sichuan region. Yunguichuan is still in the middle stage of industrialization, and its economic growth relies heavily on high energy consuming industries, especially in Guizhou (39.9%) where carbon costs are high due to the transfer of industries from the east.
4.3.2 Comparison of technical effects
Carbon intensity (CO2/GRP) is the most significant inhibitory factor in both regions. The cumulative inhibitory effect is stronger in the Beijing Tianjin Hebei region (Beijing −37.67%, Tianjin −28.73%, Hebei −19.96%), especially in Beijing due to its high proportion of service industry and rapid technological progress, which has a significant inhibitory effect. The inhibitory effect of Yunnan, Guizhou, and Sichuan is slightly weak (Yunnan −30.7%, Guizhou −26.09%, Sichuan −27.6%), with Guizhou having the lowest inhibitory effect due to its high dependence on coal and difficulty in transforming its energy structure. Both regions indicate that technological progress and energy structure optimization are the core paths for emission reduction, but the Beijing Tianjin Hebei region has better effects due to its strong policy implementation and good technological foundation.
4.3.3 Comparison of energy structure effects
The carbon intensity of energy consumption (CO2/Energy) exhibits inhibitory effects in both the Beijing Tianjin Hebei region and the Yungui River, but there is a significant difference in intensity. The cumulative contribution rates of Beijing Tianjin Hebei are −6.85% for Beijing, −2.91% for Tianjin, and −1.63% for Hebei, while Yunguichuan is −9.36% for Yunnan, −0.64% for Guizhou, and −0.88% for Sichuan. Yunnan has a higher proportion of hydropower and a cleaner energy level than Hebei in the Beijing Tianjin Hebei region (with coal accounting for 74%), but Guizhou has the weakest inhibitory effect due to coal dominance. The Beijing Tianjin Hebei region is vigorously promoting clean energy through policies such as “coal to gas” conversion, while Yunnan, Guizhou, and Sichuan rely on natural endowments (such as hydropower) and have lower policy intervention intensity.
4.3.4 Comparison of population and per capita effects
Population growth drives carbon emissions in both regions, but the mechanisms of action are different. Due to its large population base and high urbanization rate, the population effect in the Beijing Tianjin Hebei region is significant, while the population effect in the Yunnan Guizhou Sichuan region is relatively weak. There is a significant difference in per capita carbon emissions contribution between the two regions, with Beijing playing a restraining role in the Beijing Tianjin Hebei region and Tianjin and Hebei playing a driving role. Yunnan, Guizhou, and Sichuan have a driving effect, while Yunnan and Sichuan have a restraining effect. This reflects the significant impact of urbanization level, consumption patterns, and industrial structure on per capita carbon emissions.
4.3.5 Summary of regional characteristics
The Beijing Tianjin Hebei region is mainly driven by policies, achieving energy structure optimization and technological upgrading through strong intervention. Economic growth has decoupled from carbon emissions earlier, but there are significant regional differences (Beijing leads, Hebei lags behind). The Yunnan Guizhou Sichuan region is dominated by resource endowment, with Yunnan and Sichuan provinces rich in hydropower having better emission reduction effects, while Guizhou faces greater pressure due to its dependence on coal. The overall situation is in the stage of “developing and reducing emissions”, and the carbon cost of economic growth is still relatively high. Comparison shows that the Yunnan Guizhou Sichuan region can learn from the policy experience of the Beijing Tianjin Hebei region, further strengthen technology introduction and regional coordination, but it also needs to be based on local realities, leverage the advantages of clean energy, and avoid a “one size fits all” policy.
5 Conclusions and suggestions
5.1 Conclusions
This article uses the GDIM method to decompose and analyze the driving factors of carbon emissions in Yunnan, Guizhou, and Sichuan provinces from 2012 to 2023, systematically revealing the mechanisms and regional heterogeneity of multidimensional factors such as economic growth, energy consumption, and population dynamics. Overall, the following conclusions can be drawn:
1. Among the eight carbon emission influencing factors, the cumulative contribution rates of Yunnan, Guizhou, and Sichuan are consistently ranked in the top three in absolute value order, namely, GRP, CO2/GRP, and Energy. However, the absolute value order of the other five carbon emission influencing factors varies among the three provinces. Overall, the absolute values of CO2/Population and GRP/Population are relatively high, while Population, Energy/GRP, and CO2/Energy are relatively low.
2. GRP is the primary factor driving carbon emissions growth, with the greatest driving force among all factors. As of 2023, its cumulative contribution rates have reached 34.47%, 39.9%, and 31.97%, respectively. Although the contribution rate to carbon emissions has always been positive, it is generally declining, indicating that the marginal driving effect of economic growth on carbon emissions in the three provinces is weakening, showing a relatively low-carbon trend, reflecting the characteristic of “relative decoupling” between economic growth and carbon emissions.
3. The output carbon intensity is the core factor that suppresses the growth of carbon emissions, and among all factors, it has the greatest inhibitory effect on the increase of carbon emissions. As of 2023, the cumulative contribution rates have reached −30.7%, −26.09%, and −27.6%, respectively, and its inhibitory effect exceeds the sum of all other inhibitory factors. This result highlights the significant achievements of the three provinces in improving carbon efficiency through industrial structure optimization and technological progress, but inter provincial differences also indicate that differences in energy structure and industrial foundation lead to differences in emission reduction potential and difficulty.
4. The population is showing a slow upward trend year by year, which plays a driving role in the carbon emissions of Yunnan, Guizhou, and Sichuan. Due to the fact that the population of Sichuan Province far exceeds that of Yunnan and Guizhou provinces, the population of Sichuan has the greatest impact on carbon emissions. The per capita carbon emissions have a driving effect on the cumulative emissions of Guizhou, while Yunnan and Sichuan have a restraining effect, indicating that differences in industrial structure and economic development can lead to significant differences in per capita carbon emissions.
5.2 Suggestions
Based on the aforementioned research conclusions and regional heterogeneity analysis, this article proposes the following differentiated policy recommendations aimed at promoting economic development and emission reduction benefits while fully considering the practical difficulties that may be faced in policy implementation in achieving carbon peak and carbon neutrality goals in Yunnan, Guizhou, and Sichuan provinces.
1. Continuously optimize the energy structure through differentiation strategies and increase the proportion of clean electricity (Wan et al., 2025). Data shows that Yunnan and Sichuan have shown stable negative contributions to energy consumption carbon intensity (CO2/Energy) due to their hydropower advantages, while Guizhou still has a slight positive contribution. Therefore, Yunnan should fully leverage its advantages in hydropower resources and focus on developing the “hydropower + green manufacturing” industrial cluster, such as high-end energy carrying industries such as green aluminum and green silicon, on the basis of consolidating the “West East Electricity Transmission”. It should also build supporting facilities for pumped storage and electrochemical energy storage to alleviate the power supply pressure during seasonal dry seasons. At the same time, encourage the development of distributed photovoltaic and agricultural photovoltaic complementary projects to further increase the proportion of clean energy. Guizhou is facing the practical challenges of high dependence on coal and difficulty in transforming its energy structure. It should focus on promoting the clean transformation and orderly substitution of coal-fired power, laying out new energy bases such as wind power and photovoltaics, and exploring the operation mechanism of “wind solar thermal storage integration”. Considering the large employment population in the coal-fired power industry, it is recommended to implement the “Coal Power Industry Transformation and Re employment Training Plan” simultaneously, support employees to transfer to new energy operation and maintenance, energy-saving services and other fields, and alleviate the risk of structural unemployment. On the basis of ensuring stable supply of hydropower, Sichuan actively develops diversified clean energy such as hydrogen energy and biomass energy, promotes the construction of multi energy complementary demonstration projects such as “hydro wind hydrogen storage” in the western Sichuan region, and enhances the resilience of the energy system (Zhu et al., 2025).
2. Focus on deep adjustment of industrial structure and strengthen energy efficiency improvement in key industries. Carbon intensity (CO2/GRP) is currently the most important carbon reduction factor, but its potential is far from being fully unleashed. Yunnan and Sichuan should continue to strengthen the development of low-carbon industrial clusters such as green aluminum silicon and electronic information, strictly enforce energy efficiency and carbon emission access, and promote the extension of the industrial chain towards high-end and intelligent development. Guizhou needs to focus on breaking the path dependence of high carbon industries, implement special actions for energy-saving and carbon reduction transformation in industries such as steel and chemical, and promote advanced technologies such as waste heat utilization, carbon capture, utilization, and storage (CCUS). It is suggested to establish a “High Carbon Industry Transformation Fund” to support enterprise technological transformation and capacity optimization, and reduce transformation costs. At the same time, in the field of agriculture, Sichuan needs to pay attention to the cost pressure brought by the reduction of fertilizers and pesticides and the transformation of agricultural machinery to electrification. It is suggested to reduce the burden of farmers’ transformation and promote low-carbon development of agriculture through agricultural green subsidies and low-carbon technology promotion.
3. Innovate regional collaborative emission reduction mechanisms and jointly build the Southwest Low Carbon Community (Tang et al., 2023; Ye and Wu, 2025). According to data analysis, the driving factors of carbon emissions in the three provinces have both commonalities and individualities, and have the potential for synergy and complementarity. Suggest establishing a regional green electricity trading platform to promote the priority replacement of Guizhou thermal power with surplus hydropower in Sichuan and Yunnan. Jointly carrying out forest carbon sink monitoring and trading pilot projects, Yunnan and Guizhou can transform their carbon sink advantages into cross regional ecological compensation funds. Jointly establish a low-carbon technology venture capital fund to support the research and demonstration of common technologies in the three provinces, such as CCUS for coal-fired power plants in Guizhou, smart charging for electric vehicles in Sichuan, and smart energy management systems for Yunnan.
4. Promote low-carbon transformation of daily consumption and strengthen emission reduction management in populous provinces. Data shows that due to its large population base and accelerated urbanization, Sichuan has enormous potential for carbon emissions in the consumer sector. Therefore, carbon inclusive systems can be implemented first in central cities such as Chengdu, Chongqing, Kunming, and Guiyang, exploring the establishment of individual carbon accounts to incentivize low-carbon behaviors such as public transportation travel and the purchase of energy-saving household appliances. At the same time, energy-saving renovation plans for urban and rural buildings can also be implemented, with a focus on improving the energy efficiency of old residential areas and rural housing in Sichuan and Yunnan. Strengthen the publicity of green and low-carbon life, advocate green consumption habits such as “Clean Your Plate Campaign” and clothing recycling, and reduce the per capita carbon footprint.
5. Strengthen data infrastructure and capacity building to support precise emission reduction decisions. This study found that there are still limitations in data availability, timeliness, and granularity. It is suggested that the statistical departments, energy bureaus, and ecological environment departments of the three provinces jointly establish the “Southwest Carbon Data Platform”, unify the accounting standards for energy and carbon emissions, release annual carbon emission inventories at the prefecture level, and establish a real-time monitoring system for carbon emissions based on the fusion of multi-source data such as electricity big data, traffic flow, and satellite remote sensing, providing support for more refined emission reduction policy formulation in the next step.
5.3 Limitations
While this study has achieved certain results, there are still limitations that need to be improved, such as:
1. Data availability and consistency issues. Due to differences in provincial statistical systems and adjustments to census data, some energy consumption data (especially data from Guizhou and Sichuan in 2023) were estimated through regression models. Although the scientific validity of the method was ensured as much as possible, there may still be some bias. In addition, changes in statistical calibers from different years, although processed uniformly, may still affect the precise comparability of time series.
2. Limitations of variable selection. This study mainly focuses on macro variables such as economy, energy, and population, and fails to include potential important influencing factors such as technological progress rate, foreign investment, environmental regulation intensity, and implicit carbon in international trade. Specifically, the lack of technological progress rate may underestimate the actual contribution of energy efficiency improvement and clean technology promotion to curbing carbon emissions. The neglect of environmental regulation intensity has resulted in insufficient reflection of the driving effect of policy intervention on industrial structure adjustment and corporate emission reduction behavior. In addition, foreign investment may affect regional carbon emissions through technology spillover effects or industrial transfer, while international trade implies carbon that involves the redistribution of carbon emission responsibilities between regions. The absence of these variables may prevent the decomposition results from fully reflecting the complex mechanisms driven by carbon emissions, especially when explaining regional differences and policy effects.
3. Insufficient handling of spatial heterogeneity. There are significant differences in the development stages, resource endowments, and industrial structures of various prefectures and cities within Yunnan, Guizhou, and Sichuan provinces. For example, the development models of the western Sichuan Plateau and Chengdu Plain, the northwestern and central Yunnan urban agglomerations, and the southeastern and western Guizhou regions are completely different. However, this study conducted an analysis at the provincial level and failed to reveal heterogeneity features at a smaller scale, which may mask the unique driving mechanisms of local regions.
5.4 Future research directions
Based on the model results and limitations of this study, future research can focus on deepening and expanding from the following aspects to more comprehensively and accurately reveal the driving mechanism and emission reduction path of carbon emissions in the Southwest region:
1. Regarding the issues of inconsistent and lagging data, it is recommended to conduct further research on integrating multiple sources of data to improve accuracy. For example, by combining energy statistics data from various provinces, real-time power generation data from power dispatch centers, and online monitoring data from key enterprises, a higher frequency (quarterly or monthly) and finer granularity (city level or even park level) carbon emission real-time accounting system can be constructed. Further utilization of big data and artificial intelligence technology can be used to interpolate and retrospectively revise missing data, establishing a unified and standardized energy economy environment (3E) basic database for the Southwest region.
2. Future research can systematically introduce explanatory variables that are not covered in this study but have important theoretical significance and policy value, such as technological progress rate, environmental regulation intensity, foreign investment, international trade implicit carbon, etc., to more comprehensively reveal the driving mechanism of carbon emissions. For example, technological progress can be measured by constructing green patent indicators, quantifying the intensity of environmental regulations using the frequency of environmental penalties or the proportion of environmental investment, analyzing the “pollution halo” or “pollution shelter” effect of foreign investment on regional carbon productivity, and using a multi regional input-output model to calculate implicit carbon flows. At the same time, the analysis unit can be further refined from the provincial level to the prefecture level and even county level, revealing the heterogeneity of emission drivers in different regions within the three provinces, providing a more solid scientific basis for differentiated and precise emission reduction policies.
Data availability statement
The original contributions presented in the study are included in the article/supplementary material, further inquiries can be directed to the corresponding author.
Author contributions
WY: Visualization, Writing – original draft, Writing – review and editing. XY: Writing – original draft, Writing – review and editing. PB: Writing – original draft, Writing – review and editing. TX: Writing – original draft, Writing – review and editing.
Funding
The author(s) declare that no financial support was received for the research and/or publication of this article.
Conflict of interest
The authors declare that the research was conducted in the absence of any commercial or financial relationships that could be construed as a potential conflict of interest.
Generative AI statement
The author(s) declare that no Generative AI was used in the creation of this manuscript.
Any alternative text (alt text) provided alongside figures in this article has been generated by Frontiers with the support of artificial intelligence and reasonable efforts have been made to ensure accuracy, including review by the authors wherever possible. If you identify any issues, please contact us.
Publisher’s note
All claims expressed in this article are solely those of the authors and do not necessarily represent those of their affiliated organizations, or those of the publisher, the editors and the reviewers. Any product that may be evaluated in this article, or claim that may be made by its manufacturer, is not guaranteed or endorsed by the publisher.
References
Ang, B. (2003). The LMDI approach to decomposition analysis: a practical guide. Energy Policy 33 (7), 867–871. doi:10.1016/j.enpol.2003.10.010
Ang, B. (2015). LMDI decomposition approach: a guide for implementation. Energy Policy 86, 233–238. doi:10.1016/j.enpol.2015.07.007
Ang, B., and Choi, K. (1997). Decomposition of aggregate energy and gas emission intensities for industry: a refined Divisia index method. Energy J. 18, 59–73. doi:10.5547/issn0195-6574-ej-vol18-no3-3
Ang, B., and Zhang, F. (2000). A survey of index decomposition analysis in energy and environmental studies. Energy 25 (12), 1149–1176. doi:10.1016/S0360-5442(00)00039-6
Balezentis, A., Balezentis, T., and Streimikiene, D. (2011). The energy intensity in Lithuania during 1995–2009: a LMDI approach. Energy Policy 39 (11), 7322–7334. doi:10.1016/j.enpol.2011.08.055
Chen, H., Yang, T., Gan, Y., Zhao, Y., Wang, Q., Ru, Y., et al. (2021). Carbon emission analysis and carbon emission reduction strategy research of energy industry in Yunnan Province. Yunnan Sci. Technol. Manag. 34 (02), 1004–1168. doi:10.19774/j.cnki.53-1085.2021.02.009
Chong, C., Liu, P., Ma, L., Li, Z., Ni, W., Li, X., et al. (2017). LMDI decomposition of energy consumption in Guangdong Province, China, based on an energy allocation diagram. Energy 133, 525–544. doi:10.1016/j.energy.2017.05.045
Cui, L., Wang, J., Chen, X., and Song, M. (2024). Regional policy options for carbon peaking in the Yangtze River Delta under uncertainty. Joumal Environ. Manag. 364, 121445. doi:10.1016/j.jenvman.2024.121445
Guan, W., Xu, H., Li, H., Wu, X., Wu, W., and Wu, L. (2024). Evolution and simulation prediction of carbon emissions from energy consumption in China. Environ. Sci. 10, 13227. doi:10.13227/j.hjkx.202408078
He, X., Zhao, H., Liu, Q., Li, H., and Huang, H. (2017). Influence factors of energy-related carbon emissions in Guizhou Province. Guizhou Sci. 35 (05), 1003–6563. doi:10.3969/j.issn.1003-6563.2017.05.011
Lang, H., Xiao, S., and Wang, Y. (2019). Decoupling effect analysis of agricultural carbon emissions and economic growth in Sichuan Province. J. Shandong Agric. Univ. Soc. Sci. Ed. 21 (02), 1008–8091.
Li, W., Wen, H., and Nie, P. (2023). Prediction of China's industrial carbon peak: based on GDIM-MC model and LSTM-NN model. Energy Strategy Rev. 50, 101240. doi:10.1016/j,esr.2023.101240
Lin, B., and Tan, R. (2017). Sustainable development of China's energy intensive industries: from the aspect of carbon dioxide emissions reduction. Renew. Sustain. Energy Rev. 77, 386–394. doi:10.1016/j.rser.2017.04.042
Liu, H., Li, S., Zhang, X., Qiu, W., and Ma, J. (2025). Accounting and driving factors analysis of carbon emissions in Heilongjiang Province. Environ. Sci. 10, 13227. doi:10.13227/j.hjkx.202412186
Shao, S., Zhang, X., and Zhao, X. (2017). Empirical decomposition and peaking pathway of carbon dioxide emissions of China’s manufacturing sector——generalized Divisia index method and dynamic scenario analysis. Industrial Econ. China 3, 44–63. doi:10.19581/j.cnki.ciejournal.2017.03.003
Tang, X., and Li, J. (2022). Study of the mechanism of digitalization boosting urban low-carbon transformation. Front. Environ. Sci. 10, 982864. doi:10.3389/fenvs.2022.982864
Tang, X., and Luo, X. (2022). Research on energy policies of Jiangxi province under the dual-carbon constraints. Front. Environ. Sci. 10, 986385. doi:10.3389/fenvs.2022.986385
Tang, X., Sun, Y., Zhang, C., Wu, L., and Luo, Y. (2023). Research on the promotion of digital teaching and learning toward achieving China’s dual-carbon strategy. Front. Environ. Sci. 11, 983526. doi:10.3389/fenvs.2023.983526
Vaninsky, A. (2014). Factorial decomposition of CO2 emissions: a generalized Divisia index approach. Energy Econ. 45, 389–400. doi:10.1016/j.eneco.2014.07.008
Wan, Y., Pan, B., Xu, Y., Yu, Y., Yang, J., and Tang, X. (2025). Decoupling effect of carbon emissions in the Yangtze River Delta region based on GDIM factor decomposition. Front. Environ. 13, 1622372. doi:10.3389/fenvs.2025.1622372
Wang, Z., and Yu, M. (2019). Factor decomposition of affecting carbon dioxide emissions in China’s petrochemical industry: based on generalized Divisia index method. Sci. Technol. Manag. Res. 39 (24), 1000–7695. doi:10.3969/j.issn.1000-7695.2019.24.035
Xue, Y., Gao, W., and Feng, Y. (2025). Technological innovation, low-carbon energy consumption and regional coordinated development. J. Nanjing Univ. Posts Telecommun. Soc. Sci. Ed., 1673–5420. doi:10.14132/j.cnki.nysk.20250421.002
Yan, Y., and Yin, J. (2017). Factor decomposition of carbon emissions in Beijing, Tianjin, Hebei: a study based on generalized Divisia index method. Sci. Technol. Manag. Res. 37 (19), 1000–7695. doi:10.3969/j.issn.1000-7695.2017.19.034
Ye, R., and Wu, P. (2025). The carbon reduction effects of digital trade in urban areas and its innovation-driven mechanism: difference-in-differences analysis based on national E-commerce demonstration city. Bus. Res. 2, 72–83. doi:10.13902/j.cnki.syyj.2025.02.014
Zhang, C., Zhang, W., Luo, W., Gao, X., and Zhang, B. (2021). Analysis of influencing factors of carbon emissions in China’s logistics industry: a GDIM-based indicator decomposition. Energies 14 (18), 5742. doi:10.3390/en14185742
Zheng, Y., and Xu, K. (2012). Study of the driving factors for changing energy intensity trend in China——based on the LMDI decomposition analysis. Econ. Manag. 34 (02), 1002–5766. doi:10.19616/j.cnki.bmj.2012.02.004
Keywords: generalized Divisia index decomposition, carbon emission drivers, Southwest China, regional heterogeneity, low-carbon transition
Citation: Youwei W, Yaru X, Binhui P and Xinfa T (2025) Policy-oriented pathways for decoupling economic growth from carbon emissions in Southwest China: a GDIM analysis of multi-driver dynamics and regional heterogeneity. Front. Environ. Sci. 13:1711582. doi: 10.3389/fenvs.2025.1711582
Received: 24 September 2025; Accepted: 27 October 2025;
Published: 19 November 2025.
Edited by:
Xiang Gao, Shanghai Business School, ChinaReviewed by:
Jiang Zhihua, Henan Polytechnic University, ChinaYonghong Guo, Shanxi Energy Internet Research Institute, China
Copyright © 2025 Youwei, Yaru, Binhui and Xinfa. This is an open-access article distributed under the terms of the Creative Commons Attribution License (CC BY). The use, distribution or reproduction in other forums is permitted, provided the original author(s) and the copyright owner(s) are credited and that the original publication in this journal is cited, in accordance with accepted academic practice. No use, distribution or reproduction is permitted which does not comply with these terms.
*Correspondence: Wan Youwei, MTAyMDIzMDYwMUBqeHN0bnUuZWR1LmNu