 Kun Ma1*
 Xiaoming Li
 Qiqi Liu
- 1College of Horticulture and Landscape Architecture, Yangzhou University, Yangzhou, China
- 2Agricultural College, Yangzhou University, Yangzhou, China
- 3College of Landscape Architecture, Nanjing Forestry University, Nanjing, Jiangsu, China
In this paper, we employ an enhanced watershed division method and the establishment of stormwater corridors, in conjunction with the SCS-CN model, to quantitatively assess flood disasters under varying rainstorm intensities in the central city of Nanjing, Jiangsu, China. The study also analyzes local adaptation practices and their effectiveness in mitigating adverse effects, taking into account the existing urban roadways and rivers. The results of our research demonstrate that this approach accurately analyzes runoff from each land unit, identifies the location, area, and propagation pattern of land units susceptible to flooding under different rainstorm intensities. Furthermore, the rain-flood corridors developed through this method effectively integrate the urban rain-flood pipeline network and provide a more precise analysis of infiltration losses during the runoff process. In conclusion, the flood safety pattern derived from this data offers valuable technical guidance for managing extreme rainstorm floods in central urban areas.
1 Introduction
The primary factors contributing to flooding disasters in urban central areas include the reduction of available urban land for floodwater storage, the disturbance of floodwater discharge networks due to urbanization, and the intersection of confluence areas with newly urbanized land (Rojas et al., 2017; Shafira, 2022). In recent years, Governments worldwide had put forward the strategy of “sponge city” construction based on “Low-Impact Development (LID)” (Wang, 2019). However, the insufficient focus on critical flood control aspects, such as mitigating peak runoff following exceptionally intense rainstorms, poses a challenge in providing robust technical support for urban flood control and drainage (Xia et al., 2017; Hanayni and Sulaiman, 2022; Quan et al., 2022). Hence, the objective of urban rain-flood security pattern research is to address the aforementioned deficiencies.
Currently, three methods are available for constructing a rain–flood security pattern. One is the construction of the pattern based on the evaluation of an index system (Jin et al., 2015; Peng et al., 2017; Chen, 2019; Shi and Tong, 2019). Second, based on a digital elevation model (DEM), some scholars have determined and evaluated rain–flood security patterns by collecting and summarizing historical rainstorm data (Zhang et al., 2016; Kim et al., 2020). Third, rain–flood security patterns have been constructed based on model simulations (Yin, 2017; Wübbelmann et al., 2021; Amador et al., 2023). The third method originated from the application of hydro-hydraulic models in flood analysis (Wu et al., 2016; Naemitabar et al., 2020). Compared with the previous two methods, this method reduces the amount of data needed and ensures the objectivity of the conclusion by using parameter processing and simplified calculation (Jiao et al., 2018). Therefore, knowing how to simulate and analyze urban runoff process, flood-prone areas and flood-prone points based on modeling has become the main content used to construct urban rain–flood security patterns.
Although, a large number of relevant studies have been carried out worldwide, such as the Storm Water Management Model (SWMM), the Model of Urban Sewers (MOUSE), the Walling Ford model, the MIKE model, the LISFLOOD model and so on (Huber, 1995; Che et al., 2015; Lowe et al., 2017; Zope et al., 2017; Liu et al., 2021), these models need complete resources, more parameters, cumbersome calculation process and difficult practical application. In recent years, some scholars have begun to use the SCS-CN model to assess flooding risk in rural and township areas (Tang et al., 2018; Cai and Xu, 2022; Meer, 2025). Although this method can ensure the accuracy and operability in an area lacking a large amount of historical data, measured data, or for areas with limited measurement capacity, for urban central area, complex land use types and dense buildings will greatly change the natural surface runoff, ultimately affecting the location and area of flooding areas.
This paper investigates the influence of flood disasters on the central urban area of Nanjing, Jiangsu Province, China, across varying rainstorm intensities. It also assesses the efficacy of adaptation measures in mitigating adverse effects. Our study aims to address the following research questions:
• How can we accurately delineate basin boundaries and calculate natural surface runoff in densely populated urban areas, considering the complexities introduced by extensive artificial structures and the limitations of traditional GIS-based hydrological analysis?
• What types of extreme rainstorms have impacted the local area over the past century, and what flood disasters have resulted from these varying rainstorm events?
• How can we effectively leverage the existing local infrastructure to mitigate flood disasters across different rainstorm intensities?
In summary, this study focused on the central area of Nanjing as a case study and assessed rainstorm intensities for various return periods using the Rainfall Process Line Simulation method. Building upon this analysis, we employed spatial analysis tools, including the SCS-CN model and ArcGIS local isovolumetric method, to partition the study area into distinct catchments. Subsequently, by integrating current foundational data, we identified and analyzed the sources, pathways, and confluences of runoff within the study area. Ultimately, this research culminated in the development of a rain-flood security pattern specific to the study area. We anticipate that the findings from this study will offer valuable technical insights for managing extreme rain-flood events and introduce innovative concepts and methodologies for the advancement of sponge city initiatives.
2 Materials and methods
2.1 Study area
The central area of Nanjing forms the middle part of Nanjing City along the middle part of the lower reaches of the Yangtze River, in southwestern Jiangsu Province, China (Figure 1). It covers an area of about 528.47 km2. Nanjing City lies at 31°52′44″–32°10′33″N, 118°39′06″–119°00′15″E. The study area experiences a humid climate in the north subtropical zone with distinct seasons and abundant rainfall. Rain falls on an average of 117 days annually. Although the average annual rainfall in the study area is about 1,000 mm, the spatial and temporal distribution of rainfall is very uneven. Rainfall was 1,621 mm in a wet year and 448 mm in a dry year (Ma et al., 2018). Rainfall in the flood season, known as the Plum rain season, accounts for 65% of the total annual rainfall. During the Plum rain season, continuous and/or heavy rainstorms often occur (Deng et al., 2021).
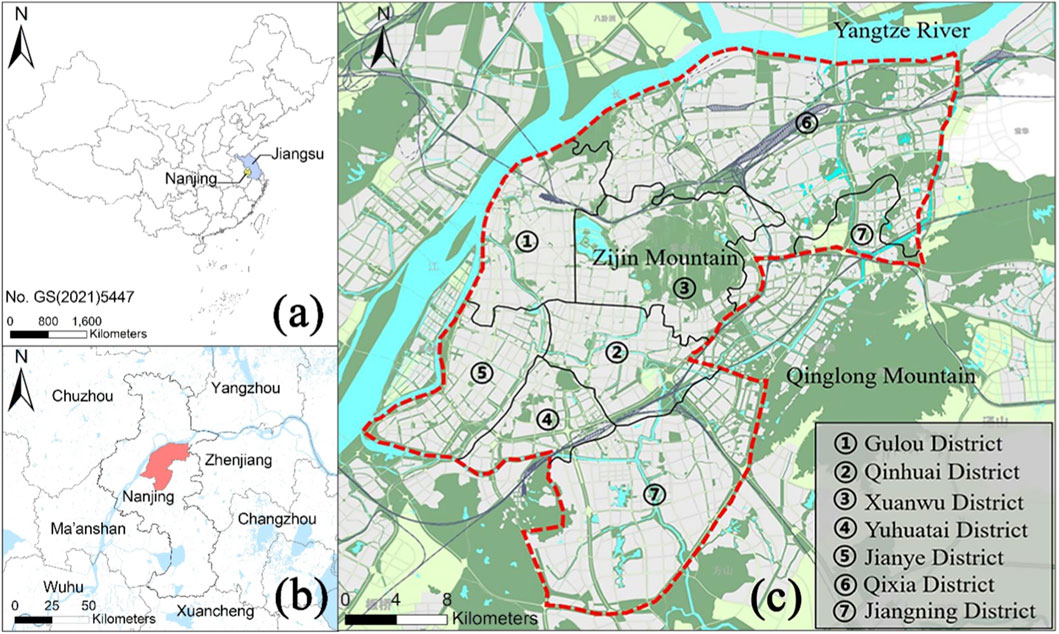
Figure 1. (a) The location of Nanjing, Jiangsu Province in China; (b) The location of the study area in Nanjing; (c) Regional division in the study area.
The original urban flood control planning data for Nanjing were compiled in 1995. After many years of large-scale construction, Nanjing initially established an urban flood control engineering system (Yan et al., 2020). However, with continued rapid urbanization, the effects of rainstorms and rainfall created more and more problematic and prominent flooding because the old flood control and drainage facilities in the central area were incapable of addressing current problems and low standards related to flood control and drainage were in place (Song et al., 2025). Therefore, providing rain–flood security has become a problem urgently in need of a solution with the ongoing development and construction in the central area of Nanjing.
2.2 Data source and processing
The data used in our research is obtained for free from various public websites, including rainfall and flood disaster data from the China Meteorological Data Center (https://data.cma.cn/) and the China Earth System Science Data Center (http://lake.geodata.cn/), road network data from the Global Geographic Information Public Product Network (http://www.globallandcover.com/), and soil data from the Resource and Environmental Science and Data Center (https://www.resdc.cn/).
In addition, based on the topographic mapping map and land use classification map provided by the Nanjing Municipal Bureau of Planning and Natural Resources, we used ArcGIS 10.2 software to create Digital Elevation Model DEM (Figure 2a) with a contour distance of 0.2 m and land use vector data (Figure 2b) with a resolution of 0.2 m. Finally, we unified all above data into a vector database with WGS84 coordinate system.
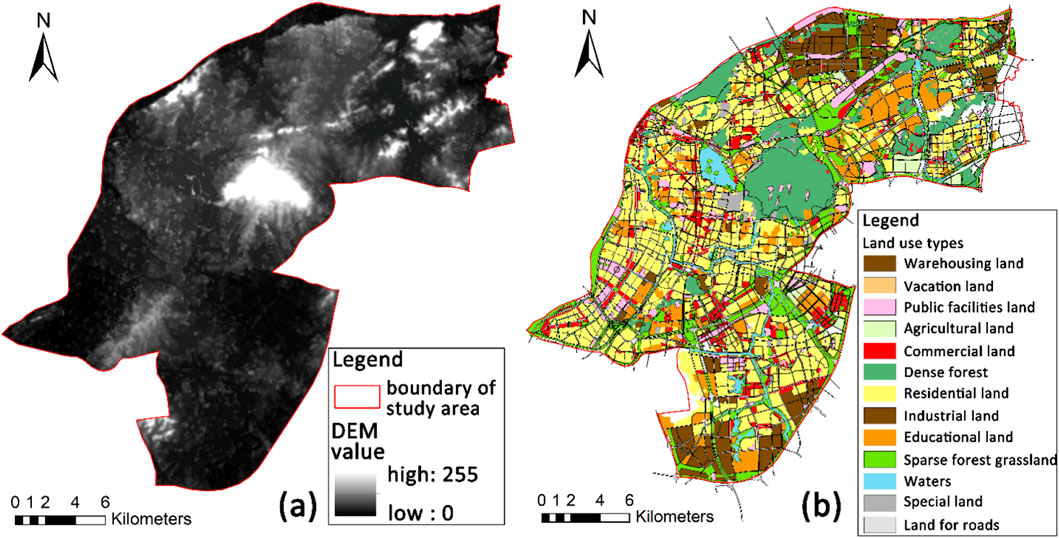
Figure 2. (a) Processed Digital Elevation Model (DEM) data of the research area; (b) Processed land use type data of the research area.
2.3 Research methods
2.3.1 Rainfall process line simulation method
There are many reasons for urban flood, the most important of which is the rainstorm. Therefore, in the study of urban rain-flood disaster, scholars often use measured rainstorm data or design rainstorm models to simulate the effects of rain on flooding.
At present, when studying various kinds of disaster risks, researchers are paying more attention to various extreme events that may cause major losses. Our selection of the design rainstorm model is precisely aligned with extreme value theory in disaster risk research. This alignment stems from the model’s focus on defining rainfall events for specific return periods, which are inherently derived from statistical analyses of historical extreme rainfall data using extreme value distributions. This approach allows for the assessment of low-probability, high-impact events crucial for robust urban flood management (Chen et al., 2023).
Keifer and Chu (1957) proposed a heterogeneous synthetic rainstorm process line model, called the Chicago Rainfall Process Line Model, which is based on the relationship between rainfall intensity, duration, and frequency. The model is widely used globally.
Cen (1998) employed a fuzzy recognition method to investigate the applicability of the Chicago Rainfall Process Line Model in China. The study concluded that the model effectively captures the characteristic temporal distribution of Chinese rainstorms, including both pre-peak and post-peak patterns, and is adaptable across various rainstorm durations. This adaptability is further supported by recent studies demonstrating its utility in urban short-duration rainfall simulation in China (Xiao et al., 2023). Rainstorm intensity formulas generally refer to the water supply and drainage design manual. The formula is as follows:
where Q is storm intensity ((L (s ha)−1)), A is rainfall in different return periods (mm), C is a rainfall variation parameter, P is rainfall return period (Equation 1), t is rainfall duration (min), and b and n are constants reflecting the change of design rainfall intensity over time. Because the numerator “
According to the planning of drainage and flood control system in Nanjing, the intensity of short-duration rainstorm in the main urban area of Nanjing can be simulated as follows. This empirical formula (Equation 3) is a localized Intensity-Duration-Frequency (IDF) curve, which was derived from long-term historical rainfall data and statistical frequency analysis specific to Nanjing by local meteorological and water resource authorities for urban drainage design purposes.
where q is storm intensity (L (s ha) −1)), P is return period Equation 1, and t is rainfall duration (min). In the simulation, we choose 2 h of rainfall design duration and 5 min of the time step.
2.3.2 SCS-CN runoff model method
The SCS-CN runoff model provides a common runoff calculation method for small watersheds. It was developed by then-named US Department of Agriculture Soil Conservation Service in 1954 (SCS, 1956). Note that the name of the Soil Conservation Service is now the US Natural Resources Conservation Service (US NRCS). Based on the characteristics of the underlying surfaces in different climates and regions, SCS-CN runoff model objectively and intuitively reflects the effects of soil type, land use development mode, and soil moisture content on rainfall in the study area (Psomiadis et al., 2020; Shi and Wang, 2020; Ibrahim et al., 2022). The advantage of this model is that the internal model has a simple structure and requires few parameters. This provides a rapid method for calculating runoff in small- and medium-sized catchments (Soulis, 2018; Caletka et al., 2020; Ling et al., 2020). After rainfall, the water balance equation is (Equation 4)
where P represents the total rainfall of this rainfall event (mm),
According to the current literature related to rainfall and runoff in Nanjing as well as the study of the CN value in the National Irrigation Engineering Manual of the United States, the CN value can be found in Table 1 (Yue et al., 2015).
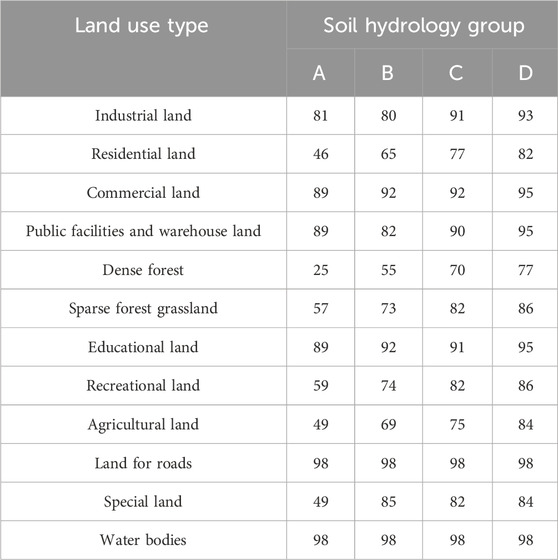
Table 1. Curve number coefficient reference table.
Among the soil hydrology groups, group A has a thick sand layer and loess layer with strong water permeability, group B is thin loess and sandy loam with strong water permeability, group C is clay loam with medium water permeability, and group D is expansive soil with weak water permeability (Soulis, 2021). For the highly urbanized central area of Nanjing, considering the widespread presence of compacted, modified, and impervious surfaces, and referencing regional hydrological characteristics and available general soil data, the predominant soil hydrological group was inferred to be ‘C'. This classification reflects the generally lower infiltration capacity of urban soils in the study area. We acknowledge this simplification and discuss its implications and the need for more detailed local soil surveys in the discussion section.
2.3.3 Local isovolumetric method
After urban surface runoff forms, the process of runoff converging at the outlet of a basin is called confluence. Then, the inundation area and depth of flooding are simulated using the local isovolumetric method in arcGIS. This method iteratively determines the water surface elevation based on the calculated runoff volume and high-resolution digital elevation models. This process delineates the flooded extent and depth for each catchment.
This method divides the study area into several catchments. These small catchments can be simulated first, and then their runoff is shown to converge in the catchment. Because rain-flood is regarded as passive submergence, the gravity characteristics of flow can be considered instead of the specific process of confluence. Finally, the runoff fills the depressions from low to higher elevations based on the topographical characteristics of the area. The basic principle of this method is that the total runoff of a certain time step is equal to the total submerged runoff of that time step (Keifer and Chu, 1957). The calculation formula is shown in (Equation 5).
where W is the total amount of flood (m3), A is the area of flooded area (m2),
where
The first step of the local isovolumetric method is to determine the range of water surface elevation. In this way, not only can the minimum value be higher than the minimum value of ground elevation, but also the maximum value can be lower than the sum of the maximum value of ground elevation and rainfall elevation (Ansari et al., 2016). Then, the initial elevation value is set as the average value of the range of values. If the initial value is higher than the elevation of a specific grid element, water will accumulate in the grid element; in contrast, no water will accumulate if the situation is reversed. Finally, the amount of accumulated water is compared with that produced by the SCS-CN model. This process uses volume matching based on the physical principle of water flowing downwards rather than traditional interpolation methods. If the difference between the calculated accumulated water volume and the runoff produced by the SCS-CN model is larger than the allowable error threshold (set to 0.01%), the water surface elevation is adjusted iteratively until convergence is achieved. In this way, the water level elevation is the water level elevation until the interpolation error is less than the allowable error (Satheeshkumar et al., 2017).
3 Results
3.1 Flooding simulation results
Because this paper analyzed the main urban area of Nanjing, relevant data and the distribution of the main soil types shows the study area has mostly loam soil with medium permeability. Therefore, the CN value of group C in Table 1 corresponds to that of group C. Then, the parameters corresponding to different land types could be calculated based on the land use type maps of the main urban area of Nanjing. The results are shown in Table 2.
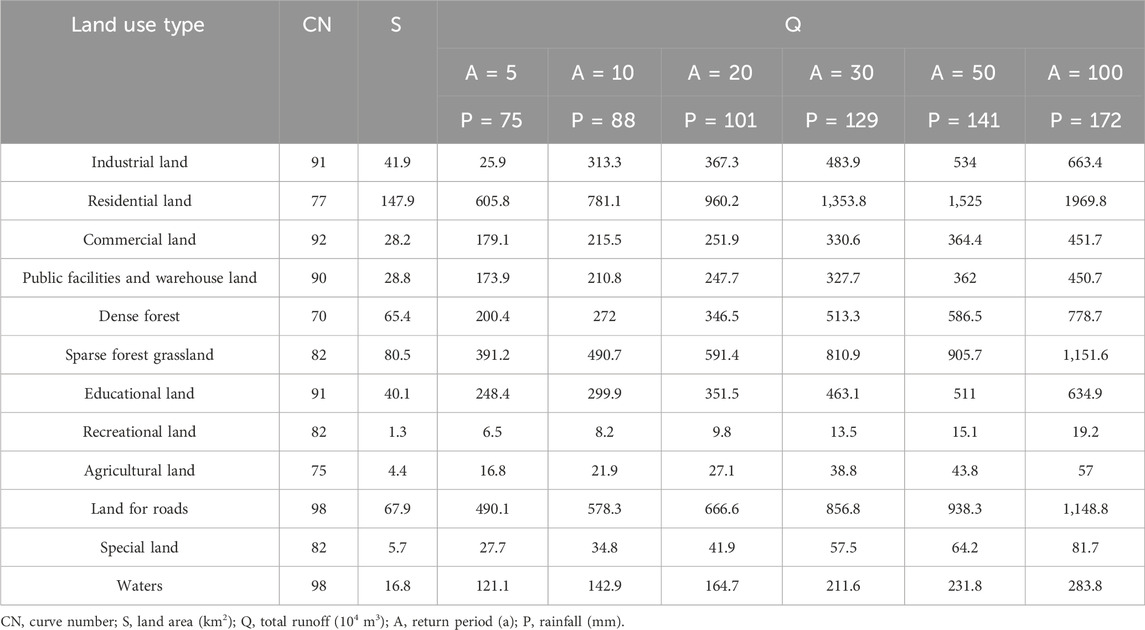
Table 2. Parameters of different land use type and simulation results of different return periods.
In the present study, the Chicago Rainfall Process Line Model was used to obtain the rainfall process lines of different return periods in the study area. Based on the rainfall intensity process line, the rainfall of the rainfall process in different return periods were obtained. Then, according to the detailed land use classification map (Figure 2b) and considering their hydrological characteristics, we categorized the Nanjing central area into 12 distinct land use types, including residential, commercial, industrial, transportation, public green space, water bodies, and others. These classifications are crucial for assigning appropriate CN values in the SCS-CN model. Based on these land use types and the topographic characteristics, we further delineated 4,327 independent catchments to record the passive submergence (Figure 3). Based on the above results, initially, runoff was calculated with SCS-CN runoff generation model. The results are shown in Table 2.
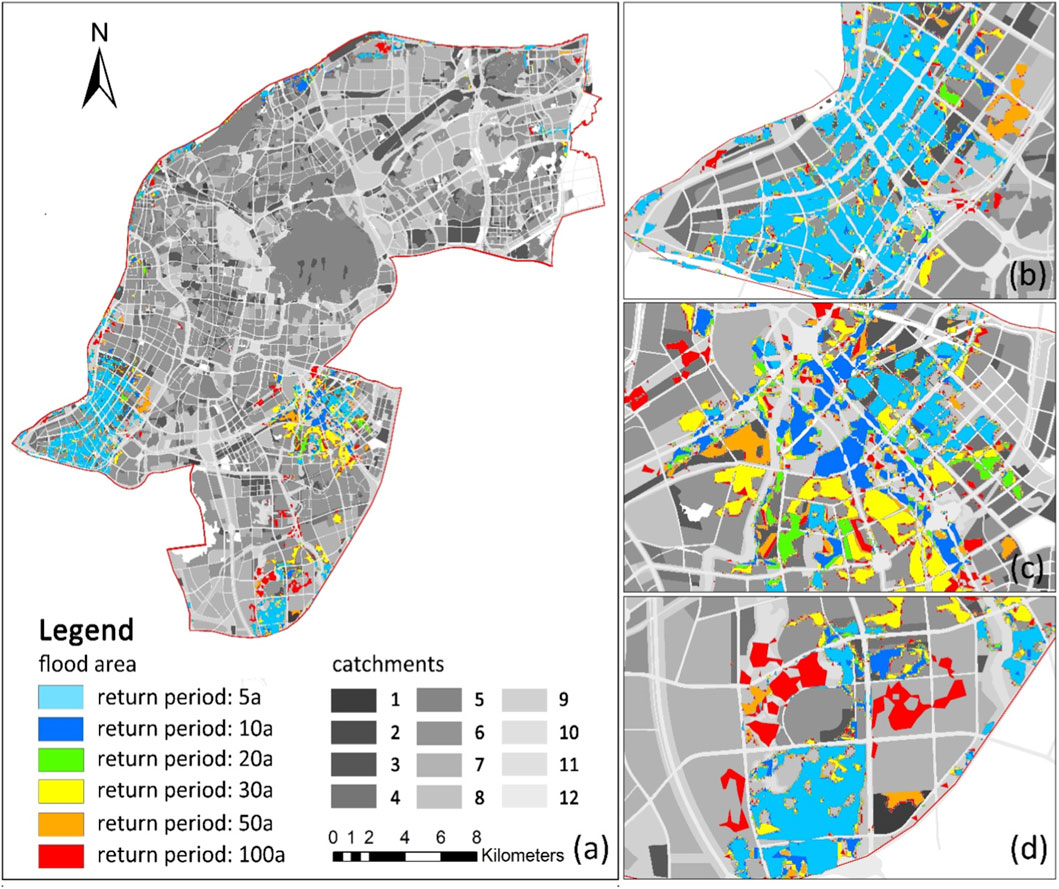
Figure 3. Flood simulation results in the study area in different return periods: (a) Nanjing central area; (b) Jianye District; (c) Northern Jianning District; (d) Southern Jianning District.
Based on the DEM data of Nanjing central area, we used ArcGIS software and local isovolumetric method to analyze the flooding area in different return periods, and finally obtained the distribution map of inundation scope in the study area. The simulation results are shown in Figure 3. As shown on the distribution map of the simulation results, the submerged area is primarily located in Jianye and Jiangning Districts. According to the simulation results of flood areas, we can get the location, area and expansion trend of each flood area in detail. For example, when a 5-year rainstorm occurs, the area where floods occur in Jianye District is about 8.6 km2. And the specific locations of these flood areas are mainly around Hexi City Park, Hexi Children’s Hospital, Nanjing Expo Center Citizen Center, Binjiang Park, Hexi Municipal Complex and so on. When rainstorms occur once in 10, 20, 30, 50 and 100 years respectively, the flood area in these regions has expanded again by 1.1, 0.5, 0.9, 0.7 and 0.9 km2on the basis of the previous return period.
The distribution of flood areas in high-density urban centers exhibits a strong spatial correlation with the built environment. Specifically, flood-prone zones are predominantly characterized by high road densities and intensive infrastructure development, often coinciding with major transportation hubs and interchanges such as the Youfangqiao Interchange, Gaoqiaomen Interchange, and Nanzhuang Hub. These areas typically feature elevated impervious surface coverage due to dense construction of residential, commercial, and public facilities, which reduces natural infiltration and accelerates runoff accumulation. In contrast, regions with lower building and road densities, such as peripheral green spaces or less developed zones, show reduced flood extents, highlighting how urban densification exacerbates vulnerability under varying rainstorm intensities.
3.2 Rain-flood corridor simulation results
Because the main land use type in the study area is in anthropomorphically generated land types, most of the runoff paths formed by natural surfaces have been destroyed. Consequently, the existing rivers and roads in the study area have become the main surface runoff paths in the study area. Therefore, new rain–flood corridors should be constructed based on natural surface runoff routes, combining the drainage patterns of existing roads and rivers in the study area. According to the rainfall calculated in different return periods, we calculated the runoff of roads and rivers respectively by using SCS-CN model. Then we used the interpolation method of ArcGIS software to assign the runoff to the plane space and get the road and river runoff distribution map (Figure 4). A comprehensive assessment of runoff accumulation, inundation risk, flow conveyance capacity and strategic urban planning considerations was conducted to classify rain-flood corridors into four distinct levels. First-class corridors represent primary drainage arteries with critical connectivity and high runoff volumes, demanding the highest flood protection standards. Second-class corridors include significant urban drainage routes and secondary channels that handle substantial runoff and pose a considerable local flood risk. Third-class corridors encompass local street drainage and green infrastructure pathways, managing moderate runoff with limited local impact. Fourth-class corridors serve as auxiliary runoff routes and temporary storage areas, dealing with smaller runoff volumes and lower flood risks.
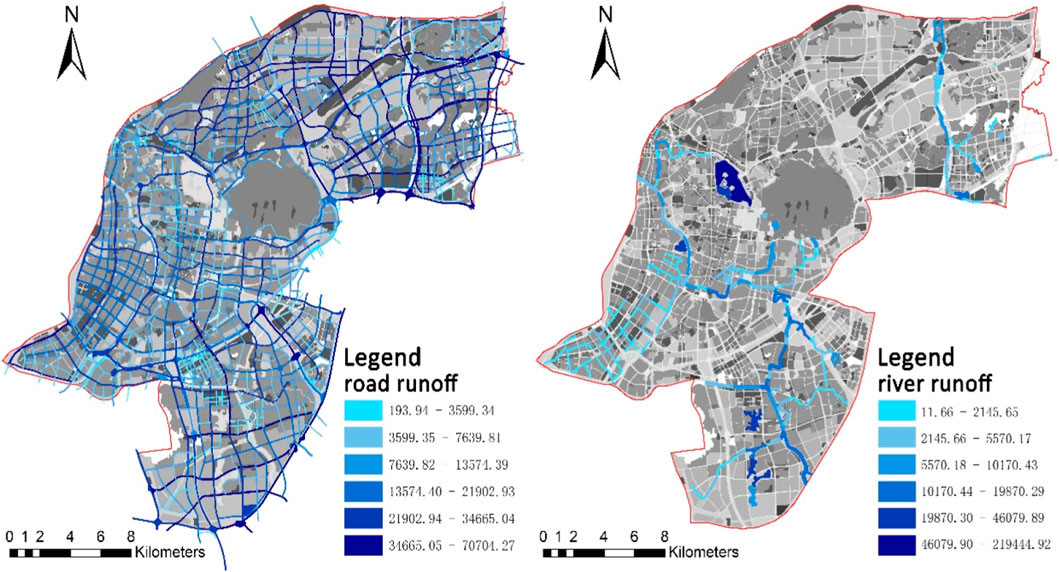
Figure 4. Runoff analysis of roads and rivers.
As can be seen from Figure 4, through the calculation and analysis of road and river runoff, we divide each runoff into six grades. Then we overlay analyze the two higher runoff levels to get the spatial distribution map of runoff paths (Figures 5a,b). Finally, from the spatial distribution information of runoff paths, we select the areas with higher runoff grade to extract runoff lines, and get four levels of rain-flood corridors (Figure 5c). At the junction or branch point of runoff, rain-flood will converge or be diverted, which is the most important part of controlling runoff and water quality. Therefore, these points where at the intersection of rain-flood corridors of all levels are the strategic points for controlling rain–flood.
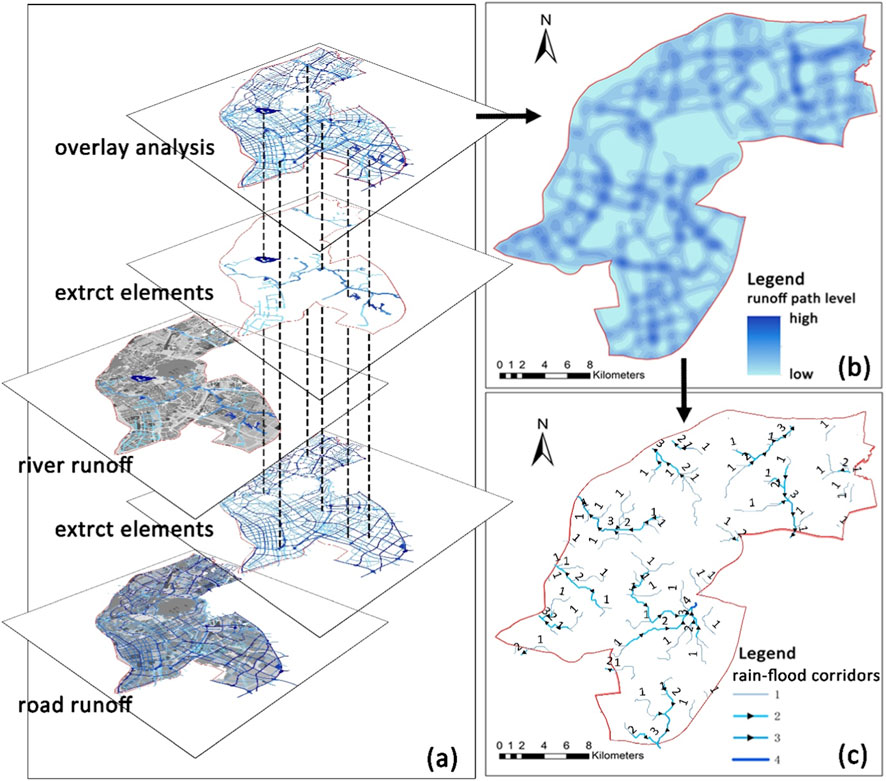
Figure 5. (a) The superposition analysis of road runoff and river runoff in the study area; (b) Runoff path classification in the study area; (c) rain-flood corridors and control points in the study area.
Regardless of their individual classification, intersections of these rain-flood corridors emerge as strategic points for controlling rain flooding due to their inherent role as hydrological confluence centers where runoff from multiple pathways accumulates. These locations are susceptible to high water volumes and potential bottlenecks, so they are crucial for implementing integrated flood control measures, such as detention facilities, pumping stations, and diversion structures. Moreover, these intersections frequently coincide with essential urban infrastructure and densely populated areas, underscoring their significance in effective flood management and disaster prevention. A comprehensive spatial analysis that explicitly incorporated both urban roads and natural/engineered rivers was conducted to identify and delineate the four-class rain-flood corridors. Roads are critical pathways for surface runoff, especially during extreme rainfall events when their associated drainage systems are overwhelmed. Rivers, on the other hand, are the primary backbone of the urban drainage network, collecting and conveying large volumes of runoff. Integrating high-resolution topographic data with detailed road networks and river systems in our GIS analysis ensured the corridors were classified according to their hydrological functions and connectivity (Cheng et al., 2024).
From the simulation results of rain-flood corridors, based on the trend of runoff in the catchment, 162 rain–flood corridors existed in the study area with a total length of 240.21 km. Note that first-class corridors were the upstream areas feeding water to second-, third-, and fourth-class corridors downstream in sequence. Among them, the majority (96) were first-class rain–flood corridors having a total length of about 152.03 km. These corridors are widely distributed and are the source of the surface runoff network formed by rainfall. Slightly fewer second-class rain–flood corridors (44) existed having a total length of about 64.21 km. These were widely distributed and spanned many existing rivers. The number of third-class rain–flood corridors was relatively small (21), with a total length of about 23.16 km. This third group was mainly distributed on the west side of the Nanjing International Exhibition Center, the west side of Zhongshan North Road, along the rivers between Daqiao Road and Jinxin Line, and along Jiuxiang River. Only one Grade IV rain–flood corridor was documented, which was located on the east side of Xinyun Road. Its length in the study area is about 0.81 km.
The spatial distribution of rain-flood corridors in densely populated urban centers is closely linked to the structure of the built environment. Urban infrastructure, especially roads and rivers, largely determines the layout and function of these corridors. They often replace disrupted natural drainage paths in areas with extensive development and high impervious surface coverage. These corridors are most prominent in zones such as commercial districts, exhibition areas and river-based transport hubs, where intense land use leads to increased surface runoff which is channeled through engineered systems. Conversely, urban fringes with lower building density and more permeable ground surfaces exhibit fewer or weaker flood corridors, emphasizing the impact of urban density on flood pathway formation and hydrological risk management.
3.3 Rain-flood security pattern simulation results
Rain-flood security pattern mainly includes three parts: rain-flood pattern, rain-flood corridors and rain-flood control points. According to the results of the simulation and analysis mentioned above, we overlay analyze the flood pattern in different return periods, the four-grade corridors and the rain-flood control points by using ArcGIS software. Then we obtain the rain-flood security pattern in different grades (Figure 6).
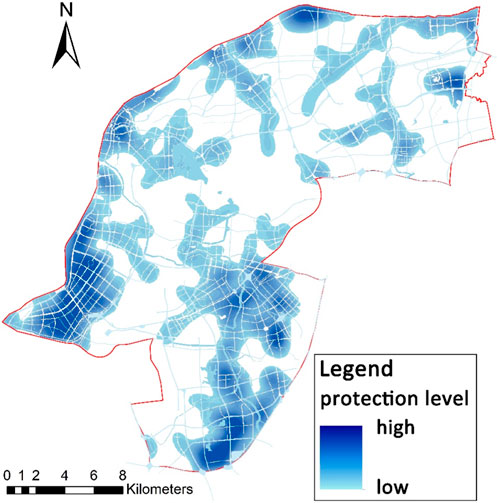
Figure 6. Rain-flood security pattern in the study area.
According to the simulation results, the rain–flood security pattern in the study area is mainly composed of three levels: low, medium, and high flood risk. Among them, the low-risk areas are mainly distributed on both sides of the main rivers in the study area, such as Qinhuai New River and the Qinhuai, Niushuoshan, Jiuxiang, and other rivers. The medium-risk areas are mainly located near lakes in the study area, such as the lakes of Xuanwu, Jiulong, Baijia, Mochou, and Yangshan. The distribution of high-risk areas almost overlies the same areas discussed above that frequently experience severe flooding. Efforts in these areas need to focus on preventing and controlling flood disasters caused by heavy rain.
This study reveals that the pattern of rain flooding in high-density urban areas is closely linked to the built environment. Urban infrastructure is essential for establishing an effective flood risk management system. This pattern is organised primarily along major transport routes and river systems, which are key structural elements that link vital urban areas and enable efficient discharge of runoff from densely developed zones such as residential, commercial and educational areas. These high-risk zones often have a high level of impervious surface coverage, which increases surface runoff and makes them more susceptible to flooding. Conversely, areas located near natural bodies of water, such as rivers and lakes, tend to experience lower flood risk due to favorable terrain and reduced development intensity, enabling better water retention and infiltration. This spatial configuration demonstrates how the security pattern responds to urban form, optimizing drainage in heavily urbanized districts while utilizing natural features to alleviate flood pressure.
4 Discussions
This study uncovers nuanced associations between land use patterns and rain-flood risks in the high-density urban core of Nanjing, emphasizing how intensive urban developments, such as commercial and residential zones with high impervious surfaces, directly amplify flood extents and propagation in transportation-heavy districts like Jianye and Jiangning. This contrasts with prior research in rural or less urbanized settings, where flood risks are predominantly tied to natural factors like soil permeability and vegetation cover rather than anthropogenic infrastructure (Chang-tong et al., 2011; Jiao et al., 2017; Fang et al., 2020). For instance, while rural studies often highlight lower flood vulnerabilities due to permeable landscapes and dispersed land uses, our findings reveal heightened risks in urban areas from dense building clusters and road networks that disrupt natural drainage, leading to rapid runoff accumulation during extreme rainstorms (Rojas et al., 2017; Shafira, 2022). These differences stem primarily from rapid urbanization in megacities like Nanjing, where historical planning prioritizes economic development over flood-resilient design, exacerbating vulnerabilities in coastal or riverine urban environments compared to rural contexts with more adaptive natural buffers. Furthermore, global variations in urban expansion patterns contribute to these disparities, as subtropical Chinese cities experience uneven rainfall distribution and infrastructure overload not as prevalent in the peri-urban or rural case studies examined elsewhere (Psomiadis et al., 2020).
The SCS-CN model, as adapted in this study, introduces innovative enhancements for urban flood risk assessment by integrating land use-specific catchment divisions and infrastructure-based corridor simulations, which allow for more accurate runoff predictions in densely built environments where traditional applications fall short (Soulis, 2021). This plays a crucial role in elucidating land use-rain-flood risk associations, as the model’s parameter efficiency and incorporation of urban factors like impervious surfaces enable objective, data-light analyses that bridge gaps in complex urban hydrology, even if the core framework remains foundational (Caletka et al., 2020). Such adaptations underscore the model’s versatility, providing essential technical support for sponge city strategies by quantifying infiltration losses and flood patterns in ways that more cumbersome models cannot match.
Despite focusing on Nanjing’s central urban area, this study shows that the SCS-CN model can be applied and generalized to other high-density urban centers when used with GIS spatial analysis. Due to its simplicity, low data requirements, and high computational efficiency, the SCS-CN model is an effective tool for preliminary flood risk assessments and macro-level spatial planning, especially in regions where detailed hydrological data, such as sewer network maps and long-term gauge records, are scarce. However, applying this approach in other urban areas requires local calibration and data integration. This includes adapting the rainfall intensity formula to local or regional intensity-duration-frequency (IDF) curves, reevaluating Curve Number (CN) values based on local land use, soil types, and imperviousness, and ensuring the availability of high-resolution digital elevation models (DEMs) and detailed land use maps. This study enhances the model’s framework by integrating the SCS-CN model with the Local Isovolumetric Method and urban infrastructure data (e.g., roads and rivers) to improve watershed delineation. This method translates estimated runoff volumes into spatially explicit inundation depths and extents, addressing the complexity of urban surface flow. It provides urban planners and water resource managers in other cities with a valuable tool for establishing foundational rain-flood security patterns.
5 Conclusion
The proliferation of dense urban buildings in the central area has profoundly altered the course of natural runoff. However, in previous studies where most researchers utilized the SCS-CN model and ArcGIS software to simulate and analyze rain-flood processes, little consideration was given to the influence of buildings on natural runoff. Additionally, roads and rivers were not recognized as pivotal factors in the runoff dynamics. Consequently, this conventional approach proved unsuitable for simulating rain-flood events in urban central areas. In response to these limitations, we have made significant enhancements to both catchment division and rain-flood corridor simulations. Our findings reveal that:
Based on predetermined rainstorm levels for various return periods, we employed a unique approach to divide the 4,327 catchments in the central area of Nanjing, classifying them according to land use types. This watershed division method deviates from the traditional natural watershed division. The key advantage of this approach lies in its ability to provide detailed runoff calculations for each individual block within the study area, as well as the capability to analyze specific flood area locations, sizes, and growth patterns.
Rain-flood corridors are constructed with current roads and rivers as runoff paths. This method is different from the traditional terrain simulation of natural runoff. Its advantage is that it completely avoids the impact of building blocking natural runoff. Moreover, this kind of rain-flood corridors can fully integrate the urban rain-flood pipeline network, and more scientifically analyze the amount of infiltration loss caused by the process of runoff.
In summary, this study serves a dual purpose. Firstly, it addresses a significant gap in the application and research of the SCS-CN model and ArcGIS software for simulating and analyzing rain-flood processes in urban central areas. Secondly, the rain-flood safety pattern developed through our methodology offers valuable technical guidance to urban planners in formulating land use plans and flood control measures.
Data availability statement
The original contributions presented in the study are included in the article/supplementary material, further inquiries can be directed to the corresponding author.
Author contributions
KM: Supervision, Writing – review and editing, Conceptualization, Formal Analysis, Project administration, Writing – original draft. XL: Writing – original draft, Conceptualization, Formal Analysis, Writing – review and editing. QL: Resources, Writing – original draft, Visualization, Data curation, Software, Investigation, Validation. WZ: Funding acquisition, Resources, Project administration, Methodology, Writing – review and editing. WL: Data curation, Validation, Software, Investigation, Resources, Writing – original draft.
Funding
The authors declare that financial support was received for the research and/or publication of this article. This article is supported by National Natural Science Foundation of China (32101577).
Conflict of interest
The authors declare that the research was conducted in the absence of any commercial or financial relationships that could be construed as a potential conflict of interest.
Generative AI statement
The authors declare that no Generative AI was used in the creation of this manuscript.
Any alternative text (alt text) provided alongside figures in this article has been generated by Frontiers with the support of artificial intelligence and reasonable efforts have been made to ensure accuracy, including review by the authors wherever possible. If you identify any issues, please contact us.
Publisher’s note
All claims expressed in this article are solely those of the authors and do not necessarily represent those of their affiliated organizations, or those of the publisher, the editors and the reviewers. Any product that may be evaluated in this article, or claim that may be made by its manufacturer, is not guaranteed or endorsed by the publisher.
References
Amador, L. D. R., Boudreault, M., and Carozza, D. A. (2023). Global asymmetries in the influence of ENSO on flood risk based on 1,600 years of hybrid simulations. Geophys. Res. Lett. 50 (5), e2022GL102027. doi:10.1029/2022gl102027
Ansari, T. A., Katpatal, Y. B., and Vasudeo, A. D. (2016). Spatial evaluation of impacts of increase in impervious surface area on SCS-CN and runoff in nagpur urban watersheds, India. Arabian J. Geosciences 9 (18), 702. doi:10.1007/s12517-016-2702-5
Cai, X. H., and Xu, D. W. (2022). Simulation and optimization strategy of storm flood safety pattern based on SCS-CN model. Int. J. Environ. Res. PUBLIC HEALTH 19 (2), 698. doi:10.3390/ijerph19020698
Caletka, M., Michalkova, M. S., Karasek, P., and Fucik, P. (2020). Improvement of SCS-CN initial abstraction coefficient in the Czech Republic: a study of five catchments. Water 12 (7), 1964. doi:10.3390/w12071964
Cen, G., Jin, S., and Fan, R. (1998). Research on rainfall pattern of urban design storm. Adv. Water. (01), 42–47.
Chang-tong, Z., Hong, L., Dong-cai, S. H. U., Shu-ling, J., Xiao-yun, X. I. E., and Mao-qiang, W. (2011). Study of karst basin SCS runoff model based on GIS and RS. Geogr. Res. 30 (1), 185–194. doi:10.11821/yj2011010018
Che, W., Zhao, Y., Li, J., Wang, W., Wang, J., Wang, S., et al. (2015). Explanation of sponge city development technical guide: basic concepts and comprehensive goals. China Water and Wastewater 31 (08), 1–5. doi:10.19853/j.zgjsps.1000-4602.2015.08.001
Chen, S. (2019). “Research on the construction and evaluation of evaluation index system of modern service industry brand competitiveness,” in 2019 5th international conference on education technology, management and humanities Science (ETMHS 2019), 104–107. doi:10.25236/etmhs.2019.015
Chen, H., Xu, Z., Chen, J., Liu, Y., and Li, P. (2023). Joint risk analysis of extreme rainfall and high tide level based on extreme value theory in coastal area. Int. J. Environ. Res. Public Health 20 (4), 3605. doi:10.3390/ijerph20043605
Cheng, S., Yang, M., Li, C., Xu, H., Chen, C., Shu, D., et al. (2024). An improved coupled hydrologic-hydrodynamic model for urban flood simulations under varied scenarios. Water Resour. Manag. 38 (14), 5523–5539. doi:10.1007/s11269-024-03914-9
Deng, J., Yin, H., Qiu, S., Zhu, J., Chen, J., Fei, F., et al. (2021). Water environmental response under varying implication ofstormwater management measures:based on cases in China. J. Nat. Resour. 36 (3), 771–782. doi:10.31497/zrzyxb.20210317
Fang, Z., Song, S., He, C., Liu, Z., Qi, T., Zhang, J., et al. (2020). Evaluating the impacts of future urban expansion on surface runoff in an alpine basin by coupling the LUSD-urban and SCS-CN models. Water 12 (12), 3405. doi:10.3390/w12123405
Hanayni, F., and Sulaiman, M. (2022). Evaluation of urban drainage system as a flood control in klitren urban village. Adv. Sci. Technol. 112, 43–48. doi:10.4028/p-6t3343
Huber, W. C. (1995). EPA storm water management model-SWMM. Comput. Models Watershed Hydrology, 783–808.
Ibrahim, S., Brasi, B., Yu, Q., and Siddig, M. (2022). Curve number estimation using rainfall and runoff data from five catchments in Sudan. Open Geosci. 14 (1), 294–303. doi:10.1515/geo-2022-0356
Jiao, S., Zhang, X., and Xu, Y. (2017). A review of Chinese land suitability assessment from the rainfall-waterlogging perspective: evidence from the Su Yu Yuan area. J. Clean. Prod. 144, 100–106. doi:10.1016/j.jclepro.2016.12.162
Jiao, S., Han, J., Zhou, M., Cai, Y., Han, Z., and Li, B. (2018). Low-impact urban development mode based on waterlogging security pattern. Geogr. Res. 37 (9), 1704–1713. doi:10.11821/dlyj201809004
Jin, J., Fu, J., Wei, Y., Jiang, S., Zhou, Y., Liu, L., et al. (2015). Integrated risk assessment method of waterlog disaster in huaihe river basin of China. Nat. Hazards 75, S155–S178. doi:10.1007/s11069-014-1307-0
Keifer, C., and Chu, H. (1957). Synthetic storm pattern for drainage design. Am. Soc. Civ. Eng. 83 (4), 1–25. doi:10.1061/JYCEAJ.0000104
Kim, D. E., Liong, S.-Y., Gourbesville, P., Andres, L., and Liu, J. (2020). Simple-yet-effective SRTM DEM improvement scheme for dense urban cities using ANN and remote sensing data: application to flood modeling. Water 12 (3), 816. doi:10.3390/w12030816
Ling, L., Yusop, Z., Yap, W.-S., Tan, W. L., Chow, M. F., and Ling, J. L. (2020). A calibrated, watershed-specific SCS-CN method: application to wangjiaqiao watershed in the three gorges area, China. Water 12 (1), 60. doi:10.3390/w12010060
Liu, Y., Zhou, Y., Yu, J., Li, P., and Yang, L. (2021). Green space optimization strategy to prevent urban flood risk in the city centre of wuhan. Water 13 (11), 1517. doi:10.3390/w13111517
Lowe, R., Urich, C., Domingo, N. S., Mark, O., Deletic, A., and Arnbjerg-Nielsen, K. (2017). Assessment of urban pluvial flood risk and efficiency of adaptation options through simulations - a new generation of urban planning tools. J. Hydrology 550, 355–367. doi:10.1016/j.jhydrol.2017.05.009
Ma, K., Tang, X., Ren, Y., Ge, Y., and Deng, M. (2018). Study on construction strategy of storm water management in hilly land based on resilience theory. J. Nanjing For. Univ. Nat. Sci. Ed. 42 (03), 139–145. doi:10.3969/j.issn.1000-2006.201706016
Meer, M. S. (2025). A review on enhancing flood mitigation strategies: a comparative study of SCS-CN and ANN model integration with GIS for rainfall-runoff simulation. Water Conservation Science Engineering 10 (2), 51. doi:10.1007/s41101-025-00369-w
Naemitabar, M., Zanganeh Asadi, M. A., Amirahmadi, A., and Mokhtari, L. (2020). Evaluating and zoning flood susceptibility using curve number (CN) logistic and hydrological regression model. Case Study Kalateh Qanbar Drainage Basin, Nishabur. doi:10.20944/preprints202012.0650.v1
Peng, J., Zhao, H., Liu, Y., and Wu, J. (2017). Research progress and prospect on regional ecological security pattern construction. Geogr. Res. 36 (3), 407–419. doi:10.11821/dlyj201703001
Psomiadis, E., Soulis, K. X., and Efthimiou, N. (2020). Using SCS-CN and Earth observation for the comparative assessment of the hydrological effect of gradual and abrupt spatiotemporal land cover changes. Water 12 (5), 1386. doi:10.3390/w12051386
Quan, X., Chen, Z., Jiang, T., Liu, W., Mo, Y., and Chen, B. (2022). Model-predicted control system for the real-time operation of an urban drainage system to mitigate urban flood risk: a case study in the liede river catchment, guangzhou, China. Int. Trans. Electr. Energy Syst. 2022, 1–20. doi:10.1155/2022/8199192
Rojas, O., Mardones, M., Rojas, C., Martinez, C., and Flores, L. (2017). Urban growth and flood disasters in the coastal river basin of south-central Chile (1943-2011). Sustainability 9 (2), 195. doi:10.3390/su9020195
Satheeshkumar, S., Venkateswaran, S., and Kannan, R. (2017). Rainfall–runoff estimation using SCS–CN and GIS approach in the pappiredipatti watershed of the vaniyar sub basin, South India. Model. Earth Syst. Environ. 3 (1), 24. doi:10.1007/s40808-017-0301-4
Shafira, S. (2022). Analysis of the correlation urban systems and risk management floods, study case: kaliwungu, kendal regency. IOP Conf. Ser. Earth Environ. Sci. 1082 (1), 012025. doi:10.1088/1755-1315/1082/1/012025
Shi, S. X., and Tong, P. S. (2019). Evaluation system and spatial distribution pattern of ecological city construction - based on dpsir-topsis model. Appl. Ecol. Environ. Res. 17 (1), 601–616. doi:10.15666/aeer/1701_601616
Shi, W., and Wang, N. (2020). An improved SCS-CN method incorporating slope, soil moisture, and storm duration factors for runoff prediction. Water 12 (5), 1335. doi:10.3390/w12051335
Song, Y., Li, Q., Niu, M., Yan, F., He, P., Chen, Q., et al. (2025). Rainstorm and waterlogging simulation in typical inundated districts of nanjing based on SWMM. Adv. Sci. Technol. WaterResources 39 (6). doi:10.3880/j.issn.1006-7647.2019.06.009
Soulis, K. X. (2018). Estimation of SCS curve number variation following forest fires. Hydrol. Sci. Journal-Journal Des. Sci. Hydrol. 63 (9), 1332–1346. doi:10.1080/02626667.2018.1501482
Soulis, K. X. (2021). Soil conservation service curve number (SCS-CN) method: current applications, remaining challenges, and future perspectives. Water 13 (2), 192. doi:10.3390/w13020192
Tang, P., Wang, W., Zhang, Z., Su, T., and Wang, H. (2018). Quantitative research on rain-flood patterns of urban area in the construction of sponge cities. J. Nanjing For. Univ. Sci. Ed. 42 (01), 15–20. doi:10.3969/j.issn.1000-2006.201705064
Wang, C. (2019). Application analysis of low impact development in sponge city construction. IOP Conf. Ser. Earth Environ. Sci. 401 (1), 012022. doi:10.1088/1755-1315/401/1/012022
Wu, Z., Yu, Z., Zhu, X., and Li, D. (2016). Application of SCS model on computing the surface runoff of different land use types-A case study on yuyao, Zhejiang Province. J. Zhejiang Univ. Ed. 43 (02), 226–230. doi:10.3785/j.issn.1008-9497.2016.02.018
Wübbelmann, T., Bender, S., and Burkhard, B. (2021). Modelling flood regulation ecosystem services dynamics based on climate and land use information. Landsc. Online 88, 16. doi:10.3097/LO.202188
Xia, J., Shi, W., Wang, Q., and Zou, L. (2017). Discussion of several hydrological issues regarding sponge city construction. Water Resour. Prot. 33 (01), 1–8. doi:10.3880/j.issn.1004-6933.2017.01.001
Xiao, H., Zhang, J., Fang, H., and Wang, D. (2023). Stochastic simulation and characteristic dependence analysis of urban short-duration rainstorms. J. Hydrology 623, 129831. doi:10.1016/j.jhydrol.2023.129831
Yan, J., Ji, H., and Zhang, Y. (2020). Study on nanjing Purple Mountain National forest park influenced by rain-flood in city based on DEM and NDVI. J. Anhui Agric. Univ. 47 (2), 192–199. doi:10.13610/j.cnki.1672-352x.20200518.025
Yin, J. (2017). Urban pluvial flood scenario modeling and emergency response assessment using high resolution Lidar-DSM. Geogr. Res. 36 (06), 1138–1146. doi:10.11821/dlyj201706011
Yue, J., Zhang, J., Zhuang, J., Xia, Y., and Liu, X. (2015). Calibration of SCS-CN initial abstraction ratio of a small watershed in nanjing bamboo forest. Sci. Soil and Water Conservation 40 (01), 36–39. doi:10.1111/nbu.12124
Zhang, Q., Li, X., Chen, Y., and Tang, J. (2016). Research on storm water management landscape security pattern in the background of sponge city. Mod. Urban Res. (07), 6–11+28. doi:10.3969/j.issn.1009-6000.2016.07.002
Zhou, Y., and Zhao, H. (2000). Theory and calculation of drainage network (1st edn). China Architecture & Building Press, 96.
Keywords: urban central area flooding, rain–flood security pattern, rain–flood corridor, land use impact, Nanjing central area
Citation: Ma K, Li X, Liu Q, Zhou W and Li W (2025) Assessing the impact of land use patterns on rain-flood risk in high-density urban centers: a SCS-CN model-based approach. Front. Environ. Sci. 13:1713793. doi: 10.3389/fenvs.2025.1713793
Received: 26 September 2025; Accepted: 18 November 2025;
Published: 28 November 2025.
Edited by:
Ruijie Zeng, Arizona State University, United StatesReviewed by:
Qianqiu Longyang, University of Kansas, United StatesChuncheng Yao, Arizona State University, United States
Copyright © 2025 Ma, Li, Liu, Zhou and Li. This is an open-access article distributed under the terms of the Creative Commons Attribution License (CC BY). The use, distribution or reproduction in other forums is permitted, provided the original author(s) and the copyright owner(s) are credited and that the original publication in this journal is cited, in accordance with accepted academic practice. No use, distribution or reproduction is permitted which does not comply with these terms.
*Correspondence: Kun Ma, bWFrdW5AeXp1LmVkdS5jbg==