 Haitao Chen
 Jiaxue Ren1
- 1Hydraulic Engineering Institute, Jiangxi University of Water Resources and Electric Power, Nanchang, China
- 2Jiangxi Provincial Key Laboratory of Water Resources Allocation and Efficient Utilization, Jiangxi University of Water Resources and Electric Power, Nanchang, China
- 3School of Science, Jiangxi University of Water Resources and Electric Power, Nanchang, China
As China’s pioneering cross-provincial ecological compensation zone, the upper Xin’an River Basin harbors immense ecological value. However, the long-term effects of its compensation policies on land use dynamics and associated landscape ecological risks (LER) remain poorly understood. Leveraging Google Earth Engine (GEE), this study analyzes land use changes from 1990 to 2020 and develops an LER assessment model to characterize spatiotemporal risk patterns. The GeoDetector model is then employed to quantify the relative influence of four categories of driving factors on LER. The results reveal that: (1) Forests have consistently dominated the landscape, with notable expansions in forest, waterbody, and urban areas, while cropland and tea plantations have declined; key transitions include bidirectional conversion between forests and tea plantations, as well as cropland conversion to other land uses; (2) The overall LER in the watershed has generally declined, particularly during the ecological compensation period, underscoring the policy’s positive impact. Spatially, LER exhibits distinct clustering patterns, with high-risk areas concentrated near urban centers and low-risk zones prevailing in mountainous regions; and (3) Natural factors, especially elevation and temperature, are the dominant drivers of LER patterns, while socioeconomic and accessibility factors have a limited impact. Collectively, these findings reflect the interplay between urbanization and ecological conservation efforts, offering a scientific foundation for optimizing watershed management under ecological compensation frameworks.
1 Introduction
Land use dynamics serve as a critical link between human activities and the natural environment, profoundly shaping ecosystem structure and function (Van Asselen and Verburg, 2013; Zhou et al., 2020). Over decades, rapid population growth and socioeconomic development have driven substantial land use changes (Jiang et al., 2022; Kuang et al., 2021), leading to habitat degradation (Zhou et al., 2017), diminished ecosystem services (Carter Berry et al., 2020), and increased ecological risks (Ai et al., 2022). These shifts pose critical threats to sustainable development, underscoring the need to analyze spatiotemporal land use patterns and assess regional ecological risks to enhance resilience.
Landscape ecological risk (LER) represents a crucial component of eco-environmental risk, referring to negative outcomes stemming from the interplay between landscape configurations and ecological dynamics (Cao et al., 2022; Jin et al., 2019; Zhang et al., 2020). Unlike traditional ecological risk assessments, LER focuses on spatiotemporal variation and scale effects, providing unique insights into risk processes and their evolutionary mechanisms (Chen et al., 2020; Lin and Wang, 2023). To date, extensive research has been devoted to LER assessments, addressing risks related to biodiversity loss (Li et al., 2024), climate adaptation (Mantyka-Pringle et al., 2015), landscape connectivity (Man et al., 2024), and human-induced ecological pressures (Bacci et al., 2013). These studies span multiple scales, including administrative units (Wang L.-J. et al., 2023), regular grids (Li et al., 2022), watershed units (Du et al., 2023), and urban clusters (Keshtkar et al., 2023).
LER assessment typically relies on land use patterns, as changes in land use impact both individual landscape features and broader ecological processes, making it essential for ecological risk evaluation (Zeng et al., 2024). Recent advancements in GIS/RS (Geographic Information System/Remote Sensing) technology, alongside platforms like Google Earth Engine (GEE) and PIE-Engine, have greatly enhanced the ability to map complex land use patterns over extended temporal scales (Xiong et al., 2021). This progress has enabled LER assessments across broader spatial extents and longer periods. For example, Karimian et al. (2022) assessed LER variations over nearly 40 years in the Dongjiang River Basin, while Zhang et al. (2023) evaluated the ecological risks in China’s nature reserves over the past 30 years. These studies have highlighted the spatiotemporal variations in ecological risks, essential for understanding regional ecological health and guiding conservation efforts. However, such studies often rely on existing land use data products (e.g., GlobeLand30, China Land Use Dataset (CLCD), and FROM-GLC, etc.) (Chen et al., 2015; Gong et al., 2013; Yang and Huang, 2021). For instance, Lin and Wang (2023) used the CLCD dataset to assess landscape ecological risks in a mountainous urban area, and Wang L.-J. et al. (2023) analyzed ecological risk changes in Nanjing from 2000 to 2020 using the GlobeLand30 dataset. Despite their high accuracy, these datasets’ applicability and reliability can vary significantly across regions (Zhai et al., 2023), and their direct use in regional LER studies may introduce considerable uncertainty (Zhong et al., 2023). Therefore, a more detailed understanding of land use changes and regional characteristics is essential for accurate LER assessments.
The Xin’an River Basin, spanning Anhui and Zhejiang provinces, plays a vital role as an ecological buffer and a primary water source for the Yangtze River Delta, contributing significantly to water conservation and biodiversity preservation (Ren et al., 2020; Yu et al., 2023). Meanwhile, the upstream watershed, renowned for its tourism appeal and tea production, has garnered sustained attention regarding its ecological health and sustainability. Since the 1990s, rapid population growth and socio-economic development in the upstream region have led to substantial land use changes, which pose significant threats to the water quality of downstream Qiandao Lake and undermine the basin’s ecological security (Chen et al., 2024; Wang S. et al., 2023). In response to this challenge, Anhui and Zhejiang provinces have implemented a cross-provincial ecological compensation mechanism, designating the Xin’an River Basin as China’s first pilot project of its kind (Yu et al., 2023). While considerable research has been conducted on ecological compensation mechanisms, ecosystem services, and water quality improvements, there remains a paucity of studies focusing on land use changes and long-term LER assessments within the context of ecological compensation.
This study centered on the upper Xin’an River Basin (XAJ watershed) to investigate the spatiotemporal changes in land use and LER from 1990 to 2020. Given the unique land cover features of the region, tea plantations were included in the land use classification system. By utilizing the GEE platform, six stable land use types were identified across the 1990–2020 period, and land use maps for 1990, 2000, 2010, and 2020 were generated by combining spectral, topographic, and textural features. A grid-based model for LER assessment was then developed, incorporating indicators of landscape disturbance and ecological vulnerability, which facilitated the examination of the spatiotemporal dynamics of LER and the identification of spatial patterns of clustering within the watershed. Subsequently, the GeoDetector model was applied to evaluate the influence of four categories of driving factors on changes in LER. The findings of this study will offer critical guidance for formulating sustainable development strategies and informing future management practices within the watershed.
2 Materials and methods
2.1 Study region description
The XAJ watershed, situated in the upper Xin’an River Basin of Anhui Province, eastern China (Figure 1), covers the geographic coordinates of 117°30′–119°00′E and 29°00′–30°30′N, with elevations ranging from 94 to 1765 m. It primarily covers Huangshan City, including Tunxi, Huizhou, and parts of Huangshan District, as well as Xiuning, Qimen, Yi, She, and Jixi Counties, with a total watershed area of 5,873.7 km2 (Cheng et al., 2020). The region features mainly mountainous and hilly landscapes, characterized by a subtropical monsoon climate. The mean annual temperature is 15.3 °C, and the average annual precipitation is 1927 mm. Forests dominate the area, with a forest coverage rate exceeding 70% (Chen et al., 2025a; Chen et al., 2025b).
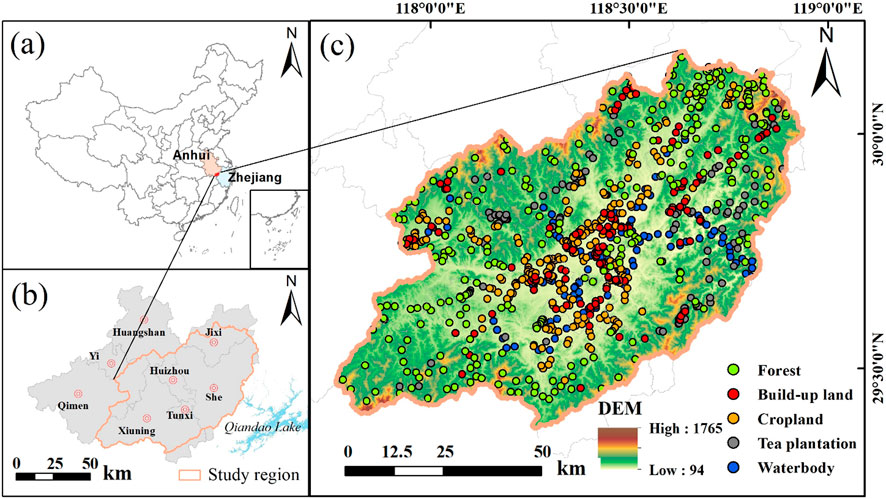
Figure 1. The study region location within China (a), within Huangshan City (b), and the distribution of sampling points across the region (c).
As a pioneering cross-provincial ecological compensation zone and a major tourist and tea-producing area, it has consistently drawn attention for its environmental quality (Fu L. et al., 2022; Li et al., 2023). In recent decades, rapid urbanization and significant changes in land use have led to a continuous decline in the ecological condition of the watershed. Additionally, influenced by human activities and climate change, events such as landslides, rockfalls, and mudflows are becoming increasingly frequent. These pressures are accelerating landscape fragmentation and heightening ecological risks, raising serious concerns for the region’s long-term sustainability.
2.2 Dataset overview and processing
Several relevant data are included in this study, including time-series Landsat imagery, natural factors (elevation, slope, and NDVI), climatic factors (precipitation and temperature), socio-economic factors (GDP density and population density), and regional accessibility factors (distances to rivers, town centers, and highways). Detailed information regarding data types, spatial resolution, and sources is provided in Table 1.
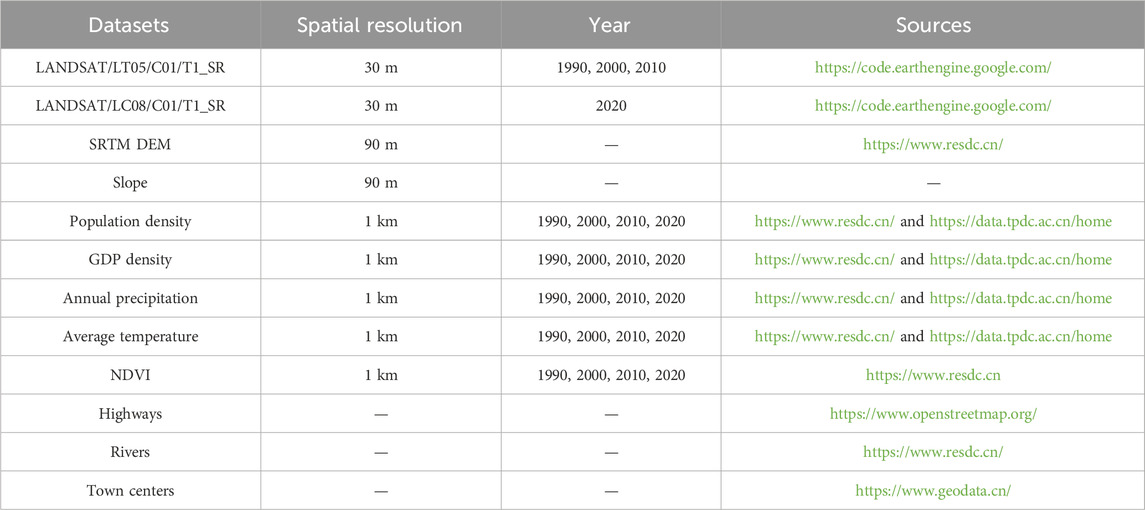
Table 1. Datasets overview for land use and landscape ecological risk dynamic analysis.
Landsat imagery was utilized for land use mapping. Specifically, the “LANDSAT/LT05/C01/T1_SR” and “LANDSAT/LC08/C01/T1_SR” datasets were used for mapping and classification in 1990, 2000, 2010, and 2020 on the GEE platform, with a spatial resolution of 30 m. All images underwent comprehensive pre-processing, including clipping, cloud removal, image fusion, and other necessary steps to ensure data quality. To better distinguish between tea plantations and forests, we synthesized composite images using data from April to July, aligning with the tea plantation harvest season. This period was chosen because spectral band characteristics exhibit pronounced variations during these months, enhancing the accuracy of classification. From these composite images, spectral and textural features were extracted, while elevation, slope, and aspect were obtained from 30-m resolution digital elevation data. This approach resulted in a robust, multidimensional feature set that integrates spectral, texture, and terrain information for improved classification performance. Additionally, by integrating multi-source data and applying spectral angular distance analysis (Section 2.3.2), long-term stable sample points were identified to support classification. The Random Forest (RF) algorithm was then applied to classify land use types for each target year, facilitating a comprehensive spatiotemporal analysis of land use dynamics throughout the study period.
Subsequently, the watershed was gridded, and the landscape disturbance index as well as the landscape vulnerability index for each grid cell were calculated using ArcGIS 10.2 and FRAGSTATS 4.2. Based on these indices, an LER assessment model was developed to evaluate the dynamic patterns and spatial correlations of LER across the entire XAJ watershed.
Finally, we assessed the impact of natural, climatic, socio-economic, and regional accessibility driving factors on LER changes using the GeoDetector model. Natural and climatic factors are regarded as key drivers influencing land use dynamics, while the acceleration of socio-economic development has further expanded changes in land use patterns. Additionally, we considered the influence of proximity to rivers, town centers, and highways. Based on these considerations, we ultimately selected ten key indicators to describe the driving forces behind LER changes (Table 1). The elevation and slope data have a resolution of 90 m, whereas the GDP density, population density, precipitation, NDVI, and temperature data are available at a resolution of 1 km. All datasets used in this research are listed in Table 1, and a detailed workflow diagram is provided in Figure 2.
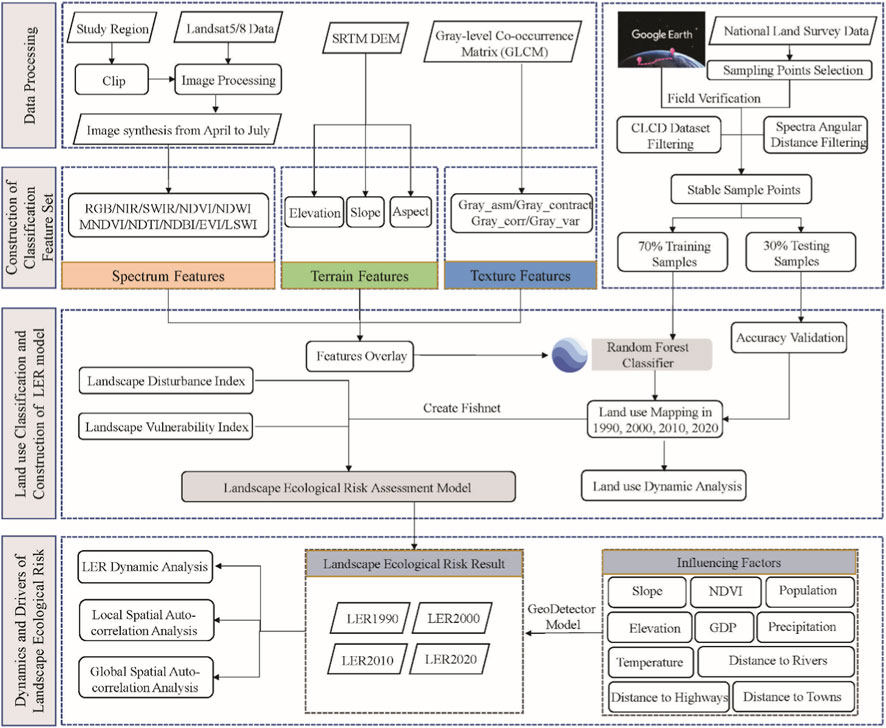
Figure 2. Workflow diagram for land use mapping, LER pattern analysis, and driving factor assessment.
2.3 Land use classification
2.3.1 Image compositing and feature extraction
Referring to the land use classification system and watershed characteristics, the labeled land use types within the watershed encompass tea plantations, forests, croplands, built-up lands, grasslands, and waterbody. The classification of this heterogeneous land use in the watershed poses a significant challenge. Notably, tea plantations, mainly situated in mountainous regions with complex terrain, exhibit a fragmented distribution and are highly influenced by climatic conditions, intensifying the difficulty and uncertainty associated with classification. In our methodology, we systematically reviewed all images captured between April and July of the target year, prioritizing composites with less than 10% cloud cover. This process enhances our ability to distinguish features between land use types, contributing to heightened classification accuracy.
To ensure the consistency and availability of image features across all target years, we extracted three distinct types of features: spectrum, terrain, and texture features. Recognizing that the original spectral features offer limited information, we opted to enhance their informativeness by incorporating spectral indices. In this regard, we utilized Normalized Difference Water Index (NDWI), Modified NDWI (MNDWI), Normalized Difference Tillage Index (NDTI), Normalized Difference Building Index (NDBI), Normalized Difference Vegetation Index (NDVI), Enhanced Vegetation Index (EVI), and Land Surface Water Index (LSWI) indicators to expand the original set of indicators for more effective land use classification. These indicators have been proven to be effective indicators for land use classification in other studies. Similarly, terrain features such as elevation, slope, and aspect were considered for classification (Table 2).
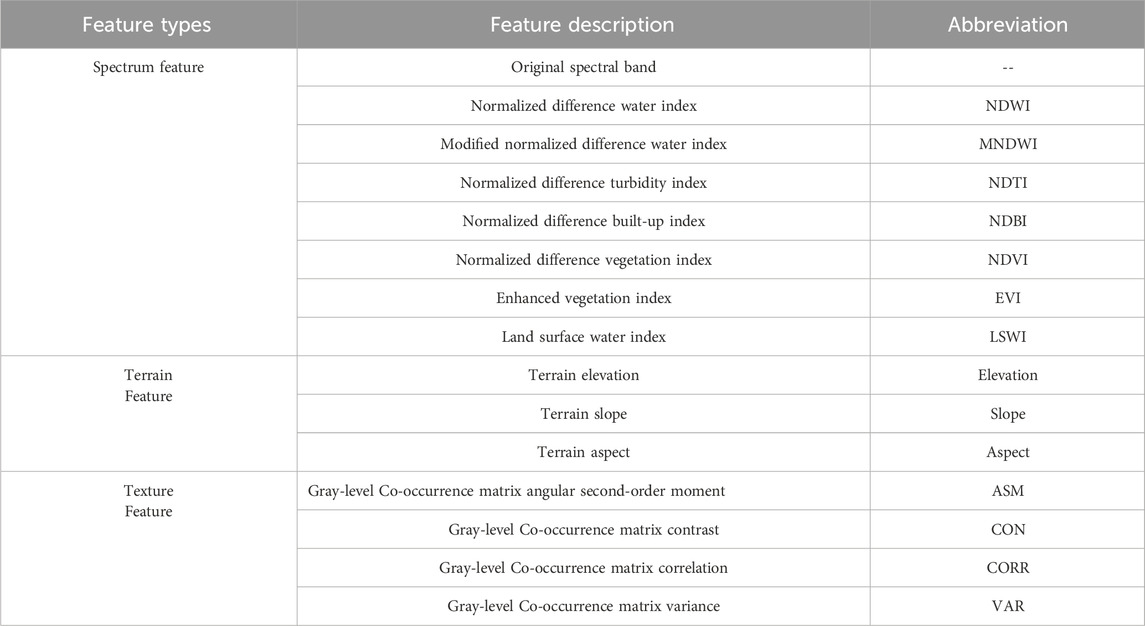
Table 2. Feature types and descriptions for land use classification.
Besides, considering the distinctive texture characteristics of tea plantations, the Gray-Level Co-occurrence Matrix (GLCM), a widely recognized method for capturing detailed spatial information, was used in this study. The GLCM is particularly effective in extracting information related to the direction of grey levels, adjacent intervals, and the amplitude of changes within images (Kang et al., 2023). In this research, commonly used texture features such as Angular Second-order Moment (ASM), Contrast (CON), Correlation (CORR), and Variance (VAR) were applied for classification, and the texture features were calculated by the glcmTexture function provided by the GEE, with a kernel size of 3 × 3. Eventually, 20 image features were generated in land use classification for each target year.
2.3.2 Stable sample points acquisition
Obtaining high-accuracy training sample datasets with extensive temporal coverage remains a significant challenge in dynamic land use mapping (Huang et al., 2020). Here, we overcame the difficulties of sample collection by integrating multiple data sources and applying a spectral angular distance approach. First, we obtained the National Second Land Use Survey data from the local government, facilitating our selection of accurate sample points for 1 year. Based on this, sample points summing up to 2650 were selected for the main five land use types (Table 3). These sample points were evenly distributed and covered the entire study area (Figure 1). Subsequently, we used the annual CLCD dataset to filter out the sample points that consistently belonged to one land use type from 1990 to 2020. This process is a prerequisite for sample point migration and ensures that most sample points are stable over the study period. Finally, we further screened the samples using the sample migration method proposed by Huang et al. (2020). Specifically, we calculated the Spectral Angular Distance (SAD) and Euclidean Distance (ED) for each sample to measure spectral differences between reference and target times. Change status was determined by applying thresholds of 0.9 for SAD and 0.2 for ED, where samples exhibiting values below both thresholds were classified as stable (Huang et al., 2020). Ultimately, 864 long-term stable sample points were selected for classification.
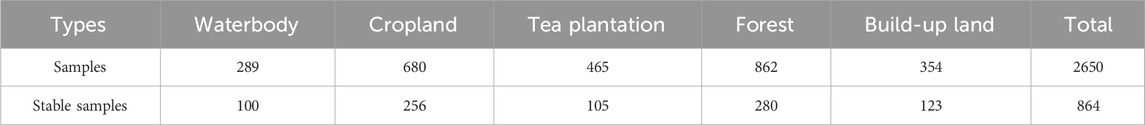
Table 3. Number of samples and stable samples for land use classification.
2.3.3 Land use classification algorithm
RF is an ensemble algorithm that builds decision trees using random data and feature subsets. It's commonly used in land use classification to categorize remote sensing imagery by assigning pixels to land cover types based on spectral and spatial features. Compared to other classification models, the RF model demonstrates stronger robustness and generalization abilities, and can effectively avoid overfitting. This study utilizes the ee. Classifier.smileRandomForest function for classification on the GEE platform. This algorithm requires setting two parameters: the number of decision trees and the number of features assigned to each node. In this study, three type of features were selected for RF classification (Table 2). The number of decision trees was set to 500 to ensure reliable predictions, while the number of features considered at each node followed the default setting, calculated as the square root of the total input variables. To optimize classification accuracy, repeated experiments and analyses were conducted to determine that 70% of the stable samples were used for training and 30% for validation. The overall performance each year was assessed using Overall Accuracy (OA) and the Kappa coefficient, while class-level accuracy was evaluated through Consumer Accuracy (CA) and Producer Accuracy (PA).
2.4 LER assessment
2.4.1 Delineation of risk grids
Delineating the landscape into risk zones is crucial for LER assessment. According to landscape ecology principles, risk zones are typically set to 2∼5 times the average patch size of the study region (Leuven and Poudevigne, 2002; Lin and Wang, 2023). Accordingly, the watershed was first divided into 3 km × 3 km grid cells using ArcGIS 10.2, generating a total of 735 risk assessment units. The ecological risk index for each unit was then calculated using FRAGSTATS 4.2.
2.4.2 LER assessment model
The LER assessment model was constructed according to the landscape disturbance index and landscape vulnerability index, as formulated in Equation 1:
Where ERI denotes the landscape ecological risk index of the assessment unit; Ak and Aki represent the areas of the kth risk zone and ith land use type, respectively. The variable n denotes the total number of land use types, and Ri is the landscape loss index for the ith land use type, calculated by Equation 2.
Where Fi denotes the landscape disturbance index of the ith land use type, and Si denotes its corresponding landscape fragility index. The index Fi reflects the spatial dispersion of patches within a given land use category—higher values indicate a more fragmented or scattered distribution. As shown in Table 4, different Fi values are assigned to six land use types. After normalization, these values are as follows: built-up land (0.047), forest (0.095), tea plantation (0.143), grassland (0.190), cropland (0.238), and waterbody (0.286). Si indicates the intensity of disturbance affecting various land use types. It is composed of three components: the landscape fragmentation index (Ci), isolation index (Ni), and dimension index (Di), with corresponding weights of a = 0.5, b = 0.3, and c = 0.2.

Table 4. Calculation expression of landscape pattern indices.
According to the calculation results of ERI, the natural break method is used to classify the ecological risk into five levels: low ecological risk (ERI ≤ 0.035), medium-to-low ecological risk (0.035 < ERI ≤ 0.05), medium ecological risk (0.05 < ERI ≤ 0.07), medium-to-high ecological risk (0.07 < ERI ≤ 0.09) and high ecological risk (ERI > 0.09).
2.4.3 Spatial autocorrelation analysis
Spatial autocorrelation analysis is used to determine whether LER values in neighboring spatial units exhibit statistically significant associations, thereby uncovering the spatial dependency structure of LER (Liu et al., 2019). Here, the global Moran’s I index is employed to quantify the overall degree of spatial autocorrelation in LER, with its values spanning from −1 (indicating perfect dispersion) to 1 (indicating perfect clustering). Additionally, the local Moran’s I index is used to explore the local spatial heterogeneity of LER (Forey et al., 2009). Positive values indicate a significantly high-high or low-low clustering pattern, where neighboring areas exhibit similar risk levels. In contrast, negative values reveal a high-low or low-high clustering pattern, indicating dissimilarity between adjacent regions. The specific formulas are as follows:
Where
2.5 Factors influencing LER
The GeoDetector model is a statistical framework developed to identify spatial heterogeneity and uncover its underlying driving mechanisms. It comprises four functional components: the factor detector, risk detector, interaction detector, and ecological detector (Yang et al., 2024). Among them, the factor detector can quantify the relative importance of influencing factors by constructing a q statistic to assess the explanatory power of the independent variable on the dependent variable, while the interaction detector can be used to identify interactions between different drivers and to assess the impact of the interaction of two factors on the explanatory power of the dependent variable Wang et al. (2010). The q statistic was defined as follows:
The q statistic signifies the impact of an individual factor on LER changes. A higher q value indicates a more pronounced influence of the driver on LER, q ∈ [0,1], the larger the q value, the greater the effect of the driver on LER. Here, h = 1, …, L, represents stratum of variables, Nh and N denote sample sizes in h and the whole region,
Here, we utilized the GeoDetector model to detect and quantify the spatial stratified heterogeneity of factors within the watershed from 1990 to 2020. This study examined the driving forces that influence LER change from four perspectives: natural factors (elevation, slope, and NDVI), climatic factors (precipitation and temperature), socio-economic factors (GDP density and population density), and regional accessibility factors (distances to rivers, town centers, and highways). Elevation (X1), slope (X2), NDVI (X3), precipitation (X4), temperature (X5), GDP density (X6), population density (X7), distances to rivers (X8), distances to town centers (X9), and distances to highways (X10) were selected as independent variables, and LER level were selected as dependent variables. Using ArcGIS software, we discretized the independent variable and performed grid matching for both the independent and dependent variables based on the generated grid cells. The Spatiotemporal variation of the four types of driving factors influencing LER patterns is presented in Supplementary Figures S1–S4.
3 Results
3.1 Classification accuracy evaluation and land use change analysis
3.1.1 Accuracy evaluation
Land use was generated for 1990, 2000, 2010, and 2020 based on all available Landsat SR data on the GEE platform. The accuracy of classification was analyzed using the validation samples and confusion matrix (Table 5). Overall, the classification accuracy is satisfactory, with the Kappa coefficient and OA both exceeding 0.87. In each category, waterbody has the highest average scores for both CA and PA, followed by croplands and built-up land, which show similar levels of accuracy. Forest and tea plantations exhibit slightly lower scores in comparison. Given the high accuracy of classification, it can be further utilized for dynamic analysis of land use and LER.
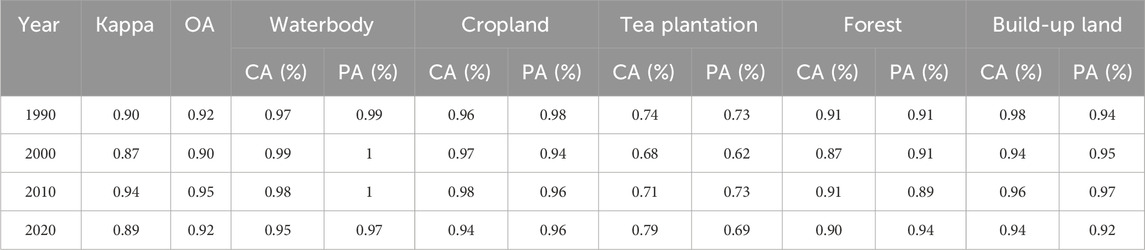
Table 5. The statistics of classification accuracy for different years.
3.1.2 Land use change analysis
The land use distribution and area of the XAJ watershed from 1990 to 2020 are presented in Figure 3. The region is predominantly forested, accounting for over 70% of the total area. Between 1990 and 2010, forested areas showed an increasing trend, while from 2010 to 2020, they remained relatively stable. Forests are mainly distributed in the higher-altitude areas surrounding the watershed. In contrast, cropland is concentrated in the central part of the watershed, where the terrain is flat and adjacent to urban areas. Cropland accounts for more than 10% of the total watershed area but has shown a gradual decreasing trend. Tea plantations, an important component of the watershed, occupy approximately 10% of the watershed’s area and have generally declined within the study duration. Additionally, built-up land, waterbody, and grassland make up a small part of the XAJ watershed, together accounting for less than 3% of the total area. Among these, built-up land and waterbody areas have steadily expanded from 1990 to 2020, increasing by 1.07 and 1.55 times, respectively, while grassland areas have consistently diminished, with a reduction of 74.9%.
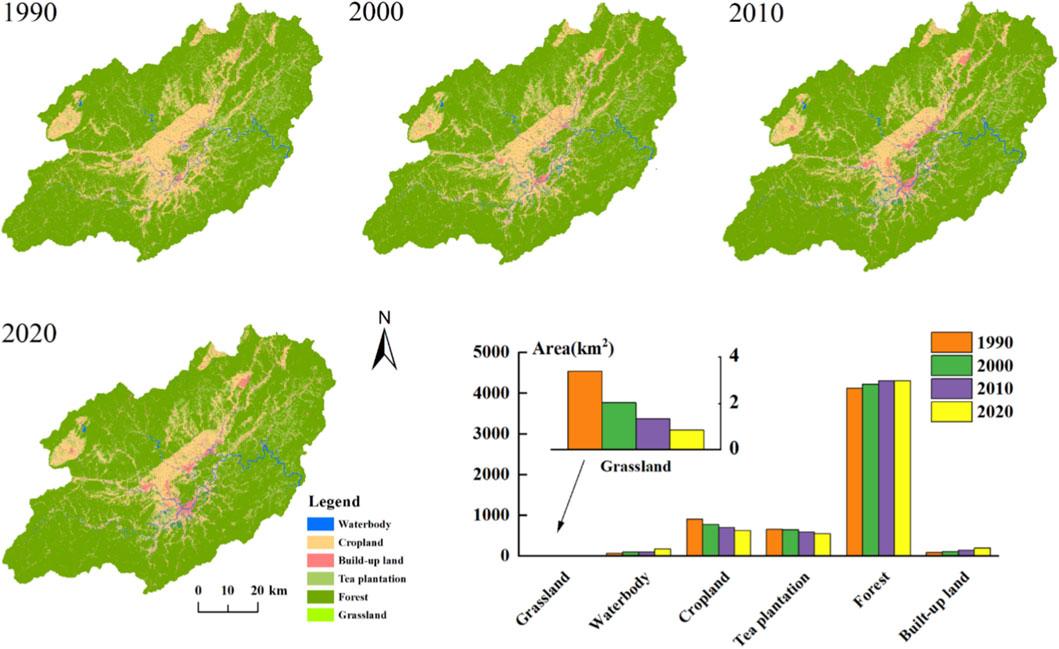
Figure 3. Land use distribution and area statistics in the XAJ watershed from 1990 to 2020.
Figure 4 illustrates substantial land use changes in the XAJ watershed between 1990 and 2020. The findings show that major transitions primarily occurred between tea plantations and forests, as well as from cropland to forest, tea plantations, and built-up land during the study period. This process may reflect both rapid urbanization and the implementation of the “Grain for Green” program. For instance, between 1990 and 2000, approximately 258.7 km2 of tea plantations were converted into forests, while 209.9 km2 of forests were transformed into tea plantations (Supplementary Table S1), highlighting a notable bidirectional conversion between forests and tea plantations. Additionally, the continuous decline in cropland over the past 3 decades has been largely driven by its conversion to forest. Specifically, 67.64 km2, 41.92 km2, and 20.9 km2 of cropland were converted into forest in each respective decade (Supplementary Table S1). Besides, part of the cropland was also converted into built-up land and waterbody, which further contributed to the expansion of these land use categories.

Figure 4. Land use transition patterns in the XAJ watershed visualized by chord diagrams across 3 decades: (a) 1990–2000, (b) 2000–2010, (c) 2010–2020. The width of each chord represents the area of land use change, in square kilometers (km2).
3.2 Spatiotemporal pattern of LER
Figure 5 presents the temporal dynamics and spatial distribution of LER in the XAJ watershed over the past 3 decades, revealing notable variations across different risk levels. Spatially, LER intensity decreases gradually from the central urban areas outward, with high-risk zones mainly concentrated in the urban core of Huangshan City, while low-risk zones are predominantly distributed in the surrounding high-altitude mountainous regions. Over time, the average LER values for the watershed in 1990, 2000, 2010, and 2020 were 0.056, 0.055, 0.055, and 0.051, respectively, indicating a general downward trend, especially between 2010 and 2020. In terms of the composition proportions of LER, the percentage of low ecological risk areas continuously increased from 13.7% to 25.3% between 1990 and 2020. Meanwhile, the area of high ecological risk regions expanded during the period from 1990 to 2010 but decreased during the subsequent decade from 2010 to 2020. Additionally, the proportion of medium-to-high ecological risk areas showed a consistent decline, collectively reflecting the ongoing reduction in LER over the study period.
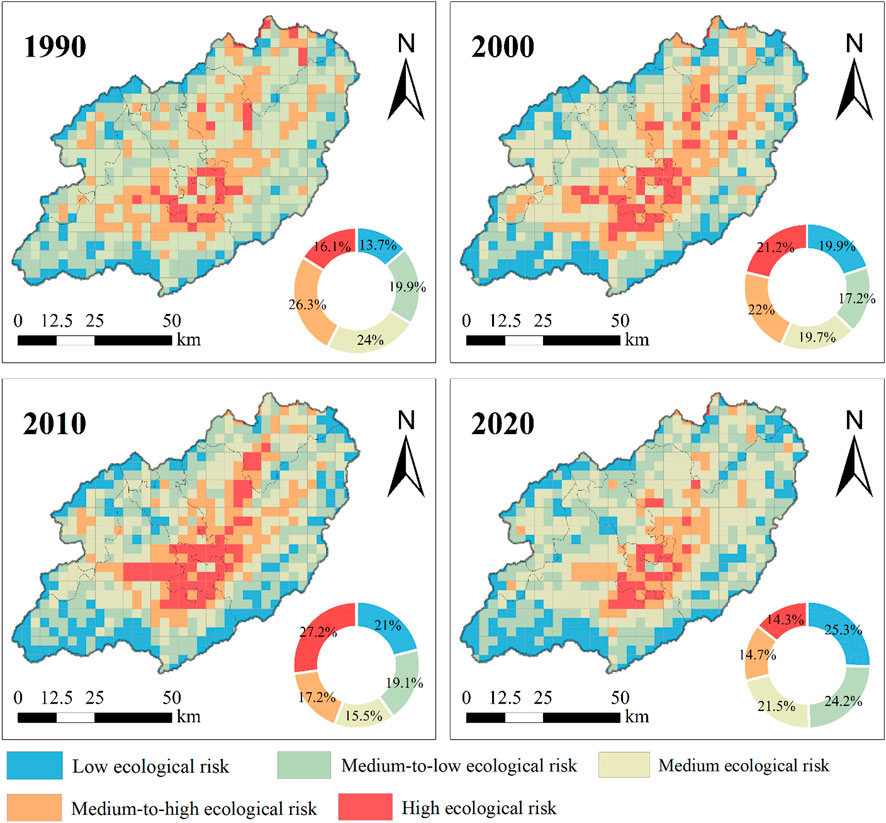
Figure 5. Spatiotemporal distribution and composition proportions of LER risk levels in the XAJ watershed (1990–2020).
Figure 6 depicts the changes in the area of different levels of LER within the watershed from 1990 to 2020. Between 1990 and 2000, the shifts in LER levels were mainly reflected in the following aspects: the transition from medium-to-low risk to low risk (368.38 km2), the shift from medium to medium-to-low risk (381.23 km2), and the mutual conversion between medium-to-high risk and medium risk areas (618.75 km2). Additionally, an area of 191.66 km2 transitioned from medium-to-high risk to high ecological risk (Supplementary Table S2). During this period, the extent of both low risk and high risk areas expanded by 6.2% and 5.1%, respectively. These dynamics suggest a polarization trend in LER during the urbanization process, with marked risk reduction in certain areas and increasing risk in others.
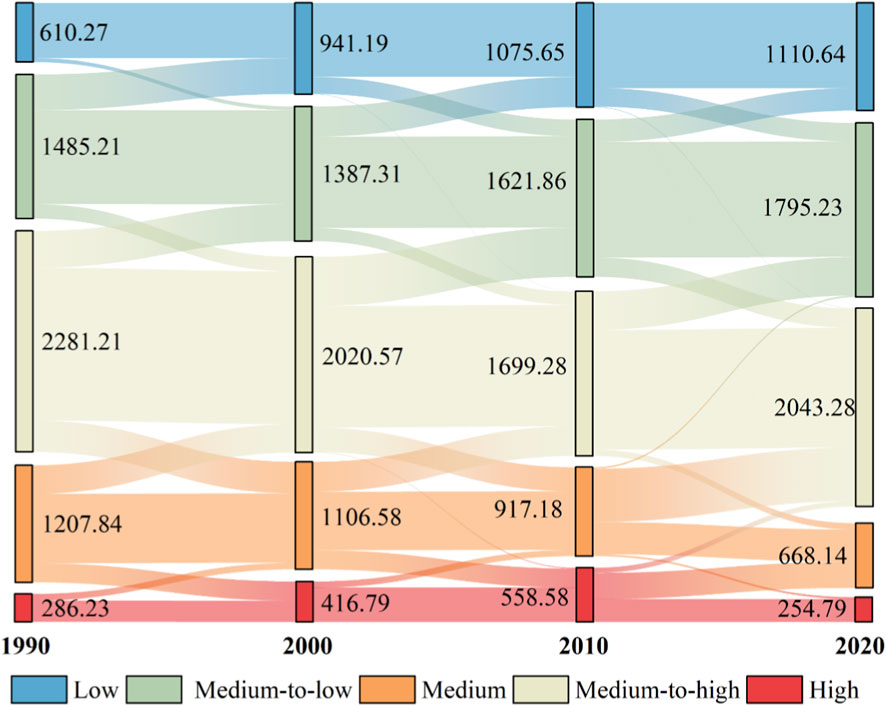
Figure 6. Sankey diagram of area transfer matrix (km2) for different levels of LER in XAJ watershed from 1990 to 2020.
Between 2000 and 2010, both low risk and high risk zones continued to expand, with their proportions increasing to 21% and 27.2%, respectively. During this period, the area transitioning from medium-to-low risk to low risk was 311.54 km2, while the area shifting from medium-to-high risk to high risk was 198 km2 (Supplementary Table S2). In addition, the LER transitions during 2000–2010 were mainly characterized by the shift from medium risk to medium-to-low risk, as well as the mutual conversion between medium and medium-to-high risk levels.
From 2010 to 2020, LER levels continued to improve, with LER gradually shifting toward more favorable categories. The main transitions included: 270 km2 shifting from high to medium-to-high risk, 549.2 km2 transitioning from medium-to-high to medium risk, and 398.27 km2 moving from medium to medium-to-low risk (Supplementary Table S2). These changes resulted in notable decreases in the proportions of both medium-to-high and high-risk areas, reflecting an overall reduction in LER across the study region.
3.3 Spatial autocorrelation characteristics of LER
The XAJ watershed exhibited global Moran’s I values of 0.60, 0.66, 0.66, and 0.61 for the years 1990, 2000, 2010, and 2020, respectively, with corresponding p-values all below 0.01 (Figure 7). These results point to a consistently clustered spatial distribution of LER across the study area, indicating pronounced positive spatial autocorrelation that remained relatively stable over the 30 years. From 1990 to 2010, a steady increase in Moran’s I value was observed, suggesting a growing tendency for LER to cluster spatially. However, between 2010 and 2020, a slight drop in the index was noted, implying a minor reduction in the degree of spatial clustering during this period.

Figure 7. Goble Moran’s I scatter of LER in the XAJ watershed from 1990 to 2020.
Figure 8 illustrates that the local spatial autocorrelation of LER in the study area is primarily characterized by high-high (H-H) and low-low (L-L) clustering types. The H-H clusters are predominantly located around the Tunxi urban area in the central region of the watershed, where land use is primarily composed of built-up land and cropland. In contrast, the L-L clusters are predominantly found in the peripheral areas of the watershed, with land use largely consisting of forested areas. Notably, the H-H clustering type exhibited a trend of initial expansion followed by contraction over the past 3 decades. Between 1990 and 2010, urban sprawl contributed to an increase in both the magnitude and spatial dispersion of LER. In contrast, during the ecological compensation period, a reduction in the spatial extent of H-H clusters was observed.
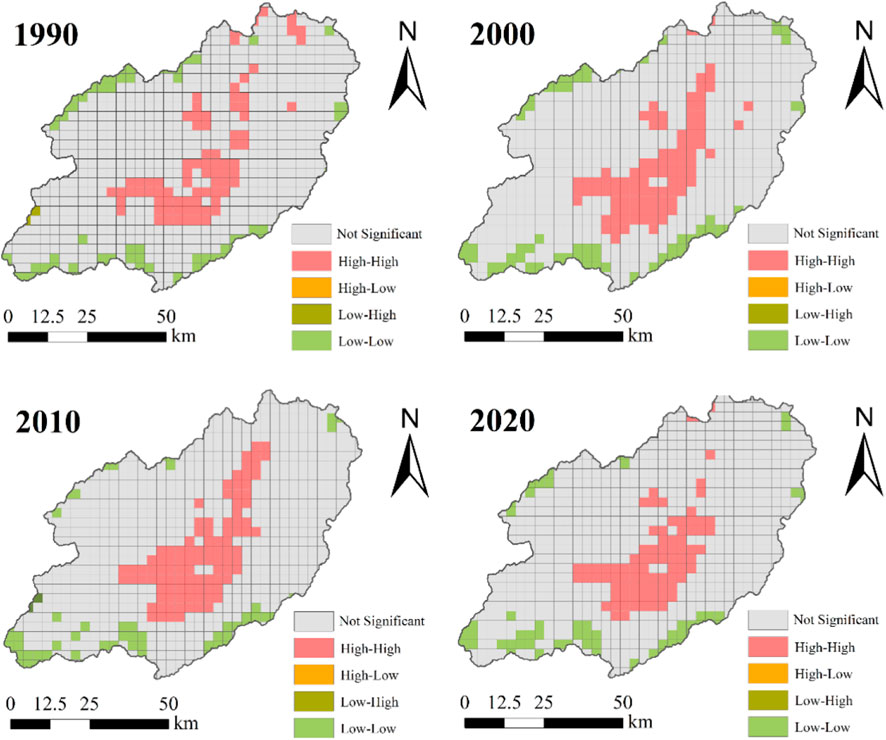
Figure 8. Local autocorrelation LER cluster map of ecological risk in the watershed.
3.4 Factors influencing the pattern of LER
By employing factor detector and interaction detector analyses, this study quantitatively evaluated the impact of ten influencing factors across four categories of driving factors on the LER pattern. As shown in Table 6, natural and climatic factors significantly influenced the LER pattern throughout the study period. Among the natural variables, elevation demonstrated the greatest explanatory power, while temperature was found to be the most influential climatic factor. From 1990 to 2020, their average q values were 0.57 and 0.56, respectively, underscoring their dominant roles in determining LER patterns. In contrast, socio-economic factors and regional accessibility factors had relatively limited impacts. Among the socio-economic factors, population density showed the highest explanatory power, while distances to town centers exhibited the greatest explanatory power within the regional accessibility factors. Notably, from 1990 to 2010, the continuous rise in the q values of these factors likely reflects the increasing impact of urbanization on LER. In contrast, from 2010 to 2020, their influence gradually declined, likely attributable to the implementation of ecological compensation policies.
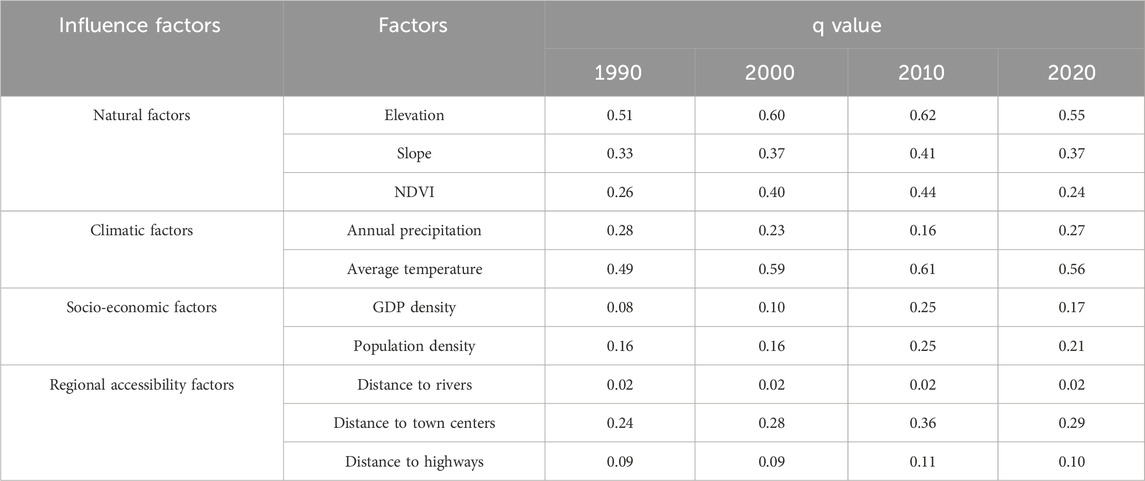
Table 6. Results of single-factor detector analysis for LER influencing factors in the XAJ watershed.
As shown in Figure 9, the interaction between any two factors consistently exerts a stronger influence on LER than the effect of individual factors alone. This indicates that the LER pattern is shaped by the combined effect of multiple factors. Notably, the interaction between elevation and average temperature stands out as the most significant, with q values consistently surpassing 0.5. Additionally, natural factors such as slope and NDVI exhibit strong interactive explanatory power, whereas the interactive explanatory power of socioeconomic and regional accessibility factors is comparatively weaker. This further underscores that the LER pattern is predominantly driven by natural and climatic factors.

Figure 9. Interaction results of LER driving factors from 1990 to 2020.
4 Discussion
4.1 Investigation into land use dynamics
Understanding land use dynamics provides key insights into regional environmental, socioeconomic, and ecological dynamics that are closely associated with human activities and natural variations (Berihun et al., 2019; Du et al., 2024). As an important practice ground for the “Two Mountains Theory,” the XAJ watershed was predominantly characterized by forest land from 1990 to 2020, with a continuous increase in forested areas that gradually stabilized. This trend can likely be attributed to the implementation of ecological protection measures in recent years (Sheng et al., 2023; Wang S. et al., 2023). Over the past 3 decades, the accelerated advancement of ecological civilization initiatives such as the “Ten Million Mu Forest Growth Project” and the “Forestry Greening and Efficiency Enhancement Initiative” has significantly increased forest coverage in the XAJ watershed through measures like returning cropland to forests and large-scale tree planting. Currently, forest coverage in the region has exceeded 70%. These efforts have not only significantly improved the regional ecological environment but also laid a solid foundation for the sustainable development of the watershed. Besides, despite the ongoing expansion of built-up land areas in the watershed over the past 30 years, significant growth has also been observed in both forest and waterbody areas (Figure 3), which has further contributed to a notable improvement in the region’s ecological service capacity (Yu et al., 2023). This, to a certain extent, demonstrates that the watershed has achieved a balance between ecological protection and economic development during its urbanization process.
From the perspective of land use transition, the past 3 decades have been characterized mainly by the conversion of cropland to other land use types, as well as the dynamic interplay between tea plantations and forests. Among these transformations, the continuous decline in cropland and tea plantation areas is likely closely associated with urban development and local environmental policies. For instance, the acceleration of urbanization has prompted a substantial migration of rural laborers to urban centers, thereby leading to a reduction in the cultivation of economic crops such as tea plantations and cropland. Moreover, since the 1990s, the progressive deterioration of downstream water quality in Qiandao Lake has driven local governments to implement a series of measures aimed at mitigating pollution sources and enhancing water quality (Chen et al., 2025b; Chen et al., 2024). In this context, the reduction in cropland and tea plantation areas corresponds closely with decreased fertilizer application, as these land use types are the primary sources of nutrient inputs.
Meanwhile, the mutual transformation between tea plantations and forest land may be influenced by a combination of factors such as economic demands and population changes. As an important tea-producing region in China, the Huangshan area holds significant economic value (Li et al., 2021). However, due to the relatively scattered distribution of tea plantations, which are interspersed with forests, this spatial pattern may lead to the conversion of some forest land into tea plantations. On the other hand, the region faces the challenge of labor outflow, resulting in the abandonment of some tea plantations due to a lack of management. This provides an opportunity for these areas to gradually revert to forest land. Overall, this dynamic change profoundly reflects the complex balance between economic development and ecological conservation.
4.2 LER pattern assessment in the watershed
As an important practice site for China’s “Two Mountains” theory and the construction of ecological civilization, the XAJ watershed holds significant demonstration value in assessing the development trends of ecological risks. Research findings reveal that between 1990 and 2020, the overall LER exhibited a declining trend, accompanied by pronounced spatial differentiation. High risk zones were predominantly located in central urban areas, where the extent expanded continuously from 1990 to 2010. This expansion was primarily driven by increasing built-up and impervious surfaces due to rapid urbanization, which intensified landscape fragmentation. In contrast, low risk areas were primarily distributed across the surrounding high-altitude regions, where forestland dominated the land use, characterized by high habitat quality and low LER values. Notably, during the period from 2010 to 2020, despite the ongoing expansion of urban areas, the proportion of high LER zones decreased (Figure 5). This decline may reflect the positive effects of ecological compensation policies implemented in recent years, highlighting their critical role in mitigating ecological risks. These measures likely encouraged more intensive urban land use and reduced landscape fragmentation, thus alleviating ecosystem stress (Liu et al., 2023; Wang X. et al., 2025). Furthermore, large-scale ecological restoration initiatives, such as the “Ten Million Mu Forest Growth Project” and the “Forestry Greening and Efficiency Enhancement Initiative” have significantly increased forest cover and promoted more compact land use patterns (Liu et al., 2018), further contributing to the reduction of ecological risks.
Spatially, LER exhibits significantly high-high and low-low clustering patterns (Figure 8), consistent with previous research findings (Shamuxi et al., 2025). These patterns reflect a clear spatial concentration of LER, revealing an uneven distribution across the watershed. High–high clusters are predominantly located in urban zones and areas adjacent to croplands—recognized as major sources of pollution inputs (Wang S. et al., 2023). Therefore, future environmental governance and ecological management should be regionally adaptive, integrating local characteristics to achieve more effective environmental governance and ecological protection.
4.3 Driving factors of LER in the watershed
Results from the driving force analysis indicate that temperature and elevation are the dominant factors influencing LER, consistent with prior findings (Wang J. et al., 2025). This pattern is likely shaped by the unique topography of the XAJ watershed, which is mainly composed of mountainous and hilly terrain. These areas typically feature steep slopes and cooler climates, creating favorable conditions for vegetation growth and ecological recovery. Consequently, over the past 3 decades, regions with low ecological risk have steadily decreased in extent. Conversely, human activities such as agriculture and industry are predominantly concentrated in lower-altitude flat zones (Fu J. et al., 2022), where accessibility is higher and settlement is more favorable. These anthropogenic pressures have led to increased disturbances in natural ecosystems, intensified land use conflicts, and greater landscape fragmentation in low-altitude regions. Overall, LER is primarily driven by natural and climatic factors, with temperature and elevation being the most critical influencing factors, while NDVI and slope also significantly affect the spatial distribution pattern of LER. However, the influence of population density and distance to town centers on LER should not be disregarded, as they also play an important role in shaping LER to a certain extent.
The analysis of two-factor interactions underscores the significant role of combined effects in shaping the spatiotemporal dynamics of LER. The results reveal that these factors interact synergistically, with their combined influence surpassing that of any single factor. This aligns with previous research (Shamuxi et al., 2025), suggesting that LER patterns are influenced by the interplay of multiple factors.
4.4 Future strategies for watershed ecological protection
As a national pilot zone for implementing the “Two Mountains Theory” and cross-provincial ecological compensation mechanisms, the XAJ watershed exhibits a distinct spatial gradient in LER. High-risk areas are predominantly concentrated in urban built-up zones and adjacent agricultural lands, whereas low-risk areas are largely confined to upstream ecological barriers. This spatial differentiation offers a scientific basis for designing targeted and differentiated land-use governance strategies. Accordingly, we propose a closed-loop management framework structured around “zonal identification, categorical intervention, and coordinated governance.” In high-risk zones, urban expansion should be strictly controlled through the clear delineation of urban growth boundaries, mandatory implementation of Low-Impact Development (LID) techniques, and systematic restoration of blue-green infrastructure. Concurrently, peri-urban farmlands should transition toward ecologically oriented agricultural practices to alleviate land-use conflicts. In moderate-risk zones, integrated measures --such as cropland consolidation, farmland-to-forest/wetland conversion, and the establishment of ecological corridors --should be promoted to enhance landscape connectivity and ecosystem service provision. In low-risk zones, rigorous enforcement of ecological redlines is essential, supported by comprehensive conservation policies, strict development prohibitions, and intelligent ecological monitoring to maintain the watershed’s fundamental ecological security. Furthermore, LER dynamics should be formally incorporated into the cross-provincial ecological compensation framework, establishing a dual-indicator mechanism based on both water quality and ecological risk. Compensation funds should be allocated differentially and linked to performance, with priority given to high-risk restoration areas. Such a transformation will shift ecological compensation from a reactive, outcome-based model toward a proactive, risk-informed governance system, ultimately fostering synergy between ecological conservation and high-quality regional development.
5 Conclusion
This study investigates the XAJ watershed, China’s pioneering cross-provincial ecological compensation watershed. Utilizing the GEE platform, it analyzes land use changes from 1990 to 2020 and develops an LER model to explore its spatiotemporal dynamics. The GeoDetector model is further employed to quantify the impacts of four categories of driving factors on LER. The results revealed that: (1) Over the past 30 years, the watershed has undergone profound land use changes, with forests consistently dominating (covering over 70% of the area and showing a continuous increase), while cropland and tea plantations have steadily declined, and built-up land and water bodies have expanded significantly. (2) The primary land use transitions involved bidirectional conversions between tea plantations and forests, as well as the conversion of cropland to other land types; concurrently, the overall LER showed a declining trend, with a particularly sharp decrease during the ecological compensation period. (3) The spatial distribution of LER exhibited distinct high-high and low-low clustering patterns, where high-risk areas were concentrated in the central urban district of Huangshan City, and low-risk areas were primarily distributed across the surrounding mountainous regions. (4) Natural and climatic factors were the dominant forces shaping the spatial distribution of LER, with elevation and temperature identified as the primary determinants, while socio-economic and accessibility factors had a limited impact; the interaction between any two factors consistently exerted a stronger influence than any single factor alone, indicating that the spatial pattern of LER results from the synergistic effects of multiple elements. In summary, land use and LER patterns may reflect the interplay of urbanization and ecological conservation. Moving forward, prioritizing high-risk areas and refining ecological compensation and land management strategies will be crucial for optimizing watershed protection.
Data availability statement
The original contributions presented in the study are included in the article/Supplementary Material, further inquiries can be directed to the corresponding authors.
Author contributions
HC: Visualization, Conceptualization, Validation, Formal Analysis, Writing – original draft, Methodology. JR: Writing – review and editing, Investigation, Data curation, Validation. WR: Formal Analysis, Writing – review and editing, Methodology, Investigation. HL: Formal Analysis, Validation, Methodology, Writing – review and editing. LL: Methodology, Conceptualization, Funding acquisition, Validation, Writing – review and editing.
Funding
The authors declare that financial support was received for the research and/or publication of this article. This research was funded by the Research Startup Fund for Introduced Talents at Jiangxi University of Water Resources and Electric Power (0101-01000576).
Acknowledgements
The constructive comments and suggestions by the journal referees and editors are gratefully acknowledged.
Conflict of interest
The authors declare that the research was conducted in the absence of any commercial or financial relationships that could be construed as a potential conflict of interest.
Generative AI statement
The authors declare that no Generative AI was used in the creation of this manuscript.
Any alternative text (alt text) provided alongside figures in this article has been generated by Frontiers with the support of artificial intelligence and reasonable efforts have been made to ensure accuracy, including review by the authors wherever possible. If you identify any issues, please contact us.
Publisher’s note
All claims expressed in this article are solely those of the authors and do not necessarily represent those of their affiliated organizations, or those of the publisher, the editors and the reviewers. Any product that may be evaluated in this article, or claim that may be made by its manufacturer, is not guaranteed or endorsed by the publisher.
Supplementary material
The Supplementary Material for this article can be found online at: https://www.frontiersin.org/articles/10.3389/fenvs.2025.1723453/full#supplementary-material
References
Ai, J., Yu, K., Zeng, Z., Yang, L., Liu, Y., and Liu, J. (2022). Assessing the dynamic landscape ecological risk and its driving forces in an island city based on optimal spatial scales: haitan island, China. Ecol. Indic. 137, 108771. doi:10.1016/j.ecolind.2022.108771
Bacci, T., Rende, S. F., Penna, M., Trabucco, B., Montefalcone, M., Cicero, A. M., et al. (2013). A methodological approach to understand functional relationships between ecological indices and human-induced pressures: the case of the Posidonia oceanica meadows. J. Environ. Manag. 129, 540–547. doi:10.1016/j.jenvman.2013.08.008
Berihun, M. L., Tsunekawa, A., Haregeweyn, N., Meshesha, D. T., Adgo, E., Tsubo, M., et al. (2019). Exploring land use/land cover changes, drivers and their implications in contrasting agro-ecological environments of Ethiopia. Land Use Policy 87, 104052. doi:10.1016/j.landusepol.2019.104052
Cao, Z., Wan, B., Xiao, Y., Wu, M., Tan, X., Zhang, Q., et al. (2022). Exploring the impact of landscape ecological risk on water quality in the danjiangkou reservoir, China. Earth Space Sci. 9 (9), e2022EA002363. doi:10.1029/2022EA002363
Carter Berry, Z., Jones, K. W., Gomez Aguilar, L. R., Congalton, R. G., Holwerda, F., Kolka, R., et al. (2020). Evaluating ecosystem service trade-offs along a land-use intensification gradient in central Veracruz, Mexico. Ecosyst. Serv. 45, 101181. doi:10.1016/j.ecoser.2020.101181
Chen, J., Chen, J., Liao, A., Cao, X., Chen, L., Chen, X., et al. (2015). Global land cover mapping at 30m resolution: a POK-Based operational approach. ISPRS J. Photogrammetry Remote Sens. 103, 7–27. doi:10.1016/j.isprsjprs.2014.09.002
Chen, J., Dong, B., Li, H., Zhang, S., Peng, L., Fang, L., et al. (2020). Study on landscape ecological risk assessment of hooded crane breeding and overwintering habitat. Environ. Res. 187, 109649. doi:10.1016/j.envres.2020.109649
Chen, H., Wang, C., Ren, Q., Liu, X., Ren, J., Kang, G., et al. (2024). Long-term water quality dynamics and trend assessment reveal the effectiveness of ecological compensation: insights from China’s first cross-provincial compensation watershed. Ecol. Indic. 169, 112853. doi:10.1016/j.ecolind.2024.112853
Chen, H., Luo, L., Ren, J., Liu, X., Wang, C., Ren, Q., et al. (2025a). Legacy nitrogen impeding the achievement of nitrogen management targets: evidence from China's first cross-provincial ecological compensation watershed. Environ. Technol. and Innovation 38, 104178. doi:10.1016/j.eti.2025.104178
Chen, H., Wang, C., Lv, Z., Zhong, Y., Ren, Q., Ren, J., et al. (2025b). Long-term water quality dynamics and influencing factors under ecological compensation mechanisms: a case study of China's first cross-provincial ecological compensation watershed. J. Environ. Manag. 380, 125142. doi:10.1016/j.jenvman.2025.125142
Cheng, Y., Wu, D., and Bian, Y. (2020). A systematic approach of determining compensation and allocation for river basin water environment based on total pollutants control. J. Environ. Manag. 271, 110896. doi:10.1016/j.jenvman.2020.110896
Du, L., Dong, C., Kang, X., Qian, X., and Gu, L. (2023). Spatiotemporal evolution of land cover changes and landscape ecological risk assessment in the yellow river Basin, 2015–2020. J. Environ. Manag. 332, 117149. doi:10.1016/j.jenvman.2022.117149
Du, Z., Yu, L., Chen, X., Gao, B., Yang, J., Fu, H., et al. (2024). Land use/cover and land degradation across the Eurasian steppe: dynamics, patterns and driving factors. Sci. Total Environ. 909, 168593. doi:10.1016/j.scitotenv.2023.168593
Forey, E., Lortie, C. J., and Michalet, R. (2009). Spatial patterns of association at local and regional scales in coastal sand dune communities. J. Veg. Sci. 20 (5), 916–925. doi:10.1111/j.1654-1103.2009.01095.x
Fu, J., Bu, Z., Jiang, D., Lin, G., and Li, X. (2022). Sustainable land use diagnosis based on the perspective of production–living–ecological spaces in China. Land Use Policy 122, 106386. doi:10.1016/j.landusepol.2022.106386
Fu, L., Ren, Y., Lu, L., and Chen, H. (2022). Relationship between ecosystem services and rural residential well-being in the Xin’an river basin, China. Ecol. Indic. 140, 108997. doi:10.1016/j.ecolind.2022.108997
Gong, P., Wang, J., Yu, L., Zhao, Y., Zhao, Y., Liang, L., et al. (2013). Finer resolution observation and monitoring of global land cover: first mapping results with landsat TM and ETM+ data. Int. J. Remote Sens. 34 (7), 2607–2654. doi:10.1080/01431161.2012.748992
Huang, H., Wang, J., Liu, C., Liang, L., Li, C., and Gong, P. (2020). The migration of training samples towards dynamic global land cover mapping. ISPRS J. Photogrammetry Remote Sens. 161, 27–36. doi:10.1016/j.isprsjprs.2020.01.010
Jiang, X., Zhai, S., Liu, H., Chen, J., Zhu, Y., and Wang, Z. (2022). Multi-scenario simulation of production-living-ecological space and ecological effects based on shared socioeconomic pathways in zhengzhou, China. Ecol. Indic. 137, 108750. doi:10.1016/j.ecolind.2022.108750
Jin, X., Jin, Y., and Mao, X. (2019). Ecological risk assessment of cities on the Tibetan Plateau based on land use/land cover changes – case study of delingha city. Ecol. Indic. 101, 185–191. doi:10.1016/j.ecolind.2018.12.050
Kang, Y., Chen, Z., Li, L., and Zhang, Q. (2023). Construction of multidimensional features to identify tea plantations using multisource remote sensing data: a case study of hangzhou city, China. Ecol. Inf. 77, 102185. doi:10.1016/j.ecoinf.2023.102185
Karimian, H., Zou, W., Chen, Y., Xia, J., and Wang, Z. (2022). Landscape ecological risk assessment and driving factor analysis in dongjiang river watershed. Chemosphere 307, 135835. doi:10.1016/j.chemosphere.2022.135835
Keshtkar, M., Mobarghaee, N., Sayahnia, R., and Asadolahi, Z. (2023). Landscape ecological security response to urban growth in southern zagros biome, Iran. Ecol. Indic. 154, 110577. doi:10.1016/j.ecolind.2023.110577
Kuang, W., Du, G., Lu, D., Dou, Y., Li, X., Zhang, S., et al. (2021). Global observation of urban expansion and land-cover dynamics using satellite big-data. Sci. Bull. 66 (4), 297–300. doi:10.1016/j.scib.2020.10.022
Leuven, R. S. E. W., and Poudevigne, I. (2002). Riverine landscape dynamics and ecological risk assessment. Freshw. Biol. 47 (4), 845–865. doi:10.1046/j.1365-2427.2002.00918.x
Li, M., Pan, T., and Chen, Q. (2021). Estimation of tea quality grade using statistical identification of key variables. Food control. 119, 107485. doi:10.1016/j.foodcont.2020.107485
Li, H., Mao, D., Li, X., Wang, Z., Jia, M., Huang, X., et al. (2022). Understanding the contrasting effects of policy-driven ecosystem conservation projects in northeastern China. Ecol. Indic. 135, 108578. doi:10.1016/j.ecolind.2022.108578
Li, T., Qi, Y., Chen, M., and Cao, J. (2023). Balancing crop security and sustainable cropland use: policy lessons from the watershed ecosystem service payments in Xin’an river, China. Econ. Analysis Policy 80, 861–879. doi:10.1016/j.eap.2023.09.029
Li, F., Wu, S., Liu, H., and Yan, D. (2024). Biodiversity loss through cropland displacement for urban expansion in China. Sci. Total Environ. 907, 167988. doi:10.1016/j.scitotenv.2023.167988
Lin, X., and Wang, Z. (2023). Landscape ecological risk assessment and its driving factors of multi-mountainous city. Ecol. Indic. 146, 109823. doi:10.1016/j.ecolind.2022.109823
Liu, Y., Liu, Y., Li, J., Lu, W., Wei, X., and Sun, C. (2018). Evolution of landscape ecological risk at the optimal scale: a case study of the open coastal wetlands in Jiangsu, China. Int. J. Environ. Res. Public Health 15, 1691. doi:10.3390/ijerph15081691
Liu, C., Wu, X., and Wang, L. (2019). Analysis on land ecological security change and affect factors using RS and GWR in the danjiangkou reservoir area, China. Appl. Geogr. 105, 1–14. doi:10.1016/j.apgeog.2019.02.009
Liu, Y., Liu, X., Zhao, C., Wang, H., and Zang, F. (2023). The trade-offs and synergies of the ecological-production-living functions of grassland in the qilian mountains by ecological priority. J. Environ. Manag. 327, 116883. doi:10.1016/j.jenvman.2022.116883
Man, Y., Du, J., Lian, Z., Wang, Q., and Cui, B. (2024). A framework to quantitatively assess the influence of land use and land cover on coastal wetland hydrological connectivity from a landscape resistance perspective. Sci. Total Environ. 922, 171140. doi:10.1016/j.scitotenv.2024.171140
Mantyka-Pringle, C. S., Visconti, P., Di Marco, M., Martin, T. G., Rondinini, C., and Rhodes, J. R. (2015). Climate change modifies risk of global biodiversity loss due to land-cover change. Biol. Conserv. 187, 103–111. doi:10.1016/j.biocon.2015.04.016
Ren, Y., Lu, L., Zhang, H., Chen, H., and Zhu, D. (2020). Residents’ willingness to pay for ecosystem services and its influencing factors: a study of the Xin’an river basin. J. Clean. Prod. 268, 122301. doi:10.1016/j.jclepro.2020.122301
Shamuxi, A., Han, B., Jin, X., Wusimanjiang, P., Abudukerimu, A., Chen, Q., et al. (2025). Spatial pattern and driving mechanisms of dryland landscape ecological risk: insights from an integrated geographic detector and machine learning model. Ecol. Indic. 172, 113305. doi:10.1016/j.ecolind.2025.113305
Sheng, J., Cheng, Q., and Wu, Y. (2023). Payment for watershed services and the coordination of interests in transboundary rivers: china's Xin'an river basin Eco-compensation pilot. J. Environ. Manag. 328, 116670. doi:10.1016/j.jenvman.2022.116670
Van Asselen, S., and Verburg, P. H. (2013). Land cover change or land-use intensification: simulating land system change with a global-scale land change model. Glob. Change Biol. 19 (12), 3648–3667. doi:10.1111/gcb.12331
Wang, J., Li, X., Christakos, G., Liao, Y., Zhang, T., Gu, X., et al. (2010). Geographical detectors-based health risk assessment and its application in the neural tube defects study of the heshun region, China. Int. J. Geogr. Inf. Sci. 24 (1), 107–127. doi:10.1080/13658810802443457
Wang, L.-J., Luo, G.-Y., Ma, S., Wang, H.-Y., Jiang, J., and Zhang, J.-G. (2023). Integrating landscape ecological risk into ecosystem service value assessment: a case study of nanjing city, China. Ecol. Indic. 154, 110625. doi:10.1016/j.ecolind.2023.110625
Wang, S., Wang, A., Yang, D., Gu, Y., Tang, L., and Sun, X. (2023). Understanding the spatiotemporal variability in nonpoint source nutrient loads and its effect on water quality in the upper Xin’an river basin, eastern China. J. Hydrology 621, 129582. doi:10.1016/j.jhydrol.2023.129582
Wang, J., Wang, J., and Zhang, J. (2025). Optimization of landscape ecological risk assessment method and ecological management zoning considering resilience. J. Environ. Manag. 376, 124586. doi:10.1016/j.jenvman.2025.124586
Wang, X., Zhu, T., and Jiang, C. (2025). Landscape ecological risk based on optimal scale and its tradeoff/synergy with human activities: a case study of the nanjing metropolitan area, China. Ecol. Indic. 170, 113040. doi:10.1016/j.ecolind.2024.113040
Xiong, Y., Xu, W., Lu, N., Huang, S., Wu, C., Wang, L., et al. (2021). Assessment of spatial–temporal changes of ecological environment quality based on RSEI and GEE: a case study in erhai Lake basin, Yunnan province, China. Ecol. Indic. 125, 107518. doi:10.1016/j.ecolind.2021.107518
Yang, J., and Huang, X. (2021). The 30 m annual land cover dataset and its dynamics in China from 1990 to 2019. Earth Syst. Sci. Data 13 (8), 3907–3925. doi:10.5194/essd-13-3907-2021
Yang, N., Zhang, T., Li, J., Feng, P., and Yang, N. (2024). Landscape ecological risk assessment and driving factors analysis based on optimal spatial scales in luan river basin, China. Ecol. Indic. 169, 112821. doi:10.1016/j.ecolind.2024.112821
Yu, H., Chen, C., and Shao, C. (2023). Spatial and temporal changes in ecosystem service driven by ecological compensation in the Xin'an river basin, China. Ecol. Indic. 146, 109798. doi:10.1016/j.ecolind.2022.109798
Zeng, J., Wu, J., and Chen, W. (2024). Coupling analysis of land use change with landscape ecological risk in China: a multi-scenario simulation perspective. J. Clean. Prod. 435, 140518. doi:10.1016/j.jclepro.2023.140518
Zhai, J., Xiao, C., Feng, Z., and Liu, Y. (2023). Are there suitable global datasets for monitoring of land use and land cover in the tropics? Evidences from mainland southeast Asia. Glob. Planet. Change 229, 104233. doi:10.1016/j.gloplacha.2023.104233
Zhang, W., Chang, W. J., Zhu, Z. C., and Hui, Z. (2020). Landscape ecological risk assessment of Chinese coastal cities based on land use change. Appl. Geogr. 117, 102174. doi:10.1016/j.apgeog.2020.102174
Zhang, N., Yuan, R., Jarvie, S., and Zhang, Q. (2023). Landscape ecological risk of China's nature reserves declined over the past 30 years. Ecol. Indic. 156, 111155. doi:10.1016/j.ecolind.2023.111155
Zhong, J., Liu, Y., Li, J., Tian, P., Zhang, H., and Ying, C. (2023). Difference and consistency of multi-sources land cover products in global large river estuaries. Ocean and Coast. Manag. 244, 106803. doi:10.1016/j.ocecoaman.2023.106803
Zhou, X.-Y., Lei, K., and Meng, W. (2017). An approach of habitat degradation assessment for characterization on coastal habitat conservation tendency. Sci. Total Environ. 593-594, 618–623. doi:10.1016/j.scitotenv.2017.03.212
Keywords: xin’an river basin, land use changes, landscape ecological risk, driving factors, ecological compensation watershed
Citation: Chen H, Ren J, Ren W, Luan H and Luo L (2025) Land use change patterns and landscape ecological risk assessment in the process of watershed ecological compensation. Front. Environ. Sci. 13:1723453. doi: 10.3389/fenvs.2025.1723453
Received: 12 October 2025; Accepted: 20 November 2025;
Published: 11 December 2025.
Edited by:
Enxiang Cai, Henan Agricultural University, ChinaCopyright © 2025 Chen, Ren, Ren, Luan and Luo. This is an open-access article distributed under the terms of the Creative Commons Attribution License (CC BY). The use, distribution or reproduction in other forums is permitted, provided the original author(s) and the copyright owner(s) are credited and that the original publication in this journal is cited, in accordance with accepted academic practice. No use, distribution or reproduction is permitted which does not comply with these terms.
*Correspondence: Hui Luan, bml0aHVpQDE2My5jb20=; Liancong Luo, bGxjQGp1d3AuZWR1LmNu