 Jian Gao1,2,3
 Zejing Qiu
 Yue Sun
- 1State Grid Dianyi Digital Technology (XiongAn) Co., Ltd., Hebei, China
- 2State Grid Digital Technology Holding Co., Ltd., Hebei, China
- 3China State Gri Xiongan Financial Technology Group Co., Ltd., Beijing, China
- 4State Grid Electric Power Research Institute /Nari Group Corporation, Nanjing, China
- 5State Grid Electric Power Research Institute Wuhan Efficiency Evaluation Company Limited, Wuhan, China
- 6China Center for Energy Economics Research, School of Economics, Xiamen University, Xiamen, China
- 7Fujian Province Key Laboratory of Philosophy and Social Science for Energy Economics and Green Smart Development, Xiamen University, Xiamen, China
During China’s industrialization, its development zones encountered issues of environmental pollution and resource depletion while fostering economic growth. For this reason, the Chinese government encouraged the establishment of national eco-industrial demonstration parks (NEDP). Based on data from 211 Chinese cities with National Development Zones from 2003 to 2020, this article uses the construction of NEDP as the research entry point to study the role of self-regulated environmental policies on the marginal abatement cost (MAC) of CO2. The multi-period DID method is used for the analysis. We find that the NEDP policy plays a key role in significantly reducing the MAC of CO2 in urban areas. The NEDP policy affects cities’ MAC of CO2 through green innovation and carbon intensity effects. Although the latter offsets part of the reduction, the former dominates, resulting in a significant overall decrease in marginal abatement costs. However, the policy’s effects exhibit some delay. The impact of the NEDP policy varies across cities, primarily influenced by the policy’s intensity and the timing of the parks’ establishment. Multiple demonstration parks and parks established at an early stage see greater reductions in abatement costs. On the other hand, single parks or those developed at later stages do not lead to a significant reduction in abatement costs and may, in fact, cause an increase in costs due to the carbon intensity effect. The policy implications suggest that the government should accelerate park transformation and promote multiple demonstration parks to maximize emission reduction benefits. Encouraging resource sharing between parks and advancing green technology innovation can strengthen the validity of voluntary environmental regulation. Additionally, the government should refine park construction strategies, adopting differentiated policies, especially for late-stage parks, and support green technology innovation to avoid rising emission reduction costs due to technological constraints.
1 Introduction
Carbon dioxide (CO2) in the atmosphere is the most significant anthropogenic greenhouse gas, primarily responsible for climate change. Its increased concentration, mainly from human activities, leads to global warming and environmental disruptions (Pörtner et al., 2022). The substantial increase in CO2 over the past decade can be attributed to historically high emissions from fossil fuels during the 2010s and 2020s. This is despite the fact that the growth of fossil fuel carbon emissions has slowed down over the past decade compared to the 2000s, emissions remain at elevated levels. As a result, the period from 2014 to 2023 shows the highest average decadal growth rate of atmospheric carbon dioxide on record.
In response to the serious environmental problem of global warming, carbon reduction has become a global consensus. China ranks as the top emitter of carbon globally, therefore, it shoulders a major mission to slow down the warming problem and reduce greenhouse gas emissions (Dong et al., 2023). To this end, China has set a dual carbon target for this purpose. This requires that all regions in China, during the process of promoting low-carbon transformation, need to not only reduce carbon emission intensity through regulatory measures, but also bear certain economic costs for controlling and reducing carbon dioxide emissions (Yu et al., 2023a). Given its significant contribution to total energy use, the industrial sector plays a key role in emission reduction. Improving energy efficiency and adopting cleaner technologies are essential for meeting China’s climate goals (Bao et al., 2008).
China is a country with rapid industrialization. Therefore, contemporary social development should focus more on fostering the harmonious development of economic growth and environmental sustainability, as both are essential for sustainable development and long-term prosperity in the face of growing environmental concerns. Against this background, China has carried out circular economy pilots in areas including national economic and technological development regions, as well as high-tech industrial parks to build national eco-industrial demonstration parks (NEDP). In the form of a government-led voluntary environmental regulation, the establishment of NEDP is a key initiative for promoting the circular economy in regions with a high concentration of industrial enterprises. The primary goal of China’s development zones was originally to stimulate economic growth and promote local economic development and restructuring of the industrial system through the introduction of foreign and domestic investment and the promotion of rapid industrialization (Zhou et al., 2018). The formation of state-level development zones has undoubtedly led to the agglomeration of enterprises and the formation of many industrial clusters, which has strengthened the development capacity of enterprises through the agglomeration effect. It has a good contribution to the development of regional economic construction (Zheng et al., 2008). From a theoretical perspective, the positive environmental externalities of industrial agglomeration should far outweigh its negative externalities. However, from a realistic point of view, as economic development enters a new stage, the traditional mode of development zones is gradually exposed to environmental pollution, waste of resources and other problems, and urgently needs to be transformed and upgraded (Wang and Nie, 2016).
In this process, eco-industrial demonstration parks came into being and became an important exploration of a new regional economic development model. In 2003, the “Regulations on the Declaration, Naming and Management of National Eco-Industrial Demonstration Parks (for Trial Implementation)” was formally issued, which marked that the construction of NEDP entered into a preliminary exploration stage. In 2007, the relevant Chinese governmental departments further promulgated “the Circular on the Development of National Eco-Industrial Demonstration Parks”. The approval and construction of the NEDP then entered a fast lane. Unlike command-and-control or market-based environmental regulations, NEDPs are a government-led, voluntary form of environmental regulation. After voluntary applications for construction are submitted by development zone management committees or local governments, the Ministry of Environmental Protection is tasked with approving, reviewing, naming, conducting regular evaluations, and overseeing the parks. This strict approval system sets high entry requirements for applicants. Parks with stronger economic foundations and existing ecological industry infrastructure are more likely to succeed in the application process. As a result, only national or provincial development zones with a certain foundation will apply for a NEDP and receive government approval for construction. The development of the NEDP is illustrated in Figure 1. By the end of 2020, 93 parks in China have completed or were in the process of building NEDPs, with policies radiating to 49 cities in China. The construction of new economic development zones is not just a continuation and expansion of the traditional development zone model, but also a significant shift towards more efficient, green, and sustainable development. The goal is to foster an industrial system that recycles waste and reduces energy consumption through the strategic development of circular economy value chains and the development of eco-friendly industrial systems. This approach can effectively change the model of economic development in a more intensive and cleaner direction. In addition, it can effectively alleviate the pressure of resource scarcity and environmental protection on regional development and creates a model of an industrial park that conforms to the ecologically sustainable development. It has been shown that the NEDPs work well in facilitating economic performance of the host region (Tian et al., 2014; Yu et al., 2015) and foreign direct investment (Hua and Tan, 2022). In addition, some academics have studied the environmental benefits of these environmental regulations, and this impact has included analysis of the release of greenhouse gases (Qian et al., 2022; Cao et al., 2022; Chen et al., 2023) and sulfur compounds (Cao et al., 2022; Chen et al., 2023). Moreover, the role of environmental regulations in increasing green total factor productivity in cities (Liu et al., 2022), total factor energy efficiency (Zhang et al., 2023), and eco-efficiency (Liu et al., 2015) has been explored by some researchers from the perspective of efficiency. Although existing studies on voluntary environmental regulation have examined its effects on both firms’ financial performance and environmental behavior (Alnafrah et al., 2024; Piekkola and Rahko, 2024; Bokor, 2024), research focusing specifically on environmental behavior remains limited, with insufficient attention paid to developing countries. Furthermore, considering that scholars, when studying the carbon reduction effect of environmental regulations, mostly focus on carbon emission intensity and carbon emission efficiency, while neglecting to analyze its impact from the perspective of cost-benefit (David and Sinclair-Desgagné, 2005; Yu et al., 2023b), the relationship between the magnitude of marginal emission reduction cost and carbon price determines the willingness of enterprises to reduce emissions (Baumol and Oates, 1988). Therefore, there is an urgent need to examine whether self-imposed environmental regulation has an influence on MAC in the city-level dimension. Based on this, we explore the impact of voluntary environmental regulatory policies on the regional MAC represented by the NEDP, which is the main objective of this paper. This paper seeks to address the following questions: First, in the setting of China, can the NEDP pilot projects encourage enterprises to focus on emission reduction, thereby lowering the regional MAC? Second, by what means does NEDP implementation impact regional MAC? Finally, what are the factors that influence the effectiveness of a city’s MAC? Exploring these questions will contribute to improving research on voluntary environmental regulation, encouraging businesses to better adapt to such policies, and ultimately achieving both sustainable development and environmental protection goals.

Figure 1. Total quantity change trend.
On this basis, this paper utilizes data from 211 Chinese cities with national development zones from 2003 to 2020 and the multi-period DID method to analyze how NEDP construction affects the city’s MAC, aiming to enrich the related research on voluntary environmental regulation. The following are some possible contributions of this paper: First, existing studies on marginal abatement costs have mainly focused on their measurement and estimation, while relatively few have examined the factors that influence them. Moreover, empirical evidence on how environmental regulation affects urban marginal abatement costs remains limited. This study examines the impact of the NEDP policy from the perspective of voluntary environmental regulation, thereby enriching the empirical evidence on the determinants of cities’ marginal abatement costs. Second, unlike other forms of voluntary environmental regulation, the NEDP policy represents a government-led, systematic, and cluster-oriented approach. Analyzing this policy helps to provide a more comprehensive understanding of the mechanisms and practical effects of voluntary environmental regulation in promoting urban green development. Third, this study explores the pathways through which voluntary environmental regulation affects urban marginal abatement costs and identifies the distinct effects of two mechanisms. The findings offer useful insights for governments to design and coordinate different types of environmental regulation more precisely, to promote green innovation, avoid cost increases caused by the carbon intensity effect, and enhance the overall efficiency and synergy of policy implementation.
Next up in this article are these: first the paper will conduct a literature review and formulate hypotheses based on it in Section 2. In Section 3, the paper will construct the multi-period DID model, describe the selection of variables and explains the sources of data. In the next Section, a data-driven analysis is conducted on the impact of the NEDP pilot policy on regional MAC, accompanied by robustness checks to validate the findings. In Section 5, the mechanism of the impact is examined. Also, we will further explore the heterogeneous effect of this policy on regional MAC in Section 6. In Section 7, we present the key conclusions derived from the study and provide an in-depth discussion of the policy implications informed by the empirical results and their broader significance.
2 Literature review and hypothesis development
Prior to analyzing the influence of NEDP on marginal abatement costs, it is essential to first calculate these costs. The marginal abatement cost (MAC) of CO2 resents the cost per unit of CO2 emission reduction, considering the current production technology (Cheng et al., 2022). In recent years, numerous scholars have undertaken its measurement and analyzed the MAC of CO2 using various modeling methods. Using the CGE model, Gernot Klepper et al. developed the MAC curve and discovered that the prices of fossil fuels influence the shape of the marginal abatement cost curve (Klepper and Peterson, 2006). Färe et al. proposed the use of the Shephard Distance Function and applying the duality theory to measure the shadow price of undesired output (Färe et al., 1993). This method allows researchers to calculate the incremental cost of unintended outputs despite the lack of cost information. Given that CO2 can be considered as a non-expected output, this paper further improves on the study by Färe et al. We use the DDF-SFA (Directional Distance Function and Stochastic Frontier Analysis) method to further measure the marginal MAC of CO2. This method combines the advantages of Dynamic Distance Function (DDF) and Stochastic Frontier Analysis (SFA), and is able to provide a more accurate estimate of abatement costs while taking into account time series data and technology heterogeneity.
Moreover, it has been shown that the MAC curve of carbon dioxide has a U-shaped curve (Cheng et al., 2022; Du et al., 2015). Due to the economies of scale, in the early phase of emissions mitigation, the MAC will decrease as the carbon intensity decreases. Nevertheless, as the emission reduction process gradually reaches a bottleneck, it is becoming increasingly difficult to reduce carbon emissions per unit, and the cost required becomes larger, therefore, as the carbon intensity decreases, the MAC will gradually increase (Xu et al., 2022). The research on NEDP shows that promoting the construction of NEDP can be effective in minimizing CO2 emissions (Hua and Ye, 2023) and carbon intensity (Nie et al., 2022) in the pilot area, and improve CO2 emissions, in terms of efficiency (Ji et al., 2024). Existing studies indicate that voluntary environmental regulation can, to some extent, compensate for the limitations of formal government supervision, demonstrating considerable flexibility and regulatory effectiveness (Arimura et al., 2019). Moreover, such regulatory mechanisms contribute to enhancing firms’ environmental management capabilities and internal governance, thereby improving their overall performance (Lajmi et al., 2025). On this basis, research hypotheses 1 and hypotheses 2 are formulated in this paper.
Hypothesis 1. The NEDP policy will affect the regional MAC.
Hypothesis 2. The NEDP policy will affect the MAC by affecting regional carbon intensity.
The updating of technology directly affects the MAC curve of CO2. Technological innovation or learning effect can reduce the cost of certain abatement technologies, which shifts the MAC curve to the left (Rekker et al., 2023). As carbon intensity decreases, so does the MAC in the role of technological creativity. In the construction of the NEDP, government departments also focus on the importance of the park to enable the widespread use of low-carbon technologies and the translation of innovations. Also, government points out that they should make full use of the think tank of the demonstration park to carry out energy substitution technology, process carbon reduction, and other technologies, and promote the industrialization of low-carbon technology. In the Guiding Opinions on Strengthening the Construction of National Eco-Industrial Demonstration Parks issued in 2011, it was explicitly stipulated that national eco-industrial demonstration parks characterized by circular or end-of-pipe industries should prioritize the improvement of waste recycling and detoxification technologies, as well as the innovation of pollution control technologies. These policy directives have compelled enterprises within the parks to engage in targeted technological innovation, thereby promoting regional transitions toward low-carbon and cleaner production technologies, thus changing the MAC curve of carbon dioxide. Therefore, this paper sets forth the third hypothesis of this study.
Hypothesis 3. The NEDP policy will affect the MAC by influencing green technology innovation.
3 Research methodology and data origins
3.1 Baseline regression model
Since the parks were approved for construction at different times, a multi-period DID model is employed to evaluate the effect of NEDPs on the MAC in urban regions. The multi-period DID method is a widely utilized approach for assessing policy impacts and measuring their effectiveness. This model assumes that the policy only affects areas where the policy is implemented, then trends between implemented and non-implemented areas are expected to diverge after the policy is implemented, while staying consistent prior to the policy implementation. The multi-period DID approach quantifies the causal effects of a policy by assessing the variations in effects between treatment and control groups pre- and post-policy is implemented at different points in time. Specifically, we compare the change in MAC between cities that have undertaken a demonstration park and those that have not before and after policy implementation. By analyzing this difference, we assess the impact of NEDP construction as a form of voluntary environmental regulation. The baseline model applied in this evaluation is presented below:
Where,
3.2 Construction of variables
3.2.1 Explained variable
We adopt the DDF-SFA methodology to measure the MAC of urban CO2. In the production process, the production entity wants to obtain more target output y and less unintended output b under an certain input x. This suggests the need to incorporate the direction vector in the construction of the directional distance function (DDF). Drawing on the research methodology of Chung et al. (1997), the DDF is as shown in Equation 2.
where
where
Equation 3 shows that the estimation of DDF process needs to satisfy the differentiability condition. The nonparametric estimation method does not satisfy the differentiability, so this paper chooses the parametric method for estimation. Because the estimation process, need to use the DDF convertibility and differentiability, this paper chooses the quadratic function for estimation, the function form is given by the Equation 4:
The translatability of the DDF is expressed as Equation 5.
Adding a random error term to a quadratic DDF
This equation is the basic expression for SFA estimation. By making
In Equation 7, there are m types of input factors,
Using the aforementioned methodology, we calculate the marginal abatement cost of CO2 for 211 cities in China. Furthermore, we divide the sample into a control group and an experimental group, calculate their annual average values respectively, and the results are presented in Figure 2. Our preliminary findings indicate that the marginal abatement cost of the experimental group is lower compared to that of the control group. This also indirectly suggests that the NEDP policy may be capable of reducing the marginal abatement cost of enterprises, and the specific results and mechanism of action require further investigation on our part.
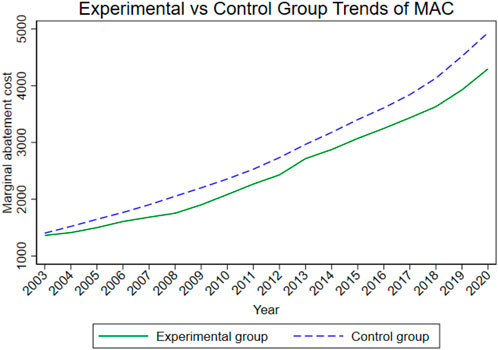
Figure 2. Time trend of MAC between the experimental group and the control group.
3.2.2 Policy variable
The binary indicator is employed to represent whether the policy is performed in the model. Taking the existence of parks approved to carry out construction in a city as a criterion, if there is a park approved for construction in city i in year t, then
3.2.3 Control variables
Control variables that might affect the city’s MAC are also included in the analysis. The following specific variables are included in the model: (1) population density (density): used the logarithm of the number of people per square kilometer as population density; (2) per capita Gross Domestic Product (pgdp): measured as the natural logarithm of the actual per capita GDP for each city; (3) foreign direct investment (fdi): expressed as the natural logarithm of the actual foreign direct investment utilized within the city; (4) urbanization rate (urban): calculated the ratio of the resident urban population to the total resident population of the area as the urbanization rate.
3.3 Data
The research sample in this paper spans from 2003 to 2020, covering 211 cities with national development zones. This represents 72% of all cities in China. In the time span studied, a total of 49 cities were approved to establish NEDPs, which serve as the treatment group in the study. The remaining 162 municipalities do not have approved NEDPs and therefore constitute the control group for this study. This study focuses only on prefecture-level cities with national-level development zones, some of which are excluded from the analysis to keep the treatment and control groups as consistent as possible at the initial stage, thus reducing potential bias due to sample selection. We find the sample cities selected for this paper from the “Catalog of China’s Development Zones Audit Bulletin (2018 Edition)”. The information on NEDPs is gathered from the 2017 government document “List of National Eco-Industrial Demonstration Parks” and other relevant audit documents.
Among them, we extract CO2 data in the Emissions Database for Global Atmospheric Research (EDGAR), and the values for other variables are gathered from the China Urban Statistical Yearbook, with some gaps in the data are filled in through the corresponding data in the statistical yearbooks published by each city. Table 1 displays the symbolic representations and detailed meanings of the other variables. Meanwhile, Table 2 outlines the summary statistics for the variables studied.

Table 1. Overview of the variables.

Table 2. Summary statistics.
4 Regression results
4.1 Benchmark regression analysis
Table 3 illustrates the results from the benchmark regression. In particular, columns (1) and (2) illustrate the effect of NEDP on the MAC of CO2, excluding the inclusion of city and time fixed effects. Going a step further, column (3) builds on the analysis in column (1) by fixing the city and year, thus accounting for the potential impact of common shocks on cross-sectional variation. In column (4), additional city-level representation variables are introduced for a more comprehensive examination. The findings across columns (1) through (4) consistently indicate that voluntary environmental regulations, such as the NEDP, contribute significantly to the reduction of the MAC of CO2 emissions. In particular, the regression coefficient in column (4) is −0.048, implying that NEDP approval lowers the MAC by 4.8%. This finding supports Hypothesis 1, demonstrating that the policy effectively amplifies the impact of green technology advancements, surpassing the effect of carbon intensity. A deeper exploration of this mechanism will be presented in the subsequent section.

Table 3. Regression results of NEDP policy on MAC.
4.2 Parallel trend test
For causal inferences based on the multi-period DID approach to be valid, the parallel trend assumption must be met. That is, there should not be a significant difference in MAC between the treatment and control groups prior to the implementation of the NEDP. To test this assumption, a parallel trends test was conducted using the event study approach proposed by Jacobson et al. (Jacobson et al., 1993). The analytical framework for this method is outlined as Equation 8.
Where

Figure 3. Parallel trend test.
4.3 Robustness tests
4.3.1 Placebo test
To address potential confounding due to omitted variables in the regression results, a placebo test was conducted. This test helps eliminate the possibility of unobserved factors influencing the findings and ensures that the shocks in the demonstration areas were not randomly assigned (Li et al., 2016). We repeat the test 500 times and obtained placebo test results as shown in Figure 4. The results clearly show that the distribution is essentially normal. The coefficients are mainly concentrated around 0, which is significantly different from the baseline value of −0.048, suggesting that the impact of NEDP on MAC remains unaffected by other unmeasured variables, confirming the stability of the results.
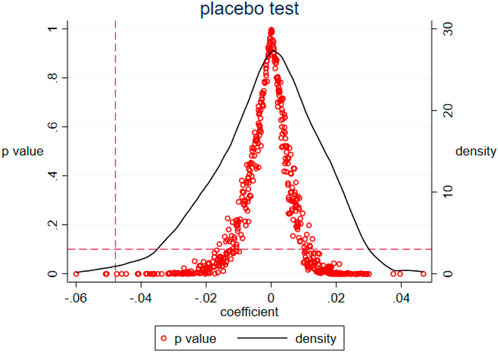
Figure 4. Placebo test.
4.3.2 Winsorize treatment
Potential outliers may have unintended effects on study results, so we use the quartile substitution method by replacing the lowest and highest 1% (or 5%) of the data points in the MAC to prevent extreme values from having an undue influence on the model’s estimation. Columns (1) and (2) of Table 4 detail the coefficients and significance of the regressions. The results show that replacing the data with the values of the 1% and 5% quartiles does not significantly change the magnitude or sign of the coefficients. This implies that the primary findings hold up under scrutiny.
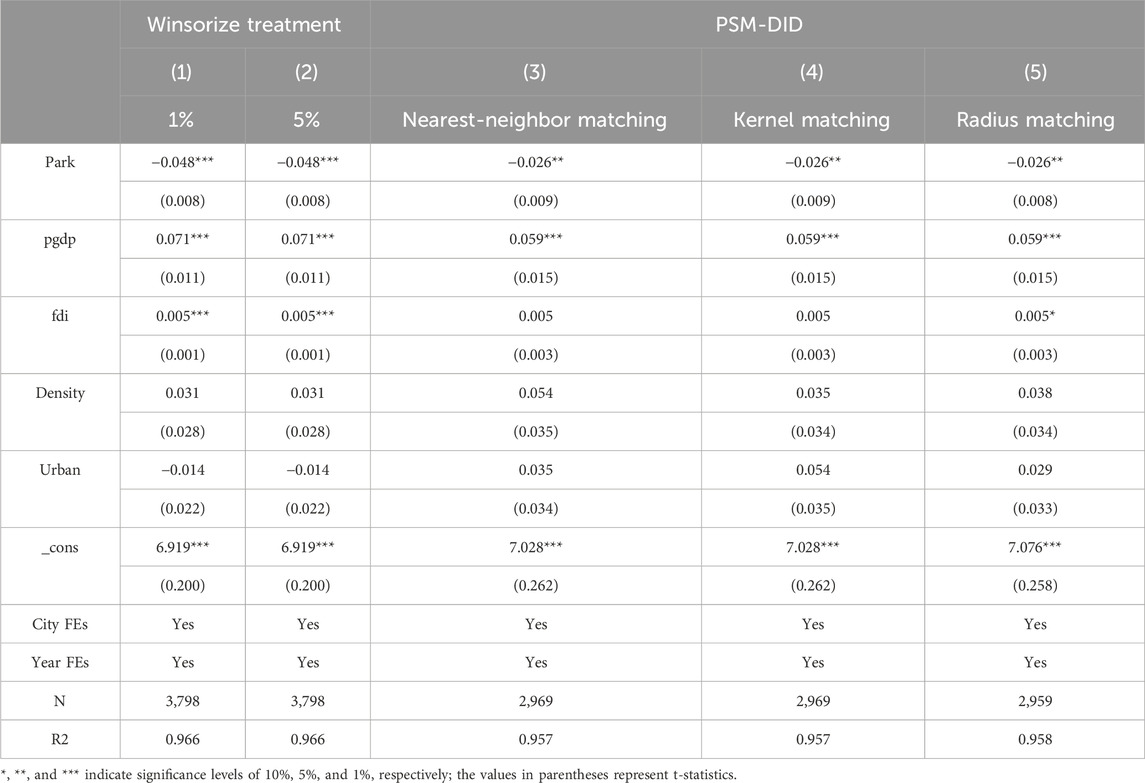
Table 4. Results of two robustness tests.
4.3.3 PSM-DID
When using the multi-period DID model for analysis, we could not guarantee that the cities in the control and experimental groups have exactly the same characteristics. In addition, estimation bias may be attributed by systematic differences between pilot cities and other cities. We introduced the PSM-DID methodology to address this issue in order to eliminate potential bias. Considering differences between cities, we introduce city control variables and apply the PSM method to match control group cities that closely resemble those in the treatment group (i.e., cities with NEDP implementation). Table 4 demonstrates the regression results of the PSM-DID method, with columns (3), (4), and (5) representing the outcomes of the 1:1 nearest neighbor matching, kernel matching, and radius matching techniques, respectively. The regression coefficients for all methods pass the test at the 5% significance level, reinforcing the robustness of the findings. Therefore, the implementation of NEDP indeed decreases the MAC of cities.
5 Mechanism analysis
Based on Hypotheses 2 and Hypotheses 3, the following Equation 9 is developed for detailed analysis determined by the effect of NEDP on the extent of green innovation and regional carbon intensity:
Where

Table 5. Mechanism analysis.
6 Heterogeneity analysis
6.1 Policy intensity
In our study sample, there are some cities with multiple ongoing or completed NEDPs. In general, the difference in the number of demonstration parks a city has reflects the difference in policy intensity and construction goals. In the case of multi-park cities, the local government seeks to strengthen environmental regulations and build a clean city through the construction of multiple demonstration parks. For single-park cities, the motives for setting up the parks are more diverse, which may be to meet environmental requirements, to highlight the performance of officials, to follow the example of neighboring cities, and so on. Based on this, this paper further breaks down the research sample. Referring to the study by Kong et al., we categorized the cities into those with a single demonstration park, cities with two demonstration parks, and cities with three or more demonstration parks, and regressed them one by one (Kong and Chai, 2021). The regression estimates, displayed in first three columns of Table 6, reveal that NEDP construction has an impact on the City’s MAC with a coefficient of 0.061. It indicates that cities with one demonstration park are more difficult to break through the carbon intensity effect, which will make the city’s MAC increase rather than decrease. This indicates that cities with only a single NEDP exhibit insufficient innovation effects and still rely primarily on reducing carbon intensity to achieve emission reduction. Although this approach contributes to lowering carbon emissions, it entails relatively high marginal abatement costs. The impact coefficient of cities with three or more parks on MAC is −0.063, indicating that as the number of demonstration parks in a city increases, the marginal abatement cost of CO2 is more strongly suppressed. This result supports the conclusions of Qian et al. that cities with multiple demonstration parks benefit more from this policy compared to cities with a single demonstration park (Qian et al., 2022). Therefore, cities should vigorously promote the transformation of national development zones into NEDPs.

Table 6. Heterogeneity analysis.
6.2 Time of establishment of the park
The impact of the construction of NEDPs on MAC may vary with the timing of the establishment of the park. Compared to parks built first, those built later will face stronger pressure to reduce emissions, and their related technological bottlenecks will be more difficult to break through. Consequently, this paper categorizes the study sample into two different phases based on when the parks were established: the first stage spanning 2003 to 2009, and the second covering 2010 to 2020, for a more detailed analysis. The choice of 2009 as the time point is based on the following considerations: first, as shown in Figure 1, the number of NEDPs increased dramatically around 2009; second, in 2009, the Ministry of Environmental Protection (MEP) issued “The Notice on Strengthening the Development of Low-Carbon Economy in National Eco-Industrial Demonstration Parks”. In this notification, the government introduced the concept of aligning NEDP construction with low-carbon objectives for the first time. This shift likely resulted in notable variations in the carbon reduction motivations and behaviors across different groups of parks. Regressing the samples of the two batches, the study’s findings are presented in the final two columns of Table 6. Although the construction of both batches of parks had an impact on MAC, the effects were completely opposite. This may be because the earlier-established parks have undergone longer periods of development and have already accumulated more mature green innovation technologies. In such cases, the green innovation effect outweighs the carbon intensity effect, leading to a significant reduction in marginal abatement costs. In contrast, parks established in more recent years are more strongly influenced by the carbon intensity effect, whereby park construction tends to increase marginal abatement costs. This suggests that the implementation and reinforcement of the policy require sufficient time to yield substantial effects.
7 Conclusion and discussion
7.1 Conclusions
The implications of environmental regulations have been widely discussed in academic literature, particularly with regard to how such policies influence various sectors and their overall effectiveness. This paper focuses on voluntary environmental regulations, using the National Eco-Industrial Demonstration Park (NEDP) as an illustrative case. In order to identify the impact of NEDP on the marginal abatement cost (MAC) of urban CO2 emissions, we utilized a dataset of 211 cities with national development zones from 2003 to 2020. Before conducting the benchmark regression in this paper, we first calculate the MAC of urban CO2 emissions using the DDF-SFA method, and then analyze the impacts of NEDP policies on MAC at different stages by using a multi-period DID model. Meanwhile, to guarantee that the result is reliable, we conducted robustness tests and further explored the underlying mechanisms contributing to these effects. Finally, the paper evaluates the heterogeneous impacts of NEDPs on municipal MAC under varying policy intensities and park establishment timelines. The key findings of this study are presented below:
To begin with, carbon emissions’ MAC in urban areas is reduced by NEDP construction. As a voluntary form of environmental regulation, NEDPs encourage firms to prioritize cost-effective emission reductions. Nevertheless, it is crucial to recognize that the impact of NEDPs does not manifest instantly. There is a certain lag before the parks begin to show measurable impacts, as it takes time for parks to meet completion standards and for their influence on MAC to become more pronounced.
Second, the NEDP policy influences cities’ marginal abatement costs primarily through two channels: enhancing urban green innovation and reducing carbon intensity. However, these two channels operate in opposite directions. Overall, the reduction effect of green innovation on marginal abatement costs outweighs the upward effect resulting from the decline in carbon intensity. This also demonstrates the positive role of eco-industrial practices in enhancing the environmental performance of urban areas.
Third, the effectiveness of the NEDP policy in reducing MAC is influenced by both the intensity of the policy and the timing of park establishment. The policy’s inhibitory effect on MAC is most evident in cities with multiple demonstration zones and those with parks that were established early in the process. Conversely, in cities that have only one park or where parks were established at a later time, the NEDP policy not only fails to reduce the MAC, but may even increase it due to the carbon intensity effect.
7.2 Policy suggestions
In light of the results from this research, various recommendations about this policy can be derived to inform the future planning and execution of NEDPs. First, it is essential to accelerate the transformation and construction of parks. Given the increasing global pressure for environmental protection, governments should encourage cities to expedite the conversion of national development zones into NEDPs. This is particularly important in promoting the construction of multiple demonstration parks, as this will enable the realization of emission reduction benefits on a larger scale. By concentrating green technology innovation and facilitating cross-park resource sharing, different parks can support each other, creating synergistic effects that enhance the overall efficiency of emission reduction efforts. At the same time, the NEDP policy should be aligned with other forms of voluntary environmental regulation such as environmental information disclosure, green certification, and corporate social responsibility (CSR) reporting to establish a synergistic policy framework. Through the interaction among these instruments, the policy can further strengthen firms’ incentives for green innovation and enhance environmental governance at the park level, thereby improving the overall effectiveness of voluntary environmental regulation. Moreover, the collective impact of multiple parks can amplify the efficiency of voluntary environmental regulation, pushing enterprises within these parks to accelerate their green transformation. As a result, this could bring about a more significant decrease in MAC of carbon emissions.
Second, optimizing the park construction strategy is crucial for ensuring the success of NEDPs. When developing new demonstration parks, the government should implement customized policies that cater to the unique requirements of each park. These policies should account for factors such as the technological maturity of the park, its stage of development, and the regional variations in carbon intensity. Particularly, the government should implement distinct support strategies for early-stage and late-stage parks. For parks established at a later stage, additional support for green technology innovation is necessary to prevent a rise in emission reduction costs due to technological bottlenecks and the high carbon intensity effect. By offering targeted support, the government can help late-stage parks overcome these challenges and continue to contribute to emission reduction goals.
Finally, it is crucial to strengthen the incentive mechanisms for green innovation. Green technology development is a motivating factor for MAC reduction, and fostering this innovation is key to achieving long-term carbon reduction objectives. To promote corporate investment in green technology development, the government ought to adopt diverse support strategies, such as financial subsidies, tax incentives, and technical assistance. By creating a favorable environment for innovation, the government can stimulate the technological advancements necessary to lower MAC, thereby contributing to China’s broader low-carbon goals. Within this framework, advancing the technological upgrading of parks will be key to China’s successful steps towards a low-carbon economy.
Data availability statement
The raw data supporting the conclusions of this article will be made available by the authors, without undue reservation.
Author contributions
JG: Conceptualization, Data curation, Supervision, Writing – original draft, Writing – review and editing. KW: Formal Analysis, Investigation, Resources, Writing – original draft. FH: Investigation, Project administration, Resources, Writing – original draft. HX: Investigation, Resources, Supervision, Writing – original draft. ZQ: Data curation, Project administration, Visualization, Writing – review and editing. YS: Data curation, Formal Analysis, Methodology, Writing – original draft, Writing – review and editing.
Funding
The authors declare that no financial support was received for the research and/or publication of this article.
Conflict of interest
Authors JG, FH, and HX was employed by State Grid Dianyi Digital Technology (XiongAn) Co., Ltd. Authors JG, FH, and HX was employed by State Grid Digital Technology Holding Co., Ltd. Author JG, FH, and HX was employed by China State Gri Xiongan Financial Technology Group Co., Ltd. Authors KW, and ZQ was employed by State Grid Electric Power Research Institute /Nari Group Corporation. Authors KW, and ZQ was employed by State Grid Electric Power Research Institute Wuhan Efficiency Evaluation Company Limited.
The remaining author declare that the research was conducted in the absence of any commercial or financial relationships that could be construed as a potential conflict of interest.
Generative AI statement
The authors declare that no Generative AI was used in the creation of this manuscript.
Any alternative text (alt text) provided alongside figures in this article has been generated by Frontiers with the support of artificial intelligence and reasonable efforts have been made to ensure accuracy, including review by the authors wherever possible. If you identify any issues, please contact us.
Publisher’s note
All claims expressed in this article are solely those of the authors and do not necessarily represent those of their affiliated organizations, or those of the publisher, the editors and the reviewers. Any product that may be evaluated in this article, or claim that may be made by its manufacturer, is not guaranteed or endorsed by the publisher.
References
Alnafrah, I., Ding, C. J., and Qing, L. (2024). Beyond transparency: unpacking the financial effects of third-party environmental disclosure in China's semiconductor sector. J. Environ. Manag. 360, 121237. doi:10.1016/j.jenvman.2024.121237
Arimura, T. H., Kaneko, S., Managi, S., Shinkuma, T., Yamamoto, M., and Yoshida, Y. (2019). Political economy of voluntary approaches: a lesson from environmental policies in Japan. Econ. Analysis Policy 64, 41–53. doi:10.1016/j.eap.2019.07.003
Bao, J.-Q., Miao, Y., and Chen, F. (2008). Low-carbon economy: A new transformation of human economic development. China Ind. Econ. 04, 153–160. doi:10.19581/j.cnki.ciejournal.2008.04.018
Baumol, W. J., and Oates, W. E. (1988). The theory of environmental policy. 2nd ed. Cambridge: Cambridge University Press.
Bokor, B. (2024). Corporate engagement in mitigating plastic pollution: examining voluntary initiatives and EU regulations. Front. Sustain. 5, 1420041. doi:10.3389/frsus.2024.1420041
Cao, K., Jin, L., Zhu, Y., Nie, Z., and Li, H. (2022). Does china’s national demonstration eco-industrial park reduce carbon dioxide and sulfur dioxide—A study based on the upgrading and transformation process. Int. J. Environ. Res. Public Health 19 (19), 12957. doi:10.3390/ijerph191912957
Chen, S., Tan, Z., Wang, J., Zhang, L., He, X., and Mu, S. (2023). Spatial and temporal evolution of synergizing the reduction of pollution and carbon emissions and examination on comprehensive pilot effects–evidence from the national eco-industrial demonstration parks in China. Environ. Impact Assess. Rev. 101, 107147. doi:10.1016/j.eiar.2023.107147
Cheng, J., Xu, L., Wang, H., Geng, Z., and Wang, Y. (2022). How does the marginal abatement cost of CO2 emissions evolve in Chinese cities? An analysis from the perspective of urban agglomerations. Sustain. Prod. Consum. 32, 147–159. doi:10.1016/j.spc.2022.04.013
Chung, Y. H., Färe, R., and Grosskopf, S. (1997). Productivity and undesirable outputs: a directional distance function approach. J. Environ. Manag. 51 (3), 229–240. doi:10.1006/jema.1997.0146
Danish, U., and Ulucak, R. (2021). Renewable energy, technological innovation and the environment: a novel dynamic auto-regressive distributive lag simulation. Renew. Sustain. Energy Rev. 150, 111433. doi:10.1016/j.rser.2021.111433
David, M., and Sinclair-Desgagné, B. (2005). Environmental regulation and the eco-industry. J. Regul. Econ. 28 (2), 141–155. doi:10.1007/s11149-005-3106-8
Dong, J., Cai, B., Zhang, S., Wang, J., Yue, H., Wang, C., et al. (2023). Closing the gap between carbon neutrality targets and action: technology solutions for China's key energy-intensive sectors. Environ. Sci. Technol. 57 (11), 4396–4405. doi:10.1021/acs.est.2c08171
Du, L., Hanley, A., and Wei, C. (2015). Estimating the marginal abatement cost curve of CO2 emissions in China: provincial panel data analysis. Energy Econ. 48, 217–229. doi:10.1016/j.eneco.2015.01.007
Färe, R., Grosskopf, S., Lovell, C., and Yaisawarng, S. (1993). Derivation of shadow prices for undesirable outputs: a distance function approach. Rev. Econ. Statistics 75 (2), 374–380. doi:10.2307/2109448
Hua, Y., and Tan, X.-Q. (2022). Green location-oriented policies and foreign direct investment: evidence from national eco-industrial demonstration parks. Int. Trade Issues 01, 130–145. doi:10.13510/j.cnki.jit.2022.01.008
Hua, Y., and Ye, Y. (2023). The carbon reduction effect of green location-oriented policies: evidence from national eco-industrial demonstration parks. Quantitative Tech. Econ. Res. 40 (4), 94–112. doi:10.13653/j.cnki.jqte.20230310.003
Jacobson, L. S., LaLonde, R. J., and Sullivan, D. G. (1993). Earnings losses of displaced workers. Am. Econ. Rev. 83 (4), 685–709. Available online at: https://www.jstor.org/stable/2117574.
Ji, Y., Shao, Z., and Wang, R. (2024). Does industrial symbiosis improve carbon emission efficiency? Evidence from Chinese national demonstration eco-industrial parks. Sustainability 16 (2), 828. doi:10.3390/su16020828
Ke, S.-Z., and Xiang, J. (2012). Estimation of urban fixed capital stock in China from 1996 to 2009. Stat. Res. 07, 19–24. doi:10.19343/j.cnki.11-1302/c.2012.07.004
Klepper, G., and Peterson, S. (2006). Marginal abatement cost curves in general equilibrium: the influence of world energy prices. Resour. Energy Econ. 28 (1), 1–23. doi:10.1016/j.reseneeco.2005.04.001
Kong, L., and Chai, Z. (2021). Does upgrading provincial development zones improve urban economic efficiency? — Quasi-experimental evidence from heterogeneous development zones. Manag. World 01, 60–75+5. doi:10.19744/j.cnki.11-1235/f.2021.0005
Lajmi, A., Ben Flah, I., and Shiri, D. (2025). Corporate governance as a moderator of the relationship between environmental regulations and financial performance: evidence from European high-polluting firms. J. Account. Organ. Change, 1–25. doi:10.1108/jaoc-03-2025-0088
Lee, C.-C., and Wang, F. (2022). How does digital inclusive finance affect carbon intensity? Econ. Analysis Policy 75, 174–190. doi:10.1016/j.eap.2022.05.010
Li, P., Lu, Y., and Wang, J. (2016). Does flattening government improve economic performance? Evidence from China. J. Dev. Econ. 123, 18–37. doi:10.1016/j.jdeveco.2016.07.002
Liu, W., Tian, J., Chen, L., Lu, W., and Gao, Y. (2015). Environmental performance analysis of eco-industrial parks in China: a data envelopment analysis approach. J. Industrial Ecol. 19 (6), 1070–1081. doi:10.1111/jiec.12233
Liu, L., Yang, X., Meng, Y., Ran, Q., and Liu, Z. (2022). Does the construction of national eco-industrial demonstration parks improve green total factor productivity? Evidence from prefecture-level cities in China. Sustainability 14 (1), 26. doi:10.3390/su14010026
Nie, X., Wu, J., Wang, H., Li, W., Huang, C., and Li, L. (2022). Contributing to carbon peak: estimating the causal impact of eco-industrial parks on low-carbon development in China. J. Industrial Ecol. 26, 1578–1593. doi:10.1111/jiec.13298
Piekkola, H., and Rahko, J. (2024). The effects of environmental innovations on labor productivity: how does it pay to be green. Econ. Innovation New Technol. 34, 1122–1143. doi:10.1080/10438599.2024.2422082
Pörtner, H.-O., Roberts, D. C., and Tignor, M. (2022). “Intergovernmental panel on climate change (IPCC). Climate change 2022: impacts, adaptation, and vulnerability,” in Contribution of working group II to the sixth assessment report of the intergovernmental panel on climate change (Cambridge, UK and New York, USA: Cambridge University Press).
Qian, L., Xu, X., Sun, Y., and Zhou, Y. (2022). Carbon emission reduction effects of eco-industrial park policy in China. Energy 261 (Part B), 125315. doi:10.1016/j.energy.2022.125315
Rekker, L., Kesina, M., and Mulder, M. (2023). Carbon abatement in the European chemical industry: assessing the feasibility of abatement technologies by estimating firm-level marginal abatement costs. Energy Econ. 126, 106889. doi:10.1016/j.eneco.2023.106889
Tian, J., Liu, W., Lai, B., Li, X., and Chen, L. (2014). Study of the performance of eco-industrial park development in China. J. Clean. Prod. 64, 486–494. doi:10.1016/j.jclepro.2013.08.005
Wang, B., and Nie, X. (2016). Industrial agglomeration and environmental governance: help or hindrance? Evidence from a quasi-natural experiment of the establishment of development zones. China Ind. Econ. 12, 75–89. doi:10.19581/j.cnki.ciejournal.2016.12.006
Xu, L., Yang, J., Cheng, J., and Dong, H. (2022). How has China's low-carbon city pilot policy influenced its CO2 abatement costs? Analysis from the perspective of the shadow price. Energy Econ. 115, 106353. doi:10.1016/j.eneco.2022.106353
Yu, F., Han, F., and Cui, Z. (2015). Evolution of industrial symbiosis in an eco-industrial park in China. J. Clean. Prod. 87, 339–347. doi:10.1016/j.jclepro.2014.10.058
Yu, J., Liu, P., Shi, X., and Ai, X. (2023a). China’s emissions trading scheme, firms’ R&D investment and emissions reduction. Econ. Analysis Policy 80, 1021–1037. doi:10.1016/j.eap.2023.09.039
Yu, J., Liu, P., Fu, D., and Shi, X. (2023b). How do power shortages affect CO2 emission intensity? firm-level evidence from China. Energy 282, 128927. doi:10.1016/j.energy.2023.128927
Zhang, N., Huang, X., and Qi, C. (2022). The effect of environmental regulation on the marginal abatement cost of industrial firms: evidence from the 11th five-year plan in China. Energy Econ. 112, 106147. doi:10.1016/j.eneco.2022.106147
Zhang, B., Yu, L., and Sun, C. (2023). How do the national eco-industrial demonstration parks affect urban total factor energy efficiency? Evidence from a quasi-natural experiment. Energy Econ. 126, 107018. doi:10.1016/j.eneco.2023.107018
Zheng, J.-H., Gao, Y.-Y., and Hu, X.-W. (2008). Enterprise agglomeration, technological upgrading, and economic performance: an empirical analysis of the agglomeration effects in development zones. Econ. Res. 05, 33–46. Available online at: https://erj.ajcass.com/#/issue?id=111737&year=2008&issue=5.
Keywords: national eco-industrial demonstration park, marginal abatement costs, multi-period DID method, voluntary environmental regulation, carbon emission reduction
Citation: Gao J, Wu K, Hong F, Xu H, Qiu Z and Sun Y (2025) Voluntary environmental regulations and their impact on marginal abatement costs: empirical results from the national ecological demonstration park. Front. Environ. Sci. 13:1725903. doi: 10.3389/fenvs.2025.1725903
Received: 15 October 2025; Accepted: 06 November 2025;
Published: 24 November 2025.
Edited by:
Jian Yu, Central University of Finance and Economics, ChinaReviewed by:
Aijun Li, Shandong University, ChinaAilun Wang, Southwestern University of Finance and Economics, China
Copyright © 2025 Gao, Wu, Hong, Xu, Qiu and Sun. This is an open-access article distributed under the terms of the Creative Commons Attribution License (CC BY). The use, distribution or reproduction in other forums is permitted, provided the original author(s) and the copyright owner(s) are credited and that the original publication in this journal is cited, in accordance with accepted academic practice. No use, distribution or reproduction is permitted which does not comply with these terms.
*Correspondence: Yue Sun, c3VueXVlMUBzdHUueG11LmVkdS5jbg==