 Yueping Lin1
 Huihui Zhao
 Runze Zhang
- 1Yunnan Tobacco Company Baoshan Company, Baoshan, China
- 2Research Institute of Aerospace Information, Chinese Academy of Sciences, Beijing, China
- 3Honghe Company, Yunnan Tobacco Company, Mile, Yunnan, China
- 4School of civil engineering and geomatics, Shandong University of Technology, Zibo, Shandong, China
Against the backdrop of global climate change and intensified human activities, drought conditions in Baoshan City, Yunnan Province, have undergone significant transformations. There is a pressing need to systematically elucidate the long-term spatio-temporal dynamics of drought intensity and its spatial distribution patterns in this region. This study employed monthly MODIS data (MOD13A2 and MOD11A2) from 2010 to 2024 to construct Normalized Difference Vegetation Index (NDVI) and Land Surface Temperature (LST) datasets. The Temperature Vegetation Dryness Index (TVDI) was subsequently retrieved. A comprehensive analysis integrating time-series analysis, centroid analysis, and the geographical detector method was conducted to investigate the spatio-temporal evolution characteristics of drought and its driving factors. (1) Drought exhibited significant spatial heterogeneity, with moderate and severe drought being the predominant types, collectively accounting for 81.45% of the study area. (2) The interannual TVDI showed a slight upward trend (slope = 0.0004 a-1), while the intra-annual variation followed a “high in winter and spring, low in summer and autumn” pattern. The mean winter TVDI (0.9) was approximately 1.5 times that of autumn (0.58). (3) The centroid of drought generally migrated northwestward. The longest migration distance (1.28 km) occurred from the period 2013–2015 to 2016–2018. (4) Elevation was the persistently dominant factor (q-value range: 0.648–0.721). However, the influence of human activity factors showed stage-specific enhancement, with the interaction between GDP and elevation reaching a q-value of 0.753 in 2015. (5) Transition characteristics of drought severity levels differed markedly between periods. During 2010–2017, drought primarily transitioned towards severe and mild drought (covering 8.59% of the total area), whereas during 2017–2024, mild drought areas shifted predominantly towards moderate drought (covering 6.59%). The findings of this study can provide crucial scientific evidence and decision-making support for drought prevention, control, and the formulation of regional adaptation strategies in Baoshan City.
1 Introduction
As a type of complex meteorological disaster, drought can cause severe damage to water resources and significantly impact local agriculture, ecology, and the environment. It has thus become one of the key research topics globally (Tadesse and Mekuriaw, 2024). Under the context of global warming, drought conditions have further intensified, posing serious constraints to the sustainable socioeconomic development of China (Yin and Slater, 2023). Located in the mountainous southwestern region of China, Yunnan Province features complex topographic conditions and frequent natural disasters, making it a typical ecologically fragile zone in the country. In recent years, the frequency and spatial extent of droughts in this region have gradually increased (Jin et al., 2018). In March 2025, during an inspection in Yunnan Province, President Xi emphasized that “Yunnan holds a crucial ecological position, and it is essential to steadfastly pursue ecological priorities and a green development path, thereby strengthening the ecological security barrier in southwestern China.” Therefore, conducting long-term drought monitoring in Yunnan Province and clarifying the patterns and driving mechanisms of drought are of vital importance for local ecological development.
In recent years, numerous scholars have conducted research on drought variations in different regions. For instance, Chen et al. (2023) utilizing meteorological station data and calculating the Standardized Precipitation Index (SPI), applied methods such as trend analysis and revealed that the frequency distribution and evolution of droughts in Yunnan Province at both annual and seasonal scales exhibit significant spatiotemporal heterogeneity. However, due to limitations in the number of monitoring stations, it has been difficult to achieve large-scale drought monitoring. With the advancement of remote sensing technology, an increasing number of studies have employed remote sensing imagery for drought monitoring. Compared to station-based data, remote sensing imagery enables large-scale monitoring and provides a more effective assessment of regional drought dynamics. Since the formation of drought is a complex process, using a single index for drought monitoring has certain limitations. Currently, a primary monitoring method involves constructing a feature space based on the Normalized DifferenceVegetation Index (NDVI) and Land Surface Temperature (LST) to retrieve the Temperature Vegetation Dryness Index (TVDI) for regional drought assessment (Przeździecki et al., 2023). By coupling land surface temperature with vegetation conditions, this approach overcomes the limitations of single-method drought detection and provides a more accurate reflection of drought status. For example, Yin et al. (2024) adopted the NDVI-LST feature space to retrieve TVDI and found a tendency towards alleviation of drought conditions in the Guanzhong region during their monitoring study. Li et al. (2019) employed meteorological station data to analyze drought patterns in the Loess Plateau, identifying distinct seasonal trends with the most significant drying in spring, followed by summer, and projecting a persistent yet seasonally heterogeneous drought trajectory for the region. Similarly, Taati et al. (2024) in their research on drought risk in forested areas near coal mines, observed significant spatial heterogeneity in drought conditions, with a trend of intensification in the forests surrounding the mining areas.
To effectively monitor drought dynamics and analyzing influencing factors, some researchers have employed methods such as spatial analysis and correlation analysis to conduct drought monitoring studies. For instance, when Li et al. (2025) used the correlation coefficient method to analyze the influence of meteorological factors on drought in Xinjiang, they found that TVDI exhibited a weak correlation with meteorological factors but a strong correlation with elevation. Similarly, Yu et al. (2019), in their drought monitoring study of the Huajiang Gorge area, discovered a significant negative correlation between the retrieved TVDI and contemporaneous measured moisture content data. However, the correlation coefficient method can only assess the impact of a single variable on TVDI variation. Since drought dynamics are influenced by multiple factors—such as hydrothermal conditions, elevation, and human activities—this approach has certain limitations in factor analysis. To effectively assess the combined effects of multiple factors, some researchers have employed geographical detectors for attribution analysis of drought conditions. For instance, Zhou et al. (2024), in their factor analysis of drought in Turpan City, found that potential evapotranspiration was the most influential single factor, while the interaction between potential evapotranspiration and elevation exhibited the strongest explanatory power among multiple factors. In studies on drought change monitoring, most existing research has been conducted using methods such as trend analysis, which can effectively reflect temporal variations in drought conditions (Li et al., 2024). However, these approaches often fall short in capturing spatial dynamic changes. Gravity center analysis and transition matrices, as methodologies for monitoring spatial dynamics, have been widely applied in various ecological monitoring contexts (Wei et al., 2022). Nevertheless, their application in drought monitoring remains relatively limited, highlighting an urgent need for further exploration into dynamic drought change monitoring.
Located in the Hengduan Mountains of western Yunnan, Baoshan City represents a typical ecologically fragile and drought-sensitive area due to its complex low-latitude mountainous terrain and remarkable ecological transitionality. The frequent occurrence of drought events in the region, combined with significant human influences, makes it an ideal case for investigating the spatiotemporal dynamics of drought.
Based on this, the present study selects Baoshan City as the study area. Utilizing MODIS data to synthesize NDVI and LST products, the Temperature Vegetation Dryness Index (TVDI) is retrieved. Through methods including gravity center analysis, trend analysis, transition matrices, and geographical detectors, this research conducts monitoring of drought variations and analysis of influencing factors within the study area. Compared with other regions, this study demonstrates distinct methodological and applied innovations by focusing on the unique geographical context and agricultural background of Baoshan City. Methodologically, it represents the first systematic integration of centroid migration models and spatial transition matrices in Baoshan to delineate drought pattern dynamics with refined precision. From an applied perspective, the constructed driving mechanism analysis framework specifically addresses Baoshan’s role as a key tobacco-producing area in Yunnan, offering novel insights into the coupling mechanisms between natural and anthropogenic factors in specialized cash crop zones. This research approach not only deepens the understanding of drought evolution patterns in the complex terrain of the southwestern plateau but also provides regionally tailored scientific support for formulating drought resistance strategies for characteristic agriculture, with tobacco cultivation as a representative case.
2 Materials and methods
2.1 Study area
As shown in Figure 1, Baoshan City is located in western Yunnan Province, between 24°08′–25°51′N and 98°05′–100°02′E, with an elevation range of 563–3,654 m. It comprises one district (Longyang District), three counties (Longling County, Shidian County, and Changning County), and one county-level city (Tengchong City), covering a total area of 19,637 km2. The region experiences an average annual rainfall of 947.0–2097.5 mm and an average annual temperature of 14.8 °C–17.1 °C. It features a low-latitude mountainous mid-subtropical monsoon climate, characterized by mild winters, cool summers, and spring-like conditions throughout the year. However, due to rising temperatures, reduced precipitation, and uneven spatiotemporal distribution of rainfall, the area faces relatively severe drought conditions.

Figure 1. Study area.
2.2 Data source and preprocessing
The data used in this study were obtained from the National Aeronautics and Space Administration (NASA). The data products include the Moderate.
Resolution Imaging Spectroradiometer (MODIS, http://ladsweb.nascom.nasa.gov/) datasets MOD13A2 and MOD11A2, which were used to synthesize NDVI and LST data, respectively. The acquired data cover the period from 2010 to 2024, with a monthly temporal resolution, a spatial resolution of 0.05 ° × 0.05 °, and are referenced to the WGS1984 coordinate system. Data on population density, GDP, land use, temperature, and precipitation were sourced from the Resource and Environmental Science Data Center (http://www.resdc.cn). Elevation data were obtained from the Geospatial Data Cloud (https://www.gscloud.cn/).The selection of these factors is primarily based on their systematic representation of two fundamental aspects influencing regional moisture differentiation: underlying natural conditions and anthropogenic disturbances. These variables collectively explain the formation mechanisms of drought spatial patterns through core dimensions ranging from energy balance (air temperature) and moisture supply (precipitation) to topographic redistribution (elevation, slope), surface properties (soil type, land use), and socioeconomic activity intensity (GDP, population density). This selection aligns with the established understanding of surface processes and satisfies the practical requirement of data accessibility.
The raw data were processed through a sequence of standardized procedures: format conversion and projection transformation were conducted using the MODIS Reprojection Tool (MRT); the study area was then extracted via clipping in ArcGIS 10.7; subsequently, atmospheric correction was applied to the clipped data in ENVI. Finally, cloud masking and invalid pixel removal were performed in MATLAB R2022a (core code excerpt provided below).
modis_data = hdfread(modis_file, data_band);
qa_data = hdfread(modis_file, qa_band);
[fill_value, valid_range] = get_data_attributes(data_info, data_band);
modis_data = preprocess_data(modis_data, fill_value, valid_range);
cloud_mask = generate_cloud_mask(qa_data, product_type);
clean_data = modis_data;
clean_data(cloud_mask) = NaN.
2.3 Research method
2.3.1 TVDI index construction
This study employed the Temperature Vegetation Dryness Index (TVDI), based on the NDVI-LST feature space (Figure 2), to quantitatively assess regional drought conditions. The core of this method lies in establishing a two-dimensional feature space constituted by the vegetation index and land surface temperature, with its upper and lower boundaries—namely the dry and wet edges—determined statistically(Fan et al., 2024). Specifically, the NDVI value range across the entire region was first divided into several consecutive narrow intervals. For each NDVI interval, the percentiles of the corresponding LST values for all pixels were computed to identify the characteristic points of potential extreme high and low temperatures at that vegetation coverage level, thereby effectively mitigating the influence of outliers. Subsequently, least-squares linear regression was applied to fit all the high-temperature characteristic points and low-temperature characteristic points separately, yielding the linear equation representing the dry edge (Equation 1) and the linear equation representing the wet edge (Equation 2). Following this, for any given pixel, its NDVI value was substituted into these equations to derive the corresponding theoretical temperature extremes, T_max and T_min. Combined with the pixel’s actual LST, its drought index was then calculated according to Formula (3). This index value ranges from 0 to 1, where a higher value indicates lower soil moisture and more severe drought conditions. Through this methodology, the TVDI effectively integrates information on vegetation status and land surface temperature.

Figure 2. Theoretical basis of the NDVI–LST feature space.
The explicit computation of TVDI is presented in Equations 1–3:
Where Tmax and Tmin denote the temperatures fitted along the dry and wet edges, respectively; LST represents the original land-surface temperature value; a and c are the fitted slope coefficients; b and d are the fitted intercept terms.
To comprehensively evaluate the robustness and physical validity of the TVDI dry and wet edge fitting, an integrated sensitivity analysis and validation were conducted. Firstly, a sensitivity analysis was performed by altering the percentile thresholds used to define the dry and wet edges (90th/10th, 95th/5th, and 97th/3rd percentiles). Subsequently, to verify the physical significance of the dry edge under each scenario, the ‘dry-edge temperature distance’ (Ld) Equation 4 and ‘wet-edge temperature distance’ (Lw) Equation 5 for each pixel were calculated and subjected to correlation analysis with contemporaneous in situ soil moisture data from meteorological stations within the study area. As presented in Table 1, the results indicated that employing the 95th percentile for the dry edge and the 5th percentile for the wet edge yielded the strongest correlations with the field-measured data (r = 0.92/0.91, p < 0.01). Consequently, these percentile thresholds were selected for defining the dry and wet edges in the final model.

Table 1. Sensitivity analysis.
To validate the accuracy of the TVDI against measured data, a correlation analysis was conducted between the TVDI calculated using the aforementioned thresholds and in situ humidity data from meteorological stations. The results demonstrated a statistically significant correlation coefficient of r = 0.893 (p < 0.01), thereby robustly verifying the rationality of the TVDI calculation.
2.3.2 Center of gravity analysis
The center of gravity can characterize the spatial dynamics of geographic attributes and has been widely applied in studies of precipitation and vegetation dynamics. In drought monitoring, the center of gravity indicates the shifting trend of drought’s spatial distribution (Yang and Guo, 2025). The center of gravity is calculated as follows (Equation 6):
Where
The direction of centroid migration indicates the azimuth along which drought intensification is most pronounced, whereas the migration distance quantifies the degree of spatial dispersion of drought distribution; the expressions are (Equation 7):
Where θ is the azimuth angle of TVDI-centroid migration; d denotes the migration distance; yt+m and yt represent the centroid y-coordinates at times t+m and t, respectively; xt+m and xt are the corresponding centroid x-coordinates.
2.3.3 Transition matrix
A transition matrix was employed to characterize shifts among different TVDI classes (Jia et al., 2025), expressed as (Equation 8):
In the formula: S represents the transferred area of different classes (km2); n denotes the number of TVDI classes; i and j represent the TVDI classes at the initial time and final time, respectively; Snn indicates the area change (km2) of TVDI classes transferred from the initial period to the final period.
2.3.4 Trend analysis
Trend analysis employs individual grid cells as the fundamental research units to simulate and fit their changing tendencies (Fu et al., 2020). The expression is as follows (Equation 9):
In the formula: i denotes the year; n represents the number of years in the time series; TVDIi refers to the TVDI value in the i-th year; θslope indicates the slope of the trend line. A positive or negative value of θslope suggests an improving or degrading trend in vegetation TVDI over time, respectively. Specifically, if θslope > 0, it denotes an increase in TVDI; if θslope < 0, it signifies a decreasing trend in TVDI. The F-test is as shown in Equation 10:
In the formula: U represents the sum of squared errors, Q denotes the regression sum of squares, and n indicates the sample size. Based on the slope trend and significance test results, the trend types are classified into seven categories, as shown in Table 2.

Table 2. Trend types.
2.3.5 Geographical detector
The Geographical Detector model is capable of assessing the contribution of different factors to TVDI and revealing the driving factors behind spatial heterogeneity of geographical phenomena (Wang and Xu, 2017). Its explanatory power is measured by the q-value, which ranges between [0, 1]. A higher q-value indicates a stronger influence of the factor on TVDI. The expression is as follows (Equations 11–13):
in the formula: h = 1, … , L represents the stratification of variable Y or factor X; Nh and N denote the number of units in stratum h and the entire region, respectively;
In this study, air temperature, precipitation, elevation, slope, soil type, land use, GDP, and population density were selected as driving factors. These factors were discretized using the natural break classification method within a parameter space of 3–9 classes. Through an iterative screening process involving over 40 iterations, the classification scheme that yielded the maximum q-value in the geographical detector analysis was ultimately selected as the optimal solution, thereby ensuring the objectivity of the driving force analysis.
2.3.6 Temporal series autocorrelation correction
The Bonferroni correction method offers distinct advantages through its conceptual simplicity, operational robustness, and strong control over statistical error. By simply dividing the significance level α by the number of tests k (α_corrected = α/k), this method provides an extremely straightforward calculation that does not rely on complex distributional assumptions, demonstrating excellent universality. Its core strength lies in its strict control of the family-wise error rate (FWER), ensuring that the overall probability of obtaining at least one false positive among all k tests does not exceed α. This provides highly rigorous statistical assurance for confirmatory research conclusions. Consequently, in scenarios requiring definitive conclusions, this method represents one of the most reliable tools for avoiding false positive results (Bonferroni, 1936).
3 Results
3.1 Spatial pattern analysis of TVDI
Based on the TVDI classification criteria established by Yu et al. (2019), TVDI values were categorized into five classes: Moist (0 < TVDI <0.2), Normal (0.2 ≤ TVDI <0.4), Mild Drought (0.4 ≤ TVDI <0.6), Moderate Drought (0.6 ≤ TVDI <0.8), and Severe Drought (0.8 ≤ TVDI <1). The spatial distribution characteristics of drought conditions are shown in Figure 3. Drought distribution in Baoshan exhibited significant spatial heterogeneity. The predominant drought severity classes were Moderate Drought and Severe Drought, accounting for 54.01% and 27.44% of the total area, respectively. These were followed by Mild Drought, Normal, and Moist conditions, with respective proportions of 15.54%, 2.52%, and 0.48%. Areas experiencing Moderate and Severe Drought were widespread across most parts of Baoshan, predominantly occurring in mountainous areas, hilly regions, karst landforms, river terraces, and the sloping lands fringing intermountain basins. Severe Drought was primarily concentrated in central-western Longyang, most of Shidian and Changning, with additional patches in eastern and southern Longling and localized areas of Tengchong. These zones are characterized predominantly by mountainous and hilly topography, with some areas adjacent to river valleys. Mild Drought was mainly distributed across central and northern Tengchong, central Longyang, as well as some parts of Longling and Changning. These areas typically consist of low to medium elevation mountains, hills, and slopes flanking river valleys or located on the edges of fault-depression basins. Normal conditions were mostly found at the border between Tengchong and Longyang and along the northern periphery of Tengchong. Moist conditions were primarily located in the northern marginal areas of Tengchong, with minor distributions also observed around the Tengchong-Longyang border. In summary, over 80% of Baoshan City experienced moderate to severe drought during the study period, highlighting the widespread and substantial moisture stress conditions in the region.

Figure 3. Spatial distribution of annual mean TVDI in Baoshan city from 2010 to 2024.
3.2 Analysis of TVDI temporal variation
Based on the constructed TVDI series derived from MODIS NDVI and Land Surface Temperature (LST) data, autocorrelation tests and regression with precipitation data were performed. As shown in Figures 4–6, the time series data exhibited no significant autocorrelation at lag periods of 1, 2, and 3 years, but showed a significant correlation with precipitation, with a goodness-of-fit coefficient of R2 = 0.8035 (p < 0.05). From 2010 to 2024, the annual mean TVDI in Baoshan City displayed a non-significant slight increasing trend (0.0004 a−1, R2 = 0.003, p > 0.05). The mean TVDI consistently remained within a high range around 0.75, indicating that the regional ecosystem was subjected to prolonged moderate-to-strong moisture stress. Notably, TVDI values persistently exceeded 0.75 during the periods of 2011–2013 and 2017–2022. The spatial distribution of high TVDI values showed significant overlap with areas where the proportion of sloping cropland exceeds 35% (r = 0.846). These findings underscore the compound driving effects of interannual precipitation variability under climate change and land use changes on the drought patterns across the southwestern Yunnan Plateau (Chen et al., 2024).
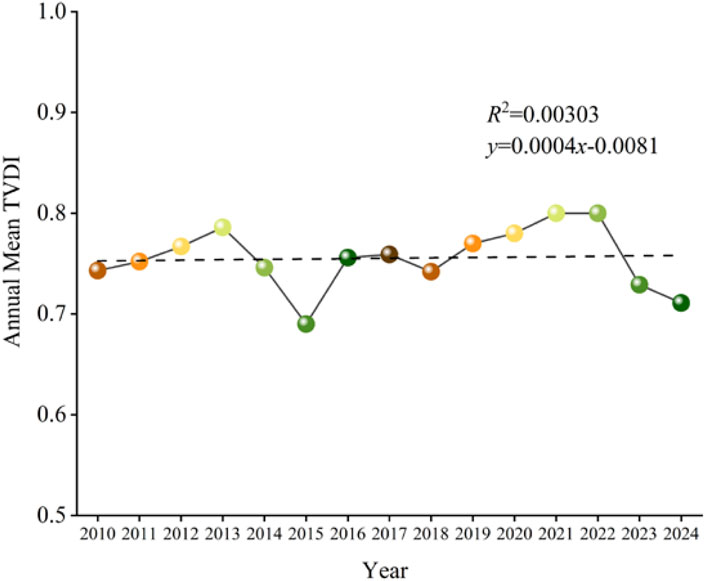
Figure 4. Annual variation of TVDI
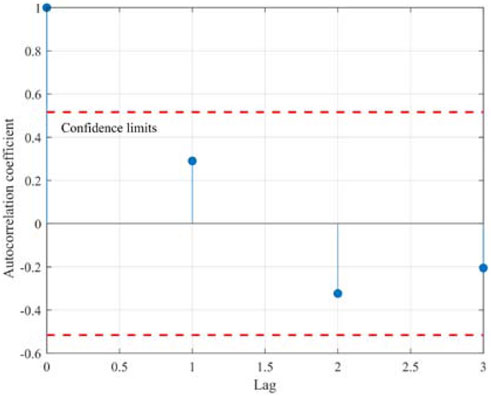
Figure 5. Inter-annual TVDI autocorrelation test.

Figure 6. Inter-annual TVDI-precipitation regression.
Based on the monthly TVDI variation trend in Baoshan City, as shown in Figures 7–9, autocorrelation tests and regression with precipitation data were conducted. The time series exhibited no significant autocorrelation at lag periods of 1, 2, and 3 months, but demonstrated a significant correlation with precipitation, with a goodness-of-fit coefficient of R2 = 0.887 (p < 0.05). The intra-annual drought process displayed a pronounced “high in winter and spring, low in summer and autumn” seasonal fluctuation pattern (Chen et al., 2024).
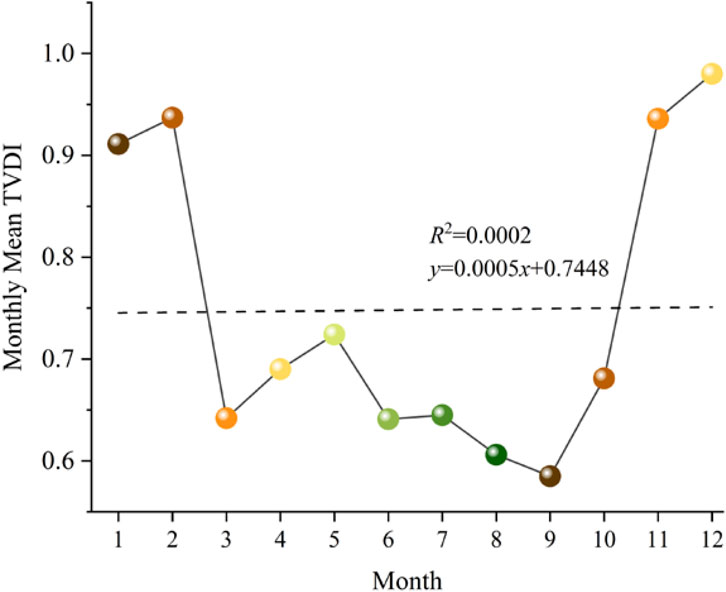
Figure 7. Monthly variation of TVDI

Figure 8. Monthly TVDI autocorrelation test.
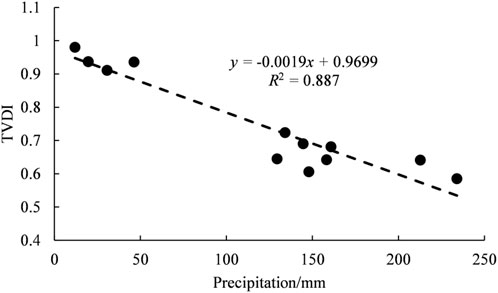
Figure 9. Monthly TVDI-precipitation regression.
To analyze the interannual variations of TVDI across different seasons, this study constructed interannual TVDI series for spring, summer, autumn, and winter from 2010 to 2024 based on MODIS NDVI and LST data (Figures 10–12). The integrated analysis reveals that the drought patterns in Baoshan City exhibited significant seasonal differentiation and asymmetric changes.
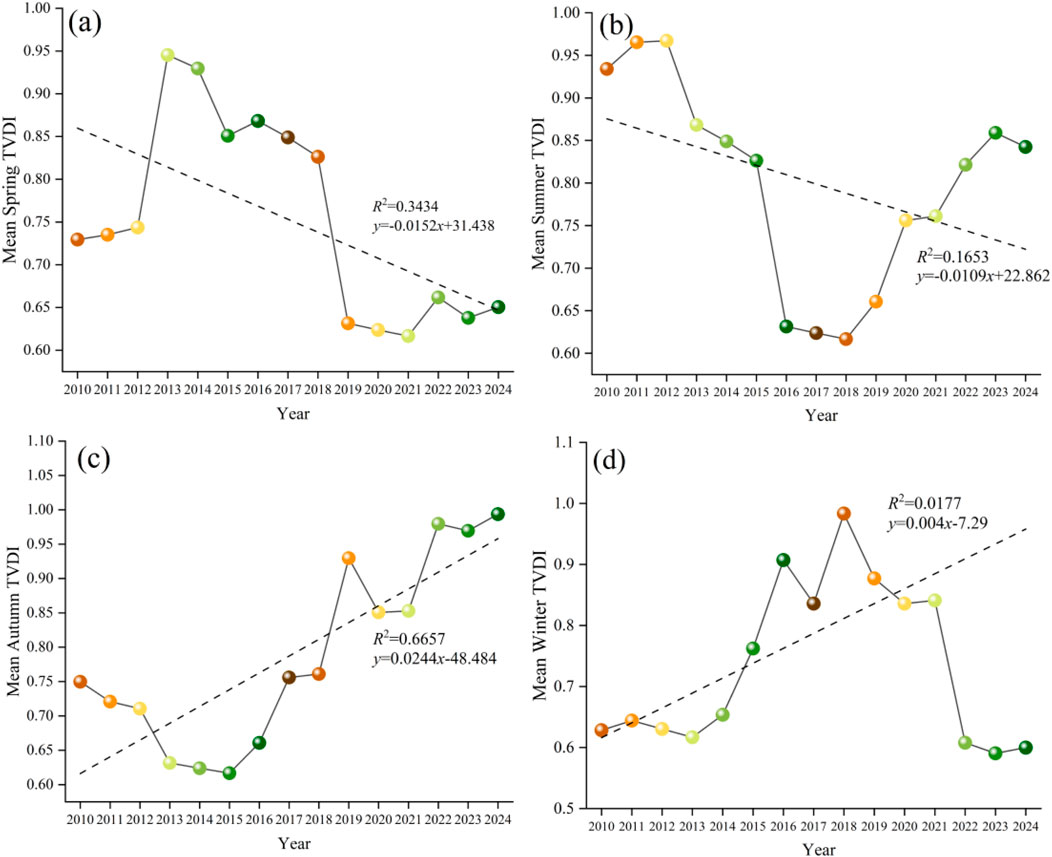
Figure 10. Interannual variations of TVDI across seasons. (a) Spring. (b) Summer. (c) Autumn. (d) Winter.

Figure 11. Seasonal TVDI autocorrelation test. (a) Spring. (b) Summer. (c) Autumn. (d) Winter.

Figure 12. Seasonal TVDI-precipitation regression. (a) Spring. (b) Summer. (c) Autumn. (d) Winter.
Spring: Based on the interannual variation trend of spring TVDI in Baoshan City, autocorrelation testing and regression analysis with precipitation data were conducted. The time series data exhibited significant autocorrelation at a 1-month lag period, along with a significant correlation with precipitation, yielding a goodness-of-fit coefficient of R2 = 0.8268 (p < 0.05). From 2010 to 2024, spring drought intensity in Baoshan City showed a statistically significant decreasing trend (slope = −0.0152 a−1, R2 = 0.343, p < 0.05), with the mean TVDI decreasing from 0.726 (2010) to 0.653 (2024), indicating an overall alleviation of spring drought stress in the region.
Summer: Based on the interannual variation trend of summer TVDI in Baoshan City, autocorrelation analysis and regression with precipitation data were conducted. The time series exhibited significant autocorrelation at a 1-month lag period and demonstrated a significant correlation with precipitation, with a goodness-of-fit coefficient of R2 = 0.8098 (p < 0.05). During 2010–2024, summer drought intensity in Baoshan City showed a weak non-significant decreasing trend (slope = −0.0109 a−1, R2 = 0.165, p > 0.05), with the mean TVDI declining from 0.928 (2010) to 0.85 (2024). Although statistically non-significant, this trend nevertheless suggests a general tendency toward improved soil moisture supply during midsummer.
Autumn: Based on the interannual variation trend of autumn TVDI in Baoshan City, autocorrelation analysis and regression with precipitation data were performed. The time series exhibited significant autocorrelation at lag periods of 1 and 2 months and demonstrated a significant correlation with precipitation, with a goodness-of-fit coefficient of R2 = 0.8488 (p < 0.05). During 2010–2024, autumn drought intensity in Baoshan City showed a statistically significant increasing trend (slope = 0.0244 a−1, R2 = 0.666, p < 0.05), with the mean TVDI rising from 0.75 (2010) to 0.98 (2024) and approaching the theoretical maximum. These results indicate that regional autumn drought stress has entered a phase of rapid expansion.
Winter: Based on the interannual variation trend of winter TVDI in Baoshan City, autocorrelation testing and regression analysis with precipitation data were conducted. The time series exhibited significant autocorrelation at a 1-month lag period and demonstrated a significant correlation with precipitation, with a goodness-of-fit coefficient of R2 = 0.8118 (p < 0.05). The drought stress conditions in the study area overall showed a weak upward trend (linear slope = 0.004), but with an extremely low coefficient of determination (R2 = 0.0177), indicating no statistically significant long-term trend and suggesting that interannual fluctuations dominate the drought evolution. Specifically, the TVDI fluctuated upward between 2010 and 2018, peaked around 2017–2018 (approaching 1.0), subsequently entered a declining phase, and then experienced a minor rebound after 2021, demonstrating a fluctuation pattern characterized by “gradual rise - peak - decline - oscillation.”
3.3 Analysis of TVDI trends from 2010 to 2024
The TVDI trend from 2010 to 2024 was calculated at a monthly scale and subjected to significance testing, as shown in Figure 13. The area characterized by non-significant increasing accounted for the highest proportion, approximately 80.6%, and was widely distributed across all counties of Baoshan City. This was followed by areas showing non-significant decreasing, covering about 9.4% of the area, primarily located in western Longyang and western Shidian. Areas of highly significant increasing comprised approximately 2%, mainly concentrated in central Longling and western Changning. Regions with Increased significantly accounted for about 8%, largely distributed adjacent to the highly significant increase areas. The area with highly significant decreasing was the smallest, constituting less than 1%. This analysis indicates that between 2010 and 2024, TVDI in Baoshan City exhibited a predominant increasing trend, suggesting a general aggravation of drought conditions in the region.

Figure 13. Tvdi variation trend.
3.4 Analysis of center of gravity variation trend
To analyze the dispersion and skewness of TVDI distribution within the study area, a centroid model alongside standard deviational ellipses was employed to examine the dynamic changes at monthly, annual, and 3-year intervals from 2010 to 2024. Using the temporal mean centroid of the study period as the coordinate origin, the distance (polar radius) and deflection angle (polar angle) from each monthly/yearly centroid to this origin were calculated. The variation in the centroid distribution was visualized based on a polar coordinate plot (Figure 14).

Figure 14. Tvdi gravity center distribution. (a) Monthly spatial distribution. (b) Monthly polar distribution. (c) Annual spatial distribution. (d) Interannual polar distribution. (e) Migration of center of gravity.
Monthly Scale Variation (Figures 14a,b): At the monthly scale, the centroids were primarily located in the areas of Shidian and Longyang, exhibiting a dual-cluster pattern (NW and SE directions). The rotation angle of the standard deviational ellipse was 150.14°. The standard deviation was 1.385 km along the X-axis and 5.138 km along the Y-axis, indicating a more concentrated distribution of centroids along the Y-axis. The ellipse area was 22.34 km2. In the polar coordinate system, the centroids were predominantly located in the second and fourth quadrants, with approximately 80% in the fourth quadrant and about 15% in the second quadrant, revealing a dominant “NW-SE” distribution pattern. The northwesternmost and southeasternmost centroids occurred in June 2017 and April 2010, respectively, indicating the most severe drought conditions in those directions during the corresponding periods.
Annual Scale Variation (Figures 14c,d): The spatial distribution pattern of the annual centroids was consistent with the monthly pattern, mainly clustered in Shidian and Longyang, and also exhibited a “NW-SE” orientation. The standard deviational ellipse had a rotation angle of 149.99°, with standard deviations of 0.235 km (X-axis) and 1.422 km (Y-axis). The polar coordinate plot confirmed the concentration of annual centroids in the second and fourth quadrants. The southeasternmost and northwesternmost annual centroids were observed in 2015 and 2022, respectively, signifying the most severe drought conditions along those directions in those years.
These analyses collectively indicate that from 2010 to 2024, drought severity in Baoshan City, Yunnan Province, was more pronounced along the “NW-SE” direction, with the southeastern direction experiencing the highest severity, followed by the northwestern direction.
Triennial Migration Trajectory (Figure 14e): The migration trajectory of the drought centroid for successive 3-year periods in Baoshan City is shown in Figure 8e. Overall, the centroid exhibited a net migration trend towards the northwest from 2010 to 2024, suggesting a gradual intensification of drought in the northwestern areas over this period.
2010–2012 → 2013–2015: The centroid shifted southeastward by 1.06 km, indicating a gradual increase in drought severity in the southeastern part during this interval. 2013–2015 → 2016–2018: The centroid migrated northwestward by 1.28 km, representing the longest migration distance, which points to the most pronounced intensification and highest variability of drought conditions in the northwestern direction during this period. 2016–2018 → 2019–2021: A short southeastward migration of 0.40 km occurred, suggesting a relatively mild increase in drought severity in the southeast. 2019–2021 → 2022–2024: The centroid shifted northwestward again by 0.44 km, indicating a renewed trend of increasing drought severity in the northwestern areas.
3.5 Transition analysis of different TVDI categories
As shown in Figures 15a,c, during the period 2010–2017, the land cover type with the largest transferred area in the study area was Moderate Drought, accounting for 8.59% of the total study area. It primarily transitioned to Severe Drought and Mild Drought, representing 56.00% and 43.81% of the transferred area from Moderate Drought, respectively. The transition from Moderate Drought to Severe Drought was mainly distributed in the central-western part of Longyang District, the border area between Longling County and Shidian County, and the central part of Changning County. The transition from Moderate Drought to Mild Drought was primarily observed in the southern and northern parts of Tengchong City, Longling County, the eastern part of Shidian County, and the southeastern part of Longyang District. The second largest transferred area was Mild Drought, accounting for 5.46% of the study area. It mainly transitioned to Moderate Drought and Normal, representing 69.33% and 30.58% of the transferred area from Mild Drought, respectively. The transition from Mild Drought to Moderate Drought was mainly distributed in Tengchong City, Longyang District, the eastern part of Changning County, and the central part of Shidian County. The transition from Mild Drought to Normal was primarily located in the northern part of Tengchong City and the central and eastern parts of Longyang District. The transferred area of Normal accounted for 1.60% of the study area, mainly transitioning to Mild Drought, which constituted 76.95% of the transferred area from Normal, and was primarily distributed in the central and northern parts of Tengchong City. The transferred area of Severe Drought accounted for 1.35% of the study area, mainly transitioning to Moderate Drought, which was primarily distributed in the southeastern part of Changning County.
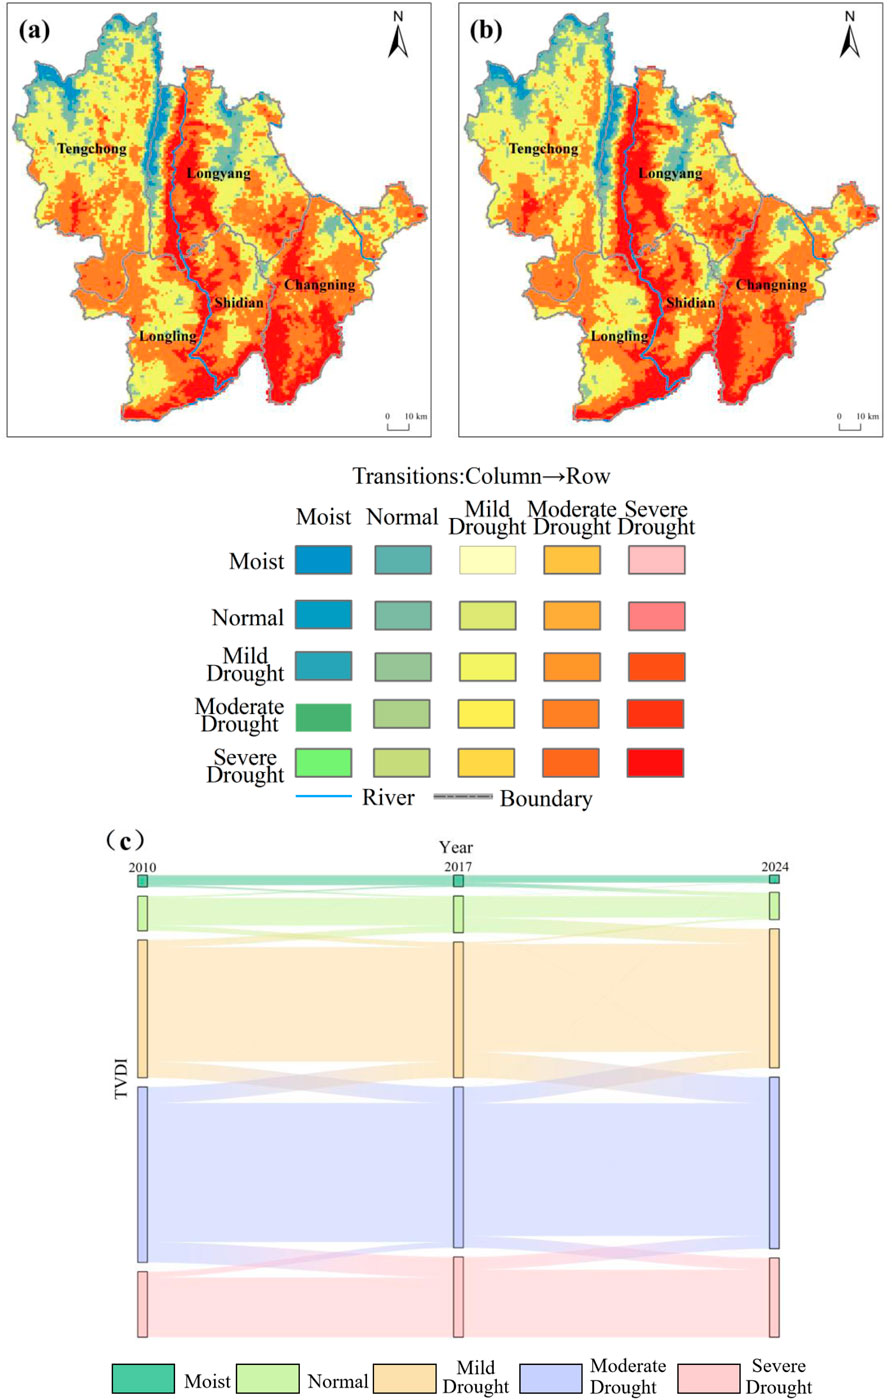
Figure 15. Baoshan City 2010–2024 Transfer Matrix. (a) 2010–2017. (b) 2017–2024. (c) Area change.
As shown in Figures 15b,c, during the period 2017–2024, the land cover type with the largest transferred area was again Moderate Drought, accounting for 6.59% of the study area. It primarily transitioned to Mild Drought and Severe Drought, with the transition to Mild Drought accounting for 58.02% of the transferred area from Moderate Drought, mainly distributed in the central-eastern part of Tengchong City, the central and eastern parts of Longyang District, and the northeastern part of Changning County. The transition to Severe Drought accounted for 41.82% of the transferred area from Moderate Drought, primarily located in the southeastern and central parts of Longyang District, Shidian County, the western part of Changning County, and the eastern part of Longling County. The second largest transferred area was Mild Drought, accounting for 6.54% of the study area. It mainly transitioned to Moderate Drought, representing 92.39% of the transferred area from Mild Drought, and was primarily distributed in the southern part of Tengchong City, the eastern part of Longyang District, Longling County, the eastern part of Shidian County, and the eastern part of Changning County. The transferred area of Normal accounted for 3.65% of the study area, mainly transitioning to Mild Drought, which constituted 95.17% of the transferred area from Normal, and was primarily distributed in the northern part of Tengchong City, the northeastern part of Longyang District, and the northeastern part of Changning County. The transferred area of Severe Drought accounted for 3.02% of the study area, mainly transitioning to Moderate Drought, representing 99.66% of the transferred area from Severe Drought, and was primarily located in the central part of Longyang District, the western part of Shidian County, and the central and western parts of Changning County.
3.6 Analysis of driving factors
Figure 16 presents the single-factor detection results for Baoshan City for the years 2010, 2015, and 2020. Among the factors analyzed, Elevation (DEM) exhibited the strongest explanatory power for TVDI changes, identifying it as the dominant factor, with q-values of 0.648, 0.721, and 0.684, respectively. Soil Type was the second most influential factor. In contrast, GDP demonstrated the weakest explanatory power, with q-values of 0.079, 0.146, and 0.071. This limited influence of GDP is likely attributable to the region’s high elevation and relatively low population density.

Figure 16. Single factor detection.
As shown in Figure 17, the two-factor interactions in Baoshan City from 2010 to 2020 were generally characterized by a bivariate enhancement mode dominated by physio-geographical factors, with the types of dominant factors and interaction strength changing significantly over time.

Figure 17. Interaction detection. (a) 2010. (b) 2015. (c) 2020.
In 2010, the three pairs with the strongest interactions were: Precipitation ∩ DEM (0.718, p < 0.01) > Temperature ∩ DEM (0.713, p < 0.01) > DEM ∩ Soil Type (0.695, p < 0.01). During this period, the interactions among DEM, Precipitation, Temperature, and Soil Type were dominant. The combination of Precipitation and DEM exhibited exceptionally strong explanatory power, reflecting the joint control of climate and topography on TVDI. Socioeconomic factors (GDP, Population Density, Land Use) showed relatively low interaction q-values at this time (such as GDP∩Land Use = 0.264, p < 0.05), indicating a weak influence of human activities on TVDI changes.
By 2015, the interaction pattern had shifted. The top three interacting pairs were: DEM ∩ Soil Type (0.762, p < 0.01) > DEM ∩ GDP (0.753, p < 0.05) > DEM ∩ Land Use = DEM ∩ Temperature (0.743, p < 0.01). The interaction between DEM and Soil Type increased significantly to 0.762, becoming the absolute dominant factor. The synergistic effect between topographic factors (DEM, Slope) and soil properties was further enhanced, suggesting that the spatial differentiation of TVDI was more significantly influenced by the coupling of topography and soil physical attributes during this period. The interaction q-values for socio-economic factors increased noticeably (such as GDP∩Land Use = 0.338, p < 0.05), indicating a growing influence of human activities on TVDI changes, while the dominance of climatic factors declined.
In 2020, the three pairs with the strongest interactions were: DEM ∩ Soil Type (0.730, p < 0.01) > DEM ∩ Temperature (0.724, p < 0.01) > DEM ∩ Precipitation (0.714, p < 0.01). Topographic factors (DEM) remained dominant. The interactions between climatic factors (Precipitation, Temperature) and DEM increased markedly compared to 2015, reflecting an enhanced combined influence of climate and topography on TVDI. The interaction q-values for socio-economic factors decreased (such as GDP∩Land Use = 0.246, p < 0.05), suggesting a reduced influence of human activities on TVDI changes.
In summary, throughout the period 2010–2020, TVDI in Baoshan City was consistently dominated by the interaction between DEM and other factors. The role of socioeconomic factors increased in 2015, but the interaction between DEM and climatic factors remained strong throughout the period. This indicates that TVDI changes in Baoshan City were primarily driven by natural drivers, with limited direct influence from human intervention such as GDP.
4 Discussion
4.1 Advantages of the applied model
This study employed the Temperature Vegetation Dryness Index (TVDI) model to analyze drought conditions in Baoshan City. The primary strengths of the TVDI lie in its capacity to synthesize information, its adaptability to complex terrain, and its strong correlation with in situ soil moisture measurements. Compared to monitoring methods that rely solely on vegetation indices or land surface temperature, the TVDI effectively mitigates the limitations of single indicators by establishing a feature space between the Normalized Difference Vegetation Index (NDVI) and the Land Surface Temperature (LST). For instance, vegetation indices (e.g., NDVI) often exhibit a lagged response to drought onset, while LST can be easily confounded by soil background signals. By integrating both vegetation cover information and the thermal response of the land surface, the TVDI provides a more sensitive and accurate reflection of surface soil moisture status in vegetated areas. This makes it particularly suitable for monitoring drought dynamics across extensive regions with complex topography (Zhang et al., 2023).
The findings of this study align with the foundational work by Sandholt et al., which confirmed that the NDVI-LST feature space, typically forming a triangular or trapezoidal shape, can be effectively utilized to assess moisture stress conditions (Sandholt et al., 2002). Furthermore, our results are consistent with the conclusions of Kang Weimin et al. from their research in the karst mountainous areas of Guizhou Province. Their validation demonstrated a significant negative correlation between the TVDI and soil moisture data measured at meteorological stations, affirming the index’s applicability in regions with complex underlying surfaces (Kang et al., 2008). Additionally, research by Sha et al. in Gansu Province indicated that constructing a feature space using the Soil-Adjusted Vegetation Index (SAVI) and LST with multi-temporal data can further enhance the inversion accuracy of the TVDI. This suggests a potential pathway for future model refinement through the incorporation of optimized vegetation indices (Sha et al., 2014).
In summary, as a remote sensing-based drought monitoring tool, the TVDI offers distinct advantages, including a clear physical basis, relatively straightforward computation, and the ability to provide macroscopic, continuous spatial information on drought conditions. It thereby serves as a powerful technical support for regional-scale agricultural drought monitoring and water resource management (Cheng et al., 2022).
4.2 Reasons of spatiotemporal patterns
Through a spatiotemporal analysis of the Temperature Vegetation Dryness Index (TVDI) in Baoshan City, Yunnan Province, from 2010 to 2024, this study reveals that the region’s drought patterns are driven by the complex interplay of natural factors and human activities.
Temporally, the annual mean TVDI in Baoshan City exhibited a slight, statistically non-significant increasing trend. The monthly variation of TVDI reveals a distinct seasonal pattern, initiating from high values in January-February (approximately 0.9) and decreasing rapidly from February onward, reaching its lowest point in September (approximately 0.58). This rhythm is governed by the coupling between the advance and retreat of the Southwest Monsoon and vegetation phenology. During June-August, the monsoon onset brings a sharp increase in precipitation, coinciding with the peak leaf area index of crops. Enhanced evapotranspiration cools the land surface, leading to a rapid decline in TVDI. From November to February, following monsoon retreat, precipitation decreases sharply. Although net radiation is relatively low, the high frequency of clear skies (>75%) promotes a greater proportion of sensible heat flux from bare soil and winter wheat fields. This results in the accumulation of water deficit in the soil-vegetation system, driving TVDI to its annual maximum. Additionally, irrigation withdrawals during the dry season cause a 0.2–0.4 m decline in shallow groundwater levels along riverbanks, further limiting water availability in the root zone and thereby reinforcing the sustained high TVDI plateau under the dual drivers of “monsoon control and anthropogenic evapotranspiration.”
Seasonal differentiation is pronounced. Spring drought has significantly alleviated, a change attributed to the earlier activation of the Southwest Monsoon, which effectively replenishes soil moisture. Furthermore, the implementation of the Grain-for-Green Program and seasonal fallow policies since 2005 has increased forest and grass coverage in the study area by 6.8%, reducing evapotranspiration water consumption and further depressing high TVDI values. However, a slight rebound occurred from 2021 to 2024, coinciding with the La Niña event characterized by higher spring temperatures and a 10%–15% reduction in precipitation, highlighting the short-term disturbance of climate oscillations on the spring drought pattern in the southwestern Yunnan Plateau (Jin et al., 2018).
Summer shows a weak decreasing trend, primarily due to two factors: first, the emergence of a regional “warming and wetting” climate pattern, with June-August precipitation increasing by approximately 22 mm⋅(10a)−1 and a rising frequency of extreme precipitation events, which effectively suppresses moisture stress on vegetation from surface evapotranspiration; second, the impoundment of water by cascade hydropower stations on the main streams of the Lancang and Nujiang rivers increases local near-surface humidity by 2%–3% (Degu et al., 2011), further reducing high TVDI values. However, significant rebounds occurred in 2019 and 2022 (TVDI >0.85), closely associated with the warm phase of ENSO causing intermittent monsoon breaks and a 15%–20% reduction in precipitation, indicating that interannual fluctuations in summer drought remain dominated by large-scale ocean-atmosphere interactions (Arora, 1990; Rwambo et al., 2025; Madolli et al., 2025).
Autumn drought has intensified significantly, stemming from the synergistic effects of three main factors (Qiu et al., 2022): first, the delayed retreat date of the Southwest Monsoon coupled with a decrease in total precipitation leads to insufficient soil moisture replenishment at the end of the monsoon season; second, the extended post-harvest bare soil period after the concentrated harvesting of cash crops like tobacco and maize in late autumn decreases surface albedo and increases sensible heat flux, causing the evapotranspiration deficit to turn negative and accelerating soil desiccation; third, cascade hydropower development between 2005 and 2020 expanded the local water surface area of the Nujiang and Lancang river main stems by about 12%. While this increases near-surface water vapor, it is accompanied by a simultaneous increase in nocturnal temperature inversion frequency, inhibiting boundary layer vertical exchange and creating a “moist air-dry surface” mismatch, further driving up peak TVDI values (Chen and He, 2000; Pan et al., 2023). Winter drought is primarily characterized by interannual fluctuations, reflecting that regional winter moisture stress is strongly influenced by interannual climate variability (such as precipitation anomalies and temperature fluctuations) rather than a unidirectional aridification process (Jin et al., 2018).
This seasonal asynchrony is closely linked to the coupling effects of the climatic system and phenological rhythms. Consistent with the findings of Liu Xin et al. in the Yellow River Source Region, the TVDI demonstrated a reliable indicative capacity for soil moisture variation (r = 0.7). However, the “intensifying autumn drought” pattern observed in Baoshan contrasts with the relatively stable conditions reported in the Yellow River Source Region, suggesting a unique response of the Yunnan-Southwest Plateau to delayed monsoon retreat and reduced total precipitation (Liu et al., 2019). The recent TVDI values in autumn in Baoshan have approached the theoretical maximum (0.98), which is closely related to post-harvest surface albedo changes and microclimatic variations induced by hydropower development, creating a “moist air-dry surface” dislocation phenomenon. This mechanism was not fully revealed in Wang Ye et al.'s study on the Loess Plateau (Wang et al., 2023a), highlighting the regional specificity of drought drivers in southwestern Yunnan. This discrepancy primarily stems from the fundamental differences in the climatic systems of the two regions: the Yellow River Source Region is predominantly governed by a continental plateau climate, whereas Baoshan City is profoundly influenced by the synergistic effects of the Southwest Monsoon and plateau mountain climate. The delayed retreat timing and intensity variations of the monsoon exert a particularly significant impact on autumn drought conditions in Baoshan City.
Spatially, drought in Baoshan City exhibited a severity distribution along the “southeast-northwest” axis, with the centroid of severe drought shifting northwestward, indicating a gradual intensification of drought in that direction. Results from the Geodetector model identified elevation as the dominant factor explaining the spatial differentiation of TVDI (q-values: 2010 = 0.648, 2015 = 0.721, 2020 = 0.684). This aligns with the conclusions of Wang et al. in the Loess Plateau, where elevation was also a primary driver of spatial drought heterogeneity (q > 0.3) (Jiang et al., 2021). However, the interaction between elevation and precipitation in Baoshan in 2010 yielded a remarkably high explanatory power for TVDI (q = 0.718), far exceeding values observed in the Loess Plateau, reflecting the intense coupling effect between topography and monsoon circulation in southwestern Yunnan. Specifically, Baoshan City is situated in the southern segment of the Hengduan Mountains, where its complex mountainous terrain strongly blocks and lifts the moisture transport of the Southwest Monsoon, thereby inducing a more pronounced orographic rain shadow effect. This mechanism is fundamentally distinct from the relatively gentle loess hills of the Loess Plateau, which exhibit a comparatively weaker obstructive influence on moisture flow. Furthermore, areas of high TVDI values in Baoshan significantly overlapped with zones where the proportion of sloping cropland exceeded 35%, indicating that the expansion of multiple cropping indices has exacerbated water stress. This finding resonates with the impact of agricultural activities on drought identified by Jiang et al. (2021) in Heilongjiang. Nonetheless, the indirect influence of cascading hydropower development on drought patterns in Baoshan constitutes a unique “natural-engineering” dual driver characteristic specific to this region.
The dominant drivers of drought in Baoshan City shifted from the “Precipitation ∩ DEM” interaction in 2010 to the “DEM ∩ Soil Type” interaction in 2020. Concurrently, the explanatory power of socio-economic factors (GDP, Population Density) remained consistently weak. This contrasts with findings from a national-scale study of TVDI changes in China over the past 2 decades, which reported that “the largest area of TVDI variation was simultaneously influenced by precipitation and temperature” (Liu et al., 2023), thereby highlighting the primacy of natural drivers in shaping Baoshan’s drought patterns. This finding further validates the north-south divergence in drought driving mechanisms across China: northern regions (e.g., the Loess Plateau, Northeast Plain) are subject to more pronounced disturbances from human activities, whereas southwestern mountainous areas, despite increasing anthropogenic intensity, maintain drought patterns primarily controlled by natural factors (topography, climate), highlighting the deterministic role of the geographical environmental foundation in shaping drought response modes. However, the transient increase in the interaction strength of socio-economic factors in 2015 suggests a phasic fluctuation in human activity influence, potentially linked to specific periods of land use policy, a phenomenon similarly noted by Gao et al. in their study of Qujing City (Gao et al., 2020). This suggests that in regional comparative studies, it is essential to consider not only differences in spatial scales but also the non-uniformity of human activity impacts under temporal dynamics, meaning that the driving intensity of human activities on drought may exhibit significant fluctuations across different development stages within the same region.
This study represents a significant breakthrough in the methodology for analyzing drought dynamics in the drylands of the Yunnan-Guizhou Plateau, demonstrating notable advancements compared to previous research in this region. In contrast to the simplified approach of Wu and He (2015), who employed only linear regression to analyze drought trends in central Yunnan, this study innovatively constructed an integrated analytical framework combining “trend analysis, centroid migration, transition matrices, and geographical detectors.” This framework systematically identifies drought trend types through Slope trend analysis combined with F-test significance testing, employs a centroid migration model to quantify the dynamic evolution of drought spatial patterns, and introduces the geographical detector model for the first time in studying plateau drought driving mechanisms. This comprehensive framework effectively overcomes the methodological limitations of Wang et al. (2023b) in their drought research on the Yunnan Plateau. By precisely quantifying the explanatory power of each factor through the q-statistic, the study found that the elevation factor consistently achieved q-values above 0.64, significantly exceeding other factors. This finding revises the conventional understanding of Xiao X.Y. et al. (2015), who emphasized soil factors as dominant in the Southwest Karst region. More importantly, through interaction detection, the study revealed that the interaction between elevation and precipitation reached 0.718 in 2010, while by 2015, the interaction between elevation and soil type surged to 0.762, uncovering the temporal variability of driving mechanisms. This discovery deepens the understanding of Wang J.C. (2024) regarding plateau drought driving mechanisms. Compared to the approach of Lan and Yan (2024), who focused solely on climatic factors in Yunnan drought research, this study utilized transition matrix analysis to reveal conversion patterns between different drought severity levels. It found that the proportion of drought transitioning to severe drought decreased from 56.00% (2010–2017) to 41.82% (2017–2024), while transition to mild drought increased from 43.81% to 58.02%. These statistical findings provide new evidence for understanding drought evolution patterns on the plateau. Compared to drought studies conducted in regions such as the Loess Plateau (Yin, 2025), this study, through coupled centroid migration and geographical detector analysis, reveals the unique “natural-engineering” dual driving characteristics of Baoshan City as a typical area of the southwestern Yunnan Plateau, offering new analytical perspectives for understanding drought formation mechanisms in its specialized agricultural zones (e.g., tobacco cultivation). These methodological innovations and mechanistic revelations provide a new theoretical basis and research paradigm for constructing drought monitoring and early warning models applicable to complex terrain regions.
This study recognizes that Baoshan City, as a tobacco-growing area, experiences potential impacts from the water demand characteristics of this high-value cash crop on regional water balance and TVDI-represented drought conditions. Tobacco, as a water-sensitive crop with high water requirements throughout its long growing season, may lead to concentrated agricultural water consumption during specific periods (e.g., post-transplantation and rapid growth stages). This could exacerbate local water stress and potentially elevate TVDI values during the growing season to some extent.
4.3 Limitations of the study
Although this study provides a systematic analysis of drought dynamics in Baoshan City based on the TVDI, several limitations should be acknowledged. First, as a drought monitoring indicator derived from optical remote sensing, the inversion accuracy of TVDI is affected by cloud cover. Although reconstruction methods such as S-G filtering were applied to the NDVI and LST data to mitigate noise, the frequent cloud cover in Baoshan City may still result in inherent gaps in raw remote sensing observations during the growing season, particularly in the rainy season. Such data gaps could introduce biases in monthly and seasonal composite TVDI values, especially during periods of persistent cloud cover coinciding with lush vegetation, potentially smoothing or obscuring short-term, intense drought fluctuations and thereby affecting the precise characterization of rapid drought response mechanisms. Future research should integrate multi-source data to alleviate the issue of cloud obstruction. Second, the TVDI primarily reflects surface soil moisture conditions and has a limited capacity to characterize deep soil moisture, particularly in mountainous areas with deep-rooted vegetation, where it may not fully capture the actual water stress experienced by ecosystems.
This study has certain limitations in quantifying the driving effects of human activities on drought. Key anthropogenic elements such as agricultural irrigation water use and the regulatory effects of hydropower projects could only be indirectly represented through spatial proxy variables like land use type and GDP, rather than utilizing actual water usage intensity and hydrological regulation data. This indirect quantification approach makes it difficult to precisely analyze the specific processes and intensity of human impacts on drought, and to decipher the driving mechanisms behind GDP growth—namely, whether water-intensive industries exacerbate water stress or water-saving measures alleviate drought conditions. Future research should incorporate high-resolution irrigation district maps and reservoir water level monitoring via remote sensing to directly quantify human water use behaviors, thereby more clearly revealing the relative contributions of natural fluctuations and human interventions to drought formation.
In assessing regional drought conditions, this study primarily relied on the Temperature Vegetation Dryness Index (TVDI) derived from NDVI and Land Surface Temperature (LST). While this index demonstrates good sensitivity to surface soil moisture variations, it possesses inherent limitations in detecting deep soil moisture. Since TVDI mainly reflects moisture conditions in the surface to shallow soil layers, it may lead to systematic underestimation of drought stress experienced by deep-rooted vegetation (such as perennial economic trees and some taproot crops) that rely on deep soil moisture. In regions like Baoshan City with complex topography and diverse vegetation types, deep soil moisture represents a crucial factor maintaining ecosystem stability. The current methodology still shows deficiencies in characterizing the overall water stress patterns, particularly in assessing actual drought risk for deep-rooted plants. Future research integrating deep soil moisture observation data would facilitate a more comprehensive evaluation of water stress conditions across different vegetation types.
Although multiple environmental factors were incorporated into this study, the consideration of vegetation type—a key factor—was insufficient. Research has shown that different vegetation types, due to variations in canopy structure and optical properties, can significantly influence TVDI inversion results. Given the diverse vegetation types in Baoshan City, neglecting this factor may lead to estimation biases in certain areas. Utilizing improved vegetation indices (e.g., EVI, MSAVI) or constructing separate feature spaces for different vegetation types could potentially enhance inversion accuracy.
The TVDI model relies on the accurate definition of the dry and wet edges, which may vary dynamically across seasons and ecosystems. Although this study analyzed a long-term time series, the determination of these edges still involves a degree of subjectivity, which could affect the precise classification of drought severity levels. While Bian et al. confirmed the reliability of the TVDI for drought monitoring in Shandong, they also highlighted that the model’s applicability across different ecological regions requires further validation.
This study, through the application of geographical detectors, has identified the dominant driving factors underlying the spatial heterogeneity of TVDI. It is crucial to emphasize that the high explanatory power (q-statistic) derived from the analysis represents a statistical association in space, which, while providing strong evidence for potential causal relationships, does not in itself constitute direct proof of causality. Establishing definitive causal mechanisms requires more in-depth investigation in future research.
While the driving factor analysis incorporated spatial representations of both natural and anthropogenic elements, it faced limitations in precisely quantifying the water volume processes associated with specific human activities such as agricultural irrigation and hydropower regulation. Their influences were largely inferred indirectly based on statistical proxy variables, which constrains a deeper understanding of the anthropogenic drivers of drought. Future research could establish a multi-source data fusion framework, integrating microwave remote sensing soil moisture products, high-resolution meteorological reanalysis datasets, and detailed water usage statistics to directly quantify human impacts. Concurrently, employing improved drought indices (e.g., TEVDI) and causal analysis methods like structural equation modeling could systematically elucidate the direct and indirect pathways through which natural and anthropogenic factors operate, thereby providing a more comprehensive revelation of drought formation mechanisms and enhancing the mechanistic understanding and predictive capability of the models.
In deeply incised mountainous terrain like that of Baoshan City, the 1-km spatial resolution of MODIS data is insufficient to accurately capture the hydrothermal differentiation induced by micro-topography. This can lead to TVDI values potentially conflating the moisture signals from heterogeneous land surfaces within a single pixel. Furthermore, the TVDI primarily reflects surface soil moisture and has a limited capacity for assessing deeper soil water content, potentially leading to an underestimation of the actual water stress experienced by deep-rooted vegetation. To address these challenges, future studies could integrate higher-resolution imagery from Landsat or Sentinel satellites to enhance the delineation of spatial details, combined with microwave remote sensing data to probe deeper soil moisture layers. Despite the declared absence of a conflict of interest, the funding source from the tobacco industry may have introduced a subtle bias in research focus, potentially leading to an underrepresentation of tobacco-specific agricultural impacts in the drought analysis.
The findings of this study provide profound insights into the unique patterns of drought evolution in the topographically complex area of western Yunnan’s Baoshan City. However, the generalizability of these conclusions across broader spatial scales requires further verification due to the lack of systematic comparison with other ecological units within the Yunnan-Guizhou Plateau or typical arid regions across China. This limitation somewhat restricts the broader applicability and impact of the research findings. Future work should aim to construct a cross-regional comparative analytical framework to extract more universally applicable drought driving mechanisms, thereby enhancing the breadth and influence of the research outcomes.
5 Conclusion
Based on MODIS NDVI and LST data, this study calculated the monthly Temperature Vegetation Dryness Index (TVDI) for Baoshan City from 2010 to 2024. Using this index, an analysis of the spatiotemporal evolution patterns and driving factors was conducted, yielding the following key findings:
1. Given that over 80% of the study area is affected by moderate to severe drought and the interannual TVDI shows an increasing trend, drought prevention and control should be elevated to a core task for regional ecological security, with comprehensive dynamic drought monitoring implemented across the entire region.
2. The northwestward migration of the drought centroid by 1.28 km, coupled with the significant intensification of autumn drought at a rate of 0.0244 a−1, necessitates prioritized deployment of drought resistance infrastructure in northwestern counties (such as western Longyang District and Shidian) and the development of water-saving irrigation schedules specifically for autumn crops.
3. Although elevation (q > 0.64) remains the dominant factor controlling drought spatial differentiation, the notable surge in human activity influence in 2015 (interaction q > 0.75) highlights the need for strict regulation of hydropower operation and slope farmland expansion alongside ongoing ecological restoration, to mitigate the phased amplification effect of anthropogenic activities on drought.
Data availability statement
The raw data supporting the conclusions of this article will be made available by the authors, without undue reservation.
Author contributions
YL: Writing – original draft, Methodology, Writing – review and editing. HZ: Funding acquisition, Resources, Writing – original draft, Writing – review and editing. HoL: Methodology, Writing – original draft. LZ: Software, Writing – review and editing. HaL: Formal Analysis, Writing – review and editing. ZH: Validation, Writing – review and editing. RZ: Visualization, Writing – review and editing.
Funding
The authors declare that financial support was received for the research and/or publication of this article. This work was supported by the China Tobacco Corporation Key R&D Project Plan (grant number: 110202402014) and the Science and Technology Plan Project of Yunnan Tobacco Company Baoshan Company (grant number: 2024530000242004).
Acknowledgements
This paper was supported by the team of the Shandong University of Technology. The project was funded by Huihui Zhao.
Conflict of interest
Authors YL, HoL, HaL, and ZH were employed by Yunnan Tobacco Company Baoshan Company.
Author LZ was employed by Honghe Company, Yunnan Tobacco Company.
The remaining authors declare that the research was conducted in the absence of any commercial or financial relationships that could be construed as a potential conflict of interest.
The authors declare that this study received funding from Yunnan Tobacco Company Baoshan Company. The funder had the follow involvement in the study: Study design, data collection and analysis.
Generative AI statement
The authors declare that no Generative AI was used in the creation of this manuscript.
Any alternative text (alt text) provided alongside figures in this article has been generated by Frontiers with the support of artificial intelligence and reasonable efforts have been made to ensure accuracy, including review by the authors wherever possible. If you identify any issues, please contact us.
Publisher’s note
All claims expressed in this article are solely those of the authors and do not necessarily represent those of their affiliated organizations, or those of the publisher, the editors and the reviewers. Any product that may be evaluated in this article, or claim that may be made by its manufacturer, is not guaranteed or endorsed by the publisher.
References
Arora, A. (2025). From Oceanic reorganization to orographic extremes: the role of Arabian Sea dynamics in reshaping Indian monsoon variability since 1990. Glob. Planet. Change 256, 105181. doi:10.1016/j.gloplacha.2025.105181
Bonferroni, C. (1936). Teoria Statistica delle Classi e Calcolo delle Probabilita, 8. Pubblicazioni del R Istituto Superiore di Scienze Economiche e Commericiali di Firenze, Firenze, Italy. 3–62.
Chen, L. H., and He, D. M. (2000). The ecological impacts of hydropower Cascade development in lancang-mekong river. Acta Geogr. Sin. (5), 577–586. doi:10.11821/xb200005007
Chen, Z. F., Li, J., Xiang, B., Duan, Q. S., Li, S. F., and Wang, S. F. (2023). Spatiotemporal variation of drought in Yunnan province calculated using the standardized precipitation index. J. Irrig. Drain. Eng. 42, 92–99. doi:10.13522/j.cnki.ggps.2022250
Chen, G. J., Fang, N., Li, J. F., Wu, X. H., and Dong, X. Y. (2024). Spatiotemporal variation and drivers of drought based on TVDI in the lower reaches of the jinsha river. J. Resour. Ecol. 15, 44–54. doi:10.5814/j.issn.1674-764x.2024.01.004
Cheng, X. Q., Zhou, Z. Y., Li, W. P., Shangguan, D. H., Wang, X. X., Zhang, X. X., et al. (2022). Monitoring drought situation and analyzing influencing factors in central Asia using MODIS data. Trans. Chin. Soc. Agric. Eng. 38, 128–137. doi:10.11975/j.issn.1002-6819.2022.10.016
Degu, A. M., Hossain, F., Niyogi, D., Sr, R. P., Shepherd, J. M., Voisin, N., et al. (2011). The influence of large dams on surrounding climate and precipitation patterns. Geophys. Res. Lett. 38, L04405. doi:10.1029/2010GL046482
Fan, H., Dang, X. H., Zhao, J. Y., Wang, X. X., Cheng, X. Q., and Lin, Q. R. (2024). Temporal and spatial variation of drought in northwest arid region based on temperature vegetation drought index. Sci. Technol. Eng. 24, 11537–11546. doi:10.12404/j.issn.1671-1815.2400342
Fu, J. X., Cao, G. C., and Guo, W. J. (2020). Changes of growing season NDVI at different elevations, slopes, slope aspects and its relationship with meteorological factors in the southern slope of the qilian Mountains, China from 1998 to 2017. Chin. J. Appl. Ecol. 31, 1203–1212. doi:10.13287/j.1001-9332.202004.018
Gao, Y., Wang, X. F., Gao, M. F., Huang, S., Li, S. L., and Leng, P. (2020). Drought monitoring in qujing based on temperature vegetation drought index. Chin. Agric. Sci. Bull. 36, 37–45. doi:10.11924/j.issn.1000-6850.casb18110107
Jia, J., Zhang, Z. S., Jiang, E. H., Tian, S. M., Chang, J. Y., Xia, M., et al. (2025). Dynamics of ecosystem patterns in the Henan section of the yellow river basin from 1980 to 2020. J. Saf. Environ. 25, 2835–2845. doi:10.13637/j.issn.1009-6094.2024.0772
Jiang, L. Q., Wang, Q., Jiang, L. X., Gong, L. J., Li, X. F., Zhang, H. C., et al. (2021). Temperature vegetation dryness index and its application in agricultural drought monitoring. Chin. Agric. Sci. Bull. 37, 132–139. doi:10.11924/j.issn.1000-6850.casb2021-0011
Jin, Y., Kuang, X. Y., Yan, H. M., Wan, Y. X., and Wang, P. (2018). Studies on distribution characteristics and variation trend of the regional drought events over Yunnan in recent 55 years. Meteorol. Mon. 44, 1169–1178. doi:10.7519/j.issn.1000-0526.2018.09.005
Kang, W. M., Luo, Y. X., Zheng, X. B., and Chen, J. (2008). The characteristic of temperature/vegetation drought Index(TVDI) and its application in remote sensing drought monitoring in Guizhou. Guizhou Agric. Sci. 37, 27–30. doi:10.3969/j.issn.1001-3601.2008.04.011
Lan, T. Q., and Yan, X. D. (2024). Analysis of drought characteristics and causes in Yunnan province in the last 60 years (1961-2020). J. Hydrometeorol. 25, 177–190. doi:10.1175/JHM-D-23-0092.1
Li, Y., Xie, Z., Qin, Y., Hao, X., Zheng, Z., Zhang, L., et al. (2019). Drought under global warming and climate change: an empirical study of the loess Plateau. Sustainability 11 (5), 1281. doi:10.3390/su11051281
Li, W. Q., Zhao, Y., Liu, Z., He, G. H., and Qin, C. H. (2024). Characteristics of agricultural drought and its influencing factors in the loess tableland of the north of the wei river from 2001—2020. J. Water resour. Water Eng. 35, 1–10+19. doi:10.117057/j.issn.1672-643X.2024.05.01
Li, X. P., Li, K., Lei, S., Jia, F. G., and Xu, J. (2025). Spatiotemporal variations in drought conditions in Xinjiang based on TVDI. Arid. Zone Res. 42, 589–599. doi:10.13866/j.azr.2025.04.02
Liu, X., Song, X. N., Leng, P., and Xia, L. (2019). Spatiotemporal variation of drought conditions based on MODIS data over the source area of yellow river. J. Univ. Chin. Acad. Sci. 36, 178–187. doi:10.7523/j.issn.2095-6134.2019.02.005
Liu, G. P., Fan, J. J., Zhao, Y. F., Liu, Y., and Tian, J. Q. (2023). Analysis on the spatiotemporal variation characteristics and influencing factors of China's TVDI in the past 20 years. Agric. Technol. Equip. 39, 39–44. doi:10.3969/j.issn.1673-887X.2023.03.014
Madolli, M. J., Gade, S. A., Gupta, V., Chakraborty, A., Cha-um, S., Datta, A., et al. (2025). A systematic review on rainfall patterns of Thailand: insights into variability and its relationship with ENSO and IOD. Earth-Sci. Rev. 264, 105102. doi:10.1016/j.earscirev.2025.105102
Pan, F., He, D. M., Cao, J., and Lu, Y. (2023). Multiple branches of water vapor transport over the nujiang river basin in summer and its impact on precipitation. Acta Geogr. Sin. 78, 87–100. doi:10.11821/dlxb202301006
Przeździecki, K., Zawadzki, J. J., Urbaniak, M., Ziemblinska, K., and Miatkowski, Z. (2023). Using temporal variability of land surface temperature and normalized vegetation index to estimate soil moisture condition on forest areas by means of remote sensing. Ecol. Indic. 148, 110088. doi:10.1016/j.ecolind.2023.110088
Qiu, S. Q., Xu, Y., Xu, Y. Q., Zhao, X. X., Long, L. H., Ji, D. B., et al. (2022). Spatio-temporal variations characteristics and differences of water temperature in upper and middle reaches of lancang-nujiang river. Resour. Environ. Yangtze Basin 31, 2186–2196. doi:10.11870/cjlyzyyhj202210008
Rwambo, I., Fan, Y., Yu, P., Chu, C. Y., Nyasulu, M., and King'uza, P. (2025). Interannual variability of short rains in Tanzania and the influences from ENSO and the Indian Ocean dipole. Atmos. Ocean. Sci. Lett. 18, 100614. doi:10.1016/j.aosl.2025.100614
Sandholt, I., Rasmussen, K., and Andersen, J. (2002). A simple interpretation of the surface temperature/vegetation index space for assessment of surface moisture status. Remote Sens. Environ. 79, 213–224. doi:10.1016/S0034-4257(01)00274-7
Sha, S., Guo, N., Li, Y. H., Han, T., and Zhao, Y. X. (2014). Introduction of application of temperature vegetation dryness index in China. J. Arid. Meteorol. 32, 128–134. doi:10.11755/j.issn.1006-7639(2014)-01-0128
Taati, L., Sunardi, S., Syauqiah, I., and Jauhari, A. (2024). Assessing drought risk in forest zones near coal mines with TVDI. J. Appl. Data Sci. 5, 559–570. doi:10.47738/jads.v5i2.220
Tadesse, S., and Mekuriaw, A. (2024). Agroecology-based analysis of meteorological and agricultural drought using time series remote sensing data in the upper gelana watershed, Ethiopia. Geocarto Int. 39, 2417881. doi:10.1080/10106049.2024.2417881
Wang, J. C. (2024). Spatio-temporal variation characteristics and prediction of drought under climate change in Sichuan Province. Ya'an, Sichuan, China: Sichuan Agricultural University.
Wang, J. F., and Xu, C. D. (2017). Geodetector: principle and prospective. Acta Geogr. Sin. 72, 116–134. doi:10.11821/dlxb201701010
Wang, Y., Shi, H. J., Jiang, Y. M., Wu, Y. F., Gao, Y., and Ding, C. Q. (2023a). Spatio-temporal variation of drought characteristics and its influencing factors in loess Plateau based on TVDI. Trans. Chin. Soc. Agric. Mach. 54, 184–195. doi:10.6041/j.issn.1000-1298.2023.07.018
Wang, Y., Wang, J. Y., Feng, R., Li, J. N., Wu, J. W., Xu, C. H., et al. (2023b). Drought monitoring method in northeast China based on FY-3D/MERSI data. Agric. Res. Arid. Areas 41, 289–297+317. doi:10.7606/j.issn.1000-7601.2023.04.30
Wei, X. D., Yang, J., Luo, P. P., Lin, L. G., Lin, K. L., and Guan, J. M. (2022). Assessment of the variation and influencing factors of vegetation NPP and carbon sink capacity under different natural conditions. Ecol. Indic. 138, 108834. doi:10.1016/j.ecolind.2022.108834
Wu, Z. J., and He, Y. L. (2015). Temporal and spatial variation of droughts over the central Yunnan Plateau based on SPEI. Resour. Environ. Yangtze Basin 24, 1238–1245. doi:10.11870/cjlyzyyhj201507022
Xiao, X. Y., Liu, F., Yao, B., and Shu, Y. G. (2015). Research progress of soil moisture in karst areas of southwest China. J. Yunnan Agric. Univ. Nat. Sci. 30, 958–964. doi:10.16211/j.issn.1004-390X(n).2015.06.020
Yang, J. C., and Guo, B. (2025). Analysis of spatial and temporal variation patterns of long-term precipitation in China from 1901 to 2022. Acta Ecol. Sin. 45, 5853–5870. doi:10.20103/j.stxb.202406041294
Yin, J., and Slater, L. J. E. (2023). Increase in drought–heatwave events worsens socio-economic productivity and carbon uptake. Nat. Sustain. 6, 241–242. doi:10.1038/s41893-022-01026-z
Yin, B. S. (2025). Spatiotemporal evolution characteristics of drought and vegetation phenology response to drought in the Loess Plateau. Xianyang, Shaanxi, China: Northwest A&F University. doi:10.27409/d.cnki.gxbnu.2025.001247
Yin, B. S., Li, Z. F., Yue, R., Lv, S. H., and Li, F. L. (2024). Monitoring drought in guanzhong areas using temperature-vegetation drought index. Trans. Chin. Soc. Agric. Eng. 40, 111–119. doi:10.11975/j.issn.1002-6819.202401219
Yu, J. L., Luo, Y., Zhao, Z. L., Yang, Y. Y., and Luo, X. Q. (2019). Drought monitor in karst gorge area based on Landsat-8 and TVDI. Bull. Soil Water Conserv. 39, 589–599. doi:10.13961/j.cnki.stbctb.2019.01.017
Zhang, Z. X., Cui, J., Guo, W. T., and Xiao, Y. (2023). Drought monitoring and spatiotemporal changes analysis in north China plain based on temperature vegetation dryness index. J. Agric. Big Data. 5, 95–107. doi:10.19788/j.issn.2096-6369.230118
Keywords: Baoshan City, centroid, geographical detector, trend analysis, TVDI
Citation: Lin Y, Zhao H, Liu H, Zhao L, Li H, Hu Z and Zhang R (2025) Change patterns and dominant factors of drought in Baoshan City during 2010–2024. Front. Environ. Sci. 13:1731437. doi: 10.3389/fenvs.2025.1731437
Received: 24 October 2025; Accepted: 26 November 2025;
Published: 19 December 2025.
Edited by:
Yuanfang Chai, Zhejiang Normal University, ChinaReviewed by:
Mohamed E. Fadl, National Authority for Remote Sensing and Space Sciences, EgyptHadi Siasar, Payame Noor University, Iran
Copyright © 2025 Lin, Zhao, Liu, Zhao, Li, Hu and Zhang. This is an open-access article distributed under the terms of the Creative Commons Attribution License (CC BY). The use, distribution or reproduction in other forums is permitted, provided the original author(s) and the copyright owner(s) are credited and that the original publication in this journal is cited, in accordance with accepted academic practice. No use, distribution or reproduction is permitted which does not comply with these terms.
*Correspondence: Huihui Zhao, emhhb2hoQHJhZGkuYWMuY24=; Runze Zhang, cnVuemUxMDIyOEAxNjMuY29t