 Khadeijah Yahya Faqeih1*
 Somayah Moshrif Alamri1
 Eman Rafi Alamery1
 Maha Abdullah Aldubehi1Omar Mohammed Al-Khalil2
 Mohamed E. Fadl3*
- 1Department of Geography and Environmental Sustainability, College of Humanities and Social Sciences, Princess Nourah bint Abdulrahman University, Riyadh, Saudi Arabia
- 2Department of Topographic Engineering, Faculty of Civil Engineering, Latakia University, Latakia, Syria
- 3Division of Scientific Training and Continuous Studies, National Authority for Remote Sensing and Space Sciences (NARSS), Cairo, Egypt
Introduction: This study investigates the relationship between land use/land cover (LULC) changes and land surface temperature (LST) dynamics in Al-Khobar, Saudi Arabia, a rapidly urbanizing desert city, from 1999 to 2024. The research addresses the critical need to understand urban thermal environment changes driven by anthropogenic modification in arid regions.
Methods: The analysis utilized Landsat satellite imagery. LULC changes were quantified using post-classification comparison and spectral indices, including the Normalized Difference Vegetation Index (NDVI), Normalized Difference Built-up Index (NDBI), Normalized Difference Water Index (NDWI), and Barren Soil Index (BSI). LST was retrieved using a radiative transfer equation. Statistical correlation analyses were performed to examine the relationships between these spectral indices and LST for the study years.
Results: Significant LULC transformations were observed: urban area increased by 71.5%, while barren land decreased by 50.6%. Vegetation cover grew by 12.4%, and water bodies shrank by 20.1%. Concurrently, the average LST rose from 40.2°C to 42.5°C. Correlation analyses revealed: 1) a strong positive correlation between NDBI and LST, with NDBI increasing from 0.395 to 0.635; 2) a consistent positive correlation between NDVI and LST, challenging the typical cooling paradigm; 3) a strong negative correlation between NDWI and LST, with NDWI declining from 0.518 to 0.294; and 4) a negative correlation between BSI and LST, with BSI decreasing from 0.374 to 0.267.
Discussion: The results identify urban expansion (indicated by NDBI) as the primary driver of surface heating. The positive NDVI-LST correlation suggests that the cooling efficacy of irrigated urban greenery in arid settings can be compromised by the surrounding heat-retaining built-up matrix. The strong negative NDWI-LST correlation underscores the disproportionate cooling importance of water bodies, whose decline contributed to warming. The findings provide an evidence-based refinement of LULC-LST dynamics for arid environments, concluding that sustainable urban planning in desert cities must prioritize water body conservation, mandate high-albedo materials, and re-evaluate greening strategies based on proven cooling efficacy rather than mere area coverage.
1 Introduction
Global cities are undergoing rapid urbanization characterized by unprecedented urban sprawl, leading to significant alterations of the urban landscape and increased pressure on natural ecosystems, infrastructure (He et al., 2018; Hoelscher and Aijaz, 2016; Wei and Ewing, 2018). A primary consequence of this expansion is the replacement of permeable surfaces and green spaces with impervious built-up areas, which fundamentally alters the land’s thermal properties (Ng et al., 2011; Scolozzi and Geneletti, 2012; Sharma et al., 2013). These Land Use/Land Cover (LULC) changes are a primary driver of elevated Land Surface Temperature (LST) and the Urban Heat Island (UHI) effect, where urban areas experience significantly higher temperatures than their rural surroundings (Bendib et al., 2017; Govind and Ramesh, 2019). As a critical indicator of urban environmental conditions, LST significantly influences energy consumption, public health, water demand, and overall ecosystem health (Raynolds et al., 2008; Weng and Lu, 2008), with these changes directly attributed to human activities that modify the Earth’s surface characteristics (Hokao et al., 2012). The relationship between LULC and LST has been extensively documented across diverse geographical and climatic contexts. For instance, studies in the Himalayan region of Pakistan (Ullah et al., 2019), Washington, D.C. (Zhou et al., 2017), and the Osaka metropolitan area (Estoque et al., 2017) have consistently shown that urban composition and density significantly influence temperature patterns. While some studies, such as in Jeddah, Saudi Arabia (Almazroui et al., 2017), have reported a limited effect of urban sprawl on LST, the overarching global consensus confirms the thermal impact of urbanization. Similarly, research in major Chinese cities (Peng et al., 2012) and Shanghai (Wang et al., 2017) has confirmed that urban expansion leads to substantial increases in LST. A consistent finding across many of these studies, including in Pakistani cities (Waleed and Sajjad, 2023), s the strong negative correlation between vegetation cover (NDVI) and LST, reinforcing the paradigm of vegetation as a primary cooling agent.
Recent investigations continue to underscore the profound impacts of LULC changes on thermal environments. In the Nile Delta, significant warming trends have been linked to LULC changes, with a strong negative correlation between nighttime LST and vegetation (NDVI) highlighting the role of greenery in mitigating urban heat island (UHI) (Nahas et al., 2025) Similarly, in Pakistan’s Punjab region, agricultural expansion and declining rangelands have been accompanied by rising temperatures (Feng et al., 2025).
Rapid settlement expansion in cities such as; Bhairab, Bangladesh (Saha et al., 2024), and Lahore, Pakistan (Irshad et al., 2024), has intensified local UHI effects, while studies in Africa and the Middle East, such as in Egypt’s Sharqiyah Governorate (Fahmy et al., 2023) and Ilorin, Nigeria (Njoku and Tenenbaum, 2022) have documented substantial LST rises directly correlated with built-up area expansion. Historically, measuring LST relied on costly and complex field data (Rehman et al., 2015). However, advancements in remote sensing (RS) now provide an effective alternative. RS techniques enable the linkage of LST to LULC changes and facilitate long-term climate change assessments by integrating spatial data from various satellites (Kothe et al., 2019). Among these systems, Landsat satellites, with their systematic revisit cycles and high-resolution imagery, are particularly valuable for monitoring urban thermal environments (Chastain et al., 2019; Li et al., 2012; Sobrino et al., 2012). While the vast majority of this research has focused on large metropolises or temperate climates, a significant gap remains in understanding the specific dynamics of rapidly growing cities in arid regions.
While the relationship between LULC changes and LST is well-documented globally, its specific manifestations in hyper-arid urban environments reveal critical nuances that require further contextual investigation. Extensive research in Saudi Arabia and the Gulf Cooperation Council (GCC), such as in Tabuk city (Albalawi, 2020), Jeddah (Almazroui et al., 2017), and other Gulf metropolises (Dahy et al., 2024; Mansour et al., 2022), has established the broad pattern of urban expansion driving elevated temperatures. Many of these studies, along with global models, report the expected strong negative correlation between vegetation (NDVI) and LST, reinforcing a universal cooling paradigm (Siqi and Yuhong, 2020; Waleed and Sajjad, 2023).
However, a growing body of evidence suggests that in hyper-arid cities, where vegetation is often sparse, sustained by intensive irrigation, and embedded within a vast heat-retaining built environment, this relationship can be weak, non-existent, or even positive (Rengma and Yadav, 2024). The thermal role of urban greenery ismediated by factors such as; species type, irrigation efficiency, and its spatial configuration (Saha et al., 2024). Therefore, the critical question is not if vegetation cools, but under what specific conditions its cooling efficacy is realized or negated in extreme arid climates (Noroozi et al., 2024). Al-Khobar city, a rapidly developing coastal city in the Eastern Province, presents a compelling case to quantitatively investigate these subtleties. Its specific trajectory of urban growth, coupled with its extreme arid climate, offers a unique valuable context to test and refine the established LULC-LST models, moving beyond universal assumptions to provide location-specific insights (Fahmy et al., 2023).
Therefore, this study moves beyond merely replicating established methods in a new location. This study aims to: i. quantify the spatiotemporal changes in LULC and their thermal impacts in Al-Khobar city from 1999 to 2024, ii. investigate the relationships between key spectral indices (NDVI, NDBI, NDWI, BSI) and LST within this hyper-arid urban context, and iii. assess the relationship between NDVI and LST and decipher the influences of built-up areas, water bodies, and barren lands on the city’s thermal environment. The findings are expected to provide critical, evidence-based insights that refine the application of universal models and inform more effective, climate-resilient urban planning for desert cities.
2 Materials and methods
2.1 Description of the study area
Al-Khobar city, a primary coastal city in the Eastern Province of Saudi Arabia, was selected as the study area due to its significant urban and industrial growth over recent decades and one of the Kingdom’s most rapidly urbanizing centers. This exceptional growth is driven by its strategic role as a major industrial and commercial hub within the Dhahran-Dammam-Khobar tri-city metropolitan area, a cornerstone of the nation’s energy economy. Given the city’s rapid expansion, it is crucial to examine the impact of this growth on the local environment, particularly the LST. This extent encompasses the core urban fabric of Al-Khobar city, its industrial zones, and surrounding peripheral lands, providing a comprehensive view of the city’s spatiotemporal development. Statistical evidence underscores the city’s rapid transformation. According to data from the Saudi General Authority for Statistics, the population of the Eastern Province, where Al-Khobar city is a key urban node, grew by over 25% between 2010 and 2022, a rate significantly higher than the national average (Central Department of Statistics and information (CDSI), http://www.cdsi.gov.sa http://www.cdsi.gov.sa/yb46/Pages/MixFPage, accessed on 20 August 2024). This population influx has directly fueled extensive physical expansion. A recent study by Alqahtany et al., 2022; AlQahtany et al., 2022) on urban sprawl in Saudi cities identified the Dammam Metropolitan Area, which includes Al-Khobar city, as having one of the highest rates of land consumption per capita and urban sprawl index values among Saudi megacities. Furthermore, research by Rahman, 2016; Rahman, 2016) specifically documented a 40% increase in Al-Khobar’s built-up area between 1990 and 2013 alone, a trend that has continued unabated, making it an exemplary site for studying the environmental impacts of accelerated urbanization in an arid climate. Geographically, Al-Khobar city is located between 26.10°N and 26.30°N and 50.10°E to 50.30°E, and the study area was defined by the administrative boundary of the urban fabric of Al-Khobar city, covering a total area of 256 km2 (Figure 1). The climate is characterized as a hot desert (BWh according to the Köppen climate classification), featuring intensely hot and humid summers with temperatures often exceeding 40 °C and mild, dry winters with temperatures ranging from 15 °C to 20 °C (World Weather and Climate Information, http://www.weather-and-climate.com/average-monthly-Rainfall-Temperature-Sunshine,al-khobar,Saudi-Arabia, accessed on 20 August 2024). The terrain is relatively flat, with an average elevation of 12 m above sea level, gently sloping towards the Gulf coastline. Land use and land cover in Al-Khobar city are diverse and have undergone substantial transformation. The dominant feature is the urban areas, comprising residential neighborhoods, commercial districts, and extensive road networks, which have expanded significantly due to rapid development. Other notable land cover classes include industrial zones, limited agricultural land and gardens on the northern peripheries, water bodies along the coast, and open barren lands, which have been the primary source for urban encroachment.

Figure 1. Location map of Al-Khobar city.
2.2 Data acquisition
To ensure temporal comparability, anniversary Landsat images were acquired for 1999 (Landsat 5 TM, Path/Row: 165/045, Date: August 7) and 2024 (Landsat 8 OLI/TIRS, Path/Row: 165/045, Date: July 12) from the USGS Earth Explorer portal (https://earthexplorer.usgs.gov/) operated by the U.S. Geological Survey (USGS), as shown in Tables 1, 2. Both scenes were cloud-free over the study area. The images were radiometrically and atmospherically corrected using standard procedures. All reflective and thermal bands were resampled to a consistent 30-m spatial resolution to facilitate multi-temporal analysis and integration.

Table 1. Key spectral bands of Landsat-5 (TM, 1999) imagery.
Table 2. Key spectral bands of Landsat 8 (OLI, 2024) imagery.
2.3 Supervised classification procedure
The supervised classification process using the Maximum Likelihood Classifier (MLC) involved the following steps.
2.4 Selection of training classes and data
Four land cover classes were identified within the study area through visual interpretation of the satellite imagery, aided by an existing reference land cover map. The classes were: urban areas (built-up, residential areas and road networks), water (water bodies), open areas (bare lands), and vegetation areas (agriculture lands and gardens) as represent in Table 3 and Figure 4. For each class, representative training sites (polygons) were digitized. Pixels within these polygons were selected as training data. The key criteria for selecting training sites were uniformity (spectral homogeneity within the polygon) and representativeness (the ability to capture the spectral variability of the class across the entire image) (Campbell and Wynne, 2011).

Table 3. Land use/land cover classes adopted in the study.
2.5 Evaluation of class separability
The quality of the training data was quantitatively assessed using the Jeffries-Matusita (JM) distance (Sen et al., 2019), a measure of statistical separability between two classes. For two normally distributed classes i and j, the JM distance Jij is derived from the Bhattacharyya distance (α) and is calculated as the following Equations 1, 2 (Richards and Jia, 1999):
where;
here, μi and μj are the mean vectors, and Σi and Σj are the covariance matrices for classes i and j, respectively. The JM distance ranges from 0 to 22 (approximately 1.414), with values closer to 22 indicating excellent separability. Pairs with Jij > 1.0 are generally considered acceptable for classification (Richards and Jia, 1999; Sen et al., 2022).
2.6 Maximum likelihood supervised classification
Prior to classification, a pre-processing step was applied to mask out clouds and their shadows from the image. This was achieved using a thresholding technique on the spectral properties of clouds to ensure analysis was performed only on clear-sky pixels (Ackerman et al., 1998; Ahmad and Quegan, 2012).
The individual spectral bands in each image were combined (Bands composite) for both Landsat images for the years 1999 and 2024, then the study area was extracted. Training samples were then extracted for all the LULC categories in the study, and a supervised classification was performed for both images using MLC classifier to obtain LULC maps for 1999 and 2024, and the accuracy of this classification was assessed using accuracy assessment matrix (Selmy et al., 2023). Land use and land cover changes between the study years were then detected.
The MLC is a supervised, parametric classification method based on Bayes’ theorem. It assumes that the spectral data for each class follow a multivariate normal distribution (Richards and Jia, 1999). The discriminant function gi (x) for a pixel with feature vector (x) to belong to class (i) is derived from the probability density function and is given by the following Equations 3, 4:
where; P (x∣i) is the likelihood function (probability of x given class i), P (i) is the prior probability of class i, and P(x) is the evidence (a normalization constant).
Assuming the data within each class is normally distributed, the likelihood function is given by the multivariate Gaussian distribution. In practice, it is convenient to use the discriminant function gi (x), which is the natural logarithm of the likelihood (ignoring constant terms) (Jensen, 1996):
A pixel is assigned to the class i for which the discriminant function gi (x) is maximized:
The mean vectors (μi) and covariance matrices (Σi) for each class are estimated directly from the pixel values in the training areas. In this study, equal prior probabilities P (i) were assumed for all classes.
2.7 Accuracy assessment
The performance of the MLC classification was rigorously assessed using a stratified random sampling approach to select reference pixels that were strictly independent of the training data. The sample size was determined based on established practices for land cover accuracy assessment, which recommend a minimum of 50–100 samples per land cover class to achieve a stable error matrix and a reliable estimate of overall accuracy (Fathizad et al., 2018; Jensen, 1996). To ensure statistical robustness for our four-class system and to align with common precedents in similar urban remote sensing studies (Pan et al., 2017; Rengma and Yadav, 2024), we selected 250 reference pixels per class, resulting in a total of 1,000 reference pixels for the entire study area. This sample size provides a confidence level of >95% for the estimated accuracies and ensures the Kappa coefficient is derived from a substantial and representative dataset. An error matrix (or confusion matrix) was constructed to compare the classified results against the reference (ground truth) data (Congalton and Green, 2019). From this matrix, four key accuracy metrics were derived as follows:
1. Producer’s Accuracy (PA): The probability that a reference pixel is correctly classified, measuring omission error (Equation 5).
2. User’s Accuracy (U.A.): The probability that a pixel classified on the map actually represents that class on the ground, measuring commission error (Equation 6).
3. Overall Accuracy (OA): The total percentage of correctly classified pixels (Equation 7).
4. Kappa Coefficient (κ): A statistically robust measure of agreement that accounts for the agreement occurring by chance (Lillesand et al., 2015). Kappa Coefficient (κ) was calculated using the following Equation 8:
where N is the total number of observations, k is the number of rows/columns, xii is the count in row i and column i, and xi+ and x+i are the marginal totals for row i and column i, respectively.
2.8 Spectral indices and their applications in remote sensing for land use analysis
Additionally, the spectral indices NDVI, NDBI, NDWI, and BSI were calculated to map green areas, buildings, water bodies, and bare land based on the Landsat-5 (TM) and Landsat-8 (OLI TIRS) images for 1999 and 2024, respectively. Spectral indices are mathematical equations used to extract information about the dynamics of the Earth’s surface in multispectral satellite imagery by utilizing two or more bands from different portions of the electromagnetic spectrum (Baranwal and Ahmad, 2021). The primary purpose of using these indices is to enhance and extract spectral characteristics of features in the image in order to track temporal changes (Mou et al., 2018). Numerous studies used the NDVI index for mapping and monitoring green areas from satellite imagery (Chen et al., 2015; Fadl et al., 2024; Shah and Siyal, 2019; Sonawane and Bhagat, 2017). Ideally, the values of this index range between −1 and +1, depending on the Digital Numbers (DN) of the Near-Infrared (NIR) and Red bands (Sonawane and Bhagat, 2017). Negative values, correspond to water, while low positive values (0.0–0.2) identify rocks and bare soil, while vegetation has positive values ranging from 0.2 to 1.0 with healthy vegetation has values greater than 0.4. The NDVI index is calculated using the following Equation 9:
The NDBI index is used for extracting, mapping, and monitoring built-up areas from satellite images. Built-up areas have a higher spectral reflectance in the Mid-Infrared (MIR) band, which has wavelengths ranging from approximately 1.55–1.75 μm, and the values of this index range between −1 and +1 (Xu, 2008). Positive values correspond to built-up areas, with higher values indicating a stronger presence of these areas. This index can be calculated using the following Equation 10:
The NDWI index is used to distinguish water bodies from other land features. The spectral reflectance of water is high in the Green band, with wavelengths ranging from 0.52 to 0.6 μm, and low in the Near-Infrared (NIR) band, with wavelengths ranging from 0.76 to 0.9 μm. The values of this index range between −1 and +1 (Xu, 2006), and positive values correspond to water bodies, with higher values indicating a stronger presence of water. This index can be calculated using the following Equation 11:
The Bare Soil Index (BSI) is used to distinguish non-vegetated lands, such as exposed soils or plowed agricultural lands (Chen et al., 2015). BSI can help identify areas where the soil is clearly exposed without dense vegetation cover and is commonly used in applications related to land management, environmental analysis, and agricultural monitoring to identify dry soil by distinguishing it from vegetation and water. High values indicate areas with exposed soil. This index can be calculated using the following Equation 12:
2.9 Significance and interdependence of spectral indices
The selection of NDVI, NDBI, NDWI, and BSI was deliberate tailored to the specific land cover and thermal dynamics of Al-Khobar’s arid coastal setting. In such an environment, the spectral confusion between key land cover types is pronounced, necessitating a synergistic index approach for accurate discrimination and thermal analysis. The most significant spectral confusion in arid cities occurs between built-up areas and bare soil, as both exhibit high reflectance in the Short-Wave Infrared (SWIR) region and low reflectance in the Near-Infrared (NIR). While the NDBI is highly effective at mapping impervious surfaces, it is notoriously susceptible to false positives from barren land (Noroozi et al., 2024; Rasul et al., 2018). This is precisely why the BSI is indispensable for this study. The BSI is specifically designed to enhance the spectral signature of exposed soil by integrating the blue, red, NIR, and SWIR bands (Chen et al., 2015). Using NDBI and BSI in tandem allows for a more confident separation of the newly urbanized areas (high NDBI, low BSI) from the persistent barren lands (moderate NDBI, high BSI), which is critical for accurately attributing LST changes.
The NDVI is included not because vegetation is a dominant land cover, but because its role in the urban thermal landscape of an arid city is complex and potentially counter-intuitive. Unlike in temperate regions, sparse, irrigated urban greenery in Al-Khobar city may exhibit limited evapotranspirative cooling and can be embedded within a vast heat-retaining built-up matrix. This can lead to a weak or even positive correlation with LST, a phenomenon observed in other desert cities (Ferreira and Duarte, 2019; Marzban et al., 2018). Monitoring NDVI is therefore essential for testing this atypical relationship and evaluating the true cooling efficacy of urban greening efforts in an arid climate.
Al-Khobar city location on the Arabian Gulf makes the NDWI a critical component. Water bodies are known for their strong cooling effect, but their extent and influence can be altered by coastal land reclamation and urban drainage modifications, common in rapidly developing Gulf cities (AlQahtany et al., 2022; Subraelu et al., 2022). The NDWI allows for the specific quantification of these water features, enabling a direct investigation into how the loss or preservation of aquatic areas contributes to the city’s thermal environment.
2.10 Land surface temperature (LST): a key indicator of Earth’s thermal dynamics
Land Surface Temperature (LST) is an indicator that reflects the actual temperature of the earth’s surface as measured by satellites or ground sensors. LST does not only reflect air temperature but represents the heat emitted from the surface itself, including soil, vegetation, and buildings. LST is an important indicator in environmental and climate studies, as it is associated with Land Use/Land Cover (LULC) changes, such as urbanization and deforestation (Qadri et al., 2023). LST is a key tool in assessing the impact of climate change and urban expansion and is used in studies related to the Urban Heat Island (UHI) phenomenon, where higher temperatures are recorded in urban areas compared to surrounding rural areas due to human activity. The extraction of Land Surface Temperature (LST) from the thermal bands of Landsat 5 TM and Landsat 8 TIRS was conducted through a standardized five-step process for each date (1999 and 2024). The workflow ensures a consistent and physically accurate derivation of LST values in degrees Celsius (°C).
1. Conversion of Digital Number (DN) to Spectral Radiance
The raw digital numbers (DN) from the thermal bands were first converted to Top-of-Atmosphere (TOA) spectral radiance (Lλ) using the radiance rescaling factors provided in the satellite imagery’s metadata file (MTL) for Landsat 5 TM band 6 (Equation 13) and Landsat 8 TIRS band 10 (Equation 14):
where; Lλ is the TOA spectral radiance (W·m-2·sr−1·μm−1), Qcal is the quantized calibrated pixel value (DN), Lmin and Lmax are the minimum and maximum spectral radiance values for the specific scene.
where; ML is the radiance multiplicative scaling factor (RADIANCE_MULT_BAND_x from MTL), AL is the radiance additive scaling factor (RADIANCE_ADD_BAND_x from MTL).
2. Conversion of Radiance to At-Satellite Brightness Temperature
The spectral radiance was then converted to at-satellite brightness temperature (TB) in Kelvin (K) using the Planck’s law approximation and the thermal constants specific to each satellite sensor (Equation 15).
where; TB is the effective at-satellite brightness temperature in Kelvin (K), Lλ is the TOA spectral radiance calculated in Step 1, K1 and K2 are the band-specific thermal conversion constants from the metadata (e.g., for Landsat 8 Band 10, K1 = 774.89, K2 = 1321.08).
3. Calculate Land Surface Emissivity (ϵ)
Brightness temperature (TB) is not the true LST, as it does not account for the emissivity (ϵ) of the surface. Emissivity, which varies by land cover type (e.g., water, vegetation, built-up areas), must be incorporated to retrieve the actual LST. A common method is to estimate emissivity based on the Proportion of Vegetation (Pv) derived from the NDVI (Sobrino et al., 2004; Van de Griend and Owe, 1993), as represent in the following Equations 16, 17.
where; NDVImin and NDVImax are the minimum and maximum NDVI values for the image, often set to 0.2 and 0.5 for general applications, respectively.
This empirical equation provides a mean emissivity value, where 0.986 is the emissivity of bare soil and 0.004 is a modification factor for vegetation presence.
4. Calculate Land Surface Temperature (LST) in Kelvin (K)
The widely adopted Mono-Window Algorithm [3] was used for the emissivity correction (Equation 18):
where; λ is the wavelength of emitted radiance (for Landsat 8 Band 10, λ = 10.895 μm), ρ = h⋅c/σ (where h = Planck’s constant, c = speed of light, σ = Boltzmann constant), which is approximately ρ = 14,380 for the Landsat 8 TIRS Band 10.
5. Conversion to Degrees Celsius
The final LST value in Kelvin was converted to degrees Celsius (°C) to facilitate interpretation and analysis (Equation 19).
2.11 Assessing LULC change impacts on LST using multi-temporal landsat data
In the context of calculating Land Surface Temperature (LST) from satellite imagery such as Landsat, the present research methodology focuses on analyzing multi-temporal data in order to extrapolate how much correlation between the LST and the other LULC change. The steps of the research methodology are summarized in Figure 2.

Figure 2. The methodology flowchart.
3 Results and discussion
3.1 Training data collection for accurate land use/land cover mapping
The supervised classification process employed training samples representing all major land use/land cover (LULC) classes, strategically distributed across the study area to ensure comprehensive spectral representation, following established remote sensing protocols. The MLC algorithm yielded a classification accuracy (>93%) with minimal inter-class confusion (<7%), as validated through contingency matrix analysis (Rengma and Yadav, 2024). These classifications enabled the detection of LULC changes, particularly the 71.5% urban expansion, which showed strong correlation (r > 0.7) with rising land surface temperatures through NDBI analysis, consistent with findings in other rapidly urbanizing arid regions (Wang et al., 2022), while the negative NDWI-LST correlation (r = −0.6) confirmed the critical cooling role of water bodies, whose 20.1% reduction contributed substantially to observed temperature increases, mirroring patterns observed in similar climatic contexts (Sharma et al., 2024). The overall findings align with global urban heat island research while providing specific insights into arid urban environments, where vegetation (NDVI) showed limited cooling capacity compared to temperate regions, highlighting the need for climate-adapted urban planning strategies in desert cities (Srivanit, 2013). The classes adopted in our study are listed in Table 3.
3.2 Mapping land use/land cover for 1999: a maximum likelihood classification (MLC) approach with landsat 5 (TM) image
The 1999 land use/land cover (LULC) map of Al-Khobar city was successfully generated through MLC algorithm of Landsat-5 (TM) imagery, utilizing 250 representative training samples per class that demonstrated excellent separability (>93% accuracy) with minimal inter-class confusion (<7%) as confirmed by contingency matrix analysis (Figure 3), following established remote sensing protocols (Albalawi, 2020). The classification output (Figure 4) accurately delineated four distinct LULC categories, with validation results confirming the robustness of both the training data selection and classification methodology, consistent with best practices in supervised classification of urban environments (Jozdani et al., 2019). This high classification accuracy (>93%) provides a reliable baseline for subsequent change detection analysis, particularly important for quantifying urban expansion and its thermal impacts in arid regions (Mertes et al., 2015), while the balanced sampling approach (equal samples per class) and rigorous accuracy assessment ensure statistically sound results comparable to other LULC change studies in similar climatic contexts (Phinzi et al., 2023). The results demonstrated in this classification phase establishes confidence in the derived LULC maps and their utility for detecting LULC changes and associated environmental impacts over the 25-year study period in the study region.

Figure 3. Accuracy assessment report for training samples of 1999 Landsat 5 (TM).
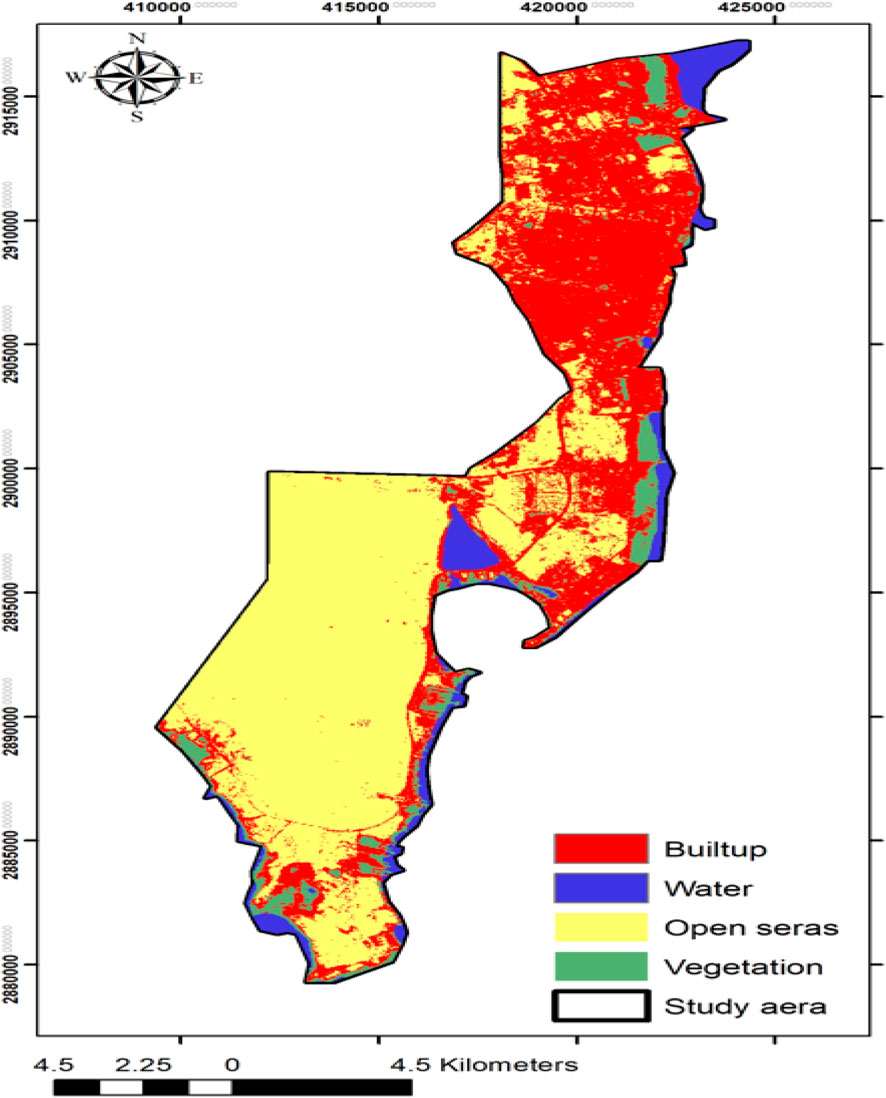
Figure 4. Landsat 5 Thematic Mapper (TM) image classification using MLC algorithm.
The classification accuracy was assessed using 100 random points measured automatically on the classified image, with 250 test points measured per class using the “Create accuracy assessment points” command in ArcGIS 10.8, and the “EQUALIZED_STRATIFIED_RANDOM” option enabled. These points were then uploaded to Google Earth after converting them to KML format and compared with the actual land classes present in the historical image from 1999. Using these points, an error matrix was generated, as shown in Table 4, which indicates that the overall accuracy of the classification reached 82%, while the Kappa coefficient value was 0.76. The Kappa coefficient value (0.76) particularly demonstrates good classification reliability, comparable to similar studies in arid urban environments (Verma et al., 2020), though slightly lower than the training sample accuracy due to inherent challenges in distinguishing spectrally similar urban and bare soil classes in desert landscapes (Abuzaid et al., 2021; Almohamad and Alshwesh, 2023). While the 82% overall accuracy meets the minimum threshold (80%) recommended for operational land cover mapping (Fathizad et al., 2018), the marginal confusion between certain classes (evident in the error matrix) suggests potential for improvement through incorporation of ancillary data or object-based classification approaches in future work, as suggested by recent advancements in urban remote sensing (Pan et al., 2017). These validation results nevertheless confirm the utility of the MLC-classified map as a reliable baseline for subsequent change detection analysis in Al-Khobar’s rapidly urbanizing landscape.

Table 4. Error matrix for the classification of the Landsat 5 (TM, 1999) image.
3.3 Land use/land cover map for 2024 mapping land use/land cover for 2024: A maximum likelihood classification (MLC) approach with Landsat-8 (OLI-TIRS) image
The 2024 land use/land cover (LULC) classification of Al-Khobar city, derived from Landsat-8 (OLI-TIRS) imagery using MLC algorithm with consistent sampling (250 samples per class), demonstrated high reliability as evidenced by the Contingency Matrix (Figure 5) showing >93% class accuracy and <7% inter-class overlap, mirroring the rigorous standards applied to the 1999 baseline map (Ganesh et al., 2023). The resulting 2024 LULC map (Figure 6) maintained classification quality comparable to the 1999 output, despite differences in sensor characteristics between Landsat-5 (TM) and Landsat-8 (OLI-TIRS), underscoring the robustness of the MLC approach for multi-temporal urban analysis (Dahiya et al., 2023). The consistent >93% training accuracy across both time periods validates the methodological continuity essential for reliable change detection, though the higher spectral resolution of Landsat-8 (11 bands vs. Landsat-5’s 7 bands) potentially enhanced class separability for certain features like impervious surfaces (Somayajula et al., 2022). These classification results establish a scientifically sound 2024 baseline that, when combined with the validated 1999 map, enables precise quantification of Al-Khobar’s urban changes over 25 years, particularly valuable for assessing urbanization impacts in arid environments where spectral confusion between built-up and bare soils presents persistent challenges (Yousif et al., 2024).
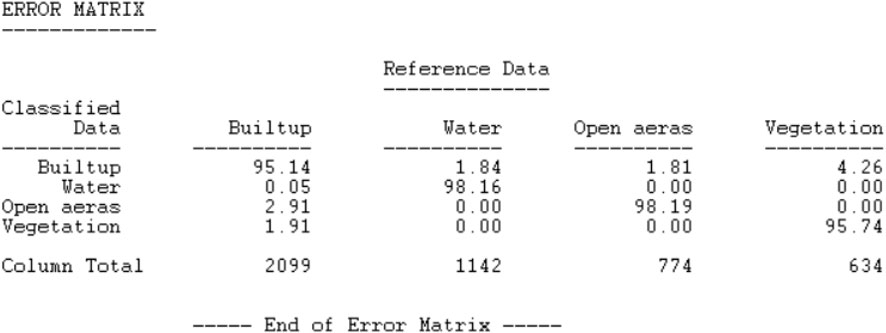
Figure 5. Accuracy assessment report for training samples of 2024 Landsat-8 (OLI-TIRS).

Figure 6. Landsat-8 Operational Land Imager (OLI) and Thermal Infrared Sensor (TIRS) image classification using MLC algorithm.
The accuracy assessment of the 2024 LULC classification demonstrated improved performance compared to the 1999 results, achieving an overall accuracy of 88% and a Kappa coefficient of 0.84 through the same rigorous validation protocol using 100 stratified random points (250 per class) (Table 5). The Kappa agreement (0.84) according to Landis and Koch, 1977; Landis and Koch, 1977) benchmarks suggests the MLC algorithm effectively handled the increased spectral information, particularly for challenging arid-region classes such as bare soil and urban areas (Guo, 2011). While the accuracy improvement aligns with expectations from sensor advancements, the persistent 12% error underscores ongoing challenges in distinguishing spectrally similar classes in desert cities (Noroozi et al., 2024), possibly mitigated in future work by incorporating thermal or texture features (Abdulraheem et al., 2023). These robust accuracy metrics (88% overall, Kappa = 0.84) validate the 2024 LULC map as a high-quality dataset for change analysis when combined with the 1999 baseline, though the differential in accuracy between epochs (88% vs. 82%) warrants consideration when interpreting change magnitudes, as recommended in multi-temporal accuracy assessment frameworks (Wan, 2020).
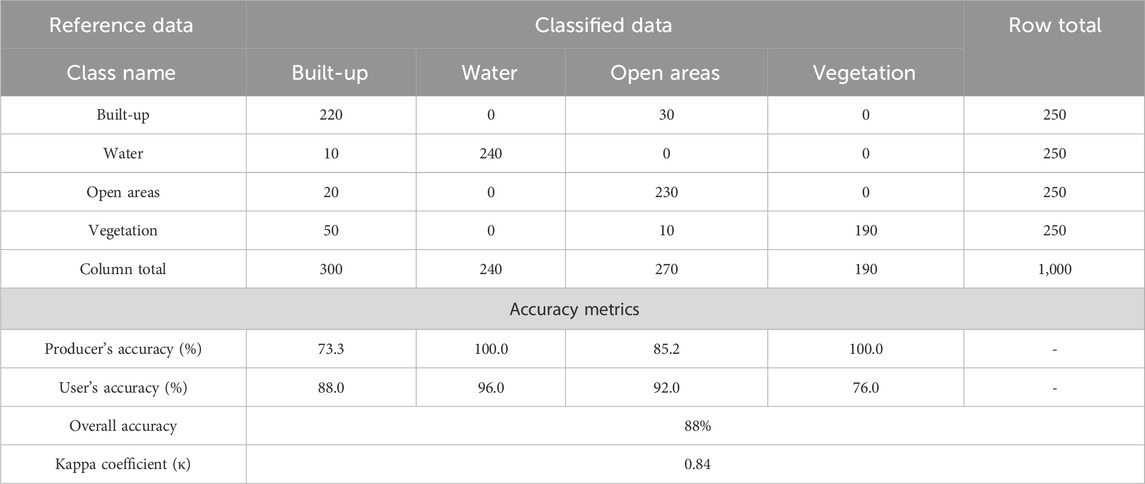
Table 5. Error matrix for the classification of the 2024 Landsat-8 (OLI-TIRS) image.
3.4 Temporal analysis of land use/land cover changes in Al-Khobar city (1999–2024)
The significant LULC changes in Al-Khobar city between 1999 and 2024 are quantified in Table 6. The most striking transformation is the 71.5% expansion of urban areas (from 71.83 km2 to 123.19 km2), reflecting rapid urbanization trends consistent with GCC cities experiencing economic growth and population influx (Dahy et al., 2024). This urban sprawl, equivalent to a net gain of 51.36 km2 at a rate of 2.05 km2/year, has occurred predominantly at the expense of open lands, which decreased by 50.6% (a net loss of 50.83 km2 at 2.03 km2/year). This patterns observation in other arid urban centers where barren lands are prime targets for conversion (Dahy et al., 2024). The 20.1% reduction in water bodies (a net loss of 1.98 km2) may be attributed to coastal land reclamation practices common in Gulf cities (AlQahtany et al., 2022) and altered hydrological patterns from urban drainage modifications (Subraelu et al., 2022). The observed 12.4% increase in vegetation cover (a net gain of 1.44 km2), while modest in absolute area, indicates a notable shift in the landscape. This change could be attributed to several factors, including increased private irrigation, or agricultural expansion on the city’s periphery, though its limited spatial extent compared to urban growth raises questions about its efficacy in mitigating urban heat island effects a challenge documented in similar desert cities (Pak and Farajzadeh, 2007).
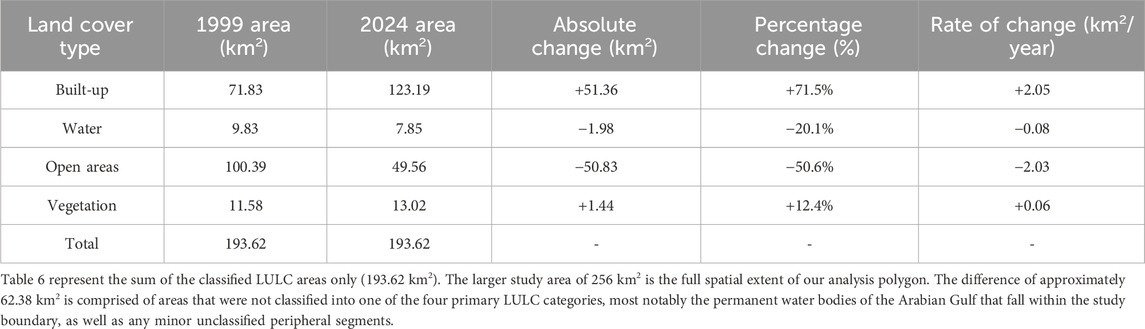
Table 6. Spatiotemporal changes in landuse/landcover classification in Al-Khobar city (1999–2024).
3.5 Multi-temporal spectral indices analysis of Al-Khobar city
The calculation of spectral indices (NDVI, NDBI, NDWI, BSI) using Landsat-5 (1999) and Landsat-8 (2024) imagery revealed not only significant statistical changes (Table 7) but also critical shifts in the spatial structure of Al-Khobar city (Figure 7). The vegetation cover (NDVI), while showing a slight statistical increase, remains spatially constrained. Higher NDVI values (1999: 0.413 to 2024: 0.498) are patchily distributed, primarily found in public parks, irrigated gardens within residential compounds, and some agricultural patches on the northern fringes. These green islands often correspond to localized cool spots within the broader LST map, but their limited and dispersed nature curtails their overall cooling influence at the city scale, and the direct, quantitative comparison of NDVI values between Landsat 5 TM and Landsat 8 (OLI) is complex due to differences in sensor spectral response functions. Nonetheless, the trend is consistent with the LULC classification showing an expansion of vegetated area (Yengoh et al., 2015). The spatial analysis of the NDBI maps clearly delineates the trajectory of urban expansion. In 1999, high NDBI values indicating built-up areas (0.395) were primarily concentrated in a compact core along the central coastline, corresponding to the historic urban center of Al-Khobar city. By 2024, a dramatic spatial expansion (0.635) is evident, with high-NDBI areas forming a nearly continuous coastal sprawl and showing significant inland and northward progression. This pattern aligns with the development of new residential and industrial zones, creating a more extensive and densely built-up urban fabric (Mansour et al., 2022). Conversely, the NDWI maps show the highest values (1999: 0.518 to 2024: 0.294), representing water bodies, consistently along the Arabian Gulf coastline. He observed statistical decline in NDWI is spatially manifested as a reduction and fragmentation of these coastal water features, likely due to land reclamation and port development, which directly contribute to the loss of these natural cooling elements (Ghosh and Das, 2018). The BSI maps effectively highlight the transition zones. The extensive areas of high BSI (bare soil) values in 1999 (0.267), dominating the inland sectors, have been substantially fragmented and replaced by the expanding high-NDBI urban class by 2024 (0.374). This spatial replacement of barren land (which has a relatively high albedo) with darker urban materials is a key driver of the observed rise in land surface temperature (Rasul et al., 2018). These index-derived findings align with the classified LULC results, collectively portraying a landscape undergoing rapid urbanization with associated environmental trade-offs: while vegetation gains demonstrate environmental awareness, their limited scale compared to urban growth (62.2% increase) and water loss (56.76% decrease) suggests potential sustainability challenges, echoing concerns raised in similar Middle Eastern urban studies (Carlucci et al., 2021).
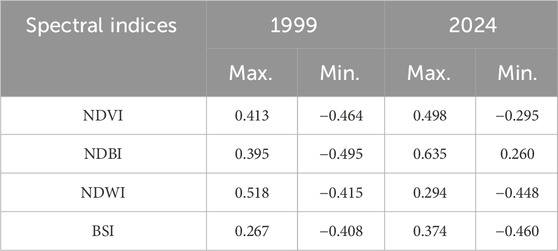
Table 7. Comparison of maximum and minimum values of spectral indices (NDVI, NDBI, NDWI, BSI) in Al-Khobar city between 1999 and 2024.
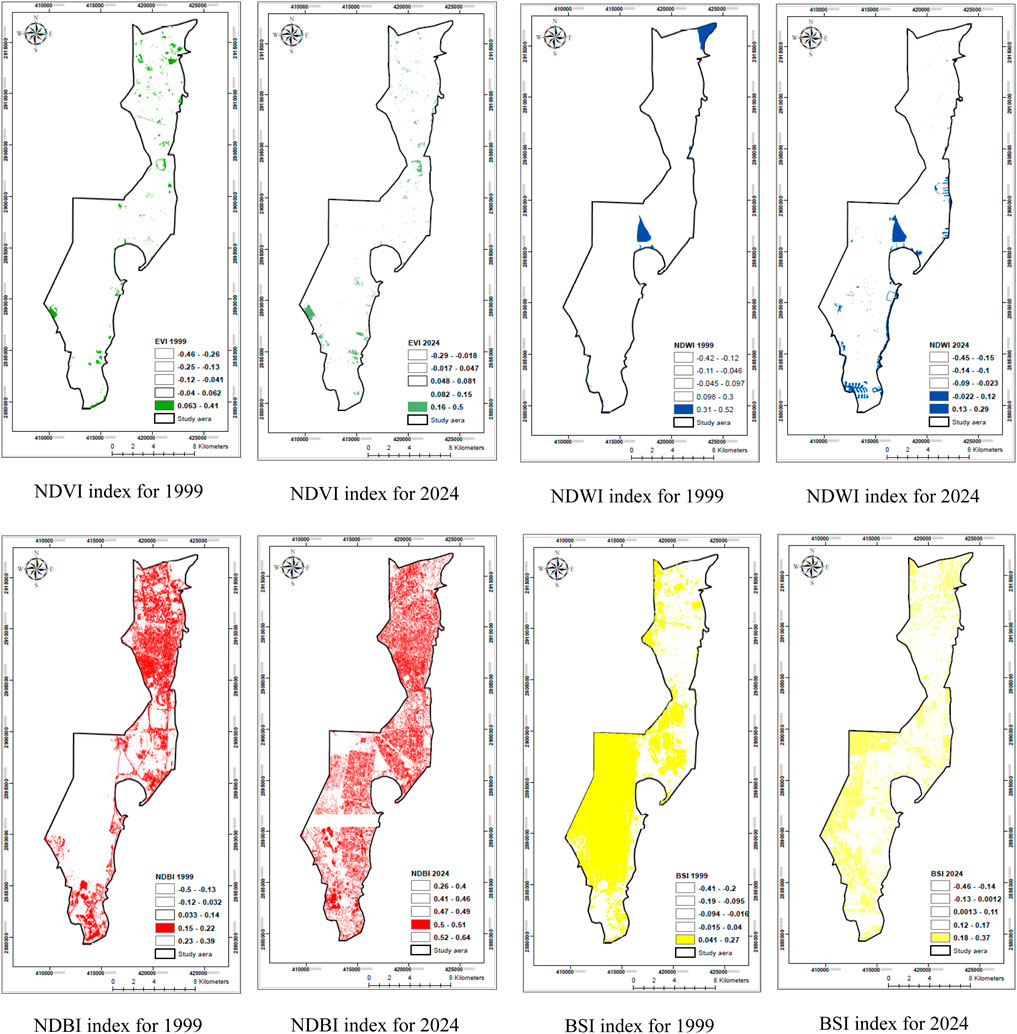
Figure 7. Spectral maps of NDVI, NDBI, NDWI, and BSI indices based on the Landsat-5 (1999) and the Landsat-8 (2024) images.
3.6 Spatial and temporal distribution of land surface temperature in Al-Khobar city
The LST maps (Figure 8) were calculated using the thermal bands of Landsat-5 (TM) and Landsat-8 Operational Land Imager (OLI) images, demonstrate a strong spatial correlation with these urban patterns. The highest LST zones, particularly the hotspots exceeding 48 °C in 2024, are co-located with the core areas of high NDBI. This provides a direct visual and spatial confirmation of UHI effect, where impervious surfaces such as asphalt and concrete absorb and re-radiate heat. A clear thermal gradient is observable, with temperatures generally decreasing from the dense urban core towards the inland peripheries, where open areas (barren land) still dominate.

Figure 8. Distribution of land surface temperature (1999–2024).
Table 8 shows an increase in the maximum temperature by 6.1 °C, which may result from LULC changes leading to a general rise in temperatures. Additionally, the increased urbanization significantly may lead to the UHI effect. On the other hand, despite the increase in maximum temperatures, the minimum temperature decreased from 30.5 °C in 1999 to 26.8 °C in 2024, suggesting an increase in daily temperature fluctuations, possibly reflecting greater climate disturbances. The mean temperature increased from 40.2 °C in 1999 to 42.5 °C in 2024, indicating a rise of 2.3 °C. This increase in mean temperature is consistent with the overall trend of rising temperatures, indicating a general warming during the study period (Li et al., 2018). The standard deviation reflects the extent of temperature variation around the mean. In 1999, the standard deviation was 2.67, increasing to 3.39 in 2024 and indicating that temperatures have become more variable and disparate. Overall, the results demonstrate significant thermal changes in Al-Khobar city, with rising maximum and mean temperatures alongside increased diurnal temperature variability, reflecting the combined impacts of urbanization and land cover changes (Rahman, 2016). These findings align with global observations of UHI intensification in rapidly developing cities (Huang et al., 2019), particularly in arid regions where the replacement of natural surfaces with impervious materials amplifies thermal extremes (Li et al., 2021).

Table 8. Characteristics of land surface temperature (LST) in Al-Khobar city between 1999 and 2024.
3.7 Relationship between spectral indices and land surface temperature in Al-Khobar city
The correlation and regression analysis conducted in NCSS statistical software, which is used for data analysis and statistical evaluation (https://www.ncss.com/software/ncss/) revealed significant relationships between spectral indices and LST, offering insights into the thermal dynamics of Al-Khobar’s arid urban environment (Figure 9). All reported correlations were found to be statistically significant (p < 0.001), indicating a very low probability that these observed relationships occurred by chance. Conversely, the strong and strengthening positive correlation between NDBI and LST (r = 0.1369 and 0.5537) in both 1999 and 2024 unequivocally underscores the role of urbanization as the dominant driver of surface heating. This finding is consistent with observations across the Arabian Peninsula, including studies in Buraydah, Saudi Arabia (Noroozi et al., 2024), and other Gulf cities (Alexander, 2020; Rasul et al., 2018), where the conversion of barren land to built-up area consistently results in significant LST increases. The marked decline in NDWI and its strong negative correlation with LST (r = 0.4709 in 1999 to r = 0.3088 in 2024) further highlights the critical, yet diminishing, role of water bodies as natural coolants. This aligns with concerns raised about the loss of coastal and inland water bodies due to land reclamation in Gulf urban centers suggesting that the conservation of aquatic features is not just an ecological but a thermal imperative for arid cities (Ouma et al., 2021). While vegetation (NDVI) typically shows negative LST correlations in temperate cities (r = 0.1536 in 1999 to r = 0.1207 in 2024) reflect the unique dynamics of irrigated urban greenery in deserts, where limited evapotranspiration and adjacency to heat-retaining surfaces can invert expected thermal relationships. The most striking finding was the consistent positive correlation between NDVI and LST, which contrasts with the typical negative correlation observed in temperate and mesic cities. This anomaly aligns, however, with the growing body of evidence from arid urban studies. For instance, similar weak or positive NDVI-LST relationships have been reported in other desert cities (Ferreira and Duarte, 2019), where irrigated vegetation may exhibit limited evapotranspirative cooling and can be surrounded by heat-retaining impervious surfaces that elevate local ambient temperatures. This suggests that the cooling efficacy of urban greenery in arid regions like Al-Khobar city is highly contingent on its type, density, and spatial configuration, a crucial nuance for planners that is often overlooked in generic UHI mitigation strategies. Finally, the observed BSI-LST correlation over time (0.3994–0.7439) mirrors the 53.7% increasing in barren lands, whose high albedo typically moderates temperatures more effectively than urban materials in arid zones (Rida et al., 2021). Collectively, these index-LST relationships, quantified through NCSS’s robust statistical toolkit, collectively demonstrate how Al-Khobar’s land cover changes have thermally reconfigured its urban environment, with urbanization effects outweighing the cooling potential of limited vegetation gains a pattern increasingly documented in fast-growing Gulf cities (Alexander, 2020). The findings underscore the value of spectral indices as diagnostic tools for urban climate studies while highlighting region-specific exceptions to typical thermal-vegetation relationships that planners must consider in heat mitigation strategies (Gao et al., 2022).
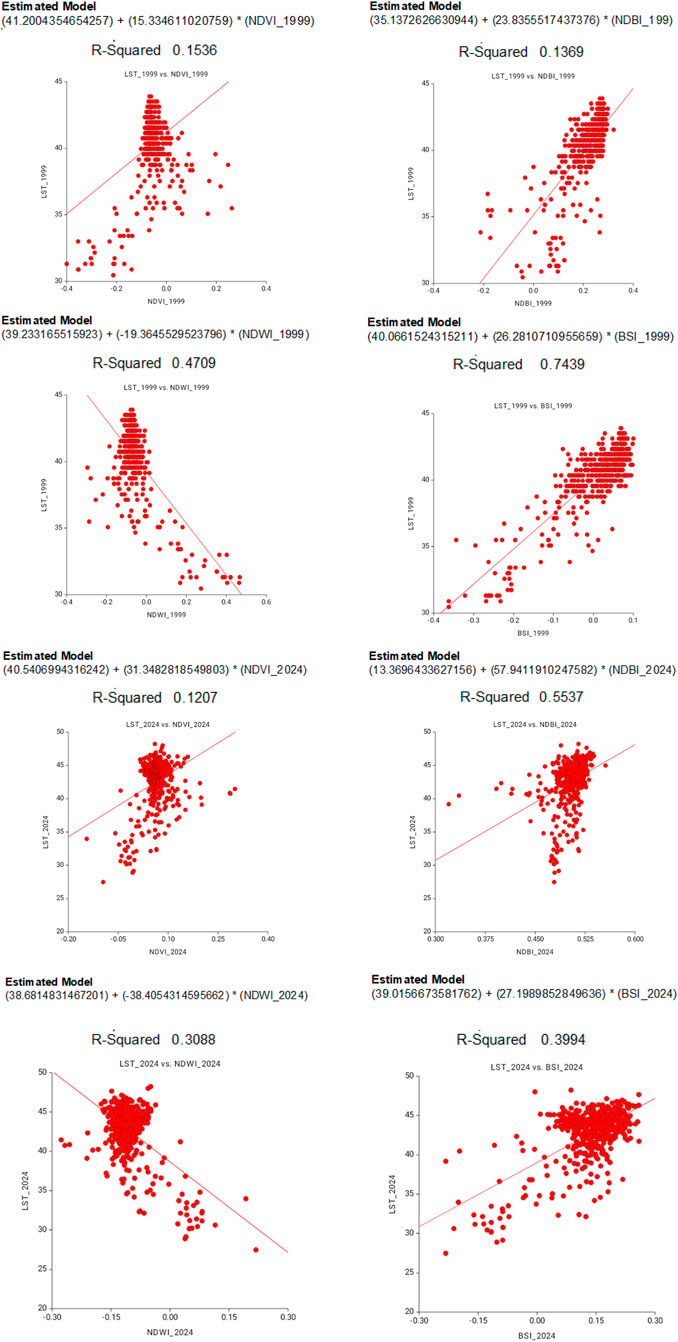
Figure 9. Correlation coefficient between spectral indices and LST in Al-Khobar City (1999–2024).
While this study robustly demonstrates a strong correlation between LULC changes, particularly urbanization, and the rising LST in Al-Khobar city, it is crucial to contextualize these findings within the broader framework of regional climate and anthropogenic factors. The observed 2.3 °C rise in mean LST over 25 years likely results from a confluence of drivers beyond land cover change alone.
Firstly, the regional climatic context must be considered; the Arabian Peninsula has experienced a documented warming trend due to global climate change (Huang et al., 2019; Li et al., 2018). The intensification and increased frequency of heatwaves in the region could exacerbate the UHI effect captured in our LST data, suggesting that the temperature rise is a compound effect of both global climate forcing and localized LULC changes.
Secondly, the choice of urban materials plays a critical role. The rapid expansion of built-up areas, as indicated by the 71.5% increase and strong NDBI-LST correlation, typically involves materials like asphalt and concrete that have low albedo and high heat capacity. These materials absorb solar radiation during the day and slowly release it at night, intensifying the diurnal temperature cycle and contributing to the observed increase in standard deviation of LST from 2.67 to 3.39. This effect is particularly pronounced in arid environments with high solar insolation.
Finally, anthropogenic heat flux (AHF) is a significant contributor to the UHI in a bustling commercial and industrial hub like Al-Khobar city. Heat released from vehicle emissions, industrial processes, and building cooling systems (a substantial energy demand in the extreme summer climate) directly adds thermal energy to the urban environment. Our findings, which show the most intense heat islands in the dense urban core and industrial zones, are consistent with patterns driven by high AHF. Therefore, the thermal regime of Al-Khobar city is not solely a function of its surface properties but is also shaped by the metabolic activity of Al-Khobar city. Future research incorporating meteorological data, material albedo surveys, and AHF estimations would be invaluable to quantitatively disentangle the relative contributions of these factors. Nonetheless, our results underscore that urban planning strategies such as mandating high-albedo, ‘cool’ materials, improving energy efficiency, and optimizing urban form to enhance ventilation are critical for mitigating thermal stress in the face of these combined challenges.
3.8 Re-evaluating the cooling efficacy of urban vegetation in a hyper-arid environment
The most significant finding of this study is the consistent positive correlation between NDVI and LST in both 1999 (r = 0.3919) and 2024 (r = 0.3474). This result aligns with a growing body of evidence from arid urban studies (Siqi and Yuhong, 2020; Waleed and Sajjad, 2023) and contrasts with the well-established negative correlation typically observed in temperate or mesic climates (Albalawi, 2020). While the specific mechanisms driving this positive correlation in Al-Khobar city, not directly measured in this study, the observed pattern can be contextualized within established urban climatology principles for arid regions.
The literature suggests several plausible, non-exclusive explanations for this observed relationship. Firstly, in a hyper-arid environment, the vegetation present is largely comprised of irrigated ornamental species, parks, and gardens. The evapotranspirative cooling capacity of these isolated, often patchy, green areas may be insufficient to overcome the intense solar radiation and the heat stored and re-radiated by the surrounding impervious surfaces (as evidenced by the strong NDBI-LST correlation). Essentially, the potential “cool island” effect of the vegetation is overwhelmed by the ambient “heat island” effect of the city (Ferreira and Duarte, 2019). Secondly, the specific physiological properties of drought-adapted or commonly planted ornamental species may result in lower rates of evapotranspiration compared to lush vegetation in temperate zones, further limiting their cooling potential (Marzban et al., 2018). Finally, the spatial configuration is critical; vegetation integrated into medians or small pockets within a dense matrix of asphalt and concrete may simply lack the spatial extent to manifest a net cooling effect at the 30 m pixel resolution of Landsat data. These potential mechanisms, derived from the literature, offer a framework for interpreting our results and highlight the need for future research that incorporates direct measurements of microclimate and vegetation physiology to conclusively determine the causal factors in Al-Khobar city.
This finding critically nuances the existing literature. While studies from other GCC cities often report the presence of greening efforts, our analysis reveals that the thermal efficacy of such efforts in Al-Khobar city is limited and, in our correlative analysis, paradoxically associated with higher temperatures. This underscores that the mere presence of green cover is not a reliable proxy for cooling service in arid cities, a crucial distinction for urban planners that must be evaluated on a case-by-case basis.
The observed positive NDVI-LST correlation (r = 0.3919 in 1999; r = 0.3474 in 2024), while counter-intuitive from a temperate climate perspective, fits within the established framework of urban climatology in arid regions (Marzban et al., 2018). The strengthening positive correlation between NDBI-LST (from r = 0.3700 to r = 0.7441) aligns unequivocally with findings from other rapidly urbanizing regions (Alademomi et al., 2022; Ouma et al., 2021), confirming that the expansion of impervious surfaces is the dominant driver of rising temperatures in Al-Khobar city. The persistent negative NDWI-LST correlation (r = −0.6862 to r = −0.557), though weakening, reinforces the critical cooling role of water bodies, a finding consistent with studies from both arid and temperate cities (Ghosh and Das, 2018; Guha et al., 2020). The diminishing strength of this correlation is likely a direct consequence of the observed 20.1% reduction in water body areas, highlighting the thermal cost of losing these natural heat sinks (Khan et al., 2021). These patterns collectively highlight how desert urbanization creates unique thermal dynamics where conventional vegetation cooling may be compromised, water resources become increasingly thermally significant, and urban materials dominate the thermal regime - findings with important implications for climate-adaptive planning in rapidly developing arid cities (Wheeler et al., 2019).
4 Conclusion and recommendations
This study provides more than a longitudinal explanation of urban growth and warming in Al-Khobar city; it offers a critical empirical challenge to the universal application of the vegetation-cooling paradigm in urban climatology. The primary contribution of this research is the demonstration that in a hyper-arid city, the relationship between vegetation (NDVI) and land surface temperature can be positive, contradicting established models derived from more temperate environments. This key finding suggests that the thermal benefits of urban greening are not automatic but are heavily contingent on local climate, vegetation type, and urban form.
Our integrated analysis, using multiple spectral indices, further clarifies the dynamics at play: the rapid urban expansion (71.5% increase in built-up area) is the unequivocal primary driver of the observed 2.3 °C rise in mean LST. While water bodies provide a crucial cooling effect, their diminishing extent reduces their overall impact. Furthermore, the conversion of barren land, which initially exhibited a strong heating correlation, to urban uses has led to an even more intense thermal environment.
These findings have direct implications for sustainable urban planning in Al-Khobar city and similar desert cities. Mitigation strategies must prioritize; i) the conservation and expansion of water bodies due to their proven and powerful cooling effect, ii) a strategic re-evaluation of greening plans, moving beyond area-based targets to focus on species selection for high evapotranspiration, and strategic placement to create larger, interconnected cool zones rather than isolated patches, and iii) the mandatory use of high-albedo, “cool” materials in construction to directly counter the heat absorption of built-up areas.
Future research should involve high-resolution thermal imagery and in-situ microclimate measurements to further unravel the complex interactions between different vegetation types and their immediate surroundings in arid urban settings.
Data availability statement
The original contributions presented in the study are included in the article/supplementary material, further inquiries can be directed to the corresponding authors.
Author contributions
KF: Conceptualization, Data curation, Formal Analysis, Funding acquisition, Investigation, Methodology, Project administration, Resources, Software, Supervision, Validation, Visualization, Writing – original draft, Writing – review and editing. SA: Conceptualization, Data curation, Formal Analysis, Funding acquisition, Investigation, Methodology, Project administration, Resources, Software, Supervision, Validation, Visualization, Writing – original draft, Writing – review and editing. EA: Conceptualization, Data curation, Formal Analysis, Funding acquisition, Investigation, Methodology, Project administration, Resources, Software, Supervision, Validation, Visualization, Writing – original draft, Writing – review and editing. MA: Conceptualization, Data curation, Formal Analysis, Funding acquisition, Investigation, Methodology, Project administration, Resources, Software, Supervision, Validation, Visualization, Writing – original draft, Writing – review and editing. OA-K: Conceptualization, Data curation, Funding acquisition, Methodology, Project administration, Resources, Software, Supervision, Validation, Visualization, Writing – review and editing. MF: Conceptualization, Data curation, Funding acquisition, Methodology, Project administration, Resources, Software, Supervision, Validation, Visualization, Writing – original draft, Writing – review and editing.
Funding
The authors declare that financial support was received for the research and/or publication of this article. Princess Nourah bint Abdulrahman University Researchers Supporting Project number (PNURSP2025R673), Princess Nourah bint Abdulrahman University, Riyadh, Saudi Arabia.
Acknowledgements
Princess Nourah bint Abdulrahman University Researchers Supporting Project number (PNURSP2025R673), Princess Nourah bint Abdulrahman University, Riyadh, Saudi Arabia.
Conflict of interest
The authors declare that the research was conducted in the absence of any commercial or financial relationships that could be construed as a potential conflict of interest.
Generative AI statement
The authors declare that no Generative AI was used in the creation of this manuscript.
Any alternative text (alt text) provided alongside figures in this article has been generated by Frontiers with the support of artificial intelligence and reasonable efforts have been made to ensure accuracy, including review by the authors wherever possible. If you identify any issues, please contact us.
Publisher’s note
All claims expressed in this article are solely those of the authors and do not necessarily represent those of their affiliated organizations, or those of the publisher, the editors and the reviewers. Any product that may be evaluated in this article, or claim that may be made by its manufacturer, is not guaranteed or endorsed by the publisher.
References
Abdulraheem, M. I., Zhang, W., Li, S., Moshayedi, A. J., Farooque, A. A., and Hu, J. (2023). Advancement of remote sensing for soil measurements and applications: a comprehensive review. Sustainability 15 (21), 15444. doi:10.3390/su152115444
Abuzaid, A. S., Abdellatif, A. D., and Fadl, M. E. (2021). Modeling soil quality in Dakahlia governorate, Egypt using GIS techniques. Egypt. J. Remote Sens. Space Sci. 24 (2), 255–264. doi:10.1016/j.ejrs.2020.01.003
Ackerman, S. A., Strabala, K. I., Menzel, W. P., Frey, R. A., Moeller, C. C., and Gumley, L. E. (1998). Discriminating clear sky from clouds with MODIS. J. Geophys. Res. Atmos. 103 (D24), 32141–32157. doi:10.1029/1998jd200032
Ahmad, A., and Quegan, S. (2012). Cloud masking for remotely sensed data using spectral and principal components analysis. Eng. Technol. and Appl. Sci. Res. 2 (3), 221–225. doi:10.48084/etasr.148
Alademomi, A. S., Okolie, C. J., Daramola, O. E., Akinnusi, S. A., Adediran, E., Olanrewaju, H. O., et al. (2022). The interrelationship between LST, NDVI, NDBI, and land cover change in a section of Lagos metropolis, Nigeria. Appl. Geomatics 14 (2), 299–314. doi:10.1007/s12518-022-00434-2
Albalawi, E. (2020). Assessing and predicting the impact of land use and land cover change on groundwater using geospatial techniques: a case study of Tabuk, Saudi Arabia. PhD thesis. Perth, WA: Curtin University.
Alexander, C. (2020). Normalised difference spectral indices and urban land cover as indicators of land surface temperature (LST). Int. J. Appl. Earth Observation Geoinformation 86, 102013. doi:10.1016/j.jag.2019.102013
Almazroui, M., Mashat, A., Assiri, M. E., and Butt, M. J. (2017). Application of landsat data for urban growth monitoring in jeddah. Earth Syst. Environ. 1, 1–11. doi:10.1007/s41748-017-0028-4
Almohamad, H., and Alshwesh, I. O. (2023). Evaluation of index-based methods for impervious surface mapping from Landsat-8 to cities in dry climates; A case study of buraydah city, KSA. Sustainability 15 (12), 9704. doi:10.3390/su15129704
AlQahtany, A. M., Dano, U. L., Elhadi Abdalla, E. M., Mohammed, W. E., Abubakar, I. R., Al-Gehlani, W. A. G., et al. (2022). Land reclamation in a coastal metropolis of Saudi Arabia: environmental sustainability implications. Water 14 (16), 2546. doi:10.3390/w14162546
Baranwal, E., and Ahmad, S. (2021). Retrieving spatial pattern of urban using spectral ratios for major features of an urban ecosystem with satellite image processing. IOP Conf. Ser. Earth Environ. Sci. 795, 012034. doi:10.1088/1755-1315/795/1/012034
Bendib, A., Dridi, H., and Kalla, M. I. (2017). Contribution of landsat 8 data for the estimation of land surface temperature in Batna city, eastern Algeria. Geocarto Int. 32 (5), 503–513. doi:10.1080/10106049.2016.1156167
Campbell, J. B., and Wynne, R. H. (2011). Introduction to remote sensing. 5th edition. New York, NY: The Guilford Press, A Division of Guilford Publications, Inc.
Carlucci, S., Lange, M. A., Santamouris, M., and Attia, S. (2021). Eastern mediterranean and Middle East climate change initiative: report of the task force on the built environment.
Chastain, R., Housman, I., Goldstein, J., Finco, M., and Tenneson, K. (2019). Empirical cross sensor comparison of Sentinel-2A and 2B MSI, Landsat-8 OLI, and Landsat-7 ETM+ top of atmosphere spectral characteristics over the conterminous United States. Remote Sens. Environ. 221, 274–285. doi:10.1016/j.rse.2018.11.012
Chen, J., Chen, J., Liao, A., Cao, X., Chen, L., Chen, X., et al. (2015). Global land cover mapping at 30 m resolution: a POK-based operational approach. ISPRS J. Photogrammetry Remote Sens. 103, 7–27. doi:10.1016/j.isprsjprs.2014.09.002
Congalton, R. G., and Green, K. (2019). Assessing the accuracy of remotely sensed data: principles and practices. 3rd edition. Boca Raton, FL: CRC press. doi:10.1201/9780429052729
Dahiya, N., Singh, S., and Gupta, S. (2023). Comparative analysis and implication of hyperion hyperspectral and landsat-8 multispectral dataset in land classification. J. Indian Soc. Remote Sens. 51 (11), 2201–2213. doi:10.1007/s12524-023-01760-7
Dahy, B., Al-Memari, M., Al-Gergawi, A., and Burt, J. A. (2024). Remote sensing of 50 years of coastal urbanization and environmental change in the arabian gulf: a systematic review. Front. Remote Sens. 5, 1422910. doi:10.3389/frsen.2024.1422910
Estoque, R. C., Murayama, Y., and Myint, S. W. (2017). Effects of landscape composition and pattern on land surface temperature: an urban heat island study in the megacities of southeast Asia. Sci. Total Environ. 577, 349–359. doi:10.1016/j.scitotenv.2016.10.195
Fadl, M. E., AbdelRahman, M. A., El-Desoky, A. I., and Sayed, Y. A. (2024). Assessing soil productivity potential in arid region using remote sensing vegetation indices. J. Arid Environ. 222, 105166. doi:10.1016/j.jaridenv.2024.105166
Fahmy, A. H., Abdelfatah, M. A., and El-Fiky, G. (2023). Investigating land use land cover changes and their effects on land surface temperature and urban heat islands in sharqiyah governorate, Egypt. Egypt. J. Remote Sens. Space Sci. 26 (2), 293–306. doi:10.1016/j.ejrs.2023.04.001
Fathizad, H., Ardakani, M. A. H., Mehrjardi, R. T., and Sodaiezadeh, H. (2018). Evaluating desertification using remote sensing technique and object-oriented classification algorithm in the Iranian central desert. J. Afr. Earth Sci. 145, 115–130. doi:10.1016/j.jafrearsci.2018.04.012
Feng, L., Naz, I., Quddoos, A., Zafar, Z., Gan, M., Aslam, M., et al. (2025). Exploring rangeland dynamics in Punjab, Pakistan: integrating LULC, LST, and remote sensing for ecosystem analysis (2000–2020). Rangel. Ecol. and Manag. 98, 377–388. doi:10.1016/j.rama.2024.09.008
Ferreira, L. S., and Duarte, D. H. S. (2019). Exploring the relationship between urban form, land surface temperature and vegetation indices in a subtropical megacity. Urban Clim. 27, 105–123. doi:10.1016/j.uclim.2018.11.002
Ganesh, B., Vincent, S., Pathan, S., and Benitez, S. R. G. (2023). Utilizing LANDSAT data and the maximum likelihood classifier for analysing land use patterns in shimoga, Karnataka. J. Phys. Conf. Ser. 2571, 012001. doi:10.1088/1742-6596/2571/1/012001
Gao, J., Gong, J., Yang, J., Li, J., and Li, S. (2022). Measuring spatial connectivity between patches of the heat source and sink (SCSS): a new index to quantify the heterogeneity impacts of landscape patterns on land surface temperature. Landsc. Urban Plan. 217, 104260. doi:10.1016/j.landurbplan.2021.104260
Ghosh, S., and Das, A. (2018). Modelling urban cooling island impact of green space and water bodies on surface urban heat island in a continuously developing urban area. Model. Earth Syst. Environ. 4 (2), 501–515. doi:10.1007/s40808-018-0456-7
Govind, N. R., and Ramesh, H. (2019). The impact of spatiotemporal patterns of land use land cover and land surface temperature on an urban cool island: a case study of bengaluru. Environ. Monit. Assess. 191, 1–20. doi:10.1007/s10661-019-7440-1
Guha, S., Govil, H., and Besoya, M. (2020). An investigation on seasonal variability between LST and NDWI in an urban environment using landsat satellite data. Geomatics, Nat. Hazards Risk 11 (1), 1319–1345. doi:10.1080/19475705.2020.1789762
Guo, L. (2011). Land cover change detection using landsat TM imagery of the 2009 victorian bushfires UNSW Sydney.
He, Q., He, W., Song, Y., Wu, J., Yin, C., and Mou, Y. (2018). The impact of urban growth patterns on urban vitality in newly built-up areas based on an association rules analysis using geographical ‘big data. Land Use Policy 78, 726–738. doi:10.1016/j.landusepol.2018.07.020
Hoelscher, K., and Aijaz, R. (2016). Challenges and opportunities in an urbanising India. Int. Area Stud. Rev. 19 (1), 3–11. doi:10.1177/2233865916637297
Hokao, K., Phonekeo, V., and Srivanit, M. (2012). Assessing the impact of urbanization on urban thermal environment: a case study of Bangkok metropolitan. Int. J. Appl. 2 (7), 243–256. Available online at: https://ijast.thebrpi.org/journal/index/331
Huang, K., Li, X., Liu, X., and Seto, K. C. (2019). Projecting global urban land expansion and heat island intensification through 2050. Environ. Res. Lett. 14 (11), 114037. doi:10.1088/1748-9326/ab4b71
Irshad, Z., Hassan, M., Akbar, S., Farooq, M., and Chishtie, F. A. (2024). Spatiotemporal changes in LULC and associated impact on urban heat islands over Pakistan using geospatial techniques. Urban Clim. 57, 102112. doi:10.1016/j.uclim.2024.102112
Jozdani, S. E., Johnson, B. A., and Chen, D. (2019). Comparing deep neural networks, ensemble classifiers, and support vector machine algorithms for object-based urban land use/land cover classification. Remote Sens. 11 (14), 1713. doi:10.3390/rs11141713
Khan, M. S., Ullah, S., and Chen, L. (2021). Comparison on land-use/land-cover indices in explaining land surface temperature variations in the city of beijing, China. Land 10 (10), 1018. doi:10.3390/land10101018
Kothe, S., Hollmann, R., Pfeifroth, U., Träger-Chatterjee, C., and Trentmann, J. (2019). The CM SAF R Toolbox—a tool for the easy usage of satellite-based climate data in NetCDF format. ISPRS Int. J. Geo-Information 8 (3), 109. doi:10.3390/ijgi8030109
Landis, J. R., and Koch, G. G. (1977). The measurement of observer agreement for categorical data. Biometrics 33, 159–174. doi:10.2307/2529310
Li, Y.-Y., Zhang, H., and Kainz, W. (2012). Monitoring patterns of urban heat islands of the fast-growing shanghai metropolis, China: using time-series of landsat TM/ETM+ data. Int. Journal Applied Earth Observation Geoinformation 19, 127–138. doi:10.1016/j.jag.2012.05.001
Li, J., Chen, Y. D., Gan, T. Y., and Lau, N.-C. (2018). Elevated increases in human-perceived temperature under climate warming. Nat. Clim. Change 8 (1), 43–47. doi:10.1038/s41558-017-0036-2
Li, X., Stringer, L. C., and Dallimer, M. (2021). The spatial and temporal characteristics of urban heat island intensity: implications for east Africa’s urban development. Climate 9 (4), 51. doi:10.3390/cli9040051
Lillesand, T., Kiefer, R. W., and Chipman, J. (2015). Remote sensing and image interpretation. John Wiley and Sons.
Mansour, S., Alahmadi, M., Atkinson, P. M., and Dewan, A. (2022). Forecasting of built-up land expansion in a desert urban environment. Remote Sensing 14 (9), 2037. doi:10.3390/rs14092037
Marzban, F., Sodoudi, S., and Preusker, R. (2018). The influence of land-cover type on the relationship between NDVI–LST and LST-T air. Int. J. Remote Sens. 39 (5), 1377–1398. doi:10.1080/01431161.2017.1402386
Mertes, C. M., Schneider, A., Sulla-Menashe, D., Tatem, A., and Tan, B. (2015). Detecting change in urban areas at Continental scales with MODIS data. Remote Sens. Environ. 158, 331–347. doi:10.1016/j.rse.2014.09.023
Mou, L., Bruzzone, L., and Zhu, X. X. (2018). Learning spectral-spatial-temporal features via a recurrent convolutional neural network for change detection in multispectral imagery. IEEE Trans. Geoscience Remote Sens. 57 (2), 924–935. doi:10.1109/tgrs.2018.2863224
Nahas, F., Hamdi, I., Hereher, M., Zelenakova, M., and El Kenawy, A. M. (2025). Warming trends in the nile Delta: a high-resolution spatial statistical approach. Remote Sens. Appl. Soc. Environ. 37, 101408. doi:10.1016/j.rsase.2024.101408
Ng, C. N., Xie, Y. J., and Yu, X. J. (2011). Measuring the spatio-temporal variation of habitat isolation due to rapid urbanization: a case study of the shenzhen river cross-boundary catchment, China. Landsc. Urban Plan. 103 (1), 44–54. doi:10.1016/j.landurbplan.2011.05.011
Njoku, E. A., and Tenenbaum, D. E. (2022). Quantitative assessment of the relationship between land use/land cover (LULC), topographic elevation and land surface temperature (LST) in ilorin, Nigeria. Remote Sens. Appl. Soc. Environ. 27, 100780. doi:10.1016/j.rsase.2022.100780
Noroozi, F., Belcore, E., and Dabove, P. (2024). Analysis of high-resolution land cover classification methods and evaluation of vegetation's role in temperature mitigation: a case study in ouagadougou.
Ouma, Y. O., Tjitemisa, T., Segobye, M., Moreri, K., Nkwae, B., Maphale, L., et al. (2021). Urban land surface temperature variations with LULC, NDVI and NDBI in semi-arid urban environments: case study of Gaborone city, Botswana (1989–2019). Remote Sens. Technol. Appl. Urban Environ. VI, 6. doi:10.1117/12.2595031
Pak, A., and Farajzadeh, M. (2007). Iran's integrated coastal management plan: persian gulf, Oman Sea, and southern Caspian Sea coastlines. Ocean and Coast. Manag. 50 (9), 754–773. doi:10.1016/j.ocecoaman.2007.03.006
Pan, T., Lu, D., Zhang, C., Chen, X., Shao, H., Kuang, W., et al. (2017). Urban land-cover dynamics in arid China based on high-resolution urban land mapping products. Remote Sensing 9 (7), 730. doi:10.3390/rs9070730
Peng, S., Piao, S., Ciais, P., Friedlingstein, P., Ottle, C., Bréon, F.-M., et al. (2012). Surface urban heat island across 419 global big cities. Environ. Science and Technology 46 (2), 696–703. doi:10.1021/es2030438
Phinzi, K., Ngetar, N. S., Pham, Q. B., Chakilu, G. G., and Szabó, S. (2023). Understanding the role of training sample size in the uncertainty of high-resolution LULC mapping using random forest. Earth Sci. Inf. 16 (4), 3667–3677. doi:10.1007/s12145-023-01117-1
Qadri, S. T., Hamdan, A., Raj, V., Ehsan, M., Shamsuddin, N., Hakimi, M. H., et al. (2023). Assessment of land surface temperature from the Indian cities of ranchi and dhanbad during COVID-19 lockdown: implications on the urban climatology. Sustainability 15 (17), 12961. doi:10.3390/su151712961
Rahman, M. T. (2016). Detection of land use/land cover changes and urban sprawl in al-khobar, Saudi Arabia: an analysis of multi-temporal remote sensing data. ISPRS Int. J. Geo-Information 5 (2), 15. doi:10.3390/ijgi5020015
Rasul, A., Balzter, H., Ibrahim, G. R. F., Hameed, H. M., Wheeler, J., Adamu, B., et al. (2018). Applying built-up and bare-soil indices from landsat 8 to cities in dry climates. Land 7 (3), 81. doi:10.3390/land7030081
Raynolds, M. K., Comiso, J. C., Walker, D. A., and Verbyla, D. (2008). Relationship between satellite-derived land surface temperatures, arctic vegetation types, and NDVI. Remote Sens. Environ. 112 (4), 1884–1894. doi:10.1016/j.rse.2007.09.008
Rehman, Z., Kazmi, S. J. H., Khanum, F., and Samoon, Z. A. (2015). Analysis of land surface temperature and NDVI using geo-spatial technique: a case study of keti bunder, Sindh, Pakistan. J. Basic and Appl. Sci. 11, 514–527. doi:10.6000/1927-5129.2015.11.69
Rengma, N. S., and Yadav, M. (2024). Generation and classification of patch-based land use and land cover dataset in diverse Indian landscapes: a comparative study of machine learning and deep learning models. Environ. Monit. Assess. 196 (6), 568. doi:10.1007/s10661-024-12719-7
Richards, J. A., and Jia, X. (1999). “The interpretation of digital image data,” in Remote sensing digital image analysis: an introduction (Springer), 75–88.
Rida, A., Koumetio, C. S. T., Diop, E. B., and Chenal, J. (2021). Exploring the relationship between urban form and land surface temperature (LST) in a semi-arid region case study of ben guerir city-Morocco. Environ. Challenges 5, 100229. doi:10.1016/j.envc.2021.100229
Saha, J., Ria, S. S., Sultana, J., Shima, U. A., Seyam, M. M. H., and Rahman, M. M. (2024). Assessing seasonal dynamics of land surface temperature (LST) and land use land cover (LULC) in bhairab, Kishoreganj, Bangladesh: a geospatial analysis from 2008 to 2023. Case Stud. Chem. Environ. Eng. 9, 100560. doi:10.1016/j.cscee.2023.100560
Scolozzi, R., and Geneletti, D. (2012). A multi-scale qualitative approach to assess the impact of urbanization on natural habitats and their connectivity. Environ. Impact Assess. Rev. 36, 9–22. doi:10.1016/j.eiar.2012.03.001
Selmy, S. A., Kucher, D. E., Mozgeris, G., Moursy, A. R., Jimenez-Ballesta, R., Kucher, O. D., et al. (2023). Detecting, analyzing, and predicting land use/land cover (LULC) changes in arid regions using landsat images, CA-Markov hybrid model, and GIS techniques. Remote Sensing 15 (23), 5522. doi:10.3390/rs15235522
Sen, R., Goswami, S., and Chakraborty, B. (2019). Jeffries-matusita distance as a tool for feature selection. 2019 Int. Conf. Data Sci. Eng. (ICDSE), 15–20. doi:10.1109/icdse47409.2019.8971800
Sen, R., Goswami, S., Mandal, A. K., and Chakraborty, B. (2022). An effective feature subset selection approach based on jeffries-matusita distance for multiclass problems. J. Intelligent and Fuzzy Syst. 42 (4), 4173–4190. doi:10.3233/jifs-202796
Shah, S., and Siyal, A. (2019). GIS-based approach estimation of area under wheat and other major rabi crops in district ghotki and corresponding irrigation water requirement. ACTA Sci. Agric. 3 (12), 59–70. doi:10.31080/asag.2019.03.0725
Sharma, R., Ghosh, A., and Joshi, P. K. (2013). Spatio-temporal footprints of urbanisation in surat, the diamond city of India (1990–2009). Environ. Monit. Assess. 185, 3313–3325. doi:10.1007/s10661-012-2792-9
Sharma, K., Tiwari, R., Wadhwani, A. K., and Chaturvedi, S. (2024). Spatiotemporal analysis of land surface temperature trends in nashik, India: a 30-year study from 1992 to 2022. Earth Sci. Inf. 17 (3), 2107–2128. doi:10.1007/s12145-024-01260-3
Siqi, J., and Yuhong, W. (2020). Effects of land use and land cover pattern on urban temperature variations: a case study in Hong Kong. Urban Clim. 34, 100693. doi:10.1016/j.uclim.2020.100693
Sobrino, J. A., Jiménez-Muñoz, J. C., and Paolini, L. (2004). Land surface temperature retrieval from LANDSAT TM 5. Remote Sens. Environ. 90 (4), 434–440. doi:10.1016/j.rse.2004.02.003
Sobrino, J., Oltra-Carrió, R., Sòria, G., Bianchi, R., and Paganini, M. (2012). Impact of spatial resolution and satellite overpass time on evaluation of the surface urban heat island effects. Remote Sens. Environ. 117, 50–56. doi:10.1016/j.rse.2011.04.042
Somayajula, V. K. A., Ghai, D., Kumar, S., Tripathi, S. L., Verma, C., Safirescu, C. O., et al. (2022). Classification and validation of spatio-temporal changes in land use/land cover and land surface temperature of multitemporal images. Sustainability 14 (23), 15677. doi:10.3390/su142315677
Sonawane, K. R., and Bhagat, V. (2017). Improved change detection of forests using landsat TM and ETM+ data. Remote Sens. Land 1 (1), 18–40. doi:10.21523/gcj1.17010102
Srivanit, M. (2013). Integrated urban thermal environment assessment methods for multi-scale spatial planning.
Subraelu, P., Ebraheem, A. A., Sherif, M., Sefelnasr, A., Yagoub, M., and Rao, K. N. (2022). Land in water: the study of land reclamation and artificial islands formation in the uae coastal zone: a remote sensing and gis perspective. Land 11 (11), 2024. doi:10.3390/land11112024
Ullah, S., Ahmad, K., Sajjad, R. U., Abbasi, A. M., Nazeer, A., and Tahir, A. A. (2019). Analysis and simulation of land cover changes and their impacts on land surface temperature in a lower Himalayan region. J. Environmental Management 245, 348–357. doi:10.1016/j.jenvman.2019.05.063
Van de Griend, A., and Owe, M. (1993). On the relationship between thermal emissivity and the normalized difference vegetation index for natural surfaces. Int. Journal Remote Sensing 14 (6), 1119–1131. doi:10.1080/01431169308904400
Verma, P., Raghubanshi, A., Srivastava, P. K., and Raghubanshi, A. (2020). Appraisal of kappa-based metrics and disagreement indices of accuracy assessment for parametric and nonparametric techniques used in LULC classification and change detection. Model. Earth Syst. Environ. 6, 1045–1059. doi:10.1007/s40808-020-00740-x
Waleed, M., and Sajjad, M. (2023). “Warming cities in Pakistan: evaluating spatial–temporal dynamics of urban thermal field variance index under rapid urbanization,” in Climate change and cooling cities (Springer), 67–82.
Wang, H., Zhang, Y., Tsou, J. Y., and Li, Y. (2017). Surface urban heat island analysis of shanghai (china) based on the change of land use and land cover. Sustainability 9 (9), 1538. doi:10.3390/su9091538
Wang, J., Bretz, M., Dewan, M. A. A., and Delavar, M. A. (2022). Machine learning in modelling land-use and land cover-change (LULCC): current status, challenges and prospects. Sci. Total Environ. 822, 153559. doi:10.1016/j.scitotenv.2022.153559
Wei, Y. D., and Ewing, R. (2018). Urban expansion, sprawl and inequality. Landsc. Urban Plan. 177, 259–265. doi:10.1016/j.landurbplan.2018.05.021
Weng, Q., and Lu, D. (2008). A sub-pixel analysis of urbanization effect on land surface temperature and its interplay with impervious surface and vegetation coverage in Indianapolis, United States. Int. Journal Applied Earth Observation Geoinformation 10 (1), 68–83. doi:10.1016/j.jag.2007.05.002
Wheeler, S. M., Abunnasr, Y., Dialesandro, J., Assaf, E., Agopian, S., and Gamberini, V. C. (2019). Mitigating urban heating in dryland cities: a literature review. J. Planning Literature 34 (4), 434–446. doi:10.1177/0885412219855779
Xu, H. (2006). Modification of normalised difference water index (NDWI) to enhance open water features in remotely sensed imagery. Int. Journal Remote Sensing 27 (14), 3025–3033. doi:10.1080/01431160600589179
Xu, H. (2008). A new index for delineating built-up land features in satellite imagery. Int. Journal Remote Sensing 29 (14), 4269–4276. doi:10.1080/01431160802039957
Yengoh, G. T., Dent, D., Olsson, L., Tengberg, A. E., and Tucker, I. I. I. C. J. (2015). Use of the normalized difference vegetation index (NDVI) to assess land degradation at multiple scales: current status, future trends, and practical considerations. Springer.
Yousif, F. A., Mustafa, M. T., and Mahdi, Z. H. (2024). Assessment of land use/land cover variations with temperature changes in the Baghdad city, Iraq. AIP Conf. Proc. 3203, 050045. doi:10.1063/5.0212635
Keywords: landuse/landcover changes, land surface temperature, spectral indices, remote sensing, urban expansion
Citation: Faqeih KY, Alamri SM, Alamery ER, Aldubehi MA, Al-Khalil OM and Fadl ME (2025) Spatiotemporal analysis and mapping of LULC changes and thermal environment variations in Al Khobar, Saudi Arabia using remote sensing techniques. Front. Environ. Sci. 13:1732839. doi: 10.3389/fenvs.2025.1732839
Received: 26 October 2025; Accepted: 25 November 2025;
Published: 11 December 2025.
Edited by:
Salvador García-Ayllón Veintimilla, Polytechnic University of Cartagena, SpainReviewed by:
Kolade Victor Otokiti, University of Guyana, GuyanaMegersa Kebede Leta, Jimma University, Ethiopia
Copyright © 2025 Faqeih, Alamri, Alamery, Aldubehi, Al-Khalil and Fadl. This is an open-access article distributed under the terms of the Creative Commons Attribution License (CC BY). The use, distribution or reproduction in other forums is permitted, provided the original author(s) and the copyright owner(s) are credited and that the original publication in this journal is cited, in accordance with accepted academic practice. No use, distribution or reproduction is permitted which does not comply with these terms.
*Correspondence: Khadeijah Yahya Faqeih, a2FmYXFlZWhAcG51LmVkdS5zYQ==; Mohamed E. Fadl, bWFkaGFtQG5hcnNzLnNjaS5lZw==