 Oscar M. M. Yukich Clendon1*
 Joanna K. Carpenter2Dave Kelly3Puke Timoti4,5
 Bruce R. Burns1Gretel Boswijk6Adrian Monks2
- 1School of Biological Sciences, The University of Auckland, Auckland, New Zealand
- 2Manaaki Whenua–Landcare Research, Dunedin, New Zealand
- 3Centre for Integrative Ecology, School of Biological Sciences, University of Canterbury, Christchurch, New Zealand
- 4Tūhoe Tuawhenua Trust, Rotorua, New Zealand
- 5Manaaki Whenua–Landcare Research, Hamilton, New Zealand
- 6School of Environment, The University of Auckland, Auckland, New Zealand
Introduction: Climate change is expected to exacerbate the pressures faced by already fragile ecosystems. Negative impacts on the localized and culturally significant plant and animal species within these ecosystems will have cascading effects for the indigenous communities that interact with those species. Understanding how climate change affects culturally important seed crops may be particularly important, as seeds are critical for forest regeneration as well as providing sustenance for wildlife and people. In the central North Island/Te Ika-a-Māui of Aotearoa-New Zealand, Tūhoe elders of the Tuawhenua region have observed declines in seed production by the large-fruited locally dominant forest tree Beilschmiedia tawa (tawa, Lauraceae) over the last half century, which could be related to climate change.
Methods: We used seed trap data from six sites throughout the geographic range of tawa to measure trends in seed crop size from 1986 to 2020 and to determine which weather factors affect seed crops. We then used these weather predictors to hindcast how tawa seeding may have changed in Tuawhenua forests from 1910–2019, based on historic weather data.
Results: Seed trap data showed a decline in seeding through time across tawa’s range, and that seeding was lower at more northerly sites. Seed crops were synchronous among trees within sites, but were strongly asynchronous among sites. High seed crops were associated with cooler summer and winter temperatures, and with high rainfall. In the Tuawhenua region, increases in summer and winter temperatures appear to have contributed to the declines in tawa seed crops observed by elders, with the model predicting that years with heavy fruiting have become less frequent after 1940.
Discussion: Our study provides strong evidence that tawa is undergoing changing seedfall patterns in response to changing climate. The biggest weather drivers of seeding that we identified in tawa were winter and summer temperature, both of which were negatively associated with crop size. Both winter and summer temperatures have increased in Tuawhenua in the last 100 years suggesting a possible mechanism to explain observations of long-term declines in tawa seedfall observed by Tūhoe elders of the Tuawhenua region, with ecological and cultural implications.
1. Introduction
Forest-dwelling indigenous communities are among the first to face the direct consequences of climate change, owing to their reliance on natural resources for both economic subsistence, cultural identity and heritage. Globally, many regions are expected to experience significant warming through the 21st century, accompanied by more frequent and severe droughts and floods (IPCC, 2021). These shifts in climate conditions will impact culturally significant plants, animals, and environments, with flow-on effects to indigenous communities’ identity, sense of place, social-ecological knowledge systems and existing practices (Voggesser et al., 2013). Indigenous communities’ access and connection to valued species is already being impaired by climate-induced range shifts, such as with wild rice for the Anishnaabeg people in northern U.S.A (Lynn et al., 2013).
While many components of forests are likely to be impacted by climate change, impacts on seeds may be particularly important because of their importance for forest regeneration, and as food for humans (Herrmann, 2006; Lynn et al., 2013; Long et al., 2017) and ecologically and culturally important animal species (Wilson et al., 1998; Bogdziewicz et al., 2016). Any impacts on seeds could affect the regeneration of tree species whose decline or loss can have major ecological and cultural impacts (Rivers et al., 2022). Given the long generation times for many forest trees, seeding failure may not manifest changes in forest structure for many years (Tilman et al., 1994; Kuussaari et al., 2009). Therefore, identifying species at risk of, or currently experiencing seeding failure is important for informing climate change adaptation strategies.
Climate effects on seed crops are complex (Walck et al., 2011; Bogdziewicz, 2022). First, climate may act as a synchronizing cue for large scale flowering in masting species [i.e., species with temporally variable, spatially synchronous seed production (Richardson et al., 2005; Bogdziewicz et al., 2021)], where pollination efficiency (Norton and Kelly, 1988), predator satiation (Kelly and Sullivan, 1997; Peters et al., 2017; Bogdziewicz et al., 2018) or ability to make use of suitable environmental conditions for regeneration (Ascoli et al., 2020) depend on large, intermittent, synchronized seed crops. Hence, a failure of synchronization also leads to a failure of seed production itself (Bogdziewicz et al., 2021) or plant regeneration more generally. Second, climate can influence plants’ acquisition of resources that are required for reproduction. For example, moisture and warming may both increase rates of N mineralization if microbial action is enhanced (Hartley et al., 1999) or decrease it if mechanical breakdown of litter by freeze-thaw is limiting (Ueda et al., 2013). Finally, factors such as drought can limit the ability of developing fruits to reach maturity, either resulting in premature abortion (Nussbaumer et al., 2020) or undersized seeds which have lower establishment success under some circumstances (Leishman et al., 2000).
Observed climate change effects on seeding patterns suggest a range of responses, likely stemming from a range of mechanisms determining the annual crop for different species (Bogdziewicz, 2022). Moreover, even within species, climate change responses will be dependent on spatial variation in climate and the interaction with other aspects of the species’ ecology. For example, Allen et al. (2014) found average crop size increased over time for mountain beech (Fuscospora cliffortioides) at high elevation, but not at lower elevations at the same site, despite a general increase in the temperature flowering cue everywhere. The authors interpreted this result as a precipitation-driven increase in soil nutrients rather than a response to warming. Hence, prediction of future impacts, and interpretation of past patterns, requires a clear understanding of the mechanisms underlying seed production.
Here, we investigate the relationship between weather variables (short-term temperature and rainfall conditions during a particular season) and seed production for the recalcitrant tree Beilschmiedia tawa (hereafter referred to as tawa), which is endemic to Aotearoa-New Zealand. Recalcitrant species account for 33% of all tree species (Wyse and Dickie, 2017) and have no seedbank due to their short-lived, desiccation-prone seeds. Tawa seeds are rapidly killed by desiccation (West, 1986), and mortality of seedlings due to desiccation may be affecting recruitment at some sites (Morales et al., 2016). The lack of a seed bank means seeding failure is much more likely to result in poor regeneration outcomes (Pritchard et al., 2022). Tawa produces large, oval shaped single seeded fleshy fruits, which are a significant food source for the kererū (Hemophagia novaeseelandiae) (Emeny et al., 2009), a frugivorous pigeon. Kererū have cultural significance to many of the indigenous Māori iwi (tribal groups) of Aotearoa-New Zealand (Wright et al., 1995; Timoti et al., 2017), are a source of cultural identity, highly valued for food and feathers (Feldman, 2001; Lyver et al., 2008) and are ecologically important seed dispersers (Clout and Hay, 1989; Kelly et al., 2010). In addition, the denuded and preserved tawa fruit (known as pōkere) was historically an important food source for some iwi (Doherty, 2010).
The Tūhoe Tuawhenua, a sub-regional community of Tūhoe people residing in the Te Urewera rainforest in the heart of Aotearoa–New Zealand’s North Island (Te Ika-a-Māui), have raised concerns about the diminishing tawa seed yields observed over the past few decades (Lyver et al., 2017). These indigenous elders suspect that climate change could be a contributing factor to this decline (Lyver et al., 2008). “In our time boy, the forest was lush and beautiful. There was an abundance of trees growing in the forest. Now, there are places that I have gone to and couldn’t find many tawa berries at all. They were a main part of our food source. Harvesting was from the end of December to February. There was a set time when they fall off the branches. Parekaeaea was a place where the tawa grew in abundance and they were always loaded with tawa berries” Peho Tamiana, as translated from Māori, cited in Lyver et al. (2017).
Other mechanisms, such as increased browsing pressure by introduced brushtail possums (Trichosurus vulpecula) that became established during the period of initial seeding declines, have also been posited by elders (Lyver et al., 2008). In addition, selective logging of emergent podocarpus between 1950 and 1975 has significantly altered forest structure, resulting in tawa becoming the dominant canopy species (Carswell et al., 2007).
In this paper we aim to: (1) quantify seed crops and describe patterns in space and time across the geographic range of tawa; (2) clarify weather variables correlated with seed crop size, and (3) determine how the weather variables have changed over time in Tuawhenua, and evaluate what effect this may have on fruit production. Specifically, we analyze six long-term annual tawa seedfall datasets from across tawa’s range, spanning between 8 and 18 years. We quantify patterns of interannual variability and determine whether seedfall is synchronous across sites. We model seedfall to test whether there are latitudinal and temporal trends in seedfall consistent with a susceptibility of seedfall to climate change, and identify the weather drivers affecting seeding. From this information we develop a weather-seeding model to retrospectively predict seedfall for forests of the Tuawhenua region over the previous century and identify which aspect of a changing climate might underly elders’ observations of declining tawa seed crops.
2. Materials and methods
2.1. Study species
Tawa is long-lived, shade tolerant and grows mostly in lowland mixed broadleaf-podocarp forest, where it can reach over 30 m tall and up to 1 m in trunk diameter (Knowles and Beveridge, 1982). Tawa is widespread in Aotearoa-New Zealand’s North Island up to 800 m elevation and occurs in the South Island/Te Wai Pounamu north of 42°20’ S (Knowles and Beveridge, 1982), accounting for more basal area than any other fleshy-fruited species in the Aotearoa-New Zealand flora by at least two orders of magnitude (Kelly et al., 2010). Tawa fruits are ellipsoid drupes, each containing a single seed surrounded by a fleshy mesocarp, and are the fourth largest fruit in Aotearoa-New Zealand’s indigenous flora at 20–40 mm in length and 15.5 mm in diameter (Clout and Hay, 1989; Kelly et al., 2010).
Tawa produces small (2–3 mm diameter), perfect flowers arranged in inflorescences (Dawson et al., 2011). Pollination is most likely performed by the Aotearoa-New Zealand endemic thrip, Thrips obscuratus (Norton, 1984) as floral morphology is poorly suited to wind borne pollination and pollen is produced in very low quantities (Macphail, 1980). Flowering onset varies considerably throughout the range of tawa (West, 1986), but peak flowering occurs from December through January (Roper, 1967; West, 1986; Dijkgraaf, 2002). After fertilization, perianth segments close and flowers over-winter until spring when embryos begin to enlarge (West, 1986). Mature fruits fall mostly between January and March, 12 to 14 months after flowering (Leathwick, 1984; West, 1986). Annual seed production in tawa is described as variable, with observations of intermittent large crop years interspersed with smaller crops (Beveridge, 1964; Knowles and Beveridge, 1982; West, 1986). In the highest reported seeding years, more than 100 seeds m-2 were observed beneath parent trees over an 11-year period by Knowles and Beveridge (1982) at Pureora Forest (Latitude South 36.84 decimal degrees), and Kelly et al. (2010) observed 5 to 62 seeds m-2 over a 9-year period at Blue Duck (Latitude South 42.24 decimal degrees). However, there are no published estimates of the coefficient of variation for inter-annual variability in seedfall.
2.2. Data sources
Seedfall data for six sites spanning the natural range of tawa (Figure 1; Table 1) were obtained from the New Zealand Department of Conservation’s National Seed Rain Network and our own data. Seeds were caught in traps (0.283 m2 in area except for traps at Pelorus Bridge before 2010 and before 2012 at Blue Duck which were 0.1 m2) underneath chosen parent trees and emptied several times through the season. Seed counts for each seed trap under tawa were summed to give annual seedfall counts for each tree. Dispersed, whole and herbivore-damaged fruits were included, but aborted immature fruits were not.
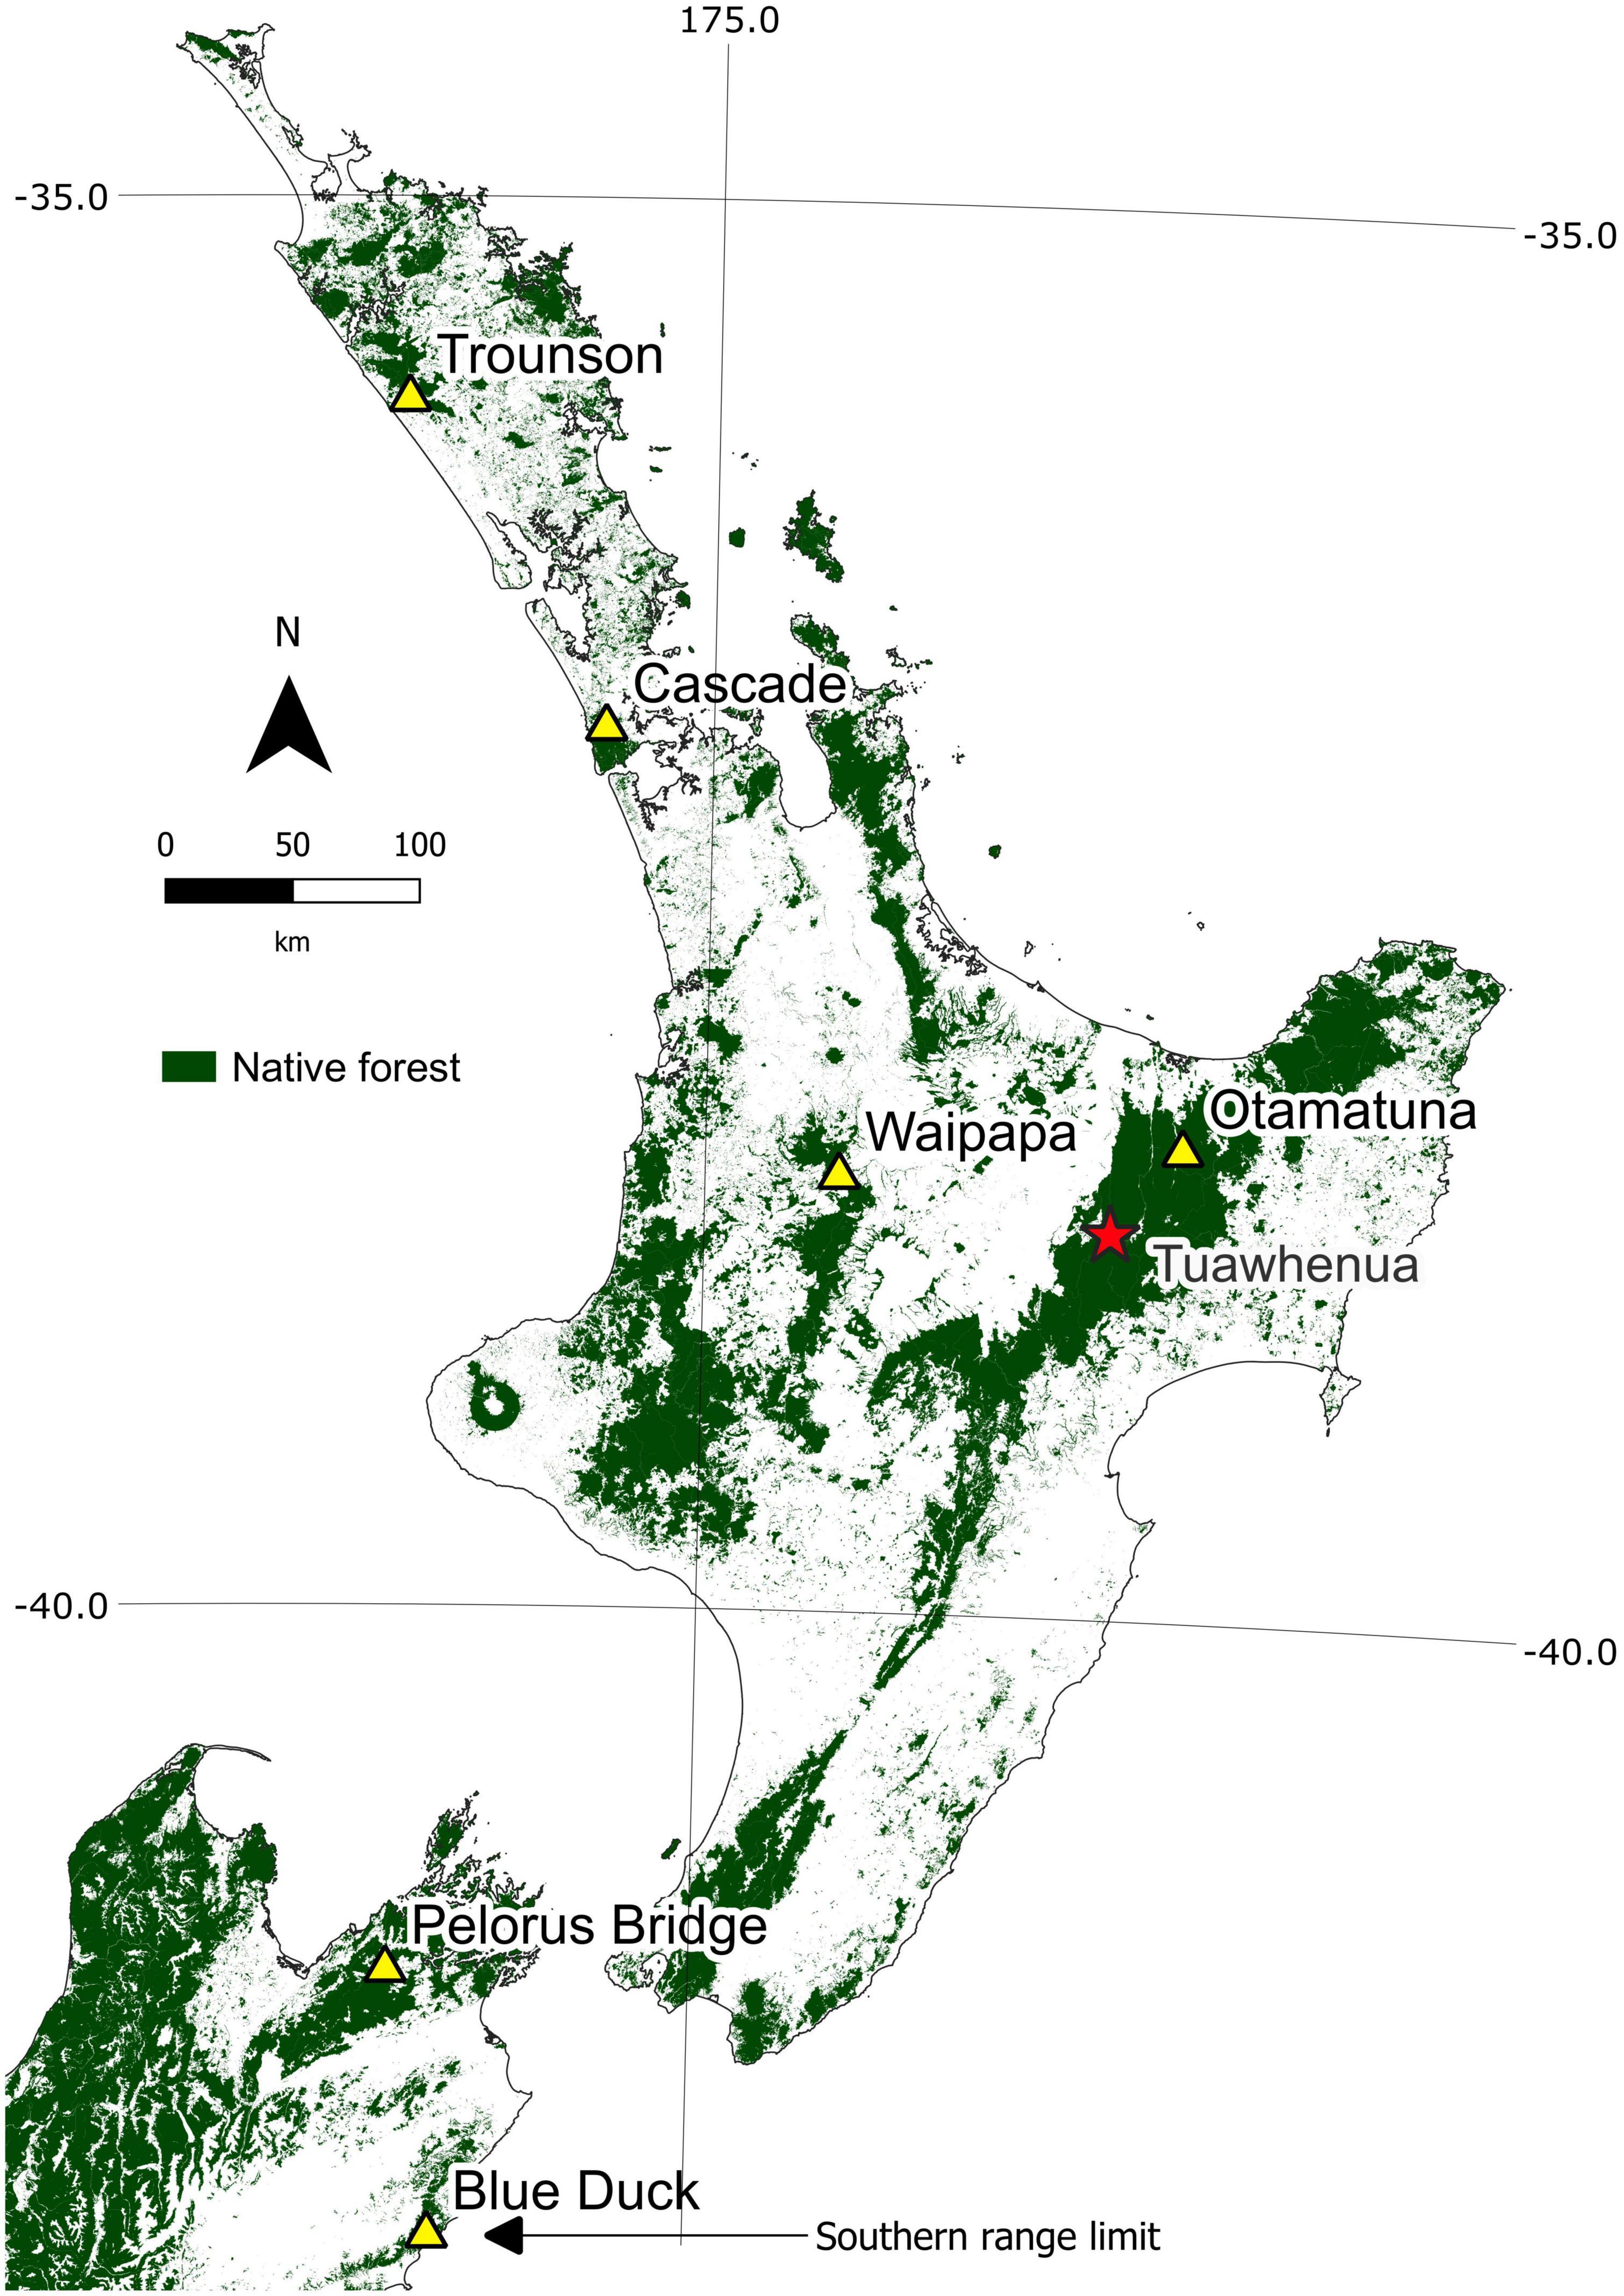
Figure 1. Location of the six seedfall sites (yellow triangles) spanning the latitudinal range of tawa. Current native forest cover is represented by the shaded areas. The red star marks the location of the Tuawhenua region. Native forest cover data obtained from Ministry for the Environment, licensed under CC BY 4.0.
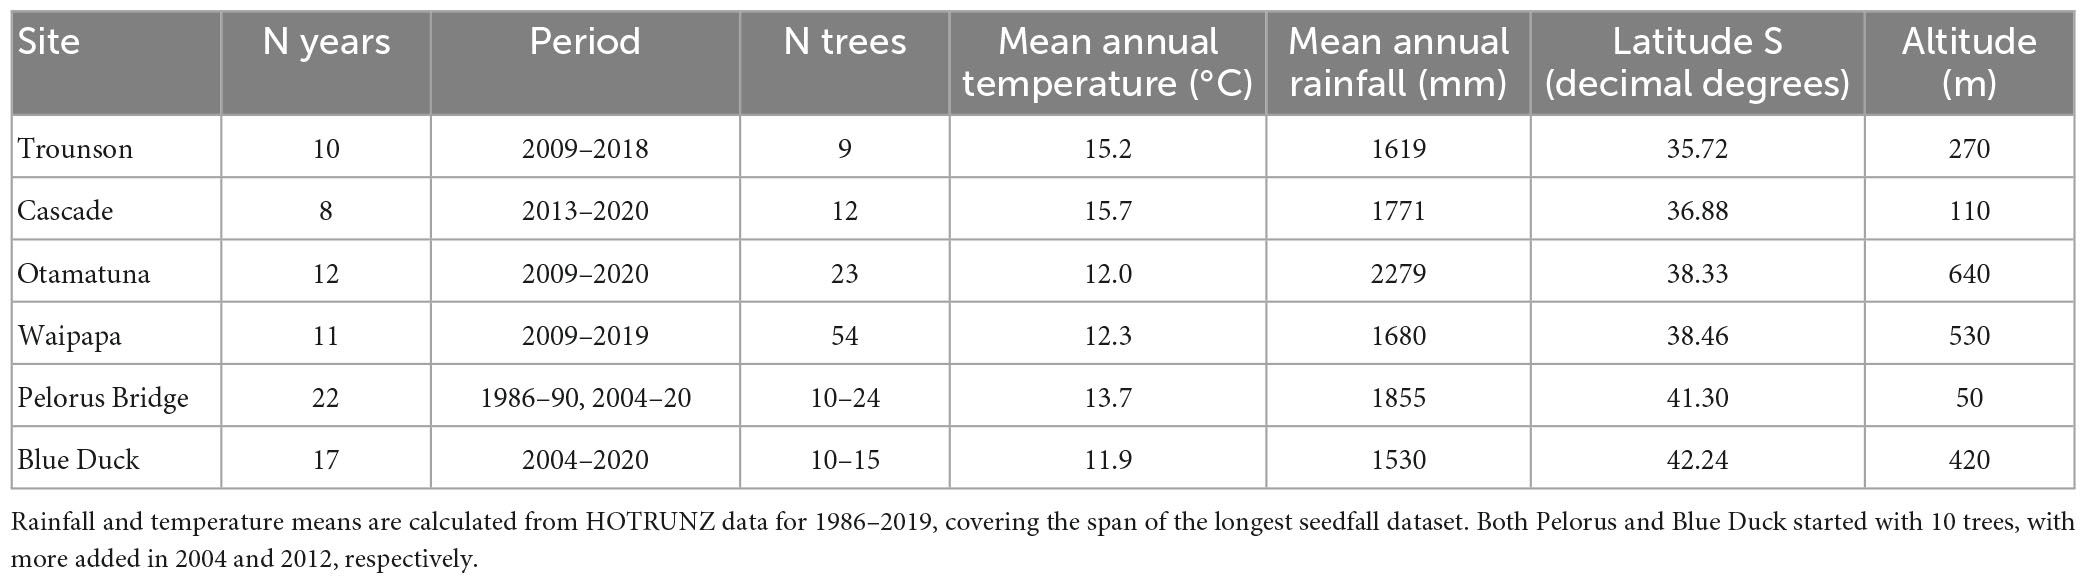
Table 1. Summary of tawa seedfall datasets giving years and trees sampled, and study site climates, ordered by latitude.
Weather data were obtained from the History of Open Temperature and Rainfall with Uncertainty in Aotearoa-New Zealand (HOTRUNZ) dataset (Etherington et al., 2022). HOTRUNZ provides estimates of monthly average rainfall and air temperature for 1 km grid cells across the land area of mainland Aotearoa-New Zealand using climatological aided natural neighbor interpolation. HOTRUNZ offers advantages over other Aotearoa-New Zealand weather datasets in that it is open access, and covers a long period (1910–2019).
2.3. Seeding patterns in time and space
Coefficient of variation (CV, i.e., standard deviation/mean) values were calculated to quantify inter-annual variability in seedfall for individual trees (CVi) and site means (CVp; Koenig et al., 2003 Oikos).
Synchrony of seed production among trees within a site, and among sites, was measured by calculating pairwise cross-correlations (Pearson’s r) between annual seedfall counts for overlapping years (Buonaccorsi et al., 2003; Koenig et al., 2003). Correlation scores for tree pairs within a site were then averaged to give a site average pairwise correlation value. For correlations between site pairs, the number of years of overlap varied from 5 years (Cascade-Trounson) to 17 years (Pelorus-Blue Duck). Pearson’s r correlations were also calculated for monthly temperature and rainfall among sites for the period 1986–2019 to assess spatial consistency in weather. Monthly temperatures were first detrended by subtracting the site mean for that month calculated over the 1986–2019 period to avoid synchrony of seasonal changes elevating the calculated correlation coefficients.
To determine if seedfall had declined through time and varied latitudinally across tawa’s range, a generalized linear mixed model (GLMM) was fitted to the seedfall data with year and latitude as fixed effects. The GLMM used a negative binomial error distribution and a log link. Random intercepts for both seed trap and site were included to control for repeated measures and spatially clumped data, respectively. R2 statistics for GLMM model fits were calculated using linear regressions between observed and predicted seedfall values for marginal (fixed effects) and conditional (fixed and random effects) model components separately.
2.4. Effects of weather on seedfall
We use the term ‘weather’ to refer to short-term rainfall and temperature variables experienced by trees during each season of seed development. We estimated the effects of weather on seedfall by fitting GLMMs to the seedfall data with weather predictors as fixed effects. An ‘all sites’ model was fitted to the complete tawa seedfall dataset, as well as separate models fitted to data for each site individually, to investigate differences in weather responses across tawa’s range. Individual site models included a tree level random effect, while the all-sites model included random intercepts for both tree and site.
Weather predictor variables for tawa were constructed from rainfall and temperature means extracted from the corresponding HOTRUNZ grid cell for each of the six study sites. A priori weather variable selection was guided by mechanistic drivers of variable annual seed production in perennial plants, and key phenological timings relating to tawa flower and seed production (Table 2; Figure 2). We used weather data for conventional 3-month seasonal blocks (December to February for summer, etc.) or larger, to minimize risks of overfitting.
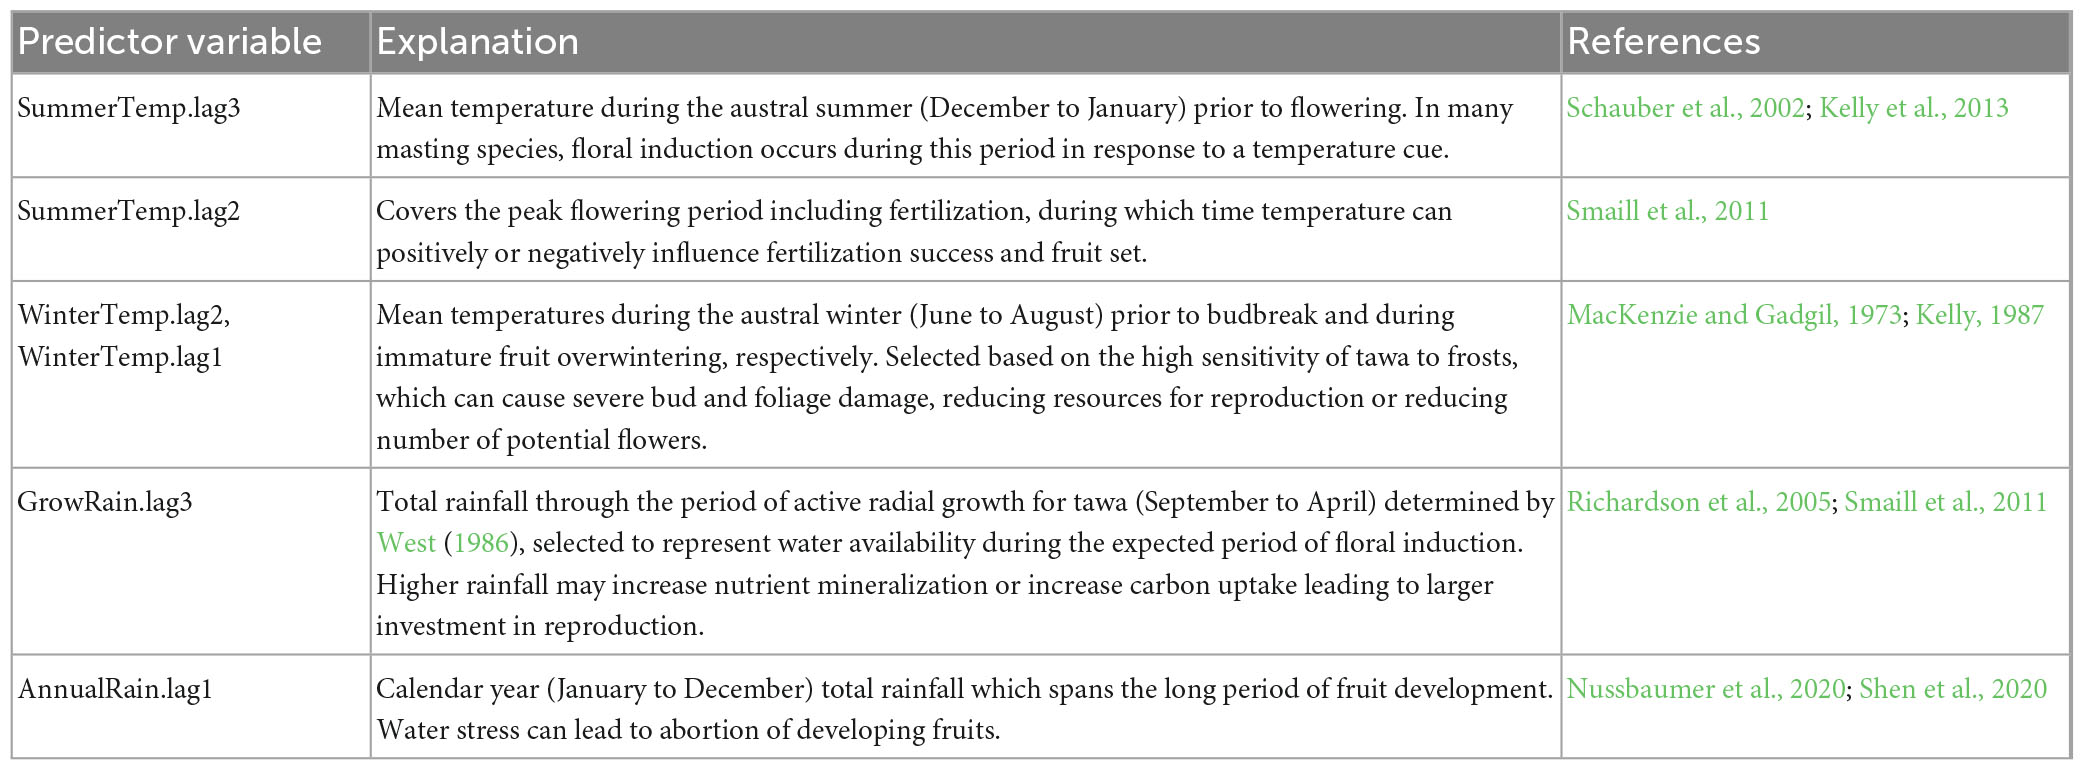
Table 2. Weather variables potentially related to seedfall in tawa, and the mechanisms through which they may influence seed production.
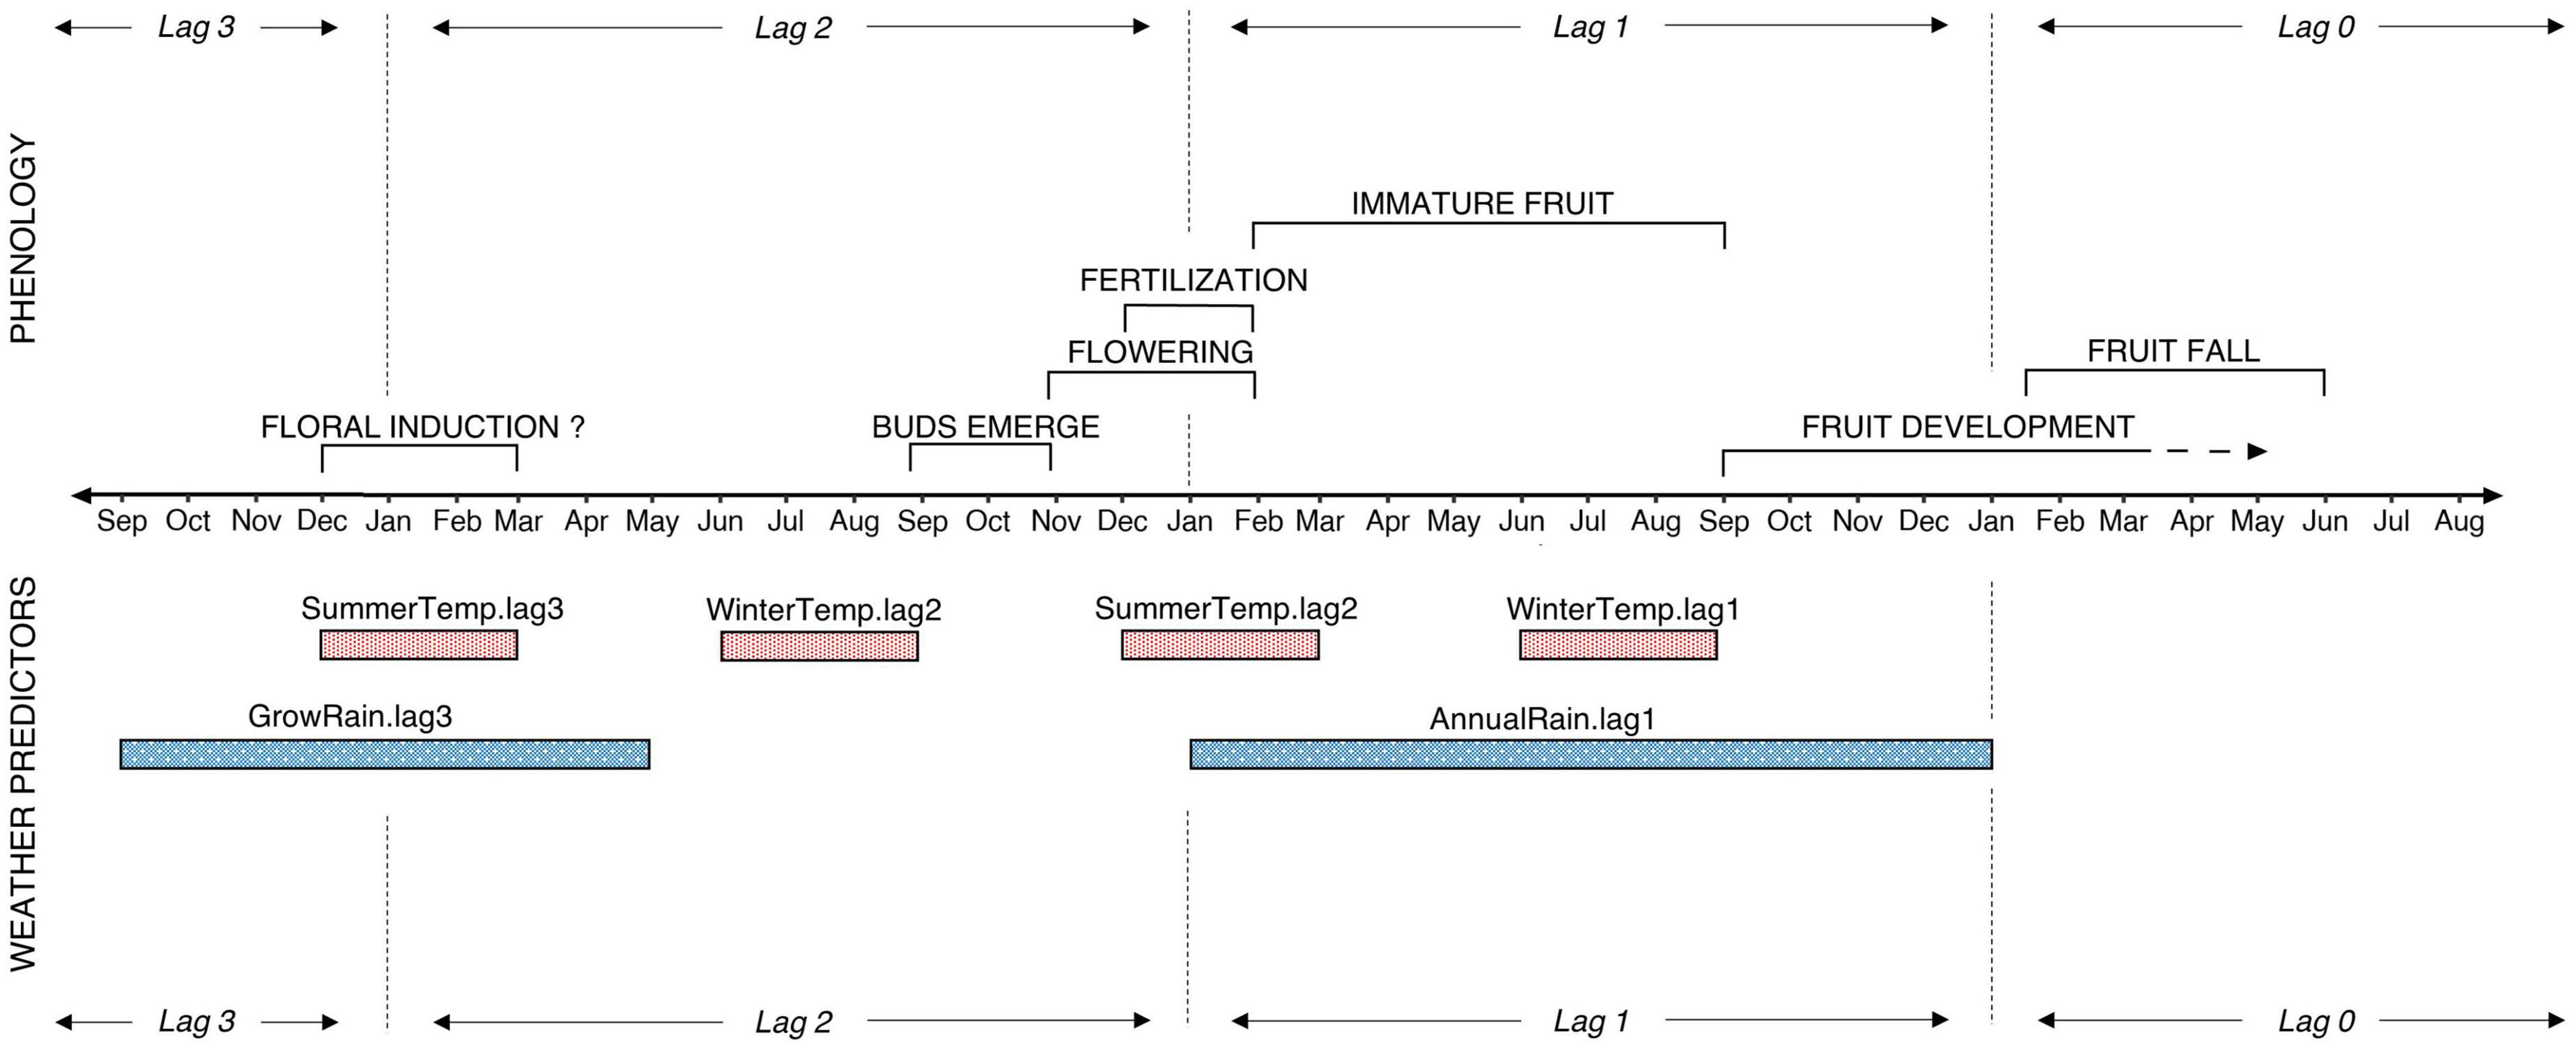
Figure 2. Tawa fruiting phenology, and weather predictor variables used to construct seedfall models. Phenology timings indicate averages for tawa across the literature (see Roper, 1967; Leathwick, 1984; West, 1986; Dijkgraaf, 2002).
For each weather predictor, we use the term ‘lag’ to refer to the number of years between each predictor and the year in which seedfall occurs (e.g., lag0 is the year of seedfall and lag1 is 1 year before seedfall). Weather predictors of seedfall are in chronological order as follows. GrowRain.lag3 is the total rainfall during the period of active radial growth for tawa in the year which floral induction occurs, selected to represent water availability. SummerTemp.lag3 is the mean temperature during the austral summer (December to January), which for many masting species is when floral induction occurs in response to a temperature cue. WinterTemp.lag2 and WinterTemp.lag1 are the mean temperature during the austral winter (June to August) prior to bud break and during immature fruit development, respectively. These periods of winter temperatures were selected based on tawa’s frost sensitivity. AnnualRain.lag1 is the total calendar year (January to December) rainfall for the period of fruit development when water stress may lead to abortion of immature fruit. See Table 2 for detailed explanations and references.
2.5. Climate trends and seeding in Tuawhenua
Here, we use the term ‘climate’ to refer to long-term, multi-decadal, changes in temperature and rainfall conditions. To make predictions for Tuawhenua, past seedfall was modeled using historical rainfall and temperature data for the period of 1910–2019 from the HOTRUNZ dataset fitted using the all-sites parameter estimates. As no seedfall data from Tuawhenua were used to construct the model, the expected population means for the random intercepts were to be assumed (i.e., zero). Our hindcasting analysis assumes that the relationship between weather and reproduction in tawa has not changed during the 1910–2019 period.
All statistical analyses were performed with R Statistical Software (v4.2.2; R Core Team, 2022) and all GLMMs were fitted using the package glmmTMB (v1.1.4; Brooks et al., 2017). Model diagnostics were performed with the package DHARMa (v0.4.6; Hartig and Hartig, 2017). Significance of fixed effects in the GLMMs was identified when the Wald 95% confidence intervals excluded zero.
3. Results
3.1. Seeding patterns in time and space
The two most southern sites averaged >40 seeds m-2yr-1, whereas Waipapa and the two Northland sites averaged <3 seeds m-2yr-1 (Table 3; Figure 3). The other North Island site at Otamatuna was intermediate. The low seedfall at the three low seed sites meant that more than three-quarters of all traps averaged less than 3.53 seeds m-2yr-1 (i.e., <1 seed m-2yr-1 in the 0.283 m2 traps), and at Cascade nearly half of the traps never caught a seed (Table 3). This limited some of the subsequent analyses and the CVi and synchrony calculations exclude trees with zero seeds caught.
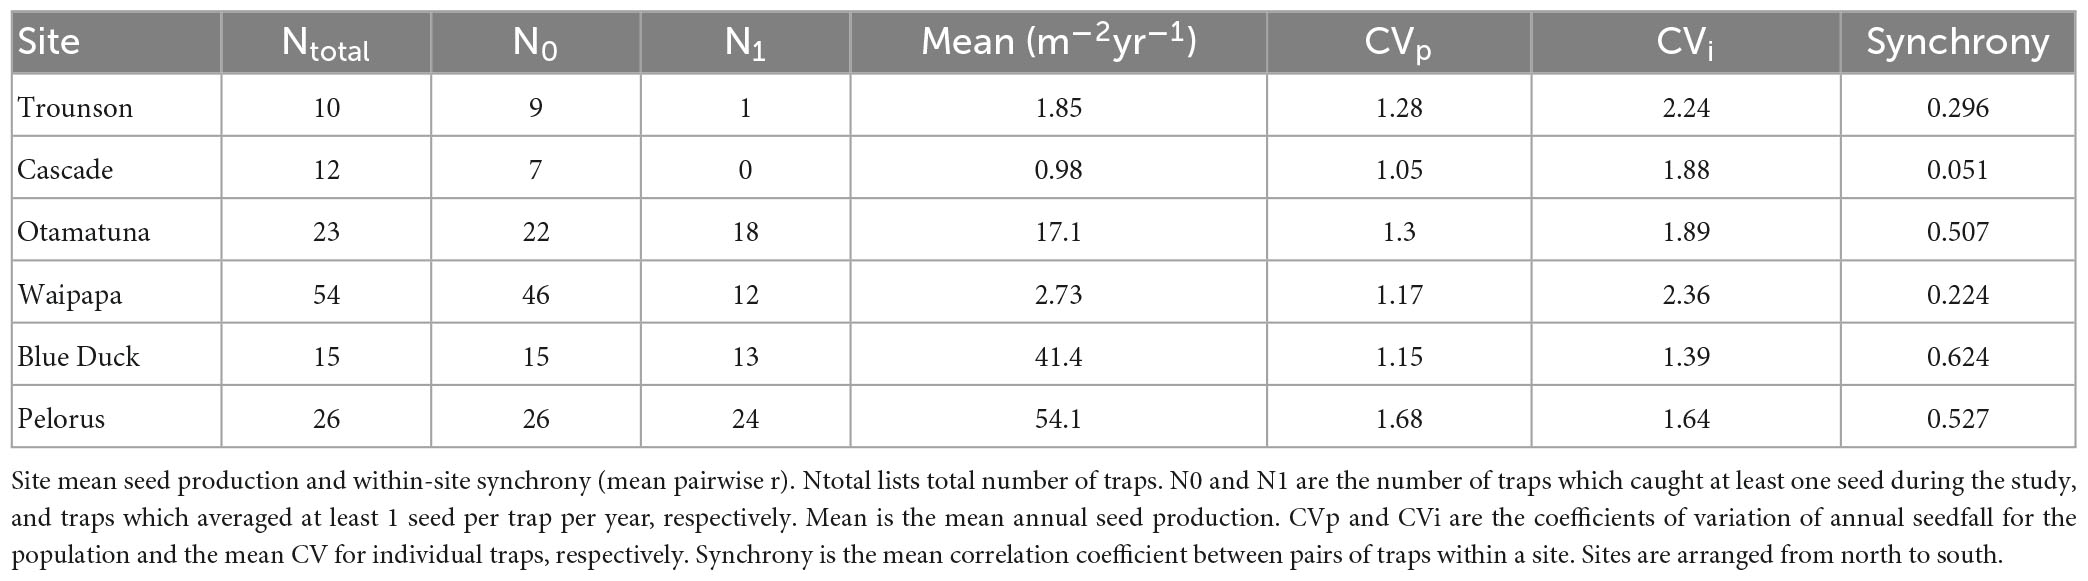
Table 3. Summary of site seeding characteristics.
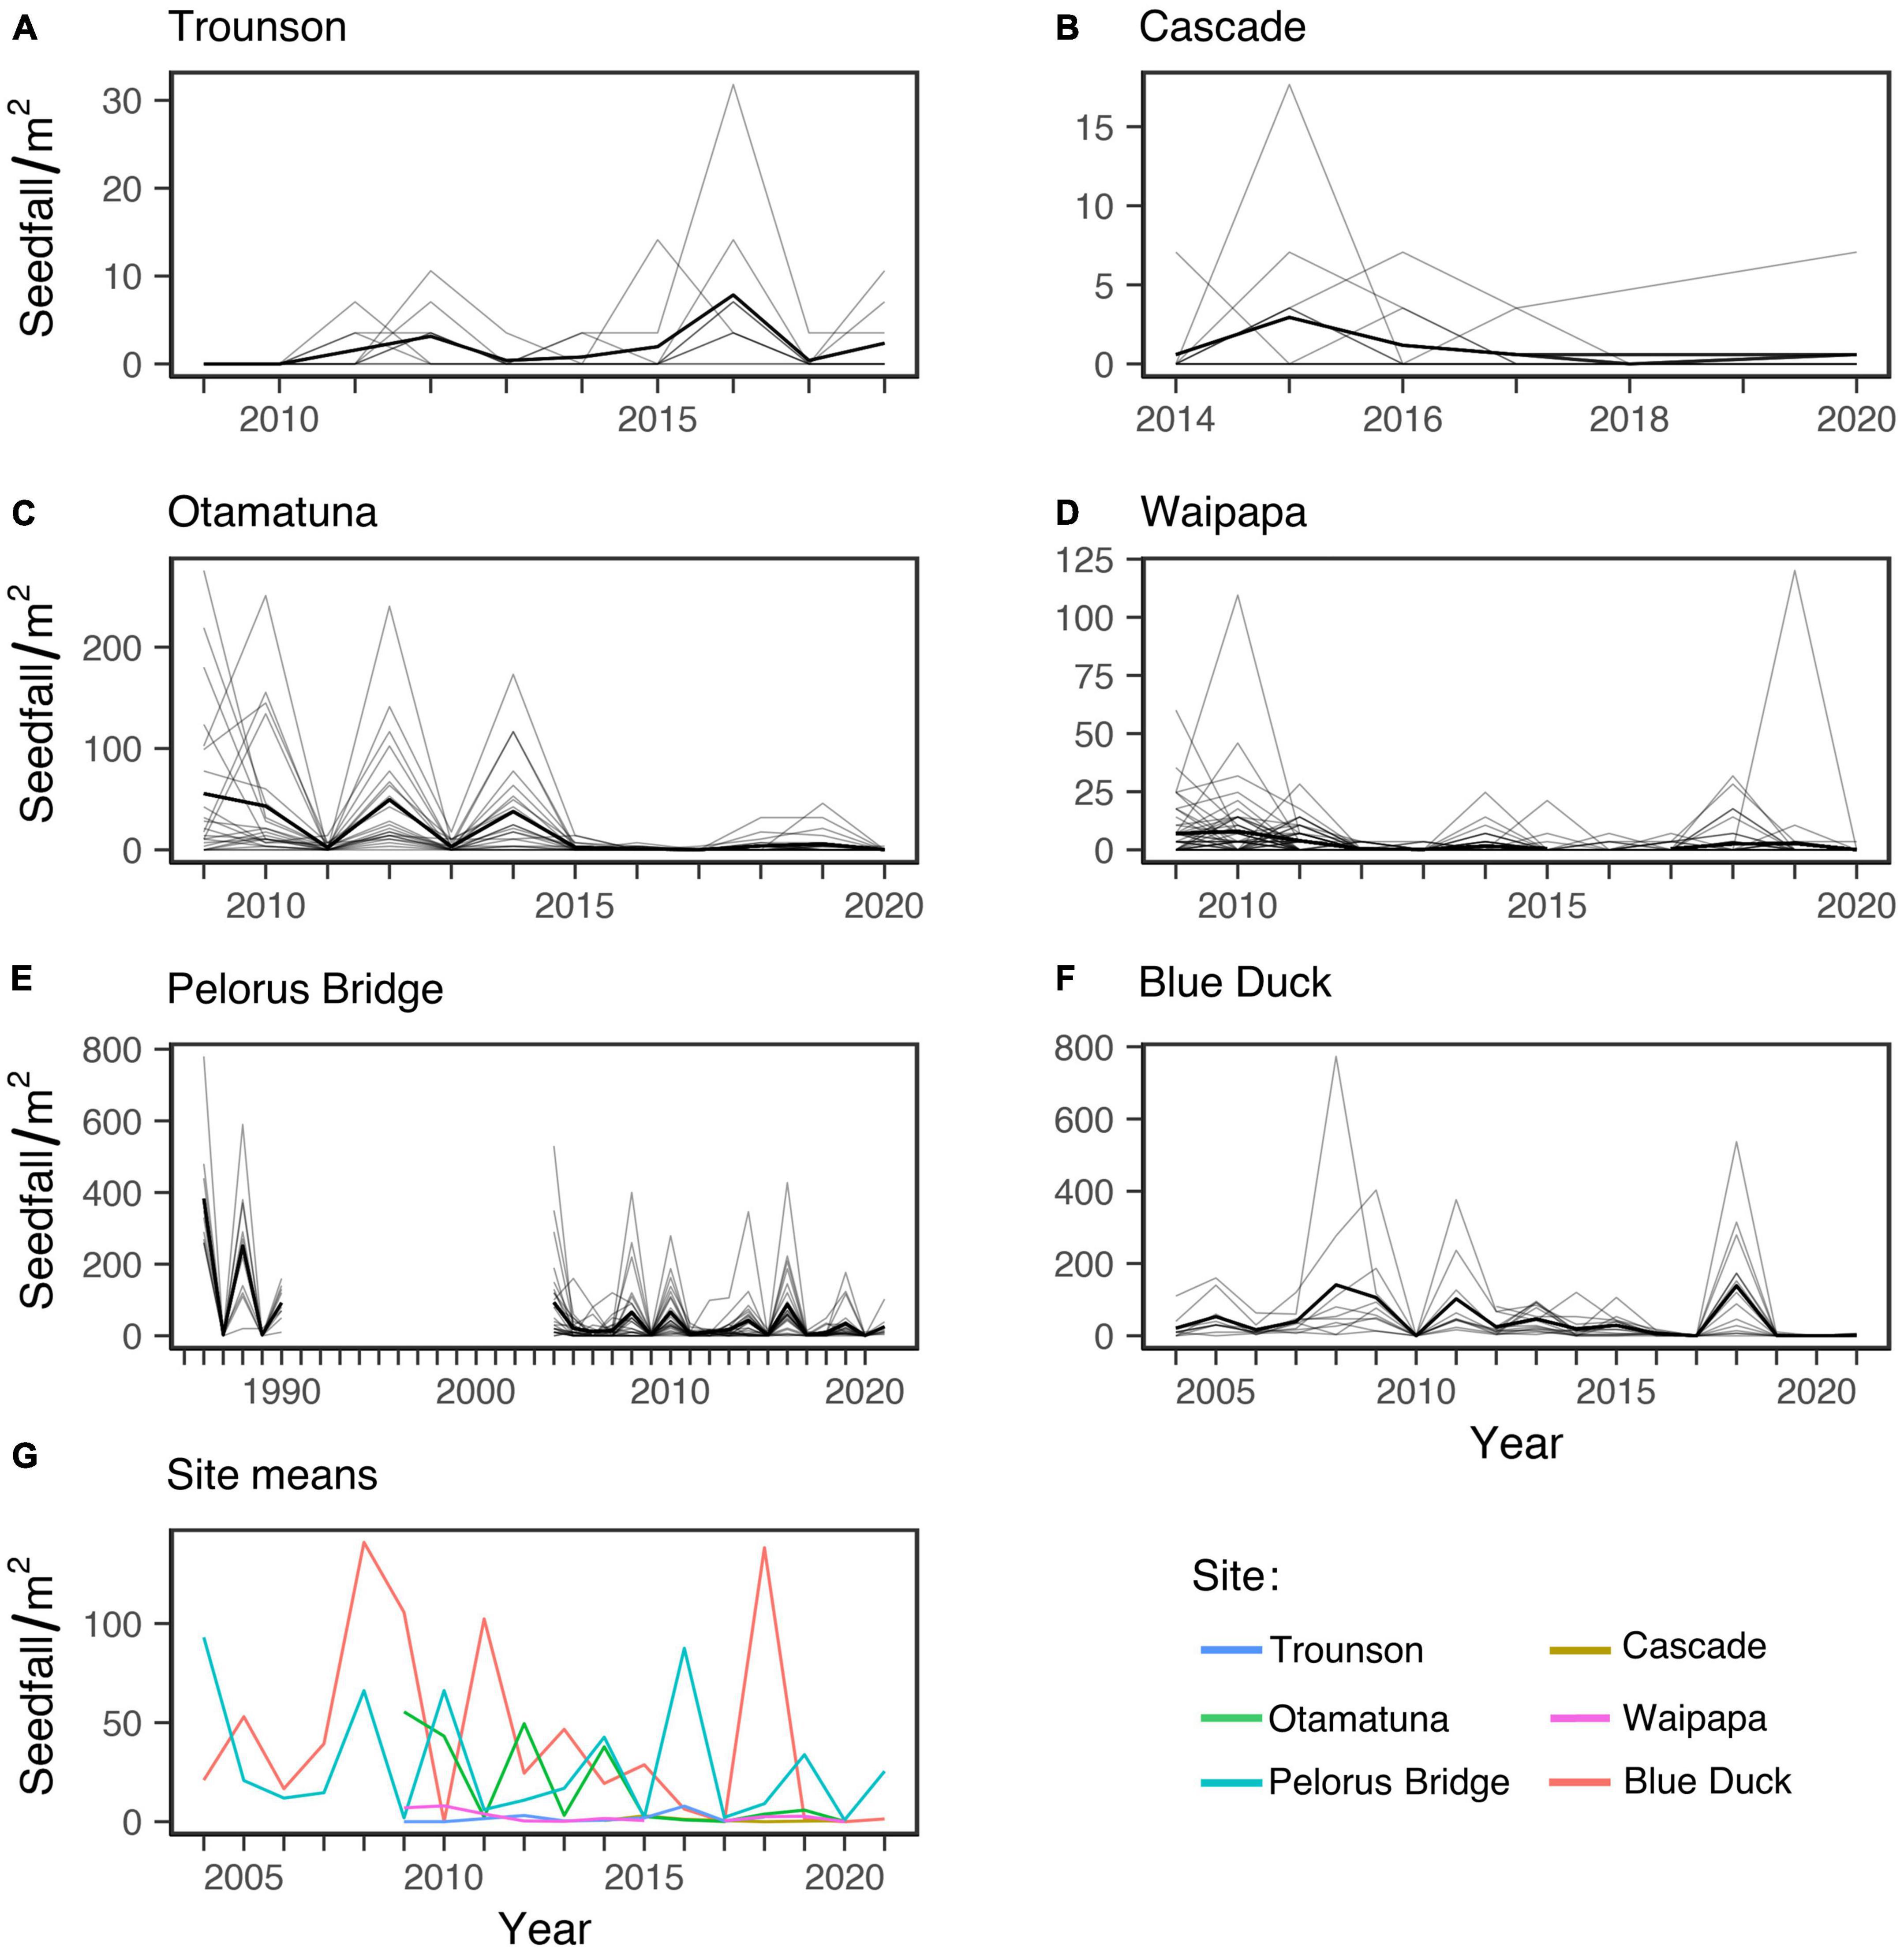
Figure 3. Tawa seedfall through time. (A–F) Show annual fruit production at each site, where thin lines are individual trees, and the thick lines are site means. Panel (G) shows mean annual seedfall for all sites, omitting older observations for Pelorus Bridge (1986–90) to aid comparison among sites.
The population-level variation (CVp) at each site was in the range 1.0–1.7 which is moderate to high variability (Table 3). For the three higher-seedfall sites this was achieved with moderate levels of CVi and high synchrony between plants (0.51–0.63) (Figure 3). In contrast, the lower-seedfall sites had higher mean CVi values and much lower synchrony, as expected. The CVi is typically higher for trees with more 0 years, and the synchrony generally falls for very low-fecundity plants (see Section 4. “Discussion”).
Despite the generally high level of synchrony across time among trees within higher-seedfall sites, there was essentially no synchrony across time between sites, Figure 3G. The mean pairwise correlation among sites was r = −0.001, with an average of 9.7 years of overlap. This was not just due to the three lower-seedfall sites, which had both low seed production and fewer years of data (especially Cascade). Even considering only Blue Duck, Pelorus and Otamatuna the mean among-site correlation was still close to zero (mean r = 0.006, mean years = 13.7).
Whilst sites were largely asynchronous, there was a systematic decline in seedfall with time across all sites, time main effect: −0.10, 95% CI [−0.08, −0.23]. Seedfall also increased from southern sites to northern sites, latitude main effect: −0.50 [−0.25, −0.75].
3.2. Effects of weather on seedfall
Weather variables were significantly correlated across sites. This was especially true for temperature; the detrended monthly mean temperatures had an average between-site correlation of 0.784, ranging from a high of 0.870 at the two closest sites (Otamatuna-Waipapa) and a low of 0.656 at the most distant (Trounson-Blue Duck). As expected, rainfall had lower correlations with a mean of 0.439 and a range of 0.786 (Cascade-Trounson) to 0.202 (Blue Duck-Pelorus). All pairwise correlations between sites, for both temperature and rainfall, were statistically significant (n = 408 months, P < 0.05).
Across all weather predictors of seed crops, the direction and size of coefficient estimates varied among sites (Figure 4; Supplementary Table 1). This is not unexpected considering some sites have few years of data (6–12 years), and the particular weather conditions during each short monitoring period would affect which variables were significant, e.g., if a site had good rainfall throughout, a possible effect of dry weather would not be detectable. However, there was broad consistency, especially for temperature predictors where Summer lag 3, Summer lag 2 and Winter lag 1 were all negative in the all-sites model and most separate site analyses. Rainfall was more variable within individual sites, but was significantly positive in the all-sites model for both lag 2 and lag 1. The individual site model for Cascade did not converge and has therefore been omitted.
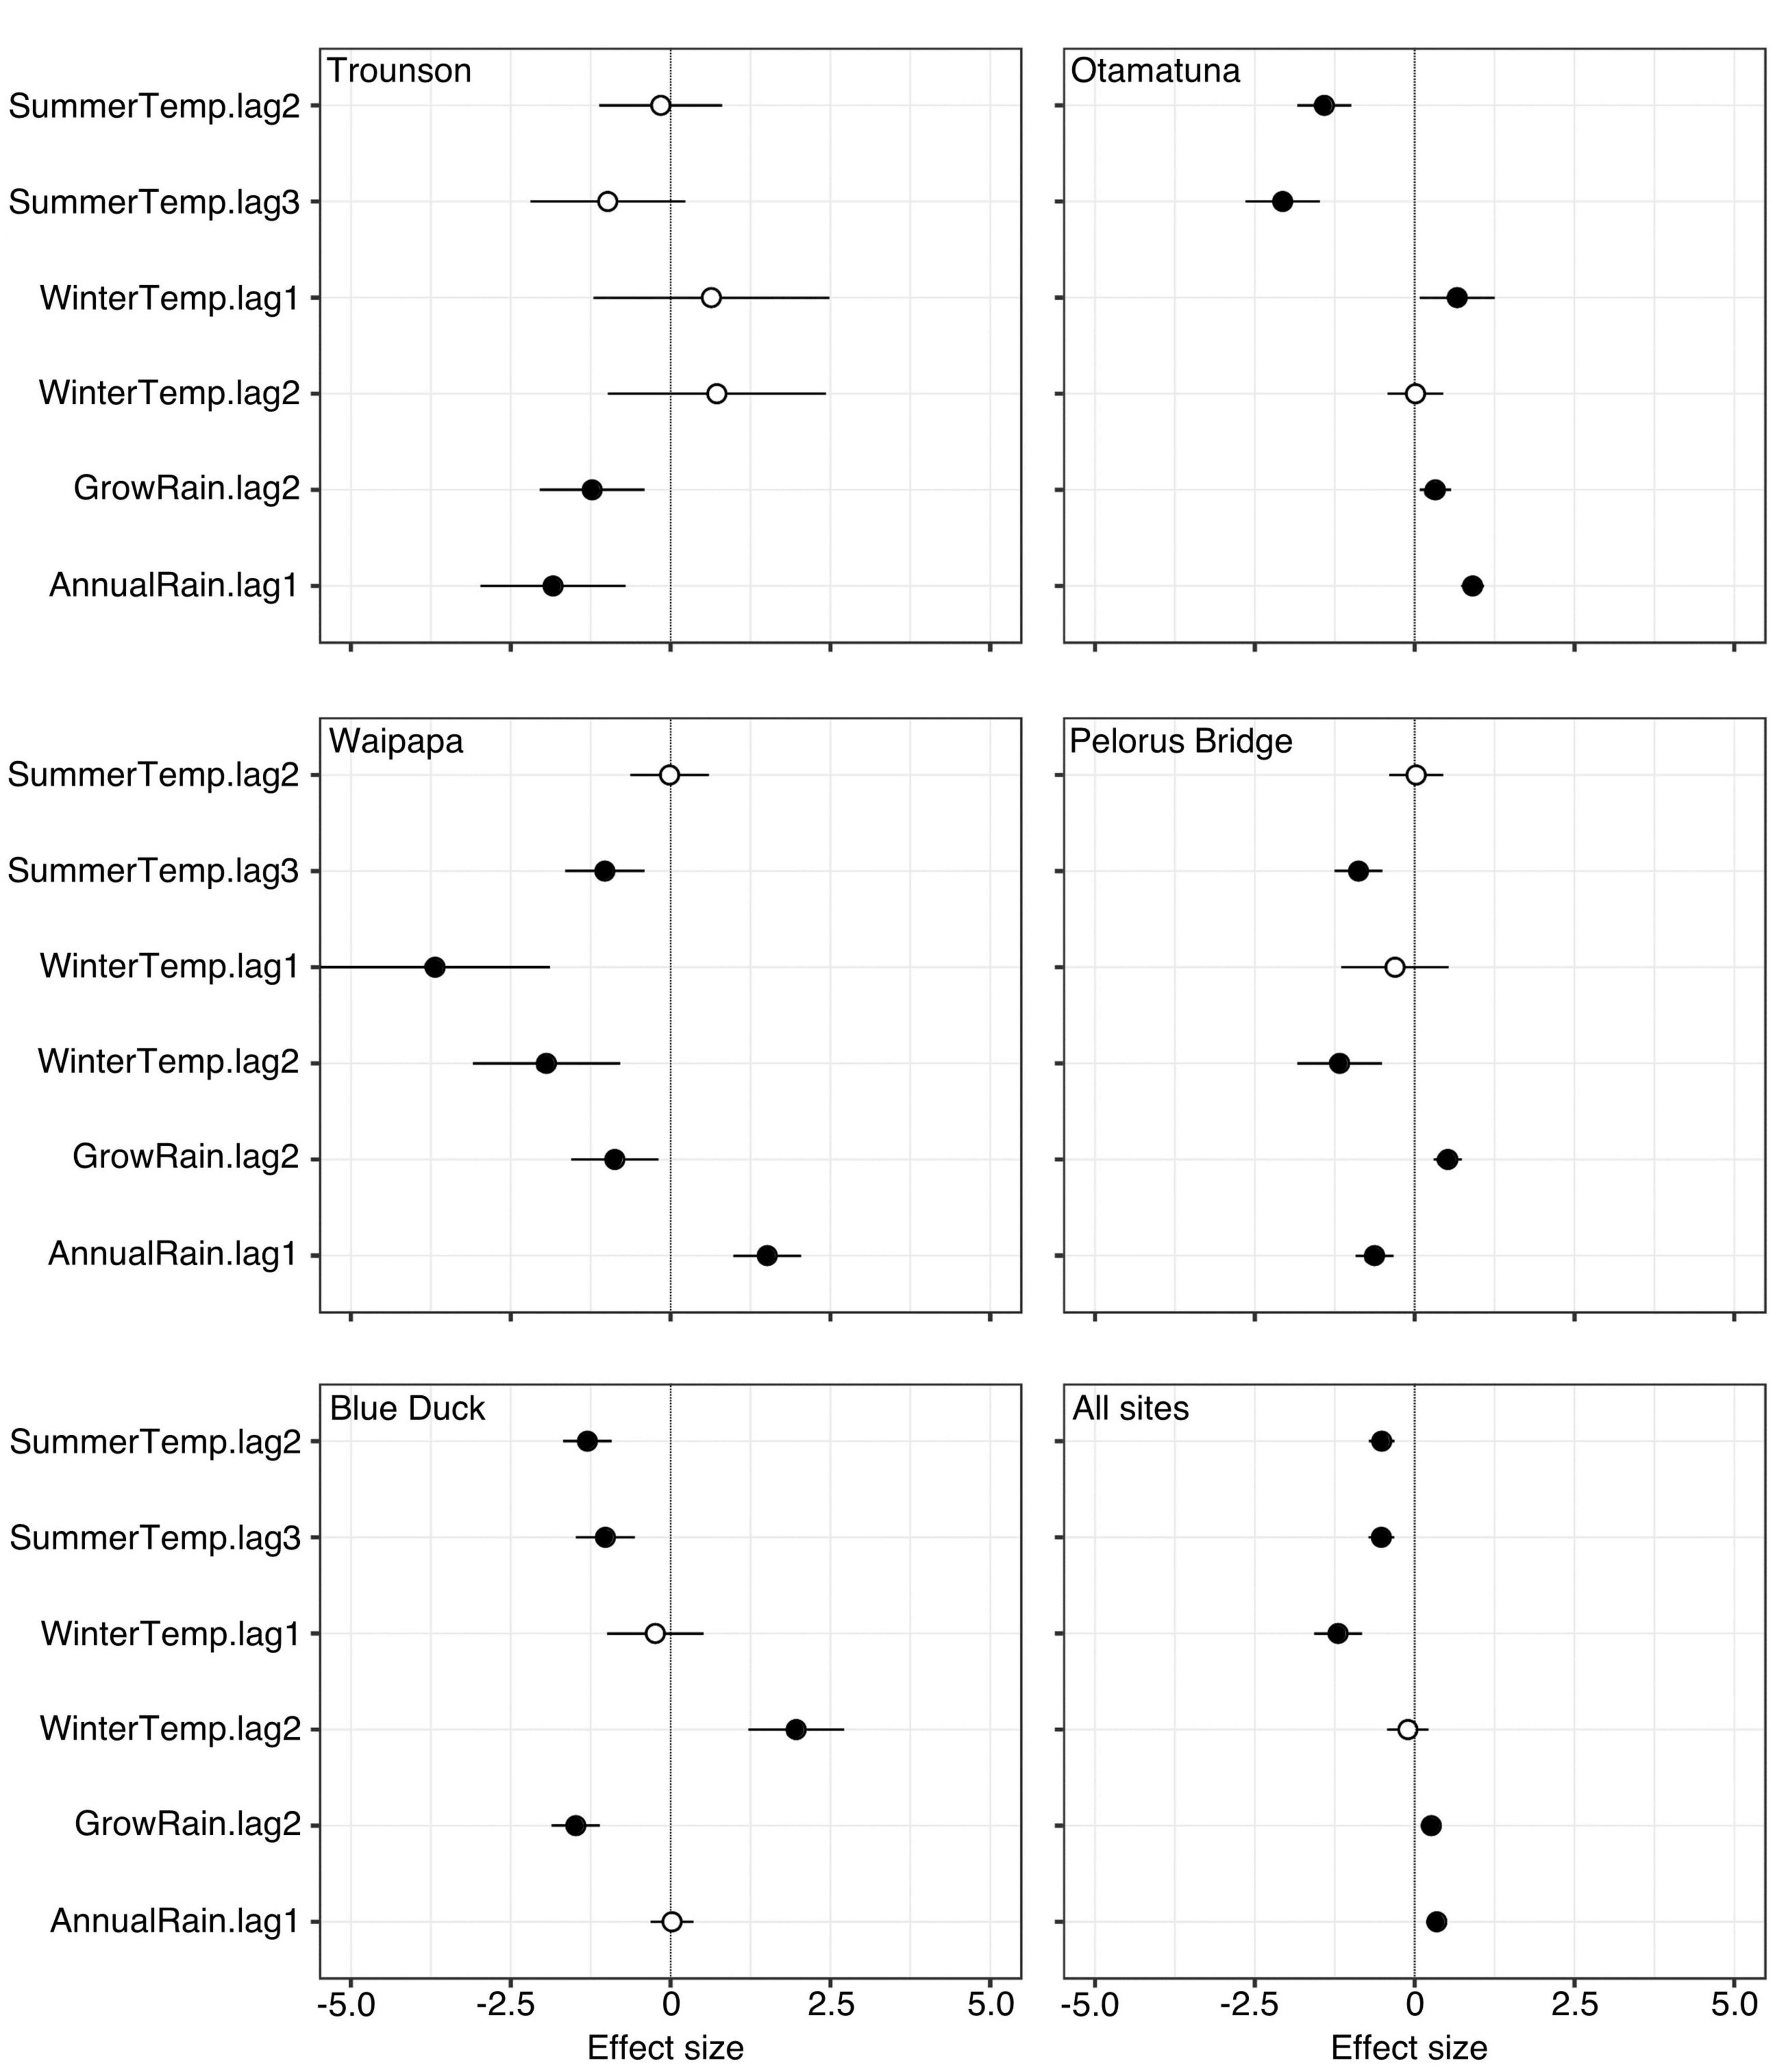
Figure 4. Coefficient estimates for weather models fitted to seedfall data for all sites and individual sites. Cascade is not presented as the model for that site could not be fitted due to the shorter dataset and small number of traps which caught any seeds, but those data are included in the all-sites model. Points to the left of the vertical lines indicate a negative effect on seedfall and to the right, a positive. Horizontal bars show Wald 95% confidence intervals. Significant (P < 0.5) effects indicated by filled points. All coefficient estimates are given in table format in Supplementary Table 1.
The overall level of fit (marginal and conditional R2, given for all models in Table 4) were reasonably high within the three higher-seedfall sites, Otamatuna (marginal R2 = 0.17, conditional R2 = 0.48), Pelorus Bridge (marginal R2 = 0.26, conditional R2 = 0.49) and Blue Duck (marginal R2 = 0.20, conditional R2 = 0.48), and more variable at Waipapa (marginal R2 = 0.05, conditional R2 = 0.18) and Trounson (marginal R2 = 0.22, conditional R2 = 0.22). The all-sites model had a reasonably high conditional R2 (0.32) but relatively low marginal R2 (0.03), perhaps because of unmeasured site-specific factors responsible for the order of magnitude difference in mean seedfall between the most and least productive sites.

Table 4. R-squared statistics for seedfall models calculated using linear regression between predicted and observed seedfall values.
The all-sites model (including Cascade data) showed that tawa produces larger seed crops under relatively low temperatures and high rainfall. This is consistent both with the observed decline in seedfall through time, as all sites have become significantly warmer over the past several decades (see Supplementary Figure 1), and with the frequent failure of trees to produce any seed at the warmer, northernmost sites at least since monitoring began in 2008.
3.3. Climate trends and seeding in Tuawhenua
Over the past century, the Tuawhenua region has experienced significant warming during the seasonal windows relevant to tawa seed production (Figures 5A, B). Average winter and summer temperatures were 1.76°C and 0.98°C higher, respectively, for the 1961–2019 period compared to 1910–1960. Annual rainfall showed a slight increase from 1910 until around 1970, then remained consistent other than the recent extremely dry years in 2018 and 2019 (Figure 5C).
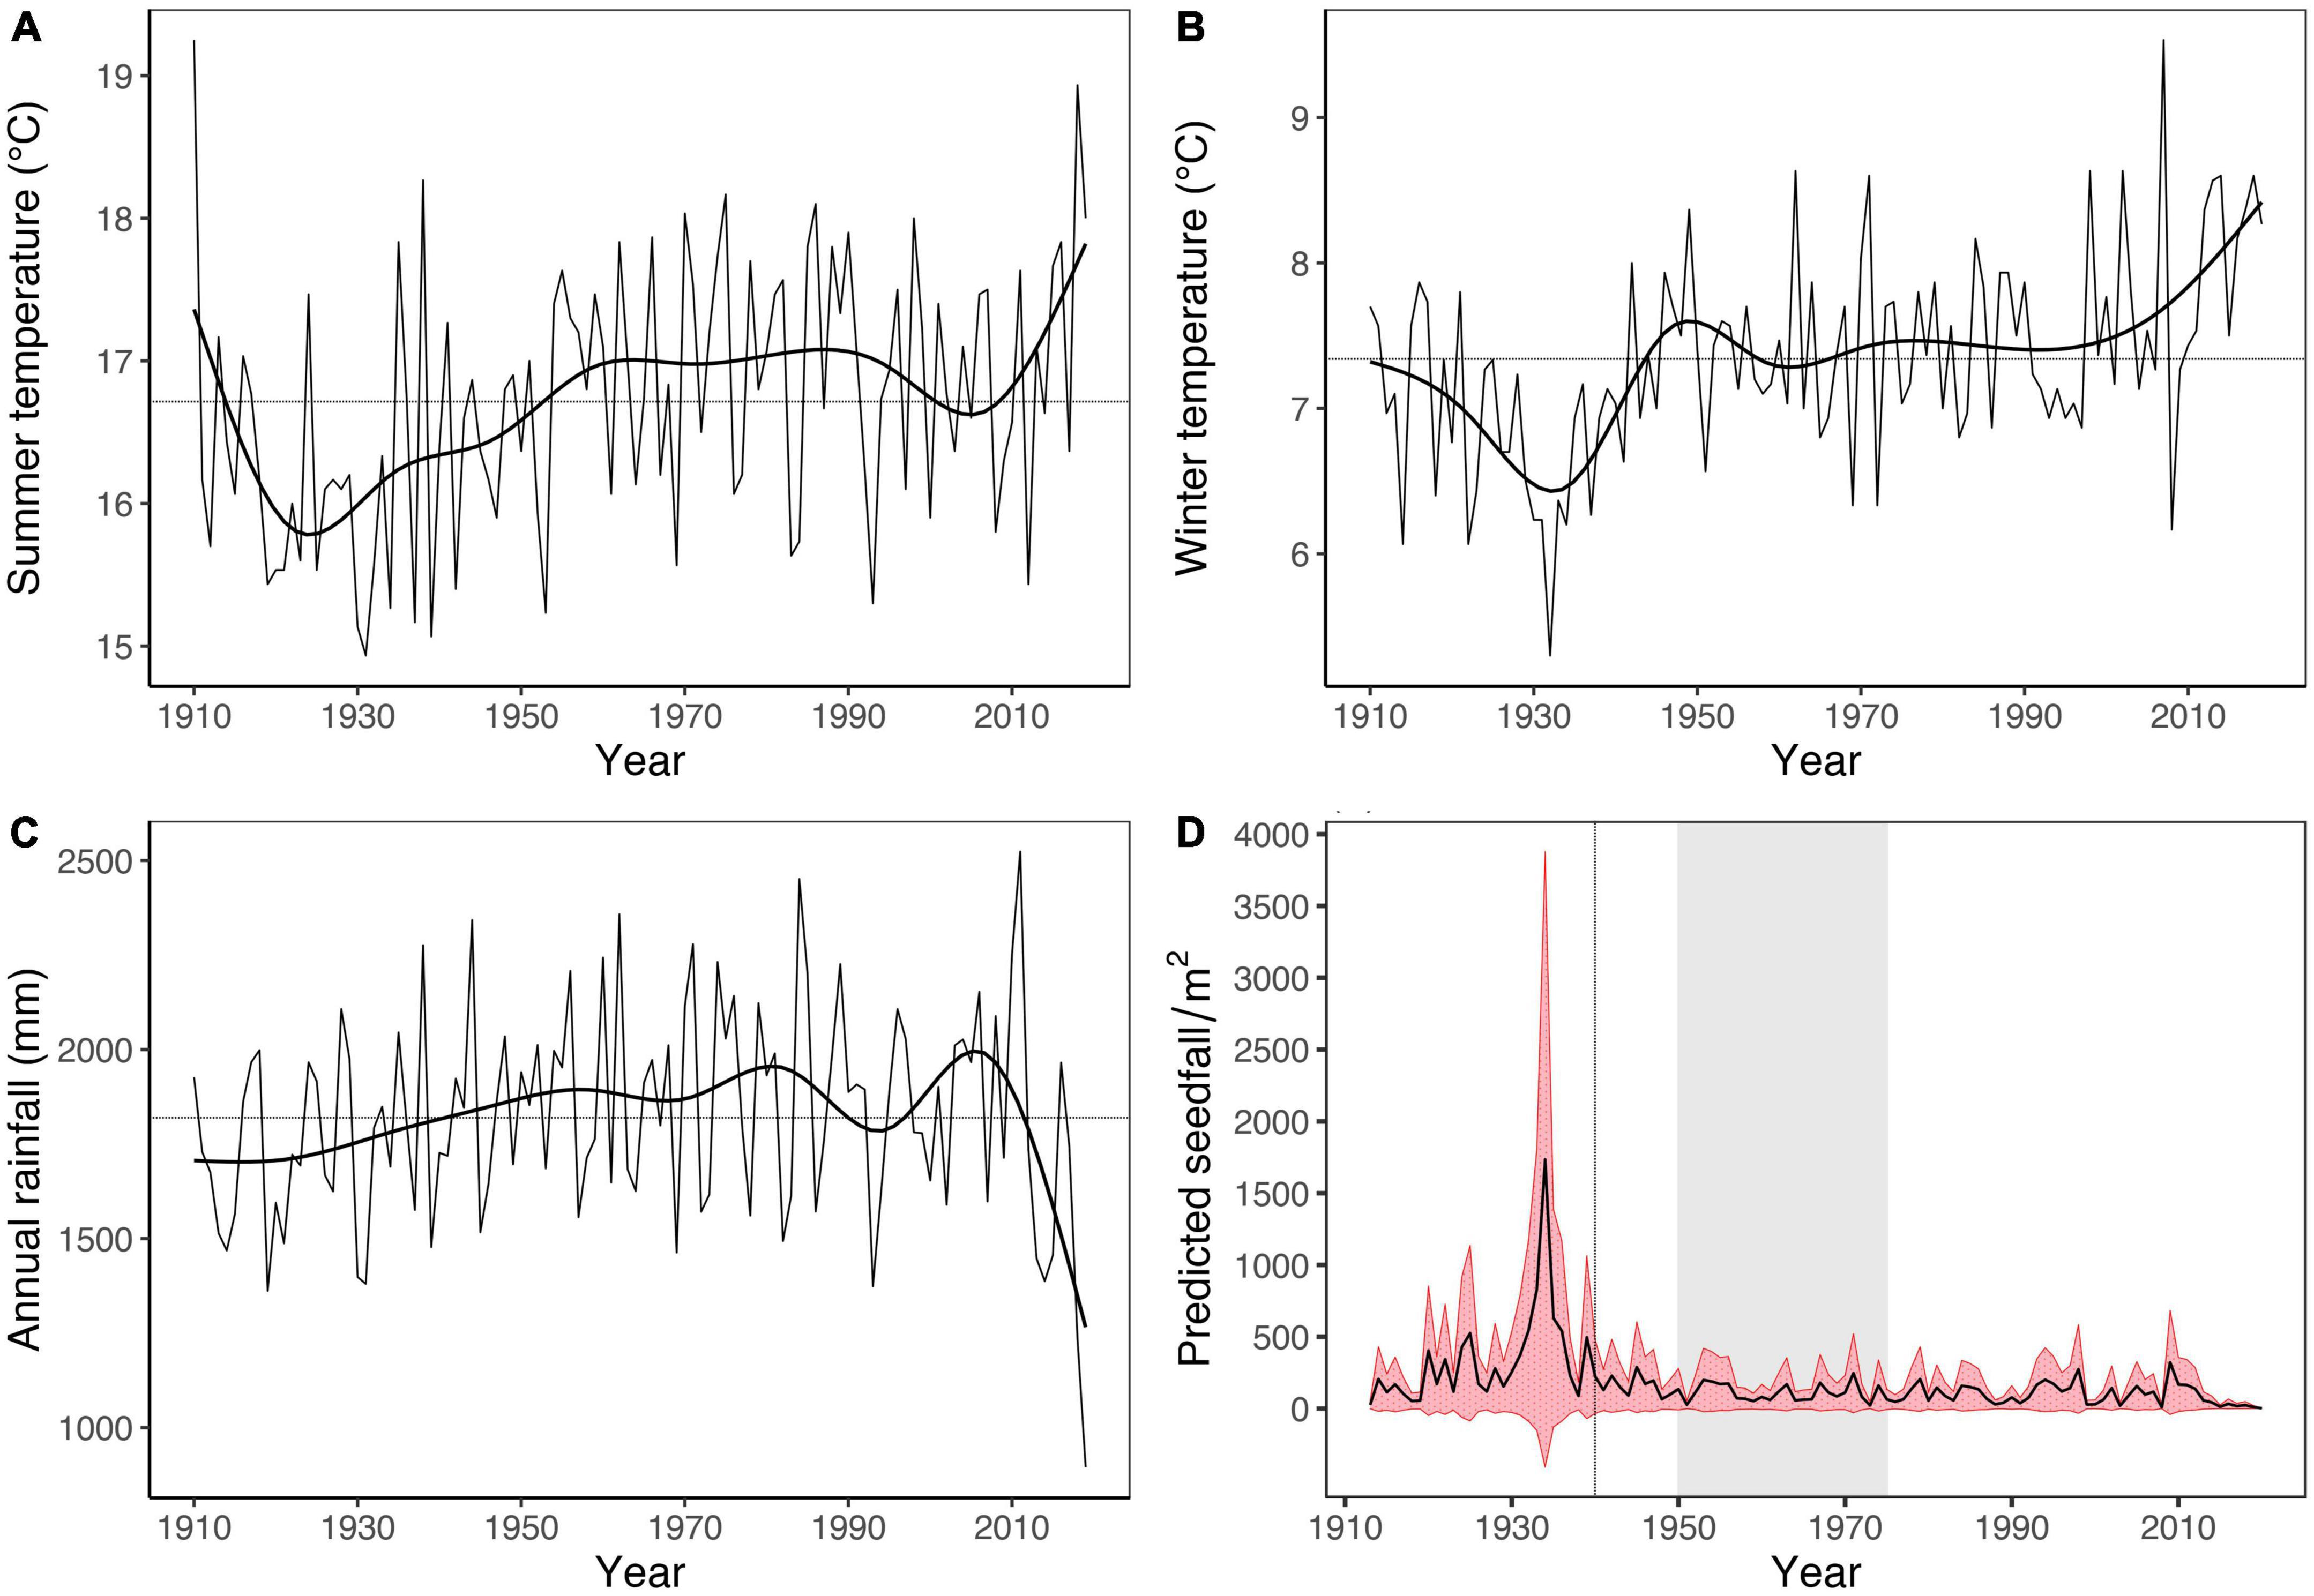
Figure 5. (A–C) Trends for weather variables significantly related to tawa seedfall for Tuawhenua and between 1910 and 2019. Horizontal lines indicate the average for each variable over the 1910–2019 period. A generalized additive model with 10 degrees of freedom was used to fit each trendline to aid visualization of changes in conditions over time. (D) Seedfall predictions for Tuawhenua between 1913 and 2019 based on weather correlates of annual seed production in tawa (seedfall was not predicted for 1910, 1911, and 1912 due to the 3-year lag of weather predictors). Weather variables used for predictions were the same as those used to model tawa seedfall, presented in Figure 4. Prediction standard errors are represented by the red shaded area. The vertical dashed line indicates when possums became common in Tuawhenua (Lyver et al., 2008) and the gray shaded area is the period when selective logging of podocarpus occurred (Lyver et al., 2018).
Model predictions indicated that changes in climatic factors related to seed production in tawa are consistent with a decline in seed crop over the past century in Tuawhenua (Figure 5D). Predictions show that years with heavy fruiting have become less frequent after 1940. As cooler winters and summers appear to be important for tawa fruiting (Figure 4; Table 3), the two periods of rapid warming (Figures 5A, B) are the major drivers of this trend. The peak in seedfall predictions for 1936 are likely attributed to successive years of very low temperatures (Figures 5A, B) which are beyond the range of the data used to fit the seedfall model. Therefore, the exact fitted values for seedfall may be unrealistically high.
4. Discussion
Our study provides strong evidence that tawa is undergoing changing seedfall patterns in response to changing climate. We found considerable spatial and temporal variation in tawa fruiting that in part follows latitudinal gradients and has been declining over time in recent years, consistent with seeding being most prolific in cooler climates both latitudinally and historically prior to recent warming. The biggest weather drivers of seeding that we identified in tawa were winter and summer temperature, both of which were negatively associated with crop size. Both winter and summer temperature have increased in Tuawhenua in the last 100 years suggesting a possible mechanism to explain observations of long-term declines in tawa seedfall observed by Tūhoe elders of the Tuawhenua region (Lyver et al., 2017).
4.1. Seedfall variability and synchrony
Compared to other mast-seeding trees, tawa seed crops are moderately variable across years. The mean CVp for the three higher-fruiting tawa sites (1.38 across Blue Duck, Pelorus and Otamatuna) would put it near the most variable one-third (the 64th percentile) of 570 global datasets (Kelly and Sork, 2002). However, as many Aotearoa-New Zealand plants are highly variable, tawa would be near the bottom (21st percentile) of the 34 datasets from 17 Aotearoa-New Zealand species in Schauber et al. (2002). The CVp, CVi and synchrony estimates for our three low-seedfall sites (Waipapa, Cascades, Trounson) are less reliable, since the low numbers of seeds caught inflates the CVi’s and decreases synchrony (Bogdziewicz et al., 2020), and those sites also have only 6–12 years sampled.
The extreme asynchrony of seeding among our sites is unusual. Strongly masting species can be in synchrony across scales up to 800 km across Aotearoa-New Zealand (Schauber et al., 2002) and up to 1,000 km overseas (Koenig and Knops, 2013, 1998; LaMontagne et al., 2020). In contrast, tawa is not synchronous even over short distances: Blue Duck and Pelorus are close (110 km) but completely asynchronous (r = −0.147).
This low synchrony of masting among tawa sites presents an apparent paradox, as something, typically weather, is required to give high within-site synchrony among trees (Kelly, 1994). Shared weather cues would be expected to trigger some synchrony among sites, since temperature and to a lesser extent rainfall show significant synchrony among sites out to considerable distances (Schauber et al., 2002; LaMontagne et al., 2020).
We believe the reason that synchrony is low between-sites but high within-sites is the nature of the weather cues. Tawa responds to an unusually complex array of weather variables (three temperature variables and two rainfall variables were significant in our all-sites model). Because of the long ripening period, these weather variables are spread across three growing seasons. Rainfall is known to be more spatially variable than temperature (Norton and Kelly, 1988), as we also found for our sites and years. Thus, for high seeding synchrony between two tawa sites, they would require both rainfall and temperatures to show synchrony, across 3 years and multiple seasons, including both summer and winter. This is a far more exacting list of weather matches than is required by most masting species which show high spatial synchrony. For example, New Zealand’s southern beeches and Chionochloa both respond to a single dominant temperature signal in late summer, 1 year before flowering (Kelly et al., 2013; Allen et al., 2014; Monks et al., 2016). There are other factors that also have some effect (spring temperatures just before flowering, Kelly et al., 2008; nutrient levels which are affected by rainfall, Smaill et al., 2011), but the summer temperature signal is so strong that temperature synchrony in that narrow time period will produce detectable synchrony in seedfall.
More generally, it is notable that tawa has recalcitrant seeds yet shows mast seeding. Masting means that little seed is produced in some years, so the species potentially misses gaps for reproduction, which should be a disadvantage. Masting trees with long-lived seed can take advantage of those gaps using dormant seed. However, Rees et al. (2002) showed for Chionochloa that having long-lived seedlings can allow masting plants to take advantage of gaps even in years when little seed is produced. As described below, tawa seedlings are very shade-tolerant (Lusk et al., 2015) and can survive for years on the forest floor, minimizing the negative effects of masting on a species with recalcitrant seeds.
4.2. Effects of climate change
Our most startling result is that in recent years, rising temperatures and decreasing rainfall most likely explains the marked reduction in tawa seedfall across the northern part of its range. Our highest seedfalls were recorded at the more southerly sites (two of which are practically astride the southern limit of the species) and in the earlier years of our study. This recent decrease is confirmed by comparison of our Waipapa data with the report in Knowles and Beveridge (1982) from the adjacent Pureora forest. In the 1950s they said seedfall in Pureora was up to 100 seeds/m2 in good years. We found at Waipapa 2009–2020 yearly mean seedfall never exceeded 10 seeds/m2.
Summer temperatures at lag 2 and lag 3 both had negative effects on seed production, which may indicate pollination, fertilization or floral induction processes in tawa are operating nearer their upper temperature limit. This result is unexpected, as Beilschmiedia is a largely tropical genus. Surprisingly, cooler winters during seed development (lag 1) led to higher seedfall. This suggests frosts had negligible impacts on fruit development either through reduced photosynthesis via leaf death (Kelly, 1987), or from direct damage to fruits, contrary to our expectations.
Higher rainfall was generally beneficial for seed production in tawa. Wetter conditions during the growth period at the beginning of the reproductive cycle (floral induction) had a positive effect on seedfall, which could indicate a positive effect on tree resource availability (Smaill et al., 2011). Similarly, wetter conditions during the year of seed development resulted in higher seedfall, which may reflect abortion of developing fruit in years of high water stress (Nussbaumer et al., 2020).
It is both remarkable and alarming that local climates have warmed enough to potentially suppress most seed production by one of Aotearoa-New Zealand’s most common trees across the warmer half of its natural range. Fortunately, tawa is not entirely reliant on production of seed to replace itself at a site. Tawa trees resprout from the base, so that once a site is occupied the trees can survive and regenerate vegetatively perhaps almost indefinitely (Knowles and Beveridge, 1982; Kelly, 1987). Moreover, tawa seedlings have the highest shade tolerance of any Aotearoa-New Zealand tree measured (Lusk et al., 2015) and germination is not impaired under parent conspecifics (Morales, 2015). Thus, seedling survival rates in mature forests may be sufficiently high such that 10 seeds/m2 is adequate for regeneration in this long-lived species. However, the loss of tawa seed affects not only tawa regeneration, but also animal fruit consumers and forest users (see below).
4.3. Implications for Tuawhenua
Our findings show that changes in Tuawhenua climate over the past century have contributed to the decline in tawa fruit abundance observed by elders of the Tuawhenua region.
Based on the results of our mechanistic seedfall-climate model, warming of around 1°C for summer and winter periods during the 20th century has been the major climate driver of reduced tawa seed abundance in Tuawhenua. These results are strongly aligned with observations by Tūhoe elders and forest users with regards to the timing of fruiting decline and climate related causes. Although not mentioning tawa specifically, elders interviewed by Lyver et al. (2008) reported that ground frosts and cold, clear weather were important for forest tree fruit setting and fruit development. In the same study, interviewees also noted that frosts have been reduced and occur later in the year since the 1980s, while forest tree phenology has become significantly altered (flowering earlier, declining crop sizes and more variable timing of fruiting). Consistent with these observations, the climate data for the Tuawhenua area used in our seedfall prediction model shows that a period of rapid winter warming began around 1980 and continues to the present day (Figure 5).
While our models indicate that warming winters are contributing to the reduced tawa seed crops observed by Tuawhenua elders and forest users, other mechanisms may also be important. Introduced brushtail possums became common in Te Urewera in the 1940s, and elders observed an increasing amount of damage to tree species during this time (Lyver et al., 2008). Possums have been recorded destroying 89.4% of green tawa fruit at a site in northern Te Urewera (Barraclough, 2006), and may also cause a reduction in tawa fruit production by browsing flowers and new shoots (Dickinson, 2021), potentially causing adult tree mortality in extreme cases (Cowan, 1990). However, any relationship between foliage browsing and seed production has not been experimentally tested. Taken together, it seems probable that a decline in tawa seed production observed by elders may reflect both a changing climate and the impacts of introduced mammalian herbivores.
Declining tawa seed/fruit production has both direct and indirect cascading effects for the Tūhoe community of the Tuawhenua region. Smaller, more irregular crops means that some cultural practices directly associated with tawa fruits are no longer being undertaken with the same frequency and are at risk of being lost. For example, the Tuawhenua people used to make a drink from tawa berries, which was often given to those that were nearing death. However, this cultural practice is no longer regularly undertaken because the palate for the beverage has changed, now that large fruit crops are not available as frequently to make it (P. Timoti pers comm.).
Declining tawa seed/fruit production may also indirectly affect Tuawhenua communities by impairing population recovery of kererū, an ecological and cultural keystone species for Tuawhenua (Timoti et al., 2017). Tūhoe aspire to return to a cultural harvest of kererū due to the practice’s immense importance to Tūhoe culture. Tuawhenua knowledge holders indicated that podocarp fruit, especially toromiro (Prumnopitys ferruginea) is an important food for fattening kererū in Tuawhenua forests (Lyver et al., 2008) during autumn and winter periods, prior to breeding. However, the condition of birds is dependent upon the initial fattening taking place when tawa fruit are available in austral summer months (December, January, February). Kererū fattening on tawa is often short-lived but critical to ensuring they are in optimal condition when toromiro fruit becomes available. Podocarp fruit are currently limited in the Tuawhenua region due to selective logging of large trees between 1950 and 1975, with poor regeneration of podocarpus since (Carswell et al., 2007). Consequently, there has been a competitive release of tawa, which now represents approximately 30% of the basal area in trees ≥10 cm diameter at breast height (Carswell et al., 2007). Thus, failure of tawa to produce large fruit crops is especially problematic for kererū population recovery due to the absence of complementary podocarp fruit. Combined with this resource scarcity, losses of kererū nests and adults to mammalian predation (Carpenter et al., 2021) could result in reproduction slipping below levels necessary to achieve population stability or growth. The once thriving presence of kererū, particularly the autumn mega-flocks of 100–500 birds per flock, has significantly declined in the Tuawhenua forests (Lyver et al., 2008). The reduced occurrence of kererū is a direct consequence of the forests’ current inability to sustain such large flocks, partly attributed to the decreased tawa seed production. This ecological shift not only alters the forest’s dynamics but also poses a profound challenge to the cultural identity of the local community.
Data availability statement
The raw data supporting the conclusions of this article will be made available by the authors, without undue reservation.
Author contributions
OY, JC, AM, BB, PT, and GB: study conception and design. DK: data collection. OY, AM, DK, and JC: analysis and interpretation of results. OY, AM, JC, DK, and PT: draft manuscript preparation. All authors reviewed the results and approved the final version of the manuscript.
Funding
This research was funded by the New Zealand Ministry for Business Innovation and Employment (MBIE) through an Endeavour Grant (contract C09X1805) as part of the “More Birds in the Bush” program. OY was supported by the University of Auckland Research Masters Scholarship (code 826) for part of the duration of this study.
Acknowledgments
This work was initiated by Tūhoe Tuawhenua mātauranga collected and recorded over a decade ago in a multiyear study led by Dr. Phil Lyver. Without the sharing and the interpretation of this knowledge, this research would not be possible. We would also like to acknowledge Tūhoe Tuawhenua Trust for collaborating on this research, especially the contributions from Brenda Tahi and Tahae Doherty. Thanks to the Department of Conservation, in particular Laurence Smith for facilitating access to the national seed rain dataset, as well as all the people who have contributed to data collection over the years. A special thanks to Anja Meduna and Ana Searle from the Department of Conservation Kauri Coast office for their help validating seed traps in Trounson kauri park.
Conflict of interest
The authors declare that the research was conducted in the absence of any commercial or financial relationships that could be construed as a potential conflict of interest.
Publisher’s note
All claims expressed in this article are solely those of the authors and do not necessarily represent those of their affiliated organizations, or those of the publisher, the editors and the reviewers. Any product that may be evaluated in this article, or claim that may be made by its manufacturer, is not guaranteed or endorsed by the publisher.
Supplementary material
The Supplementary Material for this article can be found online at: https://www.frontiersin.org/articles/10.3389/ffgc.2023.1172326/full#supplementary-material
References
Allen, R. B., Hurst, J. M., Portier, J., and Richardson, S. J. (2014). Elevation-dependent responses of tree mast seeding to climate change over 45 years. Ecol. Evol. 4, 3525–3537. doi: 10.1002/ece3.1210
Ascoli, D., Hacket-Pain, A., LaMontagne, J. M., Cardil, A., Conedera, M., Maringer, J., et al. (2020). Climate teleconnections synchronize Picea glauca masting and fire disturbance: Evidence for a fire-related form of environmental prediction. J. Ecol. 108, 1186–1198. doi: 10.1111/1365-2745.13308
Barraclough, R. K. (2006). An ecological study of a New Zealand mainland restoration endeavour: the Northern Te Urewera Ecosystem Restoration Project. Ph.D. thesis. Auckland: The University of Auckland. Available online at: https://researchspace.auckland.ac.nz/handle/2292/50964
Beveridge, A. E. (1964). Dispersal and destruction of seed in central north island podocarp forests. Proceedings (N. Z. Ecol. Soc.) 11, 48–55.
Bogdziewicz, M. (2022). How will global change affect plant reproduction? A framework for mast seeding trends. New Phytol. 234, 14–20. doi: 10.1111/nph.17682
Bogdziewicz, M., Espelta, J. M., Muñoz, A., Aparicio, J. M., and Bonal, R. (2018). Effectiveness of predator satiation in masting oaks is negatively affected by conspecific density. Oecologia 186, 983–993. doi: 10.1007/s00442-018-4069-7
Bogdziewicz, M., Hacket-Pain, A., Kelly, D., Thomas, P. A., Lageard, J., and Tanentzap, A. J. (2021). Climate warming causes mast seeding to break down by reducing sensitivity to weather cues. Glob. Change Biol. 27, 1952–1961. doi: 10.1111/gcb.15560
Bogdziewicz, M., Szymkowiak, J., Calama, R., Crone, E. E., Espelta, J. M., Lesica, P., et al. (2020). Does masting scale with plant size? High reproductive variability and low synchrony in small and unproductive individuals. Ann. Bot. 126, 971–979. doi: 10.1093/aob/mcaa118
Bogdziewicz, M., Zwolak, R., and Crone, E. E. (2016). How do vertebrates respond to mast seeding? Oikos 125, 300–307. doi: 10.1111/oik.03012
Brooks, M., Kristensen, K., van Benthem, K., Magnusson, A., Berg, C. W., Nielsen, A., et al. (2017). Modeling zero-inflated count data with glmmTMB. bioRxiv [preprint] doi: 10.1101/132753
Buonaccorsi, J. P., Elkinton, J., Koenig, W., Duncan, R. P., Kelly, D., and Sork, V. (2003). Measuring mast seeding behavior: Relationships among population variation, individual variation and synchrony. J. Theor. Biol. 224, 107–114. doi: 10.1016/S0022-5193(03)00148-6
Carpenter, J. K., Walker, S., Monks, A., Innes, J., Binny, R. N., and Schlesselmann, A.-K. V. (2021). Factors limiting kererū (Hemiphaga novaeseelandiae) populations across New Zealand. N. Z. J. Ecol. 45:3441. doi: 10.20417/nzjecol.45.30
Carswell, F. E., Richardson, S. J., Doherty, J. E., Allen, R. B., and Wiser, S. K. (2007). Where do conifers regenerate after selective harvest?: A case study from a New Zealand conifer–angiosperm forest. Forest Ecol. Manag. 253, 138–147. doi: 10.1016/j.foreco.2007.07.011
Clout, M. N., and Hay, J. R. (1989). The importance of birds as browsers, pollinators and seed dispersers in New Zealand forests. N. Z. J. Ecol. 12, 27–33.
Cowan, P. E. (1990). Fruits, seeds, and flowers in the diet of brushtail possums, Trichosurus vulpecula, in lowland podocarp/mixed hardwood forest, Orongorongo Valley, New Zealand. N. Z. J. Zool. 17, 549–566. doi: 10.1080/03014223.1990.10422953
Dawson, J., Lucas, R., Connor, J., and Brownsey, P. J. (2011). New Zealand’s native trees. Nelson: Craig Potton.
Dickinson, M. C. (2021). Do rats and possums reduce the reproductive capacity of large-fruited broadleaved species in Waikato hill-country forests? Ph.D. thesis. Hamilton: The University of Waikato. Available online at: https://researchcommons.waikato.ac.nz/handle/10289/14760
Dijkgraaf, A. C. (2002). Phenology and frugivory of large-fruited species in northern New Zealand and the impacts of introduced mammals. Ph.D. Thesis. Auckland: ResearchSpace.
Doherty, W. (2010). Mâtauranga tūhoe: The centrality of Mâtauranga-a-iwi to Mâori education. Ph.D. Thesis. Auckland: ResearchSpace.
Emeny, M. T., Powlesland, R. G., Henderson, I. M., and Fordham, R. A. (2009). Feeding ecology of kererū (Hemiphaga novaeseelandiae) in podocarp–hardwood forest, Whirinaki Forest Park, New Zealand. N. Z. J. Ecol. 33, 114–124.
Etherington, T. R., Perry, G. L. W., and Wilmshurst, J. M. (2022). HOTRUNZ: An open-access 1km resolution monthly 1910–2019 time series of interpolated temperature and rainfall grids with associated uncertainty for New Zealand. Earth Syst. Sci. Data 14, 2817–2832. doi: 10.5194/essd-14-2817-2022
Feldman, J. W. (2001). Treaty rights and pigeon poaching: Alienation of Mâori access to kereru, 1864-1960. Wellington: Waitangi Tribunal.
Hartley, A. E., Neill, C., Melillo, J. M., Crabtree, R., and Bowles, F. P. (1999). Plant performance and soil nitrogen mineralization in response to simulated climate change in subarctic dwarf shrub heath. Oikos 86, 331–343. doi: 10.2307/3546450
Herrmann, T. M. (2006). Indigenous knowledge and management of Araucaria araucana forest in the Chilean Andes: Implications for native forest conservation. Biodivers. Conserv. 15, 647–662. doi: 10.1007/s10531-005-2092-6
IPCC (2021). Climate change 2021: the physical science basis. Contribution of working group I to the sixth assessment report of the intergovernmental panel on climate change, eds V. P. Masson-Delmotte, A. Zhai, S. L. Pirani, C. Connors, S. Péan, N. Berger, et al. (Cambridge: Cambridge University Press). doi: 10.1017/9781009157896
Kelly, D. (1987). Slow recovery of Beilschmiedia tawa after severe frosts in Inland Taranaki, New Zealand. N. Z. J. Ecol. 10, 137–140.
Kelly, D. (1994). The evolutionary ecology of mast seeding. Trends Ecol. Evol. 9, 465–470. doi: 10.1016/0169-5347(94)90310-7
Kelly, D., and Sork, V. L. (2002). Mast seeding in perennial plants: Why, how, where? Annu. Rev. Ecol. Syst. 33, 427–447. doi: 10.1146/annurev.ecolsys.33.020602.095433
Kelly, D., and Sullivan, J. J. (1997). Quantifying the benefits of mast seeding on predator satiation and wind pollination in Chionochloa pallens (Poaceae). Oikos 78, 143–150. doi: 10.2307/3545810
Kelly, D., Geldenhuis, A., James, A., Penelope Holland, E., Plank, M. J., Brockie, R. E., et al. (2013). Of mast and mean: Differential-temperature cue makes mast seeding insensitive to climate change. Ecol. Lett. 16, 90–98. doi: 10.1111/ele.12020
Kelly, D., Ladley, J. J., Robertson, A. W., Anderson, S. H., Wotton, D. M., and Wiser, S. K. (2010). Mutualisms with the wreckage of an avifauna: The status of bird pollination and fruit-dispersal in New Zealand. N. Z. J. Ecol. 34:66.
Kelly, D., Turnbull, M. H., Pharis, R. P., and Sarfati, M. S. (2008). Mast seeding, predator satiation, and temperature cues in Chionochloa (Poaceae). Popul. Ecol. 50, 343–355. doi: 10.1007/s10144-008-0109-1
Knowles, B., and Beveridge, A. E. (1982). Biological flora of New Zealand 9. Beilschmiedia tawa (A. Cunn.) Benth. Et Hook. F. ex Kirk (Lauraceae) Tawa. N. Z. J. Bot. 20, 37–54. doi: 10.1080/0028825X.1982.10426403
Koenig, W. D., and Knops, J. M. (2013). Large-scale spatial synchrony and cross-synchrony in acorn production by two California oaks. Ecology 94, 83–93. doi: 10.1890/12-0940.1
Koenig, W. D., and Knops, J. M. H. (1998). Scale of mast-seeding and tree-ring growth. Nature 396:6708. doi: 10.1038/24293
Koenig, W. D., Kelly, D., Sork, V. L., Duncan, R. P., Elkinton, J. S., Peltonen, M. S., et al. (2003). Dissecting components of population-level variation in seed production and the evolution of masting behavior. Oikos 102, 581–591. doi: 10.1034/j.1600-0706.2003.12272.x
Kuussaari, M., Bommarco, R., Heikkinen, R. K., Helm, A., Krauss, J., Lindborg, R., et al. (2009). Extinction debt: A challenge for biodiversity conservation. Trends Ecol. Evol. 24, 564–571. doi: 10.1016/j.tree.2009.04.011
LaMontagne, J. M., Pearse, I. S., Greene, D. F., and Koenig, W. D. (2020). Mast seeding patterns are asynchronous at a continental scale. Nat. Plants 6, 460–465. doi: 10.1038/s41477-020-0647-x
Leathwick, J. (1984). Phenology of some common trees, shrubs and lianes in four central North Island forests. Rotorua: Forest Research Institute, New Zealand Forest Service.
Leishman, M. R., Wright, I. J., Moles, A. T., and Westoby, M. (2000). The evolutionary ecology of seed size. Seeds Ecol. Regen. Plant Commun. 2, 31–57. doi: 10.1079/9780851994321.0031
Long, J. W., Goode, R. W., Gutteriez, R. J., Lackey, J. J., and Anderson, M. K. (2017). Managing California black oak for tribal ecocultural restoration. J. For. 115, 426–434. doi: 10.5849/jof.16-033
Lusk, C. H., Jorgensen, M. A., and Bellingham, P. J. (2015). A conifer–angiosperm divergence in the growth vs. Shade tolerance trade-off underlies the dynamics of a New Zealand warm-temperate rain forest. J. Ecol. 103, 479–488. doi: 10.1111/1365-2745.12368
Lynn, K., Daigle, J., Hoffman, J., Lake, F., Michelle, N., Ranco, D., et al. (2013). “The impacts of climate change on tribal traditional foods,” in Climate change and indigenous peoples in the United States, eds J. K. Maldonado, R. E. Pandya, and B. J. Colombi (Cham: Springer), 37–48. doi: 10.1007/978-3-319-05266-3_4
Lyver, P. O. B., Timoti, P., Jones, C. J., Richardson, S. J., Tahi, B. L., and Greenhalgh, S. (2017). An indigenous community-based monitoring system for assessing forest health in New Zealand. Biodivers. Conserv. 26, 3183–3212. doi: 10.1007/s10531-016-1142-6
Lyver, P. O., Richardson, S. J., Gormley, A. M., Timoti, P., Jones, C. J., and Tahi, B. L. (2018). Complementarity of indigenous and western scientific approaches for monitoring forest state. Ecol. Appl. 28, 1909–1923. doi: 10.1002/eap.1787
Lyver, P. O., Taputu, T. M., Kutia, S. T., and Tahi, B. (2008). Tūhoe Tuawhenua mātauranga of kererū (Hemiphaga novaseelandiae novaseelandiae) in Te Urewera. N. Z. J. Ecol. 32, 7–17.
MacKenzie, R. M. J., and Gadgil, P. D. (1973). Die-back of tawa. Wellington: New Zealand Forest Service.
Macphail, M. K. (1980). Fossil and modern Beilschmiedia (lauraceae) pollen in New Zealand. N. Z. J. Bot. 18, 453–457. doi: 10.1080/0028825X.1980.10425165
Monks, A., Monks, J. M., and Tanentzap, A. J. (2016). Resource limitation underlying multiple masting models makes mast seeding sensitive to future climate change. New Phytol. 210, 419–430. doi: 10.1111/nph.13817
Morales, N. (2015). Factors affecting recruitment of Beilschmiedia tawa in northern New Zealand. N. Z. J. Bot. 53, 231–240. doi: 10.1080/0028825X.2015.1095212
Morales, N. S., Perry, G. L. W., and Burns, B. R. (2016). Fencing is not enough to reinstate regeneration: Evidence from a large fruited canopy tree Beilschmiedia tawa. For. Ecol. Manag. 376, 36–44. doi: 10.1016/j.foreco.2016.05.048
Norton, D. A., and Kelly, D. (1988). Mast Seeding Over 33 Years by Dacrydium cupressinum Lamb. (rimu) (Podocarpaceae) in New Zealand: The importance of economies of Scale. Funct. Ecol. 2, 399–408. doi: 10.2307/2389413
Norton, S. A. (1984). Thrips pollination in the lowland forest of New Zealand. N. Z. J. Ecol. 7, 157–163.
Nussbaumer, A., Meusburger, K., Schmitt, M., Waldner, P., Gehrig, R., Haeni, M., et al. (2020). Extreme summer heat and drought lead to early fruit abortion in European beech. Sci. Rep. 10:1. doi: 10.1038/s41598-020-62073-0
Peters, V. S., Gelderman, M. S., and Visscher, D. R. (2017). Resiliency in masting systems: Do evolved seed escape strategies benefit an endangered pine? Ecosphere 8:e01928. doi: 10.1002/ecs2.1928
Pritchard, H. W., Tsan, F. Y., Wen, B., Jaganathan, G. K., Calvi, G., Pence, V. C., et al. (2022). “Regeneration in recalcitrant-seeded species and risks from climate change,” in Plant regeneration from seeds, eds C. C. Baskin and J. M. Baskin (New York, NY: Academic Press), 259–273. doi: 10.1016/B978-0-12-823731-1.00014-7
R Core Team (2022). R: A language and environment for statistical computing. Vienna: R Foundation for Statistical Computing.
Rees, M., Kelly, D., and Bjørnstad, O. N. (2002). Snow tussocks, chaos, and the evolution of mast seeding. Am. Nat. 160, 44–59. doi: 10.1086/340603
Richardson, S. J., Allen, R. B., Whitehead, D., Carswell, F. E., Ruscoe, W. A., and Platt, K. H. (2005). Climate and net carbon availability determine temporal patterns of seed production by Nothofagus. Ecology 86, 972–981. doi: 10.1890/04-0863
Rivers, M., Newton, A. C., Oldfield, S., and Global Tree Assessment Contributors (2022). Scientists’ warning to humanity on tree extinctions. Plants People Planet 1–17. doi: 10.1002/ppp3.10314
Roper, G. H. (1967). Morphological, ontogenetic and embryological studies in the flowers of Beilschmiedia tawa (A. Cunn.) Benth. Et Hook. F. Ex Kirk (Lauraceae). Ph.D. Thesis. Wellington: Victoria University of Wellington.
Schauber, E. M., Kelly, D., Turchin, P., Simon, C., Lee, W. G., Allen, R. B., et al. (2002). Masting by eighteen New Zealand plant species: The role of temperature as a synchronizing cue. Ecology 83, 1214–1225. doi: 10.1890/0012-9658(2002)083[1214:MBENZP]2.0.CO;2
Shen, S., Liang, X.-G., Zhang, L., Zhao, X., Liu, Y.-P., Lin, S., et al. (2020). Intervening in sibling competition for assimilates by controlled pollination prevents seed abortion under postpollination drought in maize. Plant Cell Environ. 43, 903–919. doi: 10.1111/pce.13704
Smaill, S. J., Clinton, P. W., Allen, R. B., and Davis, M. R. (2011). Climate cues and resources interact to determine seed production by a masting species. J. Ecol. 99, 870–877. doi: 10.1111/j.1365-2745.2011.01803.x
Tilman, D., May, R. M., Lehman, C. L., and Nowak, M. A. (1994). Habitat destruction and the extinction debt. Nature 371:6492. doi: 10.1038/371065a0
Timoti, P., Lyver, P. O., Matamua, R., Jones, C. J., and Tahi, B. L. (2017). A representation of a Tuawhenua worldview guides environmental conservation. Ecol. Soc. 22:20. doi: 10.5751/ES-09768-220420
Ueda, M. U., Muller, O., Nakamura, M., Nakaji, T., and Hiura, T. (2013). Soil warming decreases inorganic and dissolved organic nitrogen pools by preventing the soil from freezing in a cool temperate forest. Soil Biol. Biochem. 61, 105–108. doi: 10.1016/j.soilbio.2013.02.016
Voggesser, G., Lynn, K., Daigle, J., Lake, F. K., and Ranco, D. (2013). “Cultural impacts to tribes from climate change influences on forests,” in Climate change and indigenous peoples in the United States, eds J. K. Maldonado, B. Colombi, and R. Pandya (Cham: Springer), 107–118. doi: 10.1007/978-3-319-05266-3_9
Walck, J. L., Hidayati, S. N., Dixon, K. W., Thompson, K., and Poschlod, P. (2011). Climate change and plant regeneration from seed. Glob. Change Biol. 17, 2145–2161. doi: 10.1111/j.1365-2486.2010.02368.x
West, C. J. (1986). Population ecology of Beilschmiedia tawa at Pureora Forest. Ph.D. Thesis. Auckland: ResearchSpace.
Wilson, P. R., Karl, B. J., Toft, R. J., Beggs, J. R., and Taylor, R. H. (1998). The role of introduced predators and competitors in the decline of kaka (Nestor meridionalis) populations in New Zealand. Biol. Conserv. 83, 175–185. doi: 10.1016/S0006-3207(97)00055-4
Wright, S. D., Nugent, G., and Parata, H. G. (1995). Customary management of indigenous species: A Maori perspective. N. Z. J. Ecol. 19, 83–86.
Keywords: forest regeneration, recalcitrant seeds, Lauraceae, Tūhoe Tuawhenua, climate change, global warming, indigenous knowledge, mast seeding
Citation: Yukich Clendon OMM, Carpenter JK, Kelly D, Timoti P, Burns BR, Boswijk G and Monks A (2023) Global change explains reduced seeding in a widespread New Zealand tree: indigenous Tūhoe knowledge informs mechanistic analysis. Front. For. Glob. Change 6:1172326. doi: 10.3389/ffgc.2023.1172326
Received: 23 February 2023; Accepted: 08 June 2023;
Published: 27 June 2023.
Edited by:
Dylan Craven, Major University, ChileReviewed by:
Muthoni Masinde, Central University of Technology, South AfricaJanice Marjorie Lord, University of Otago, New Zealand
Copyright © 2023 Yukich Clendon, Carpenter, Kelly, Timoti, Burns, Boswijk and Monks. This is an open-access article distributed under the terms of the Creative Commons Attribution License (CC BY). The use, distribution or reproduction in other forums is permitted, provided the original author(s) and the copyright owner(s) are credited and that the original publication in this journal is cited, in accordance with accepted academic practice. No use, distribution or reproduction is permitted which does not comply with these terms.
*Correspondence: Oscar M. M. Yukich Clendon, b2NsZW5kb25AZ21haWwuY29t