 Annette Debel
 Zeynab Foroozan
 Martin Häusser
 Stephan Raspe
 Achim Bräuning
- 1Institute of Geography, Friedrich-Alexander-Universität Erlangen-Nürnberg, Erlangen, Germany
- 2Department Soil and Climate, Bavarian State Institute of Forestry (LWF), Freising, Germany
Detecting the intra-annual dynamics and courses of secondary tree growth enables the accurate identification of crucial steps in the forming of a new tree ring. Furthermore, comparing the high-resolution recordings of tree growth with environmental conditions allows assessment of the influence of weather on wood formation processes. This study investigates the intra-annual growth performance of conifer species and European beech at two high- and two low-elevation sites in Bavaria, southeast Germany. We measured stem circumference changes with electronic band dendrometers and cambial dynamics by collecting microcores at biweekly intervals. We analyzed growth variations between the consecutive years 2020 and 2021, which showed distinct climatic differences during the growing seasons. While warm and dry conditions prevailed in spring and summer in 2020, spring in 2021 was comparatively cold, and summer precipitation was high. Different tree growth patterns were observed in the contrasting years 2020 and 2021. Distinct growth reductions occurred in the drier year 2020 for most of the studied tree species, while trees showed wider tree rings in 2021 despite of low growth rates at the beginning of the growing season. Climate-growth correlations exposed the intraseasonal influence of climatic conditions, particularly available soil water, water vapor pressure deficit, and soil temperature, on short-term tree responses. Wood anatomical analysis and daily stem diameter variations proved to be valid monitoring methods to assess individual wood formation processes and to identify species-specific tree responses to the influence of climatic conditions. However, combining both methods represents the most reliable approach due to the mutual ability to compensate for each other’s deficiencies. While dendrometers provided a very accurate and high-resolution record of intra-annual tree growth, wood anatomical analyses were more reliable in determining the exact onset and cessation of wood formation. For this reason, combining both is recommended for assessing prospective tree growth performance in the context of climate change.
1 Introduction
Annual tree-ring analysis is effective for examining long-term climate-growth relationships but cannot capture intra-annual growth variations. To detect short-term tree responses to climate, measuring tree circumference changes with electronic band dendrometers and wood anatomical analysis of microcores are useful approaches (Deslauriers et al., 2007; Drew and Downes, 2009; Rossi et al., 2016; De Micco et al., 2019). High-resolution monitoring methods can detect the formation of new xylem cells and their contribution to stem radial increments, allowing for detailed observations of tree responses to current weather conditions (Deslauriers et al., 2003; Čufar et al., 2008a; Häusser et al., 2021; Jevšenak et al., 2021). The process of cell division in the cambium zone and the subsequent differentiation of the newly formed xylem cells during a growing season define the formation of a new tree ring (Vaganov et al., 1996; Rathgeber et al., 2016). Mainly controlled by intrinsic factors and modified by feedback effects, climatic and environmental conditions also influence the cambial production rate and its temporal variability (Deslauriers et al., 2003; Drew and Downes, 2009; Bräuning et al., 2016; Cartenì et al., 2018; De Micco et al., 2019; Huang et al., 2020). Temperature is the initial driver for cambial reactivation after the dormant season in temperate climates (Gričar et al., 2006; Rossi et al., 2008; Begum et al., 2013). At the same time, water availability represents one of the most important environmental factors for xylem cell production since it affects both the rate of cambial cell division and the cell expansion of newly formed xylem elements (Vaganov et al., 2011; Cuny et al., 2015; Hartmann and Trumbore, 2016; De Micco et al., 2019; Peters et al., 2021). Photosynthesis produces carbohydrates and depends on irradiation, nutritional status, water availability, and their complex interactions (De Micco et al., 2019). On the one hand, wood anatomical analyses of regularly collected microcore samples can reveal both the production and wall thickening of new xylem cells and their enlargement. Wood anatomical thin sections of microcore samples can quantify the numbers of newly formed xylem cells and the various phases of xylogenesis throughout the growing season. On the other hand, recording high-frequency stem circumference variations (SCVs) using electronic band dendrometers enables the monitoring of individual tree growth dynamics during the growing season with a very high resolution of up to a few minutes. A number of studies detected intra-annual tree growth, applying either the anatomical analysis of regularly collected microcores (Rossi et al., 2016; Cuny et al., 2019; Marchand et al., 2021) or the analysis of dendrometer measurements (Mencuccini et al., 2017; van der Maaten et al., 2018; Martínez-Sancho et al., 2021). However, both approaches involve certain limitations and disadvantages, such as a time-consuming and data-intensive application regarding microcore analysis and possible inaccuracy in dendrometer measurements due to the indistinguishability between hydrological stem diameter fluctuations and radial tree growth (De Swaef et al., 2015; Zweifel, 2016). A combination of both methods, however, revealed in part distinct divergences in tree growth patterns and timings (i.e., onset and cessation) (Mäkinen et al., 2008; Michelot et al., 2012; Cocozza et al., 2016; Stangler et al., 2021). Thus, the present study applies both methods while comparing the intra-annual tree growth dynamics of different tree species in two consecutive years. This approach allows a detailed method comparison and reveals the individual strengths and deficiencies of the respective technique. Since the exact impact of climatic factors on radial growth could not yet be clarified (Rossi et al., 2014; Ortega, 2017; Cartenì et al., 2018; De Micco et al., 2019), this study additionally focuses on the influence of short-term weather conditions (2-week periods) on wood production in two climatically contrasting growing seasons. By monitoring intra-annual growth of three different tree species (both broadleaved and coniferous) along altitudinal and longitudinal gradients in two consecutive growing seasons using both dendrometer measurements and wood anatomical analysis of microcores, the following hypotheses are examined:
1. Intra-annual growth patterns significantly differ between the species studied, but trees at low-elevation sites are more susceptible to dry and hot summer conditions.
2. Although dendrometer measurements and wood anatomical analyses differ in their temporal resolution and methodological concepts, both are able to capture aspects of intra-annual growth dynamics and show similar intra-annual growth patterns. However, we expect that the results of both methods partly differ, particularly in determining the initiation and cessation of radial tree growth, with dendrometer measurements recording an earlier onset and later growth stop.
2 Materials and methods
2.1 Study sites and climate
The study region is located in northern Bavaria, southeast Germany. The four studied forests characterize two pairs of locations involving one comparatively high- and one low-elevation site to examine the response of trees at varying altitudes and growth regions. Furthermore, the western part of the study area has a rather oceanic climate with mild and wet winters, whereas the eastern part of Bavaria is more continental, with colder winters. In northwestern Bavaria, the high-elevation study site is located in the Rhoen Mountains (High-West, HW) at the area of the Bavarian Forest Ecosystem Monitoring Station (WKS) “Bad Brückenau” [according to the International Co-operative Programme on Assessment and Monitoring of Air Pollution Effects on Forests (ICP Forests) Level II plot: 903]. The corresponding low-elevation site is near the WKS “Würzburg” (ICP Forests Level II plot: 921), in the basin of the river Main (Low-West, LW). The second high-elevation site is in the Fichtel Mountains (High-East, HE) in northeastern Bavaria, close to the WKS “Goldkronach” (ICP Forests Level II plot: 909), and the corresponding low-elevation site is in the Middle Franconian basin north of the city of Nürnberg (Low-East, LE) (Figure 1). All study sites are part of the dendroecological network of the “BayTreeNet” project as part of the Bavarian Climate Research Network (bayklif). For further details on the site conditions, see Debel et al. (2021).
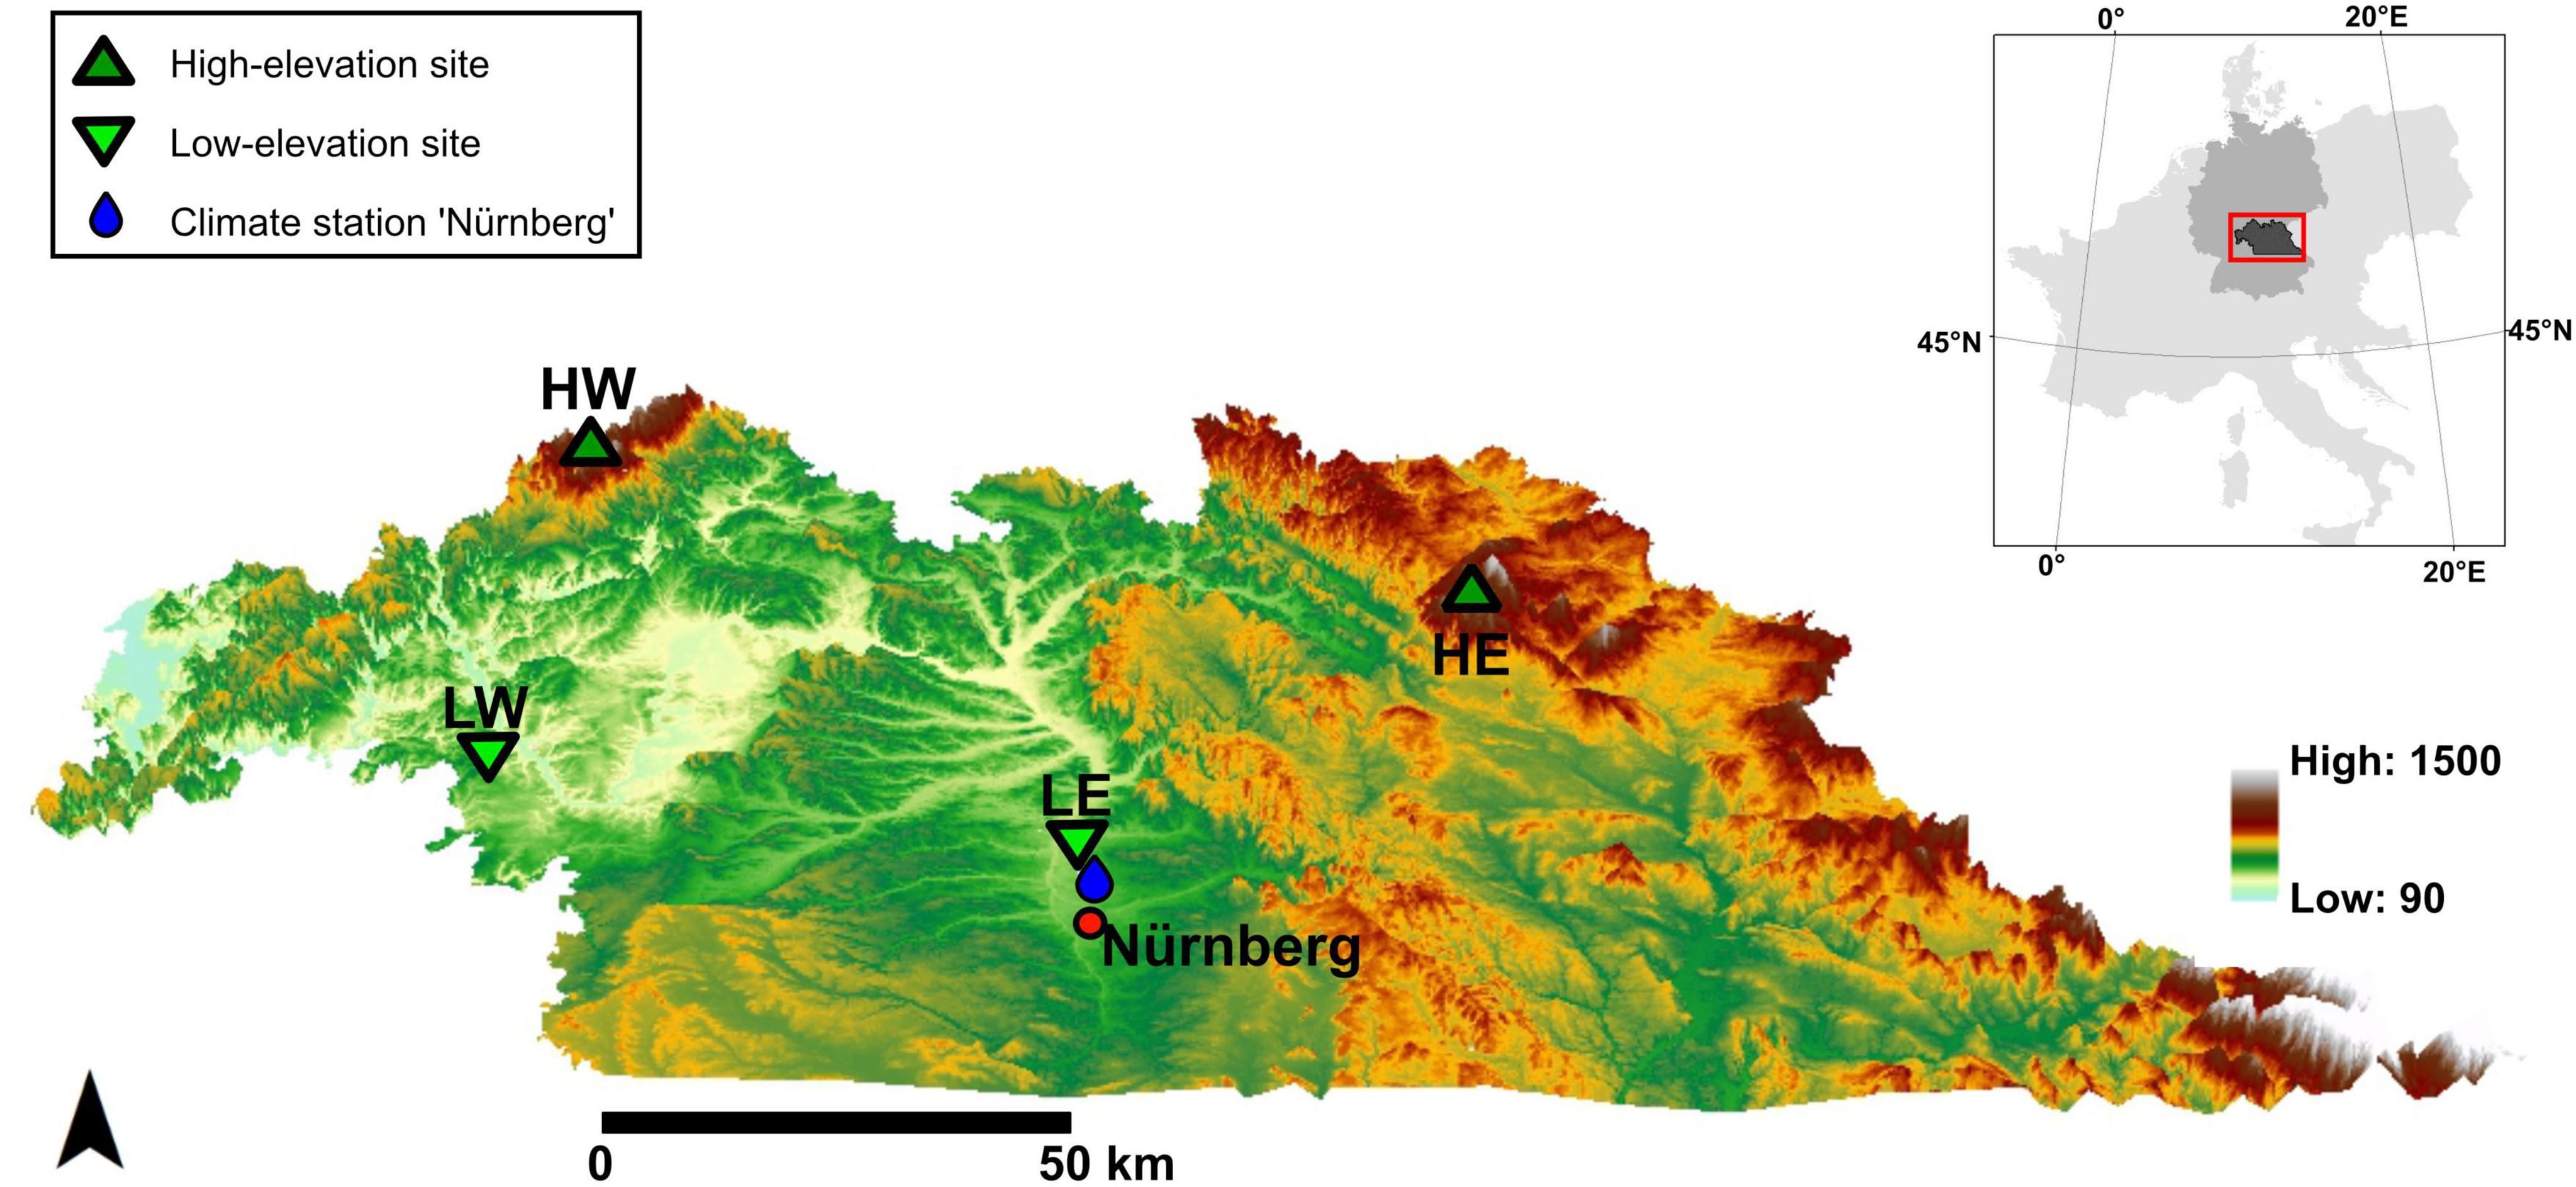
Figure 1. Locations of study sites and climate stations in northern Bavaria, southeastern Germany. The inset map illustrates the location of the study area within Central Europe. The climate stations are close (<1 km) to the study sites, except for LE, with the climate station “Nürnberg.”
Five dominant trees of one broadleaved and coniferous tree species at each site were examined in the consecutive growing seasons of 2020 and 2021. The conifer species at high- and low-elevation sites were Norway spruce (Picea abies L.) and Scots pine (Pinus sylvestris L.), respectively, whereas European beech (Fagus sylvatica L.) was the studied broadleaved species occurring at all sites. Climate data from the climate station “Nürnberg” (11,0549°/49,5030°, 314.0 m asl), as the closest station to the study site LE (distance: 6 km), were provided by the German Weather Service (DWD) (DWD Climate Data Center, 2020). For all other sites, the Bavarian State Institute of Forestry (LWF) supplied climate variables from its forest climate stations near the BayTreeNet study sites (distance <1 km) (Table 1). The two consecutive years 2020 and 2021 revealed distinct contrasts in climate variables, including precipitation, temperature, global radiation, and vapor pressure deficit. For instance, the mean annual precipitation (MAP) at LE in 2020 was >180 mm lower than that in 2021, and at LW, it was even half that of 2021 (LWF). The MAP was higher than in the Climate Normals in the mountain ranges in 2021 (HW > 150 mm, HE > 80 mm). Water stress in the summer of 2020, as reflected by the transpiration index (Tactual/Tpotential) below 1 (Zierl, 2001), was especially severe at the low-elevation sites. Compared to the Climate Normals, 1991–2020, all sites showed higher precipitation totals in 2021, especially in June and/or July. The mean annual temperature was >1.2°C colder at each site in 2021 than in 2020, at HE even by 1.7°C. At the beginning of the 2021 growing season (April and May), temperatures were between 2 and 3°C cooler than those of the Climate Normals (Figure 2).
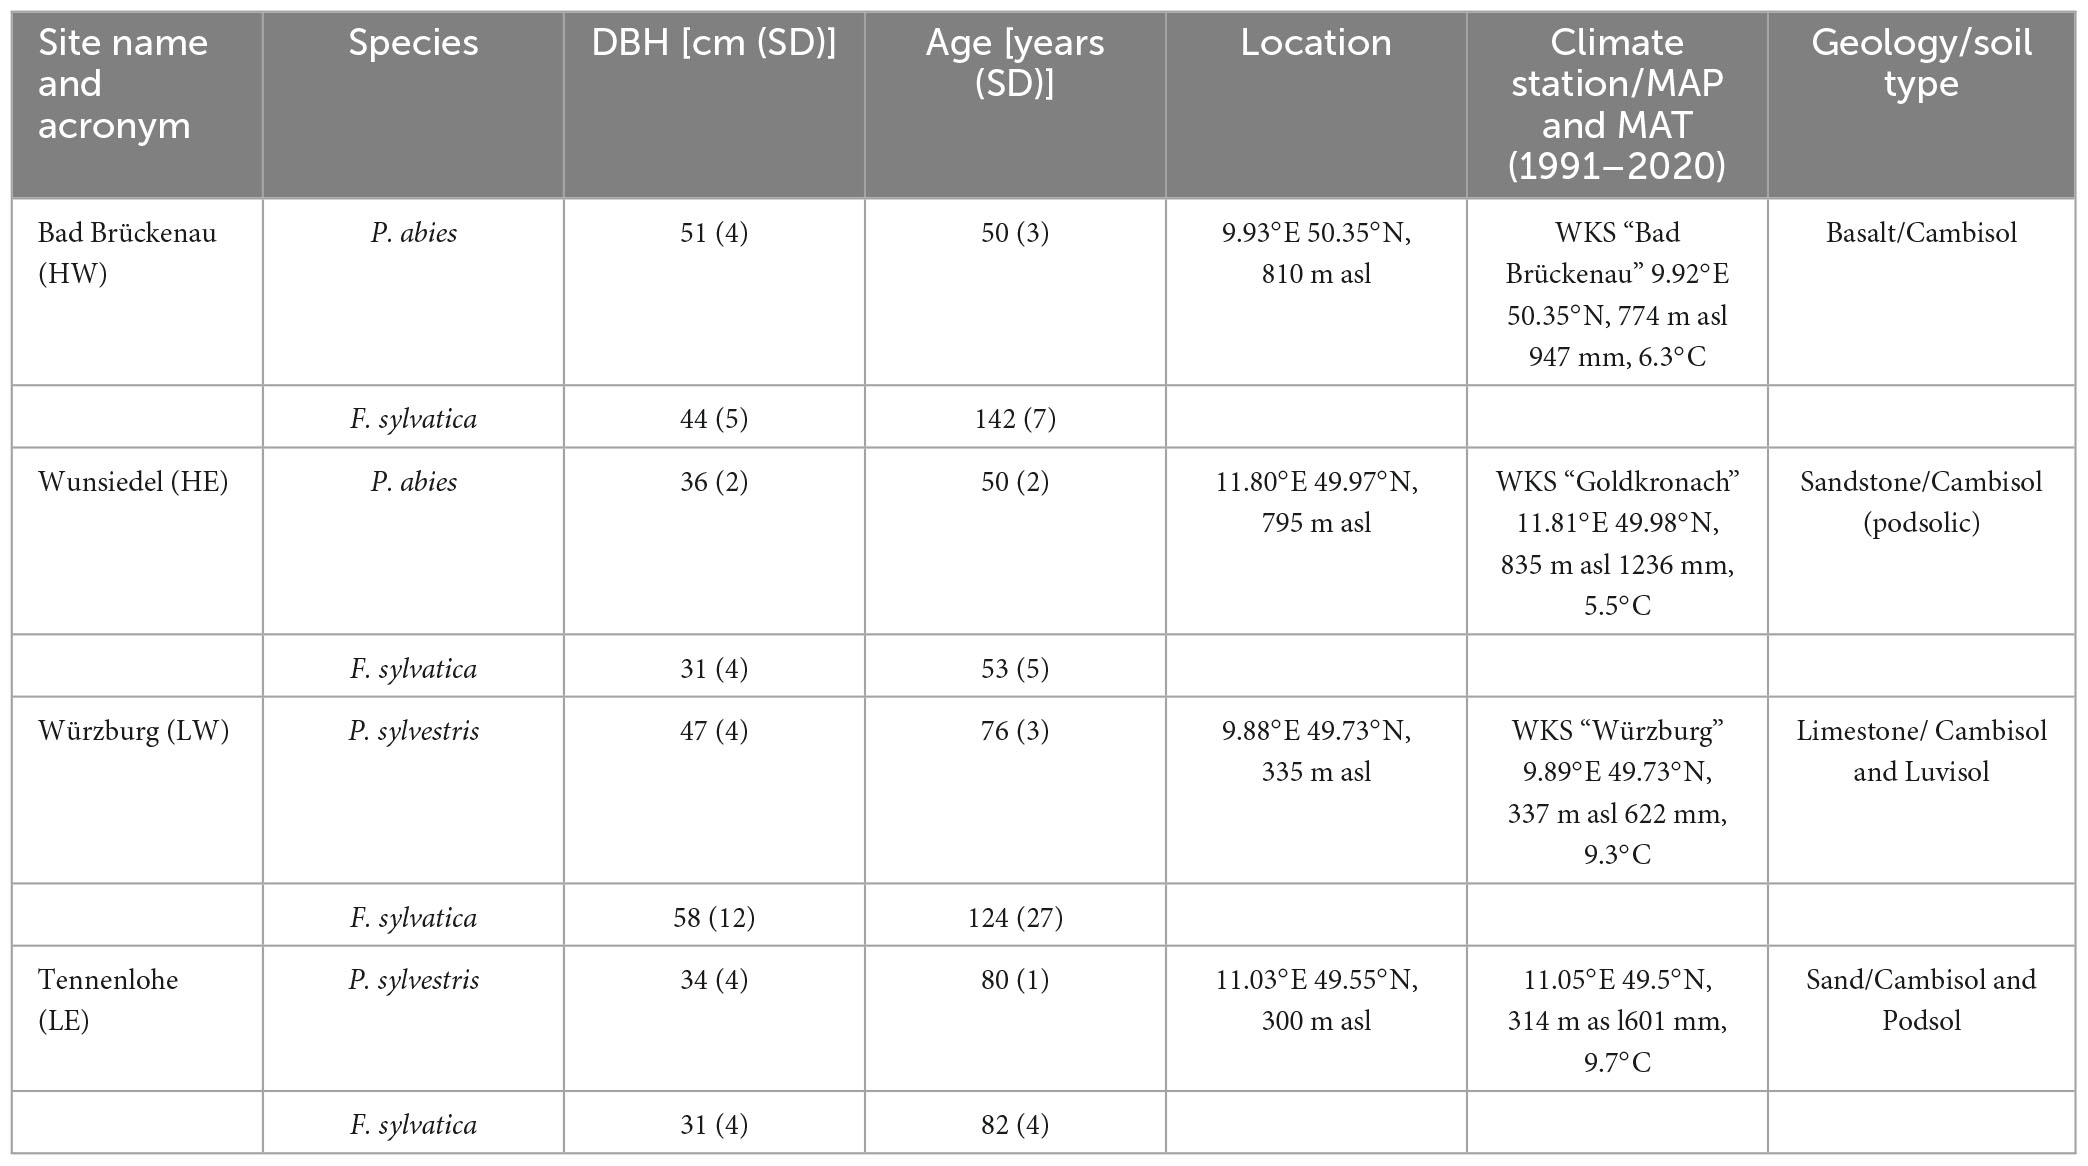
Table 1. Main site characteristics: diameter at breast height and age [mean (SD)] of the monitored tree species, site location (lon, lat, and altitude), and location of the climate station (lon, lat, and altitude).
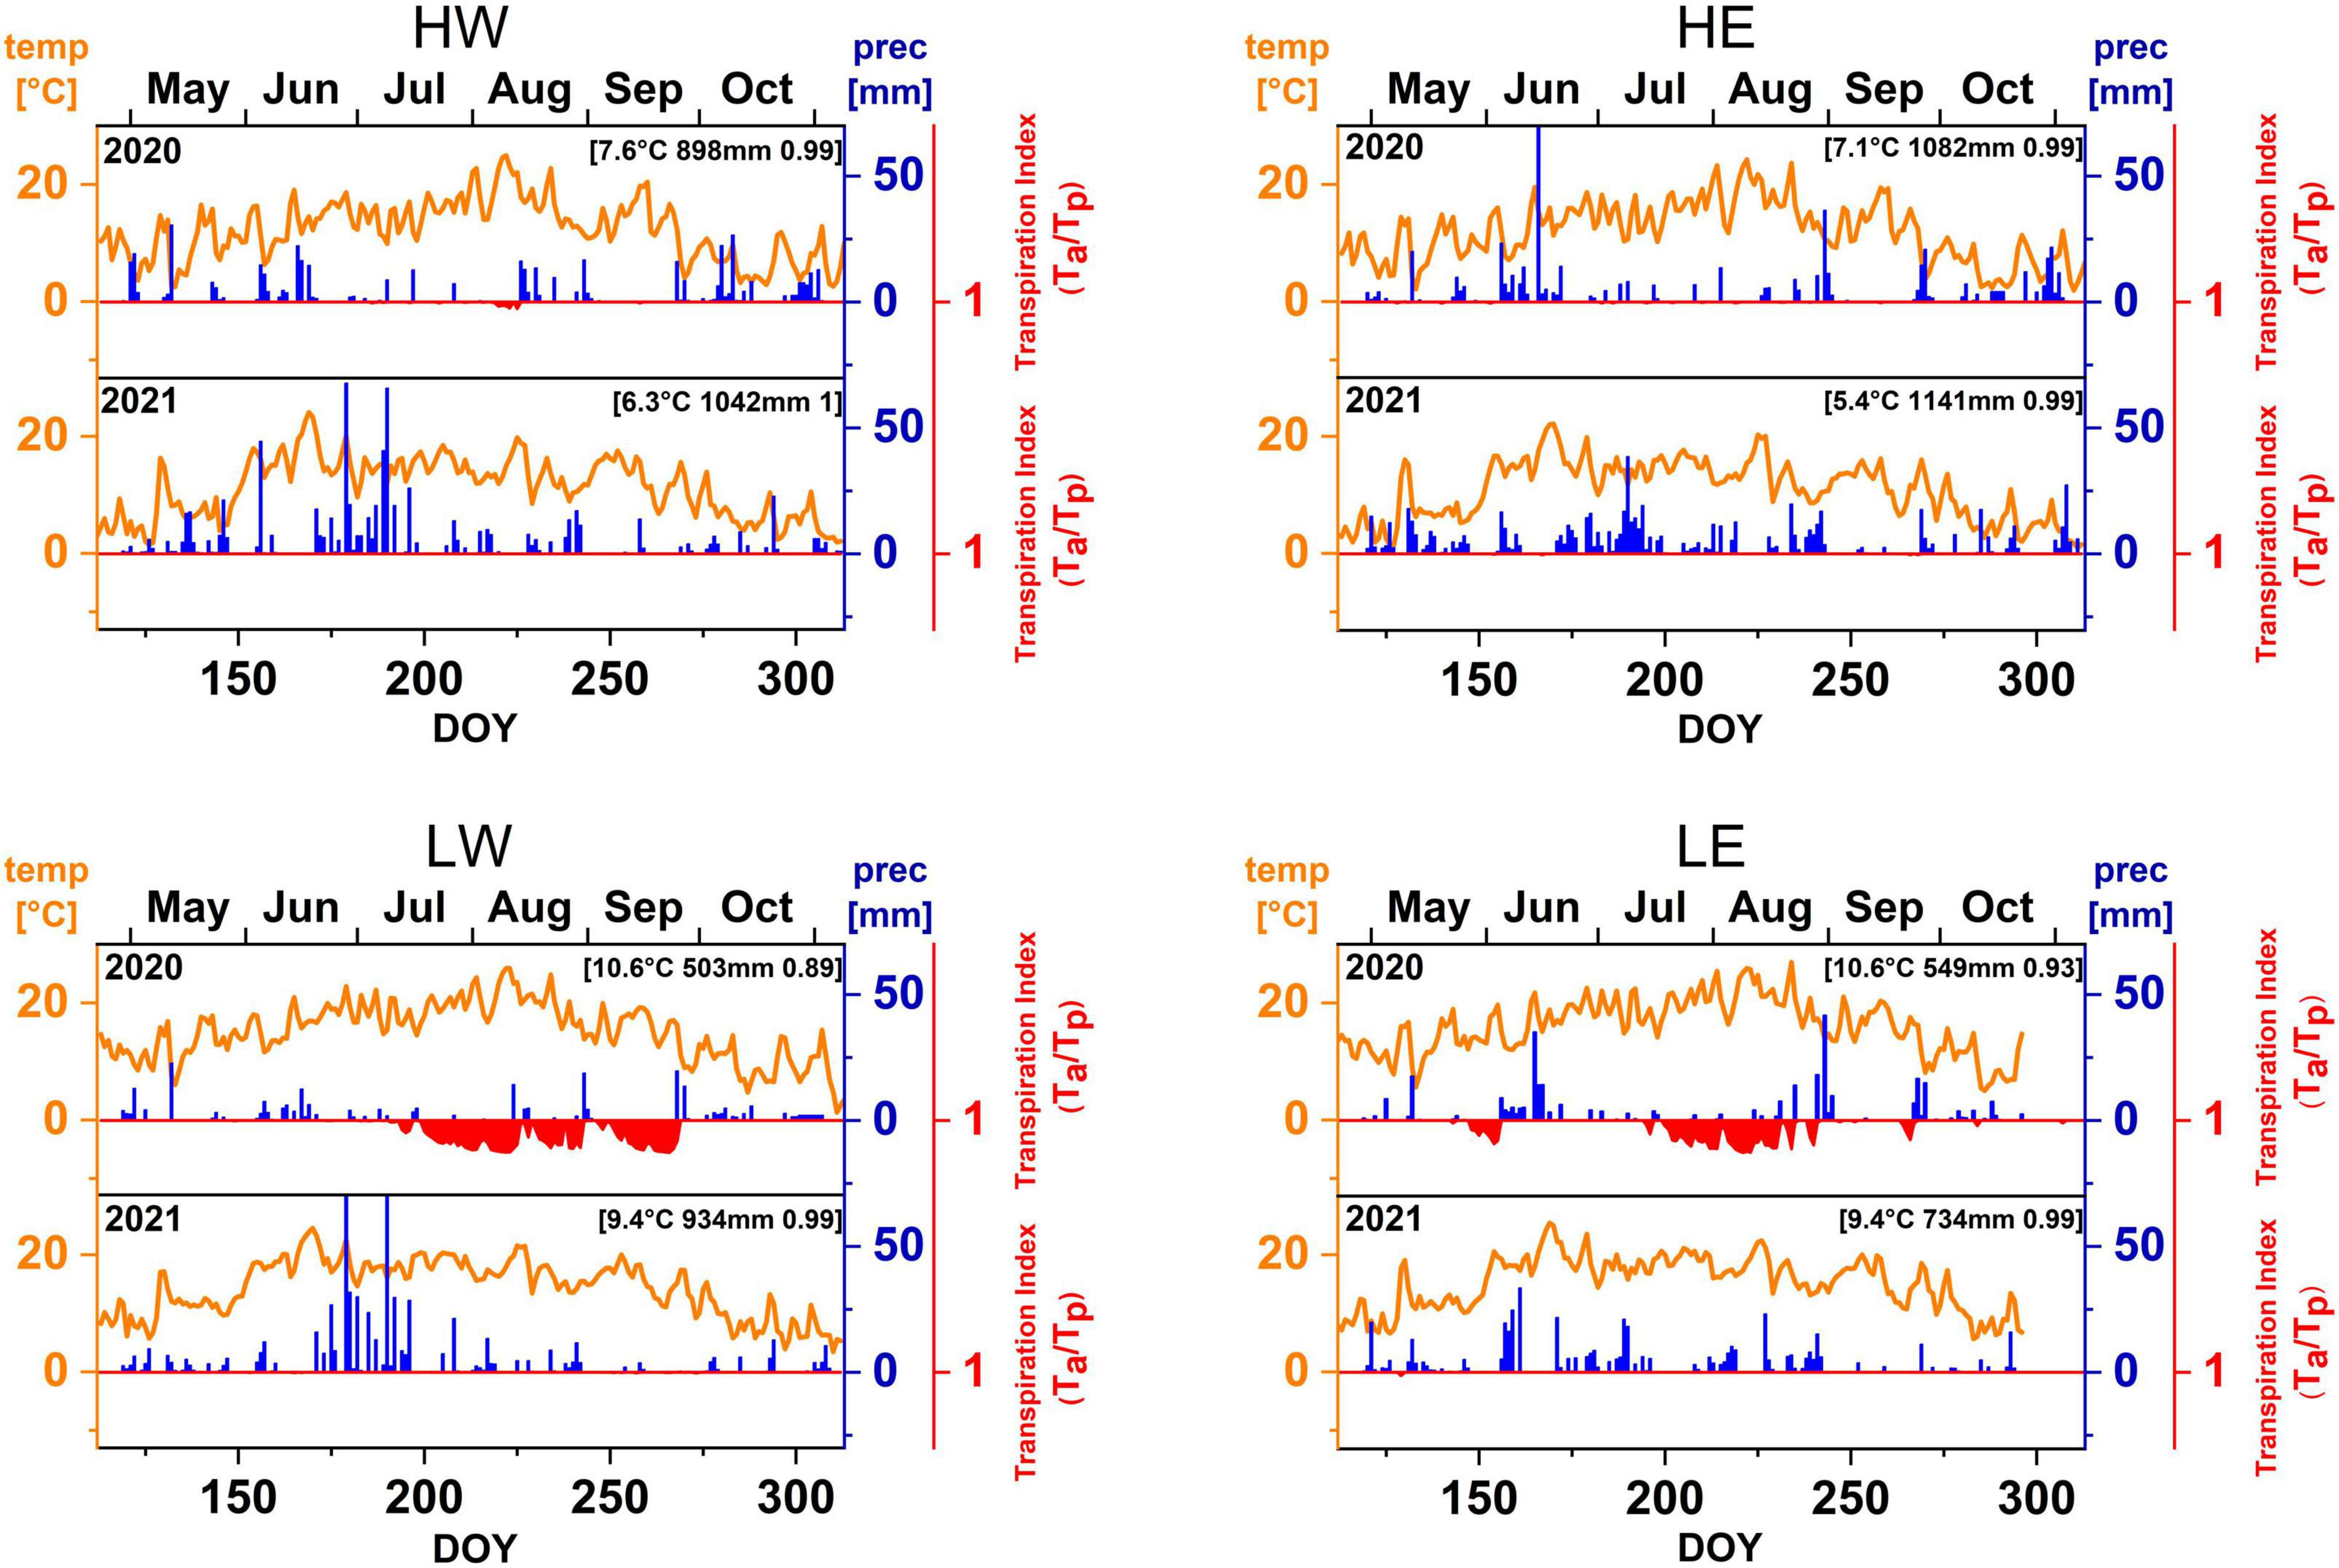
Figure 2. Daily mean temperature, precipitation, and transpiration index (the ratio Ta/Tp; values below 1 indicate drought stress) at all study sites in 2020 and 2021.
2.2 Microcore sampling, preparation, and analysis
Microcores were collected from five similar-aged dominant trees per species at each site in biweekly intervals from mid-April to mid-October to monitor cambial activity during the growing season (Table 1). Wood samples with a length of approximately 15 mm and a diameter of 2 mm were punched with a Trephor borer at breast height (Rossi et al., 2006a). Throughout the season, the samples were extracted following an ascending spiral pattern to avoid wound effects (Deslauriers et al., 2003; Rossi et al., 2006b; Michelot et al., 2012). First stored in a water:ethanol solution (1:1) to prevent tissue deterioration, the cores were then cut with a rotary microtome in transverse sections of ca. A total of 8–12 μm, stained with safranine-red and astra-blue, and finally observed under a light microscope with polarized light (Zeiss), following the protocols by Rossi et al. (2006b) and Prislan et al. (2022). Wood formation phases were discriminated according to Rossi et al. (2006b) and Rathgeber et al. (2016) and measured with the software ImageJ1.52o (Board of Regents of the University of Wisconsin-Madison, Broad Institute of MIT and Harvard, and Max Planck Institute of Molecular Cell Biology and Genetics (2009–2021). The widths of three radial rows in the respective cell differentiation phase were measured for all tree species as equivalent to the number of cells per phase. In doing so, values for both broadleaved and coniferous tree species can be compared. Unmeasurable samples, e.g., due to cracks, were set as NA values. Since the percentage of NA values was <5%, the results were not affected. The seasonal cambial activity and the dynamics of xylem formation were analyzed with the R package Caviar (Rathgeber et al., 2018) and fitted with a Gompertz function (Rossi et al., 2003). After calculating the mean cell widths per tree, the aggregated values were standardized with the previous ring width (Rathgeber et al., 2018). Due to over- or underestimated values after standardization in approximately 30% of the tree means, only their aggregated values were further analyzed. Subsequently, the intra-annual progress of the average width of cells in the enlargement, wall thickening, and mature zone (EWMZ) for each species and site was compared between the 2020 and 2021 growing seasons. The onset and cessation of different phenophases were defined according to Rathgeber et al. (2011). Hence, the onset of the respective phenophases started when more than 50% of the analyzed radial files of each tree per site and year showed the first cell of the respective phenophase. Likewise, the end of the enlarging and thickening phase was defined as the date with less than 50% of the analyzed radial files showing the last cell of that phenophase. Growth interruptions were defined as a renewed formation of enlarging cells in 50% of the studied radial files after an already ceased enlarging phase within one growing season. Maximum and average growth rates were calculated from the Gompertz functions. Accordingly, the average and maximum growth rates (μm/day) were calculated between the time at which the respective Gompertz function reached 5 and 95% of the final tree-ring width (Rathgeber et al., 2018).
2.3 Dendrometer measurements
High-resolution electronic band dendrometers (DRL26, EMS Brno, Czechia) were installed at breast height on the same trees sampled for microcores (Table 1). The outer part of the bark of conifers was carefully removed to minimize the influence of bark swelling and shrinking (Michelot et al., 2012). The electronic band dendrometers recorded stem circumference variations (SCVs) and temperature every 30 min during the 2020 and 2021 growing seasons. The raw dendrometer data were processed with the R package treenetproc (Knüsel et al., 2021). Outliers and jumps were detected by calculating the first and fourth quartiles of the first-order differences (also adjusted) plus the median of the absolute deviations multiplied by defined parameters as a tolerance value (Knüsel et al., 2021). Finally, the processed data distinguished between growth-induced irreversible stem expansion (GRO) and tree water deficit (TWD) (values and times) following the zero-growth approach (Zweifel et al., 2016). Consequently, the species’ non-reversible growth (GRO) was compared with EWMZ measurements between the growing seasons of 2020 and 2021, while both tree responses (GRO and TWD) were correlated with climate variables. Furthermore, the daily average values of the radial increment and the tree water deficit, the average and highest growth rate, the number of days with growth, and growth interruptions were calculated from the GRO series. The onset and cessation of tree growth were defined as the 5 and 95% thresholds, respectively, of the final average tree-ring width for a given species, site, and year. After determining the 14-day period with the highest cumulative GRO, the highest growth rate was calculated by downscaling the 14-day increment into a daily growth rate. The number of days with growth corresponds to the days when GRO > 0. Growth interruptions are defined as periods with >15 days of GRO = 0 for all five trees per site and species.
Differences in the timing, duration, and rates between the two study years were compared with a paired t-test (Wilcoxon test) and between species and sites with the analysis of variance (Welch-ANOVA) or a t-text (Wilcoxon test) in R. Before, all parameters were tested for normality and equality of variance (Quinn and Keough, 2002).
2.4 Soil water model
The available soil water in 40 cm, the available soil water in the root zone, and the transpiration rate in the form of an index were provided by the Bavarian State Institute of Forestry (LWF) and derived from the Bavarian Forest Ecosystem Monitoring Stations “Bad Brückenau,” “Würzburg,” and “Goldkronach” for the study sites HW, LW, and HE (Table 1). The soil data were modeled with the LWF-BROOK90 model (Hammel and Kennel, 2001; Schmidt-Walter et al., 2019), a processed-based, one-dimensional soil-vegetation-atmosphere-transport model modified from the BROOK90 hydrological model (Federer et al., 2003; Federer, 2021). However, for the study site LE, the soil properties were modeled with the LWF-BROOK90 model in R (LWFBrook90R) using climate data (daily precipitation, relative humidity, global solar radiation, mean, minimum, and maximum air temperature, average vapor pressure, and average wind speed) from the climate station “Nürnberg” (DWD Climate Data Center, 2020) as model input. The soil physical properties (texture, bulk density, and coarse fragments) and the vegetation parameters were directly recorded at the study site and, if necessary, analyzed in the laboratory following the methods described by Schmidt-Walter et al. (2019).
2.5 Climate-growth relationships
The resulting high-resolution tree responses (GRO and TWD) were compared to daily resolved environmental data, such as relative humidity, daily precipitation, mean, minimum and maximum temperature, solar radiation, water vapor pressure deficit, and available soil water (0–40 cm and the entire root zone), to detect the influence of environmental factors (Čufar et al., 2008b; De Micco et al., 2016). The calculated values for GRO (growth-induced irreversible stem expansion) and TWD (tree water deficit) according to Zweifel et al. (2016) were correlated with climate data over the complete growing season as well as for 14-day intervals by calculating moving correlations. For seasonal climate correlations, the growth period was consistently defined for all species, sites, and years (2020/2021) to enable universal comparison. The earliest date of the radial increment (DOY 113/112) defined the beginning, and the date when the last tree completed 100% of the final tree ring (DOY 323/312) defined the end of the growing season. Then, Spearman’s and Pearson’s correlation coefficients were calculated for the common period between GRO/TWD and standard climate variables with the R package correlation (Makowski et al., 2020). Since the values were not normally distributed, Spearman’s correlation coefficients were presented. However, figures illustrating the Pearson’s correlation coefficients are shown in the Supplementary material. The independence of the correlated climate variables was tested by applying the Holm’s-Bonferroni’s approach (Holm, 1979), and the thresholds for the significance levels (p < 0.05, p < 0.01, and p < 0.001) were accordingly adapted. For moving correlations, the growth periods were aligned to DOY 112 until 312 as a common period. The values were correlated using a 14-day moving window with an offset of 1 day. Furthermore, the GRO variable was modified to a daily GRO increment. Moving correlations were calculated by applying the R package zoo (Zeileis and Grothendieck, 2005).
3 Results
3.1 Tree growth phenology
The tree ring formation of Norway spruce in 2020 at the high-elevation sites began between early and mid-May and ended between mid-September and mid-October (Table 2a and Figure 3A). At both sites, dendrometer data revealed growth interruptions between early September and early October 2020. In 2021, the growth onset was significantly later (mid-to-late May) compared to 2020 and ceased significantly earlier, particularly at HE (>4 weeks earlier) (Table 2a). However, the date of growth cessation varied for up to 4 weeks at both sites between the two methods. The dendrometers recorded a later growth cessation at HE in 2020, while at HW in 2021, new xylem cells were still formed, although no radial increment was measured (Table 2a). Generally, tree rings formed in 2021 were significantly wider (HW) or showed only small differences between 2020 and 2021 (HE) (Figure 3A). In contrast, higher temporal variations occurred in the individual phenophases between 2020 and 2021 for spruce at HE, while the onset and cessation of the enlarging, wall thickening, and mature phases were similar for spruce at HW in the two subsequent years (S1).
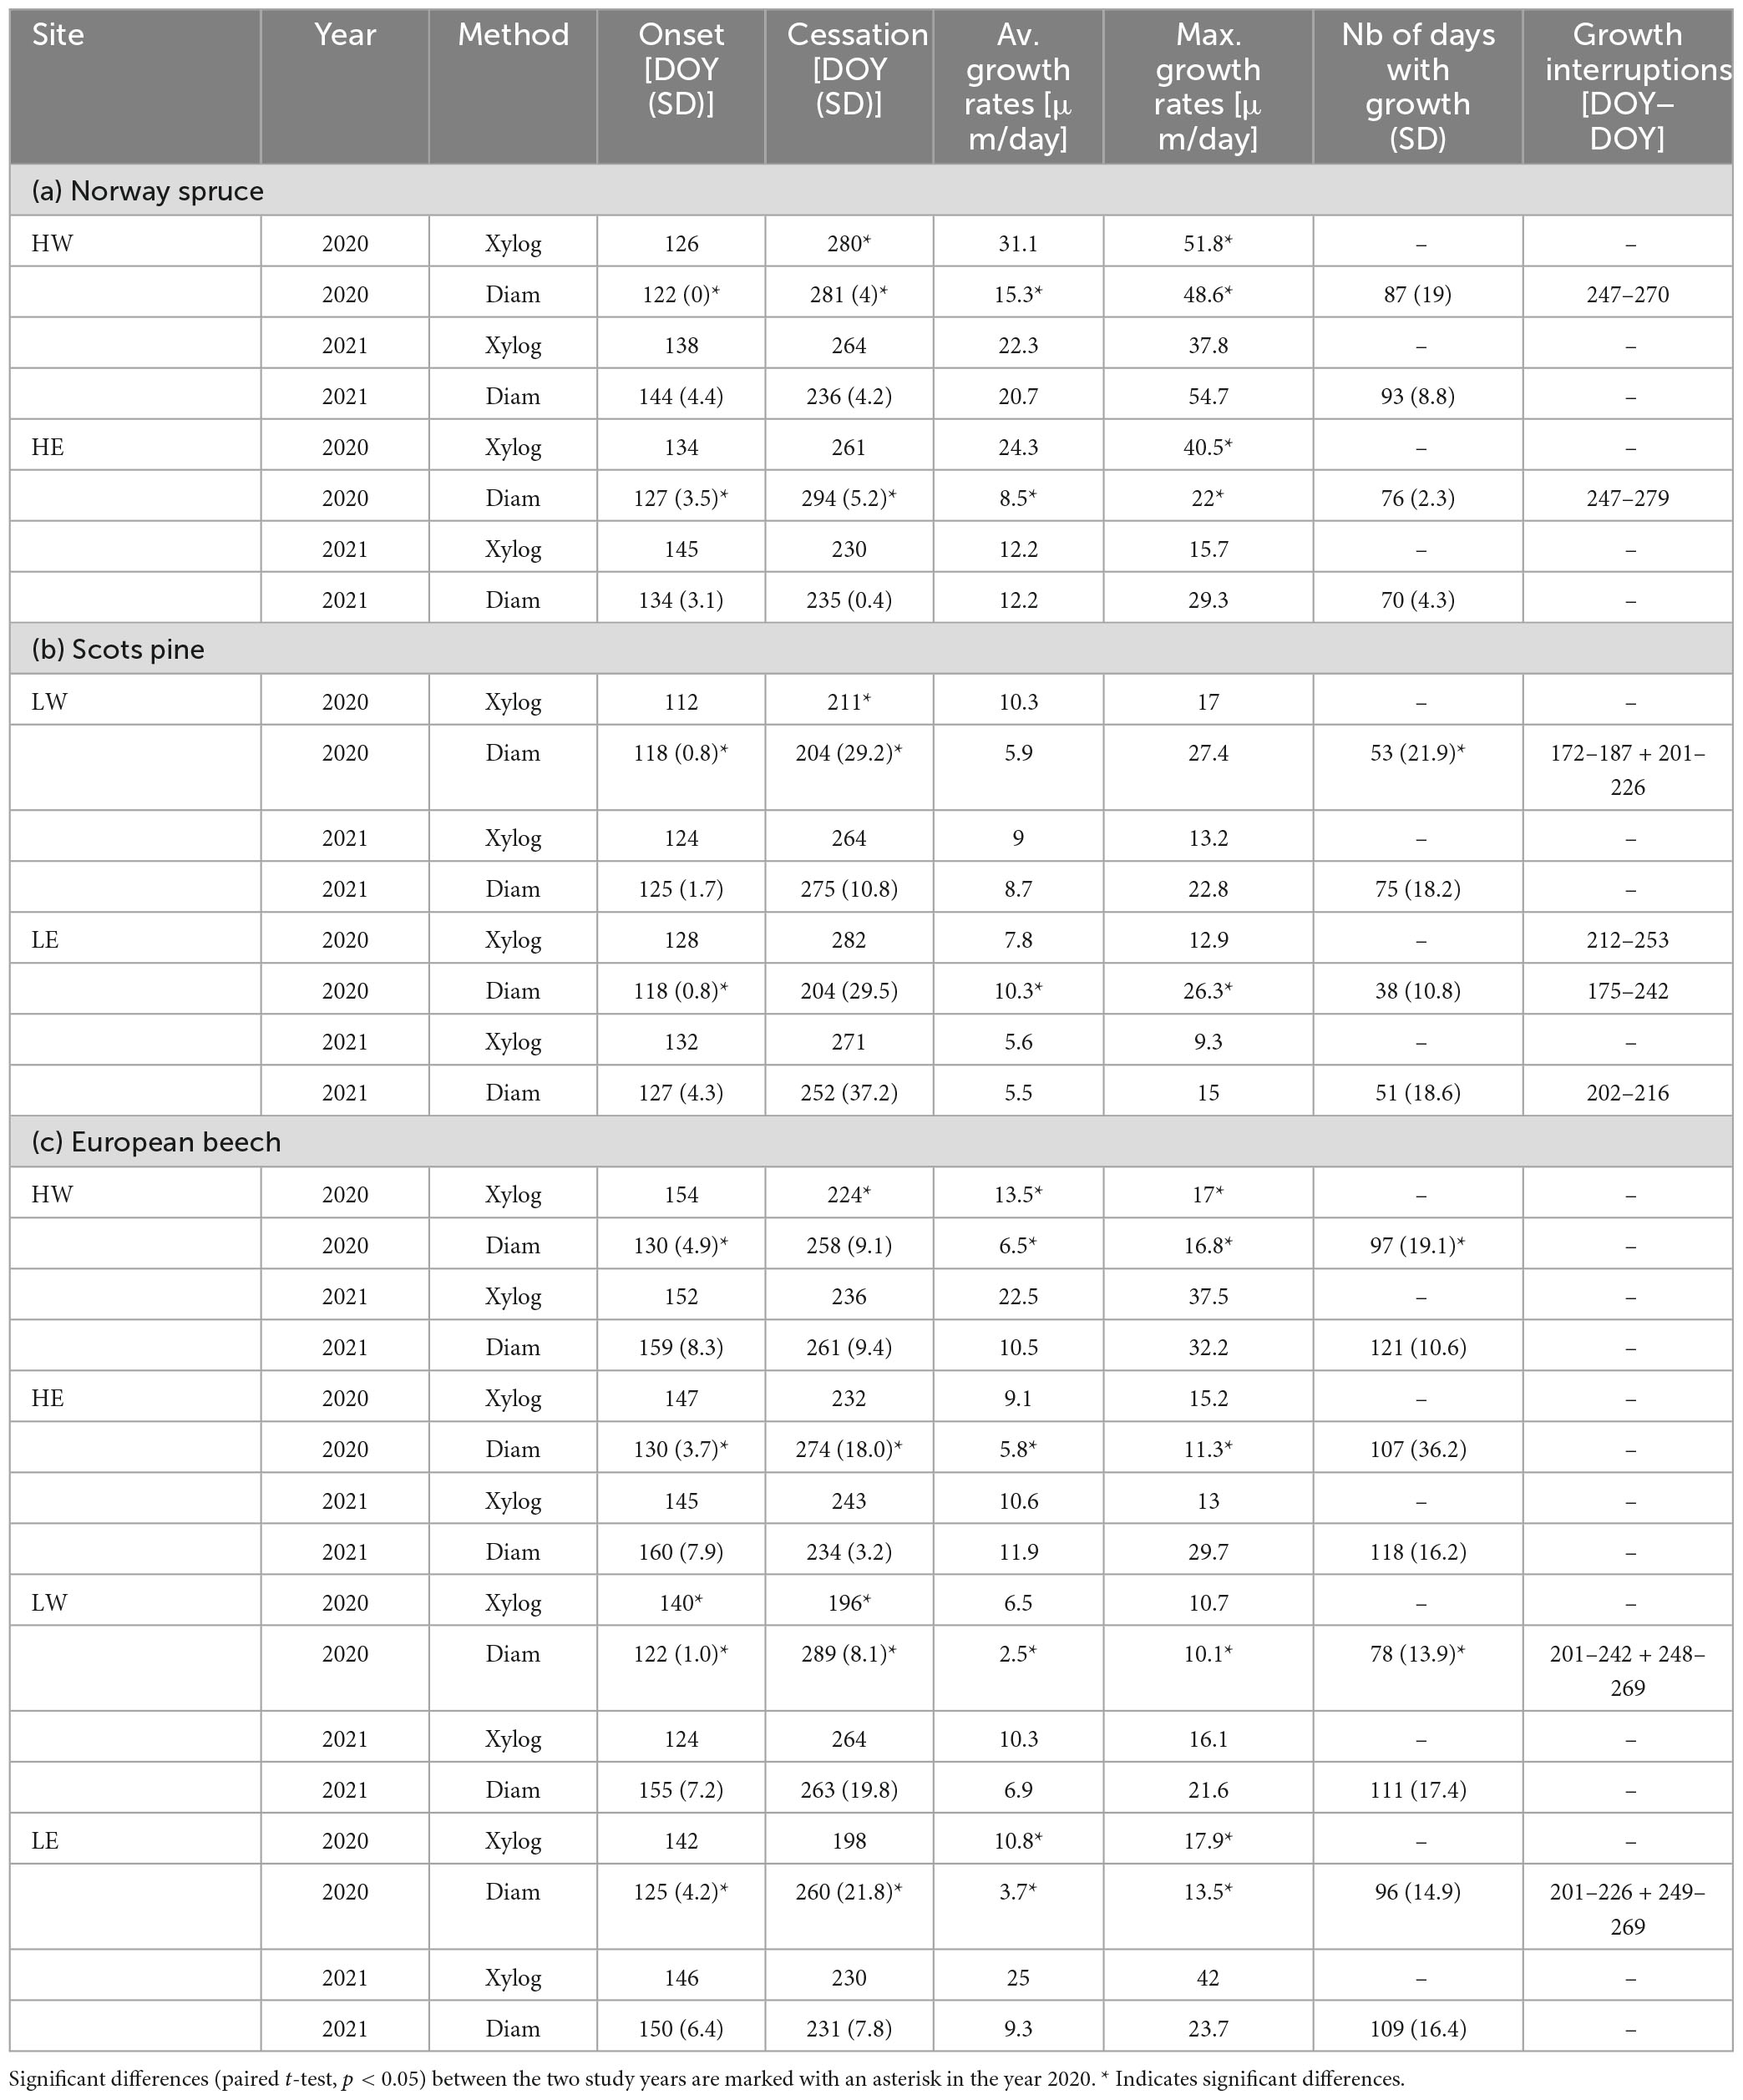
Table 2. Onset, cessation, average and maximum growth rates [μm/day], number of days with growth, and growth interruptions observed using wood anatomical analysis of micro sections (Xylog) and dendrometer data (Diam) for (a) Norway spruce, (b) scots pine, and (c) European beech.
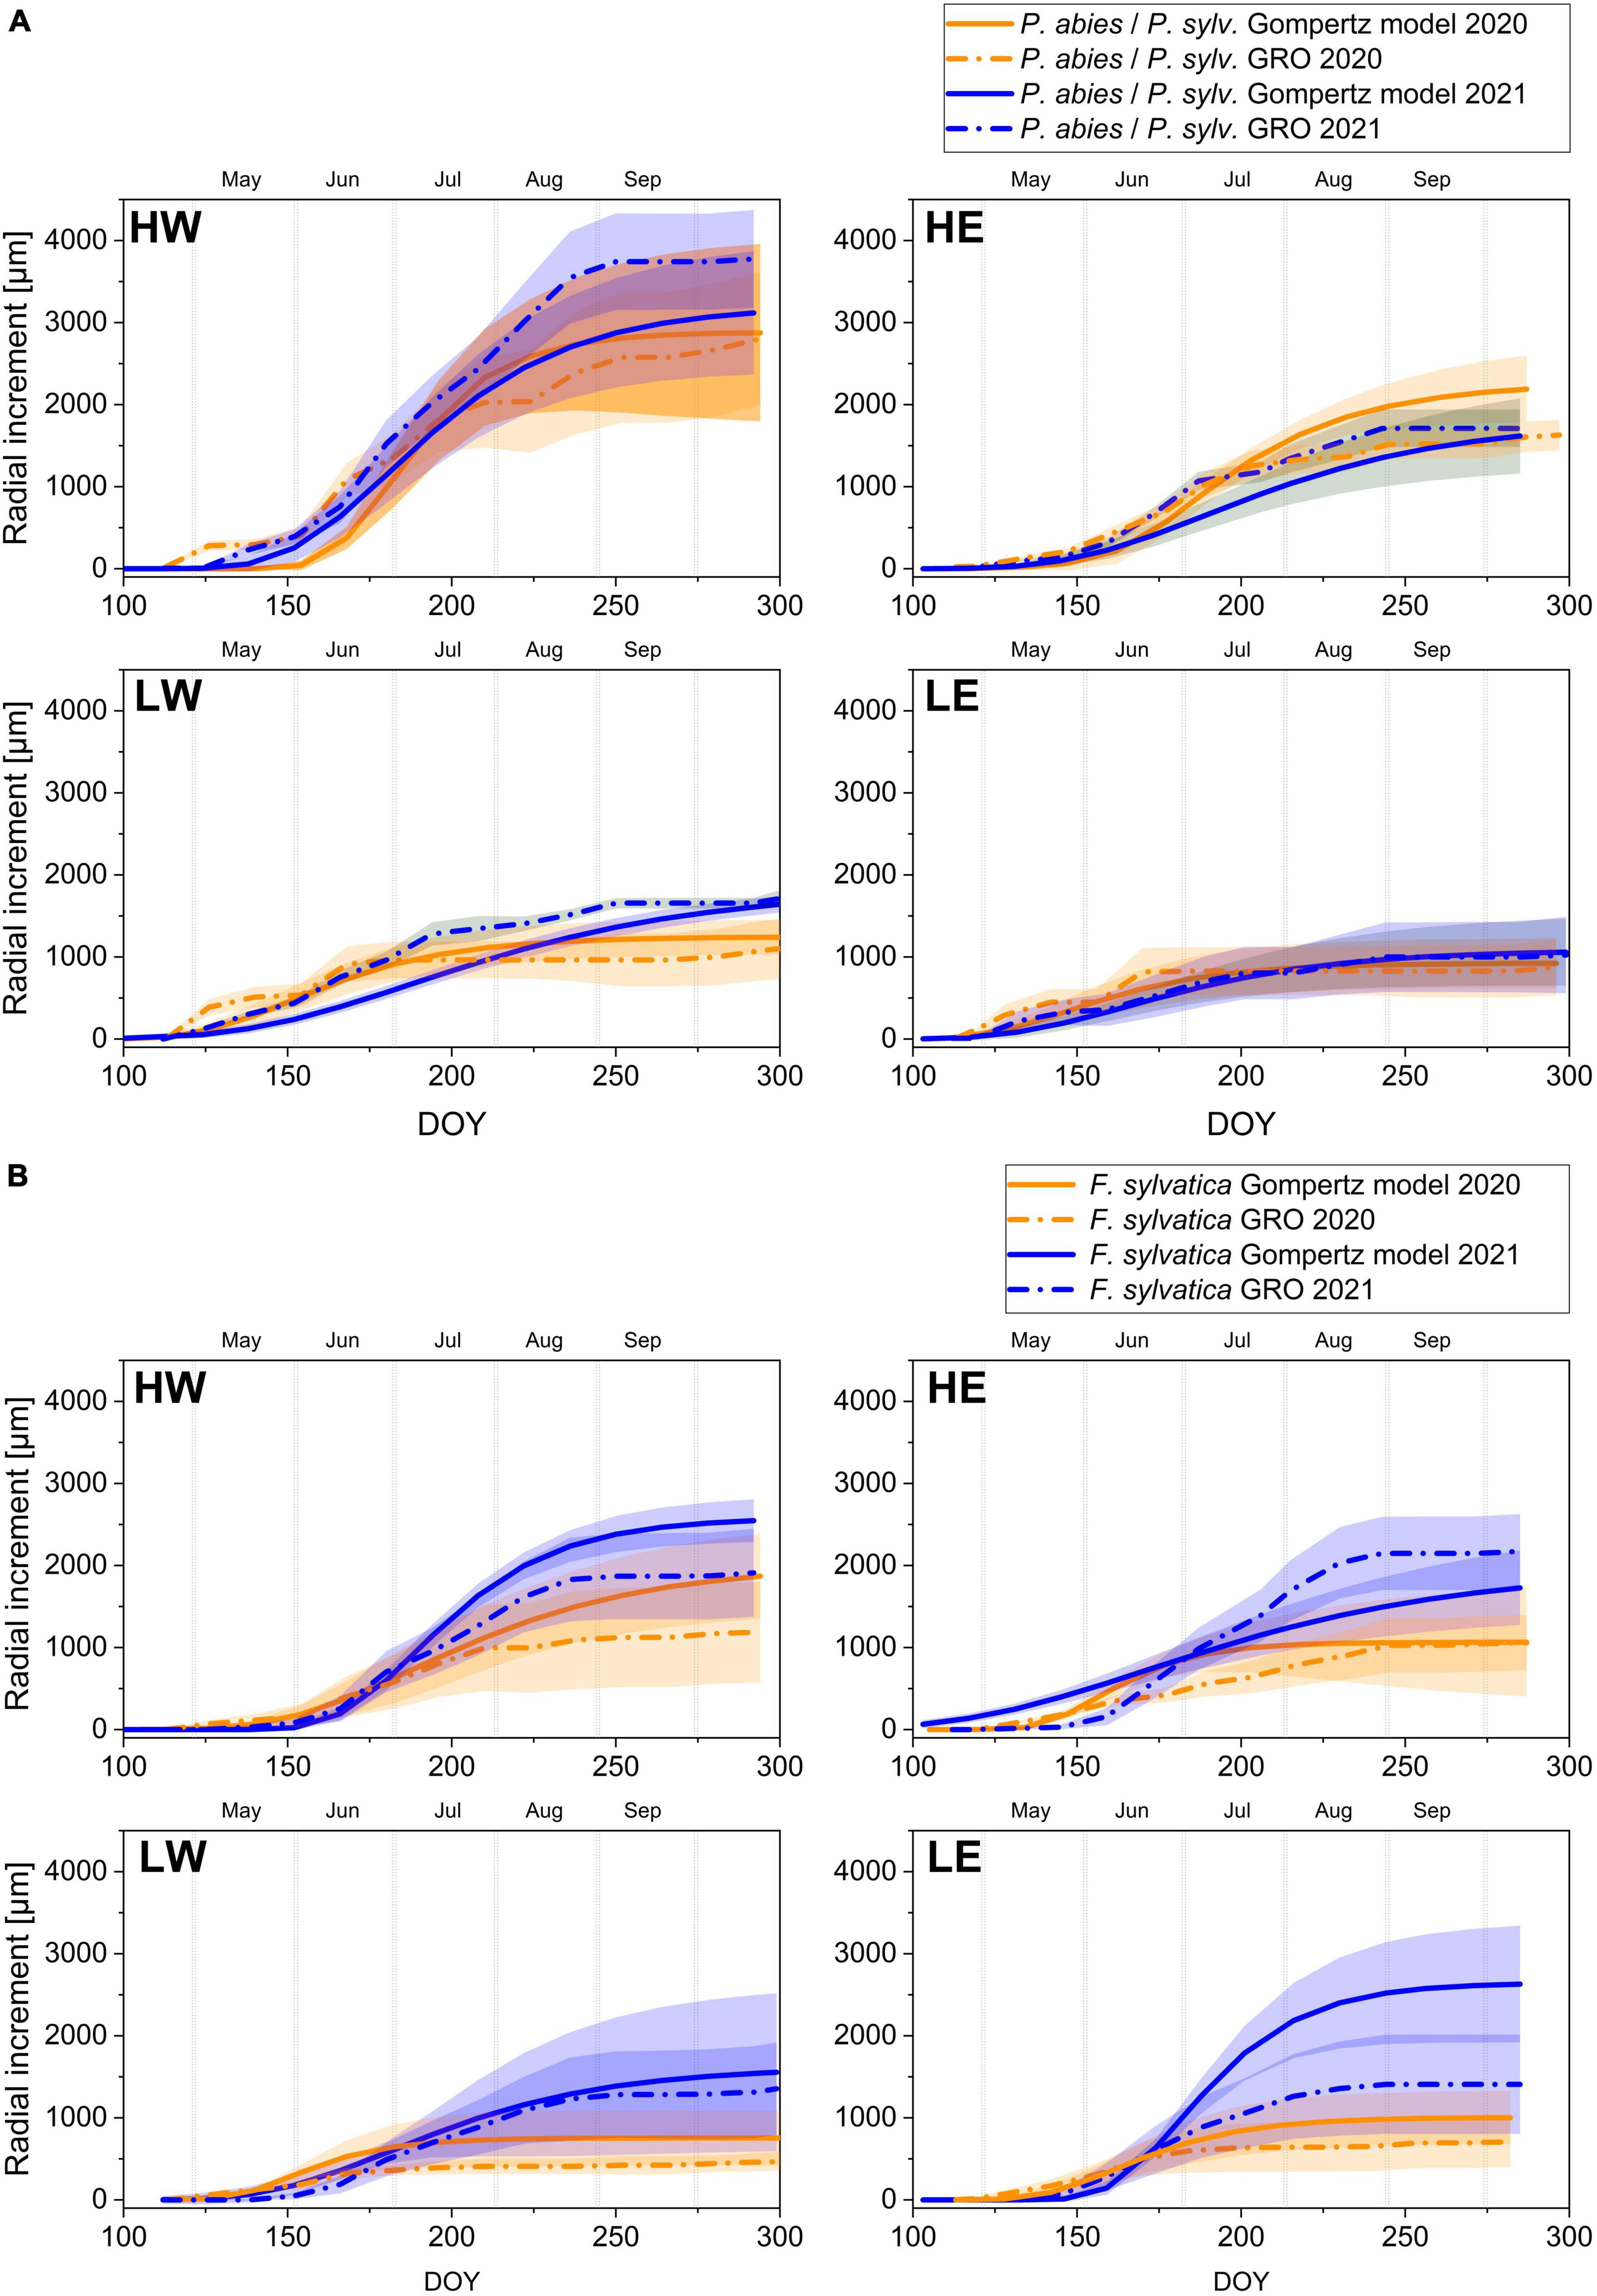
Figure 3. Gompertz model and GRO with confidence intervals of the growing seasons 2020 and 2021 for (A) conifers (P. abies at HW and HE, and P. sylvestris at LW and LE) and (B) European beech (F. sylvatica) at the two high- and low-elevation sites.
The radial growth of Scots pine at low-elevation sites started in 2020 between the end of April and early May. Pine at LW was the earliest to form the first xylem cells in 2020 compared to all studied tree species. Radial growth ceased in late July, but pine at HE restarted cambial activity in mid-September for approximately 3 weeks, as observed by both methods. At LW, only dendrometer data showed growth interruptions (Table 2b). In 2021, the formation of new xylem cells began a few days later but lasted longer than in 2020 and ceased by the end of September, which was also reflected in a higher number of latewood cells. However, dendrometer data showed that pine at LE had stopped increasing by the end of August (Table 2b). The individual phenophases showed no distinct patterns in either growing season but a longer-lasting enlarging phase compared to 2020 (S1). Nevertheless, only pine in LW showed significantly wider tree rings in 2021 (Figure 3A).
European beech at high-elevation sites formed their first xylem cells between the end of May and the beginning of June, with growth ceasing in mid-August 2020. Dendrometer measurements indicated that the diameter increase began as early as May and stopped around mid-September (Table 2c). At low-elevation sites in 2020, beech formed their first xylem cells in mid-to-late May, while the diameter had already increased by early May. The last newly formed cells appeared in mid-July, but the diameter increase halted between late September and mid-October. According to dendrometer data, beech at both low-elevation sites experienced growth interruptions between mid-July and mid-September (Table 2c). In 2021, beech growth at high-elevation sites started around the same time as in 2020. However, dendrometer measurements showed that the diameter increase lagged behind the first visible appearance of new xylem cells by several days. Radial growth ceased in late August, except for beech at HW, where dendrometers detected radial growth until mid-September (Figure 3B).
Beech at low-elevation sites started radial growth in 2021 by the end of May, even though the first xylem cells had already formed in early May. Tree growth ceased in mid-August at LE and more than 4 weeks later at LW (Figure 3B). The cell wall thickening phase of beech in 2021 was longer at all sites, with a later onset at high-elevation sites and an earlier onset at low-elevation sites compared to 2020. The mature phase began around the same time in 2020 and 2021, except for beech at LW, where the first mature cells occurred significantly later in 2021 than in 2020 (S2).
3.2 Tree growth kinetics
At both high-elevation sites, the highest growth rates for Norway spruce appeared in 2020 between June and early July, followed by a significant decrease or even a growth stop for several days. Spruce at HW revealed significantly higher maximum and average growth rates as well as more actual growth days (87, SD = 19) compared to spruce at HE (76, SD = 2.3) (Table 2a). In 2021, tree growth began very slowly, but spruce grew very rapidly until the end of August (Figure 3A), with the highest growth rates occurring between mid-June and the end of July. The average and maximum growth rates, as measured with dendrometers, were higher in 2021 than in 2020. In contrast to dendrometer records, cell formation revealed higher growth rates in 2020.
Scots pine at the low-elevation sites revealed maximum growth rates between early May and mid-June in both years, but the average (at LE) and maximum growth rates (at LW + LE) were higher in 2020. However, in 2020, pine significantly decreased its growth rate around July or even stopped radial growth (Figure 3B), resulting in only a low number of actual growth days (LW: 53, SD = 21.9, LE: 38, SD = 10.8). Despite lower growth rates at the beginning of the season in 2021, no tree stopped growing, but continuous accretion occurred from May until September, resulting in up to 20 more actual growth days in 2021 (Table 2b).
The maximum growth rate of beech at both low- and high-elevation sites occurred between early and mid-June 2020. In 2021, beech at high-elevation sites exhibited maximum rates approximately 2 weeks later than in 2020, while the period of maximum growth lasted several days longer for beech at low-elevation sites (Figure 4A). The number of days with growth was higher at every site in 2021, especially at LW. Similarly, beech displayed higher average and maximum growth rates in 2021, except for xylogenesis measurements at HE, which showed higher maximum values in 2020 (Table 2c).
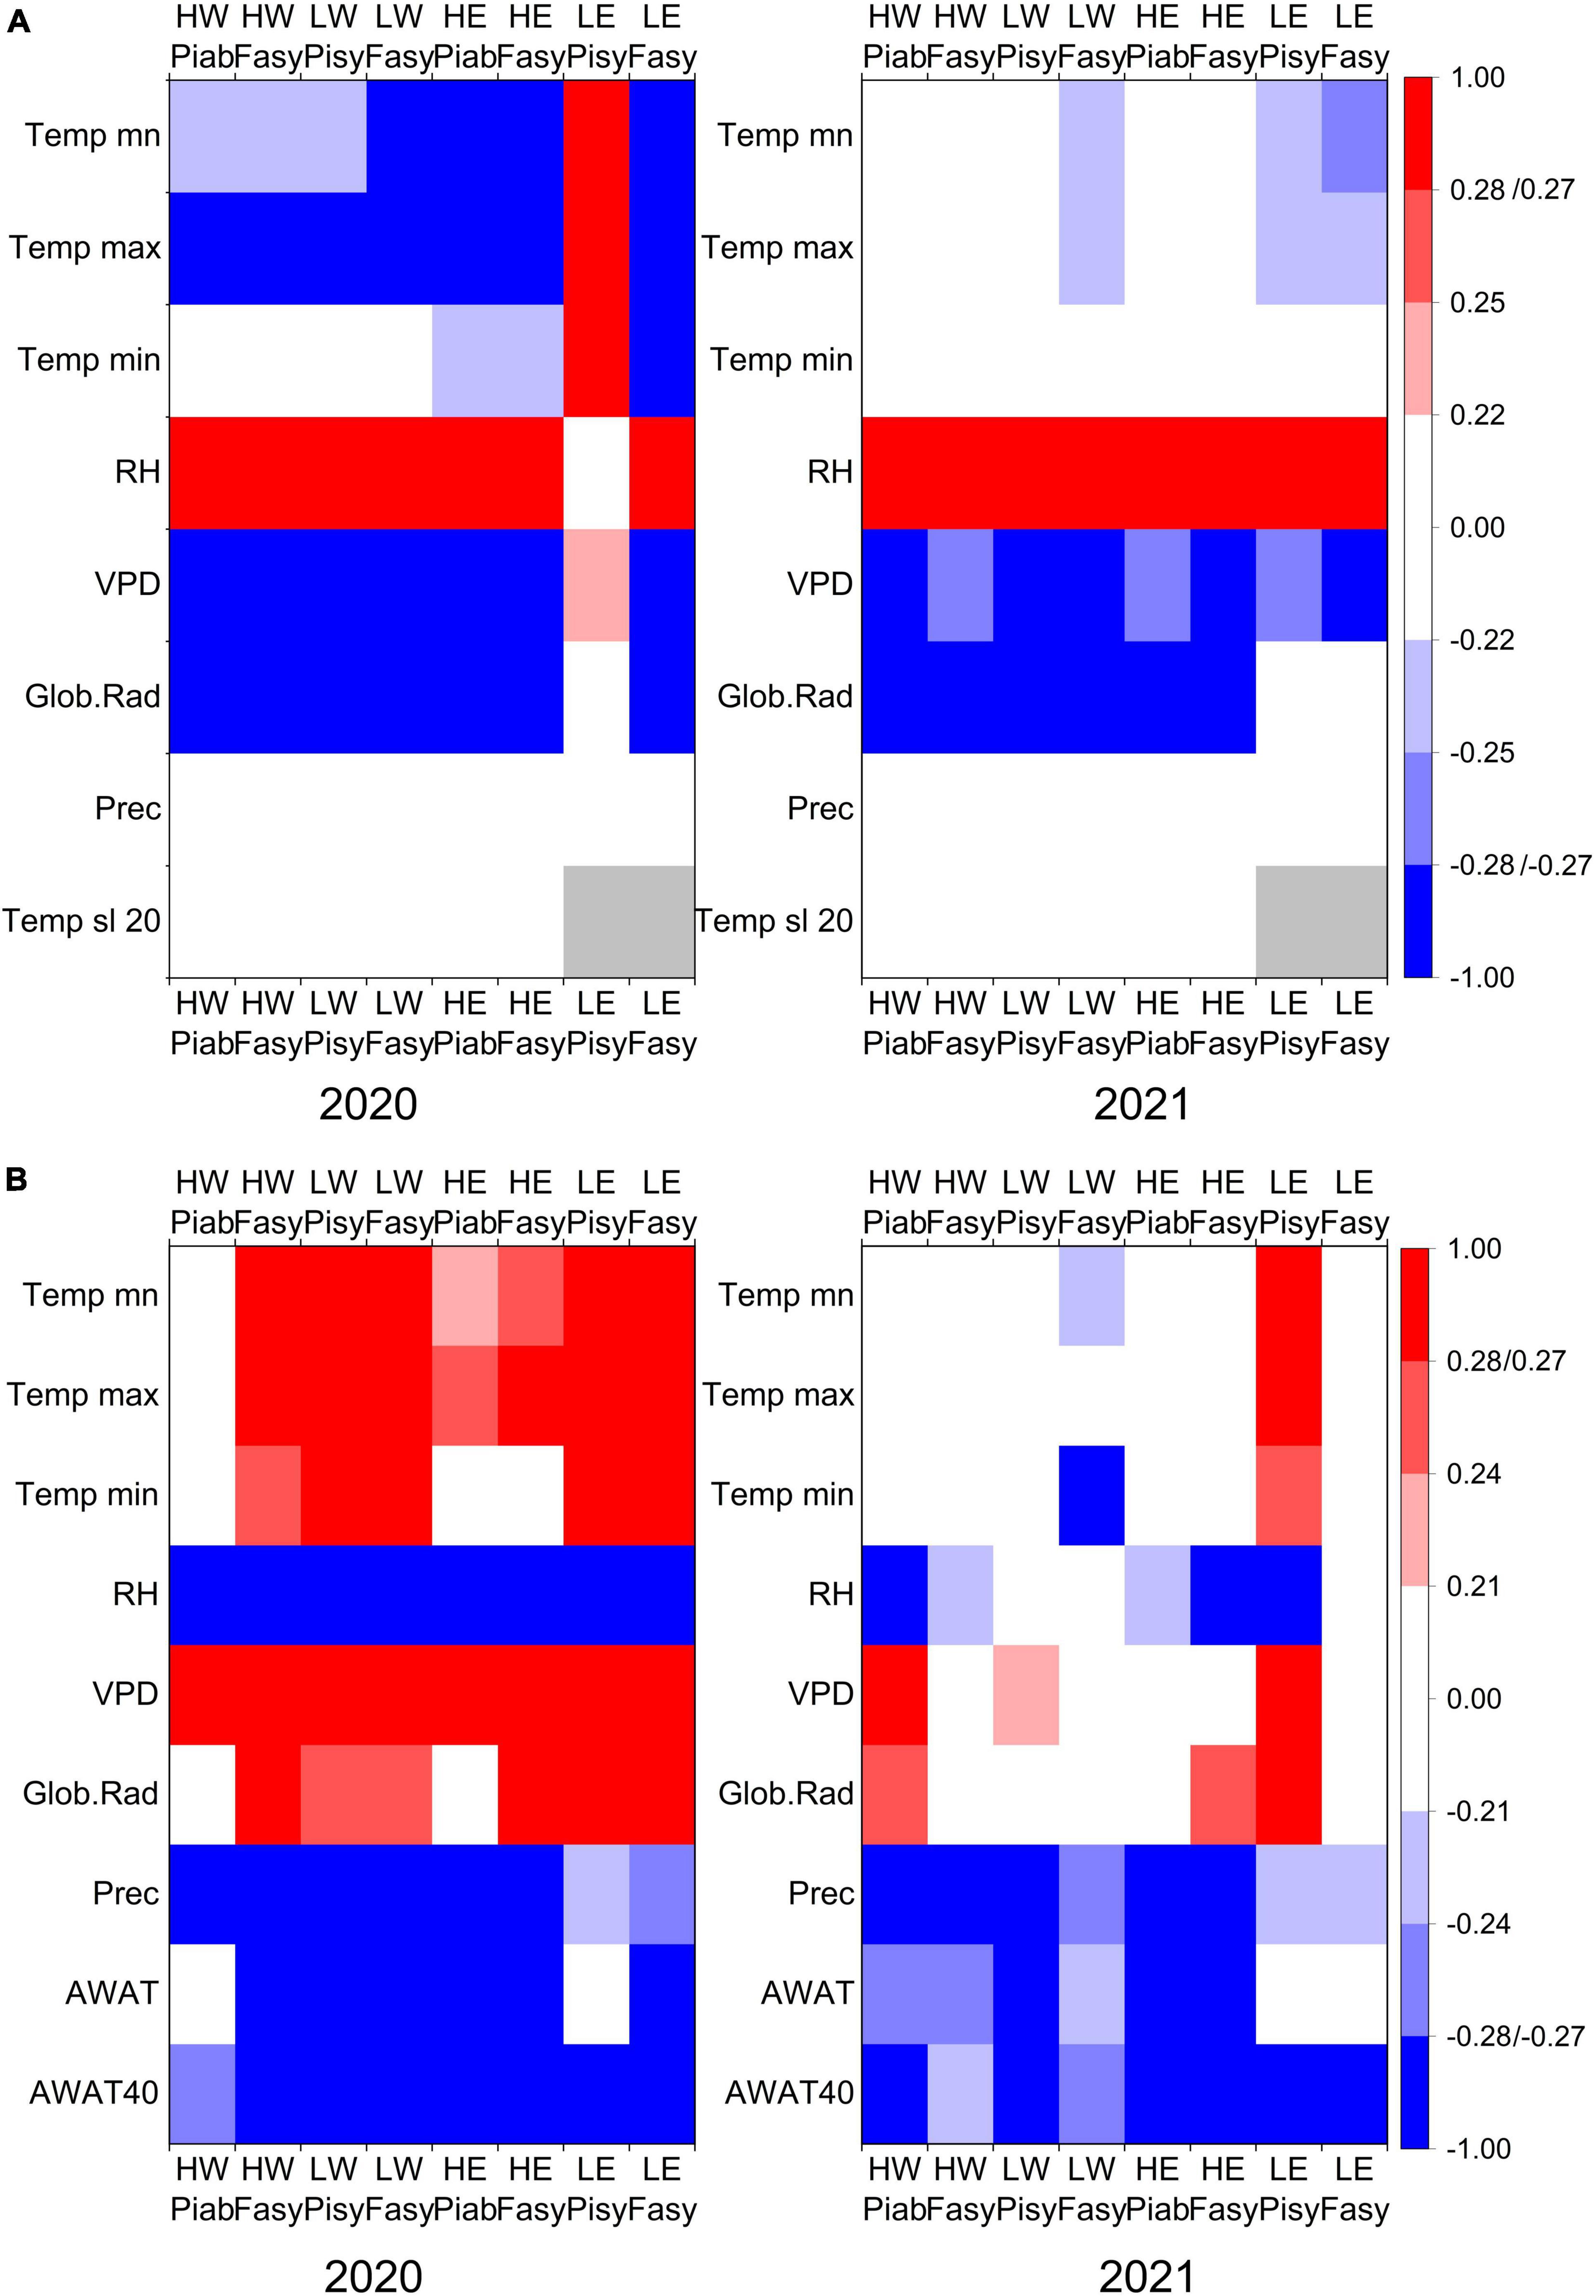
Figure 4. Correlations between (A) GRO and the climate variables temperature [Temp mean (mn), max, min], relative humidity (RH), vapor pressure deficit (VPD), global radiation (Glob.Rad), precipitation (Prec), and soil temperature at 20 cm, measured on open area (Temp sl 20) and (B) TWD and the climate variables temperature [Temp mean (mn), max, min], relative humidity (RH), vapor pressure deficit (VPD), global radiation (Glob.Rad), precipitation (Prec), available soil water in root zone (AWAT), and 40 cm (AWAT40) in a daily resolution, within the growing seasons of 2020 and 2021. Color intensity indicates the significance level: p < 0.001 = dark, p < 0.01 = medium, p < 0.05 = faded). Gray bars indicate NA values.
3.3 Climate-GRO response
In the growing season of 2020 (DOY 113–323), the calculated growth-induced irreversible stem expansion (GRO) correlated positively (p < 0.001) with relative humidity and negatively with global radiation and vapor pressure deficit at all study sites, except for pine at LE. Furthermore, pine at LE showed a highly significant positive correlation with daily mean, maximum, and minimum temperatures, while all other sites revealed negative correlations to temperature in 2020. Soil temperature at a depth of 20 cm correlated positively with GRO, except for spruce at HW (Figure 4A). In the growing season of 2021 (DOY 112–313), similar to 2020, GRO showed positive correlations with relative humidity and negative correlations with vapor pressure deficit and global radiation, except for the study site LE. Unlike in 2020, a slightly negative correlation with temperature solely remained at the low-elevation sites (Figure 4A).
Similar to the positive correlation between GRO and relative humidity for all tree species at the high- and low-elevation sites for the entire growing season in 2020 (Figure 4A), a positive relationship between these two variables also appeared in the moving correlations (Figures 5A, B). In 2021, however, the correlating phases were shorter and switched at low-elevation sites in autumn to negative values. The correlation between GRO and precipitation did not show a significant correlation over the complete growing season (Figure 4A), but the moving correlations revealed time windows in which precipitation positively influenced GRO (Figures 5A, B). The correlation with soil temperature revealed short periods of positive relations but sometimes even negative ones. However, since no actual growth occurred in several periods in either 2020 or 2021, GRO was zero and could not be correlated (Figures 5A, B).
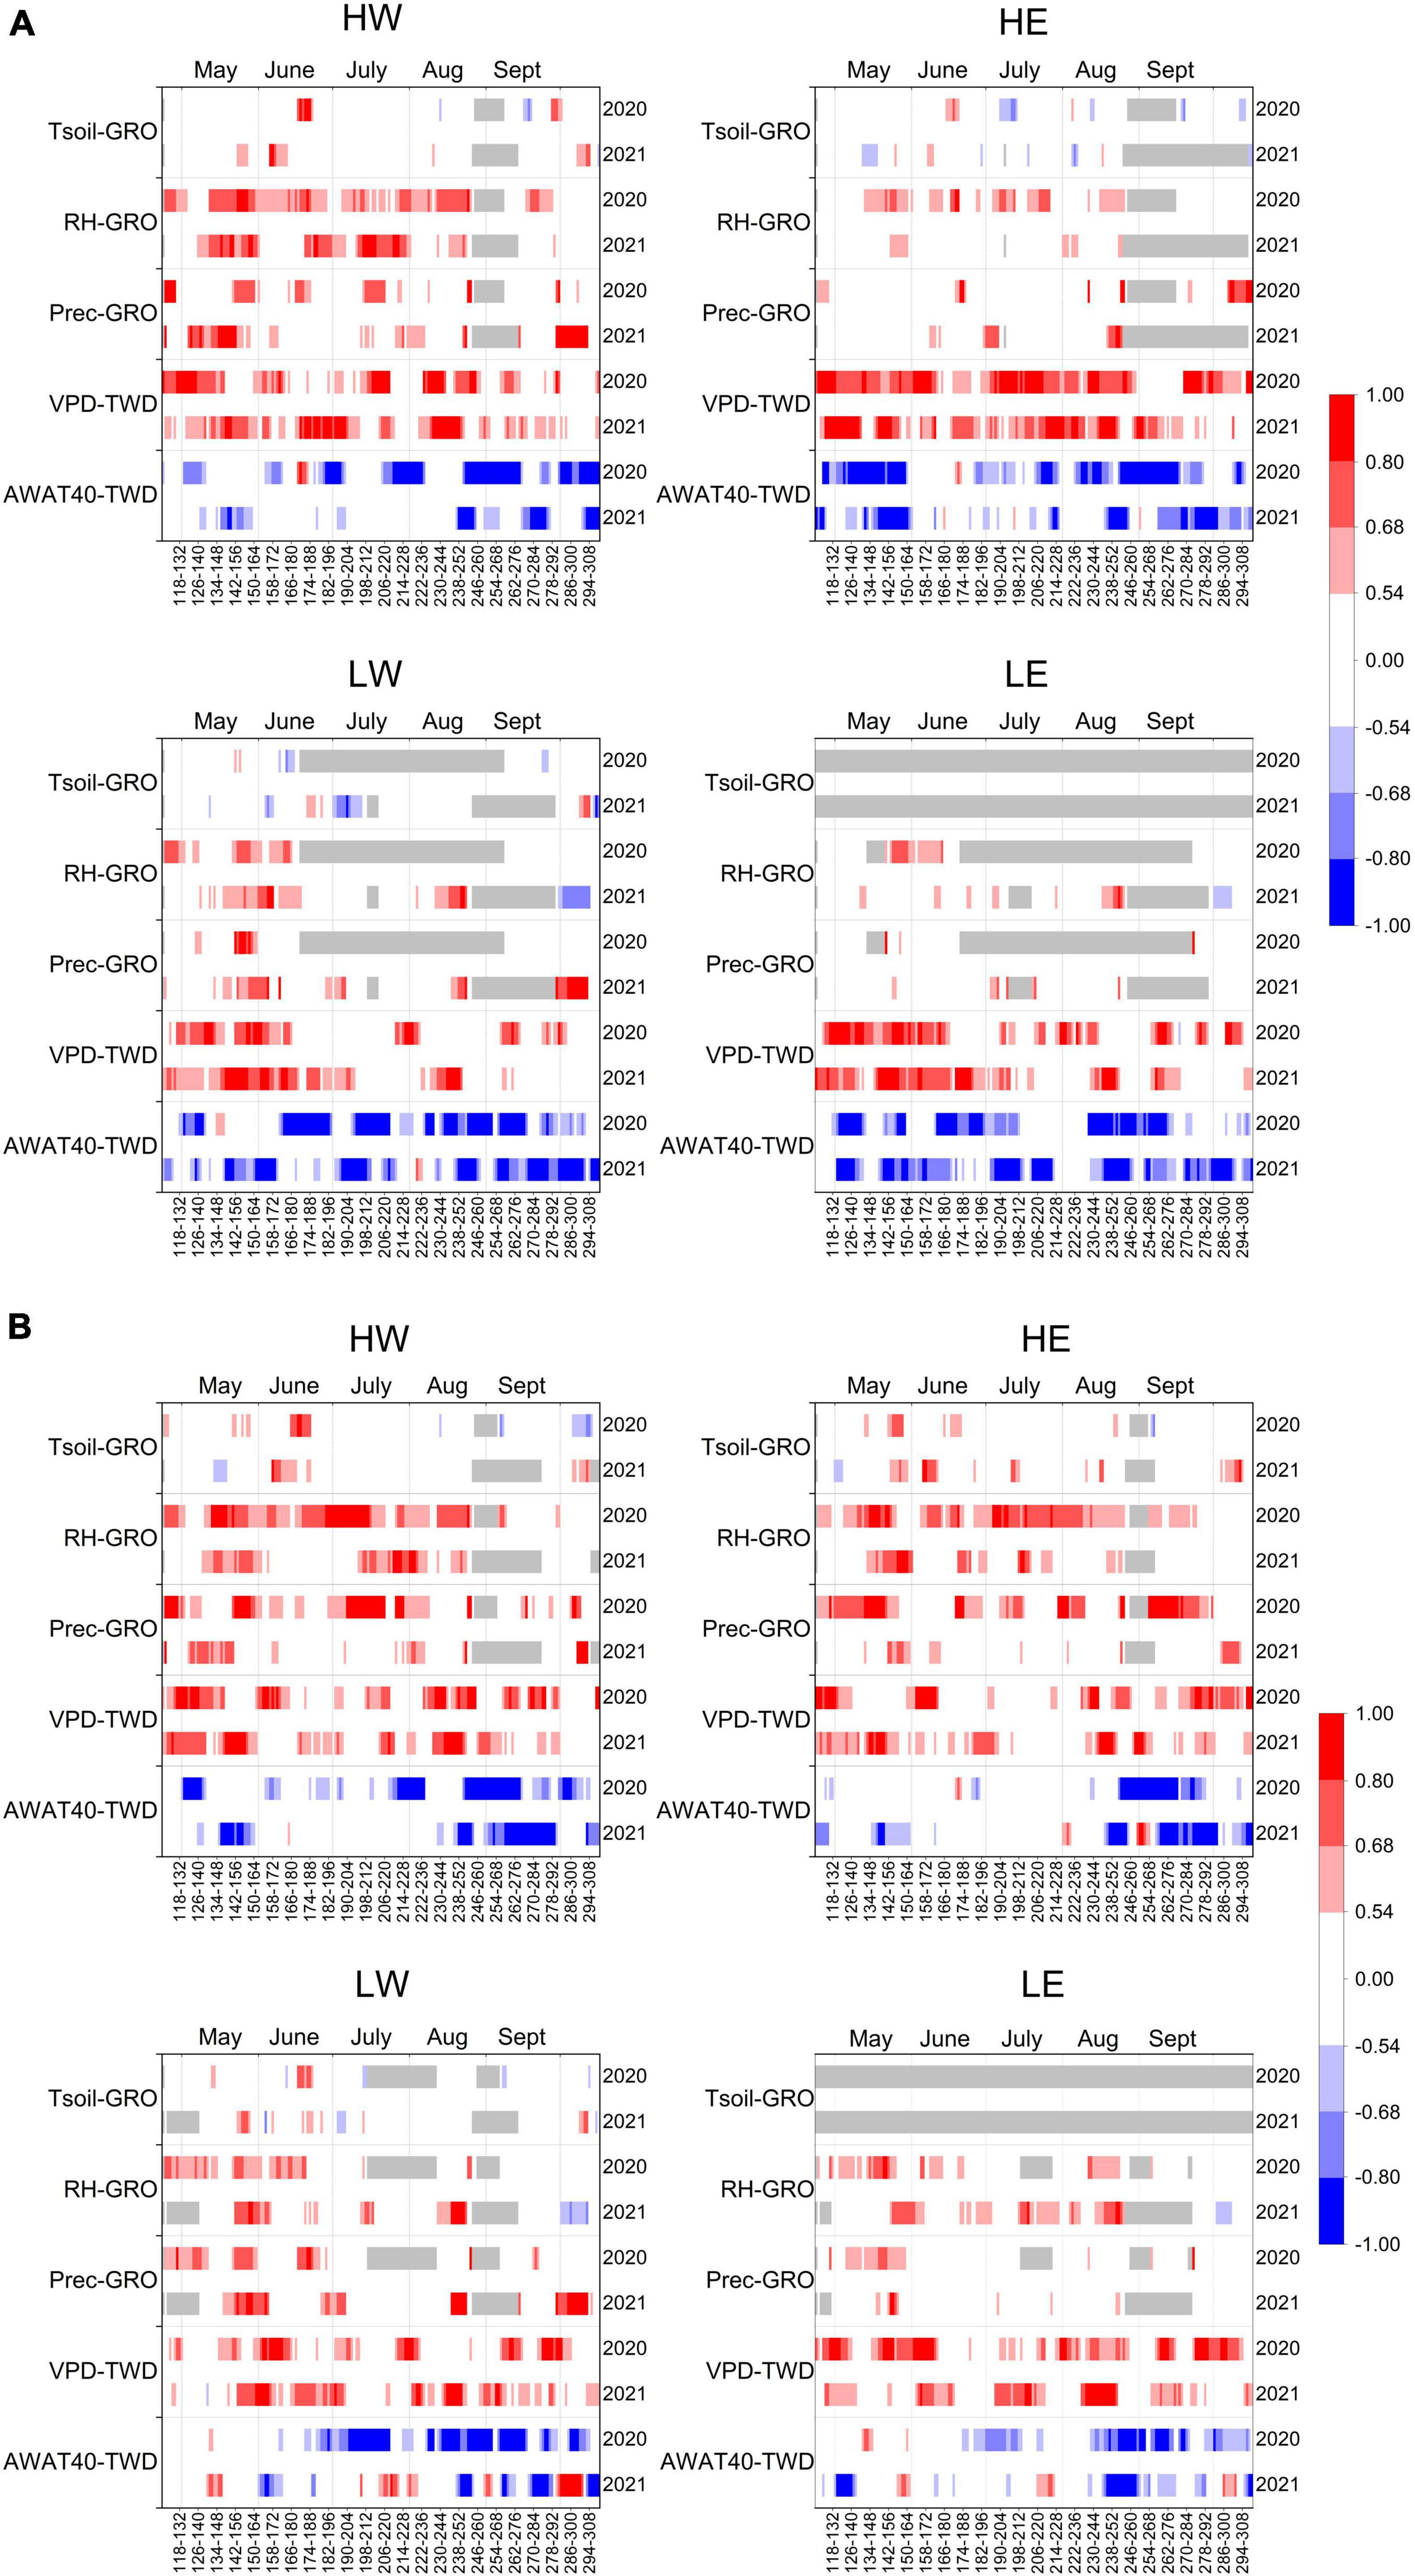
Figure 5. Moving correlations between GRO and soil temperature at 20 cm (Tsoil), relative humidity (RH), and precipitation (Prec), as well as between TWD and vapor pressure deficit (VPD) and available soil water in 40 cm (AWAT40), in the growing season of 2020 and 2021 of (A) conifers (P. abies at high-elevation sites HW and HE, and P. sylvestris at low-elevation sites LW and LE) and (B) European beech (F. sylvatica). Gray bars indicate NA values.
3.4 Climate-TWD response
In the growing season of 2020, correlations between TWD and climate variables were stronger and more frequent than correlations with GRO. TWD correlated positively to vapor pressure deficit (VPD) and negatively to the available soil water (mostly both AWAT and AWAT40), precipitation, and relative humidity (RH) at each study site. Furthermore, daily mean and maximum temperatures showed positive correlations to TWD for all studied tree species, except for spruce at HW. Higher global radiation increased the TWD of both tree species at LE and LW and beech at HE and HW (Figure 4B). In 2021, precipitation and the available soil water also significantly influenced TWD. However, the available water at 40 cm showed higher correlations than the available water in the root zone at most sites. The positive correlation to temperature, such as in 2020, only persisted for pine at LE. Similarly, the correlations to RH, VPD and global radiation in 2021 were mostly lower than in 2020 and occurred only at several sites (Figure 4B). The moving correlations between TWD and VPD showed long periods of significantly positive correlations in both years, although the complete seasonal correlation only revealed significant values for spruce at HW and pine at LW and LE in 2021. Likewise, the moving correlations with available soil water were predominantly negative. Nevertheless, in 2021, the negative correlations between TWD and AWAT40 occasionally shifted for short periods to a positive correlation, especially for beech at low-elevation sites (Figures 5A, B).
4 Discussion
4.1 Comparison of growth patterns
Our results confirmed that all tree species adapted their growth patterns to prevailing weather conditions but with different intensities and manifestations (Martinez del Castillo et al., 2018; Chen et al., 2022). The altered growth responses of each species at every site were clearly visible in the climatically contrasting growing seasons of 2020 and 2021 (Figure 2). Warm temperatures in spring 2020 caused an earlier onset of radial increment and a higher growth rate at the beginning of the season for all studied species. However, dry conditions in early summer 2020 caused an early growth stop and partial growth interruptions at low-elevation sites (Figures 3A, B). The warm temperatures in spring affected cambial activity intensively, which confirms the findings of Rossi et al. (2014), who found that warmer spring temperatures cause earlier cambial resumption. However, the subsequent dry summer with soil water shortage annihilated the positive effects of the warm spring. Although trees have various long- and short-term physiological and morphological strategies to adapt to water shortage, the first response of pine and spruce to a drought period in the current growing year is stomatal closure to avoid xylem cavitation (Martínez-Vilalta et al., 2009; Pretzsch et al., 2014; Choat et al., 2018). In particular, pine at low-elevation sites showed this precautionary response in 2020. As beech reveals a strong dependency on water availability in June–July (Scharnweber et al., 2011), the low precipitation amounts and warm temperatures in 2020 caused growth cessation around July. Accordingly, beech revealed a shorter growing season (significant at HW and LW) and narrower tree-ring widths than in 2021 (significant at HW, LW, and LE). Even beech at high-elevation sites revealed a decrease in growth rates or a cessation of wood formation by the end of July. Since xylem growth in diffuse-porous species occurs later than in conifers and ring-porous species, it often coincides with seasonal maxima in evapotranspiration and water deficit (D’Orangeville et al., 2022). Therefore, the difference between these two consecutive years was more pronounced for beech than for the studied conifers. In conclusion, the formation of new xylem cells ended prematurely in 2020 due to limited water availability. In contrast, at the more humid and cold high-elevation site HE, spruce formed slightly more xylem cells in 2020 because warmer weather conditions implied a prolonged growing season length for conifers (Menzel and Fabian, 1999; Deslauriers et al., 2008; Rossi et al., 2013). In contrast to the warm and dry weather conditions in 2020, the spring of 2021 revealed temperatures in April and May more than 2°C colder than the Climate Normals. Due to these cold temperatures at the beginning of the growing season, the growth rate of the studied tree species was slower than that in 2020 (Figures 3A, B). Nonetheless, most trees built larger tree rings in 2021. Since the average precipitation amount throughout the summer months was higher than that in the Climate Normals at all study sites, the available soil water was scarcely limited, and no water stress occurred (Figure 2). Therefore, a longer growing season length accompanied by the continuous formation of new xylem cells resulted in significantly larger tree rings according to the dendrometer measurements, except for spruce at HE and pine at LE (Peters et al., 2021). Indeed, pine at LE showed similar tree ring widths in 2020 and 2021, although water availability in 2021 was better than that in 2020 (Figure 2). One reason might be that a dry growing season, as in 2020, also has a higher impact on the radial growth of pine in the following year at this site, as found by Debel et al. (2021). Rossi et al. (2016) assumed that the mean annual temperature determines radial growth in conifers at cool-temperate sites; hence, higher temperatures induce a longer growing season. However, our results show that the mean annual temperature only results in a prolonged growth period if the soil water availability is sufficient in summer. This is confirmed by findings of Peters et al. (2021), who related a decreased growth rate to turgor limitation in warmer and drier summers. For instance, spruce at HE benefitted from warmer annual temperatures in 2020 because no water deficit occurred at this site. Accordingly, all other sites showed larger tree rings in 2021 (significant for beech at each site, spruce at HW, and pine at LW) due to a higher number of days with actual growth (significant for beech at HW, LW and pine at LW). These findings support the conclusions by Michelot et al. (2012), who found that tree ring widths were influenced by the number of growth days rather than by the growth rate.
4.2 GRO and TWD response to climate
Correlations between climate variables and growth-induced irreversible stem expansion (GRO) revealed that relative humidity had the main positive influence on radial growth, whereas global radiation and vapor pressure deficit minimized the growth of all species at almost each site. The significantly high negative correlations between tree radial growth (GRO) and temperatures of the hot year 2020 underline the adverse effects of increasing temperatures on tree growth. The hot summer of 2020 was detrimental to tree growth even at the studied high-elevation sites. Heat does not only provoke rising evapotranspiration and vapor pressure deficits (Grossiord et al., 2020; Gazol and Camarero, 2022; Haberstroh et al., 2022) but also can directly harm several tree species, e.g., Norway spruce (Kunert, 2020). Hence, vitality loss and mortality of the studied tree species are likely to increase in the future since increased drought and heat periods are predicted for the study region (Spathelf et al., 2014; Sedlmeier et al., 2018; Hammond et al., 2022). On the contrary, pine at LE revealed positive correlations to minimum, mean, and maximum temperatures in 2020. A reason might be that pine’s actual growth time (days with GRO > 0) was very short within the 2020 growing season, with the highest growth rates between early May and mid-June. Thus, temperature, besides the photoperiod, was a dominant environmental driver for wood formation (Huang et al., 2020). Furthermore, as practically no GRO happened during the summer months, correlating GRO to temperature was impossible. Regarding (soil) temperature, Spearman’s and Pearson’s correlations showed divergent results. While no significant correlation occurred between GRO and soil temperature according to Spearman’s method, Pearson’s correlations revealed a positive correlation, especially in 2021 (S3A). Since the soil temperature influences growth onset (Jochner et al., 2018; Huang et al., 2020; Leeper et al., 2021) and spring temperatures in 2021 were comparatively low (Figure 2), warmer soil temperatures positively affected tree growth. The tree water deficit (TWD) correlated positively with vapor pressure deficit (VPD) and global radiation and negatively with relative humidity (RH) and precipitation at all sites. Hereby, the correlation coefficients were mostly higher in 2020 than in 2021 (Figure 4B). According to Zweifel et al. (2016), VPD and soil water potential mainly explain the TWD. Due to the delayed stem response, however, the TWD reacts with a time lag on changing VPD. Since a high VPD aggravates the refilling of stem cells, the turgidity also decreases, and the threshold of turgor pressure for cell division and enlargement cannot be reached (Steppe et al., 2006; Knüsel et al., 2021; Peters et al., 2021). Consequently, no stem expansion occurred. In addition, TWD of each studied tree species was positively correlated with temperature in 2020. Higher temperatures induce stronger evapotranspiration and thus higher water deficits in soils and plants (Choat et al., 2018; Gharun et al., 2020). Due to higher precipitation amounts and lower temperatures in spring 2021, only pine at LE showed positive correlations with TWD in 2021. Precipitation and the available soil water negatively influenced TWD at all sites and in both study years. However, higher correlation coefficients occurred in the drier year 2020. These results confirm that the soil water, especially in deeper layers, was sufficient for tree growth in 2021 (Figure 4B). Moving correlations with a 14-day window and a 1-day offset provided more detailed insights into short-term tree responses than seasonal correlations. Although the moving correlations predominantly confirmed the seasonal correlations to the various climate variables (Figures 5A, B), the high-resolution approach exposed time windows in which the correlations with climate variables were specifically high or showed no or opposite relations. Hence, climate conditions can affect tree growth differently, depending on timing during the season (Deslauriers and Morin, 2005). However, the high-resolution (2 weeks) observation of the influence of climate variables on GRO and TWD could be too short for specific climate variables (e.g., soil temperature and available soil water). Consequently, the response of trees might not immediately reflect weather changes but rather react with a temporal offset and to longer-lasting weather tendencies. Therefore, a lower resolution of up to 4 weeks might be favorable for variables related to a delayed tree response.
4.3 Comparison of methods
Both growth phenology and kinetics differed between the two methods applied, e.g., beech at HW (Figure 3B). Since different growth parameters (diameter variations and xylem cell formation) were observed, sometimes significantly diverging results for critical dates emerged, e.g., HW, 2020 (Table 2b). Discrepancies between the two approaches was also observed in other studies (e.g., Mäkinen et al., 2008; Cocozza et al., 2016; Stangler et al., 2021). However, in this study, the total annual radial increment differed even at 37% of tree means between the two methods. Nevertheless, each method has advantages and disadvantages, but both applied techniques convince with a high temporal resolution of growth observations. However, depending on the frequency of sample collection, xylogenesis has a resolution of 1 or 2 weeks, while dendrometer measurements of wood formation can even display the intra-annual growth of trees with a precision of several minutes (Michelot et al., 2012; Poljanšek et al., 2019).
Band dendrometer data integrate stem size variations over the complete stem circumference, while microcores can only illustrate cell formation, particularly at the part of the stem where the core was punched. As a result, significant variations in cell production and growth processes can occur during xylogenesis due to non-circular and irregular growth around the tree stem. Furthermore, standardization with the previous ring may cause discrepancies due to its differing cell numbers. Indeed, the modeling of xylogenesis with the Gompertz function can reliably illustrate the accumulative wood formation during one growing season, especially in temperate climates (Rossi et al., 2003; Rathgeber et al., 2018), but the calculation is sometimes inaccurate due to NA values or non-circular growth. Hence, intra-annual growth dynamics cannot be resolved accurately (Cuny et al., 2013; Häusser et al., 2023). Moreover, Gompertz models are not capable of plotting growth interruptions at all. Fitting GAMs (Generalized Additive Models) to the xylogenesis data revealed similar inaccuracies compared to the Gompertz models. Although more flexible GAMs are suitable for displaying growth variations very well, these models still insufficiently reflect intra-annual growth dynamics compared to dendrometer data. Furthermore, the accuracy of the models depends on the raw anatomical data (EWMZ-width). Since the widths of the forming rings significantly varied according to the sampled dates for several trees and did not reflect steady growth, GAMs partly plotted even more inadequate growth patterns than Gompertz models. In the same way, GAMs generated different final tree-ring widths than those measured with dendrometers. Nevertheless, growth models are very convenient for comparing species and sites since growth progression is immediately recognizable at first glance. In addition, with the Gompertz model, key biological parameters are easily and consistently calculated (Cuny et al., 2013).
Additionally, band dendrometers measure complete circular stem growth but include shrinking, swelling, and other structural processes of tree tissue, e.g., contraction and expansion of dead conducting xylem elements and phloem and thermal expansion and contraction of the stem (Daudet et al., 2005; Deslauriers et al., 2007). There are several R packages helping to clean raw dendrometer data to obtain radial growth only (van der Maaten et al., 2016; Aryal et al., 2020; Knüsel et al., 2021). Nevertheless, non-growth-related processes cannot be completely excluded from dendrometer data (Knüsel et al., 2021). For instance, the growth cessation of European beech at LW and LE, measured with dendrometer data, lagged xylogenesis measurements by several weeks. Xylem and phloem swelling instead of irreversible growth might have caused the radial increment. In contrast, xylem cells may even form, although the stem circumference shrinks (Cruz-García et al., 2019). However, dendrometer data provide a general overview of radial growth during the growing season.
Hence, defining growth onset and cessation on the anatomical level showed more reliable values. In particular, swelling and water storage processes could have induced the radial increase in part, which the applied R package could not discard (Knüsel et al., 2021). Likewise, average and maximum growth rates calculated with the Gompertz function were more accurate since the growing periods, defined between 5 and 95% of the final tree ring, were solely oriented to cellular processes. At the same time, the intra-annual course of GRO best reflected individual growth patterns. The high resolution allowed observation of growth processes from day to day (or even shorter), displaying each short-term environmental influence. Therefore, climate correlations with dendrometer data are more suitable for climate correlations because the circumference changes are available at daily resolution or even at sub-daily resolution (e.g., 30 min), while the widths of newly formed xylem cells were only available at biweekly resolution. Especially for the calculation of moving correlations, data at a daily resolution are a prerequisite. Therefore, climate correlations of data calculated with the Gompertz model or GAM provided less precise results, especially for moving correlations, since the models consist of calculated values independent of daily environmental influences.
5 Conclusion
The year 2020 was the third year in a sequence of dry and hot summers in North Bavaria (Boeing et al., 2022; Thonfeld et al., 2022). As an adaptation to water limitation in summer, all tree species showed a premature growth stop or a reduced growth rate in summer. Consequently, tree rings built in 2020 were predominantly smaller than those built in 2021, even though spring temperatures in 2021 were low and caused low growth rates at the beginning of the vegetation period. These results suggest that the number of growth days, meaning the number of days with actual growth, favors total annual radial growth more than the growth rate. Both seasonal and moving climate correlations significantly reflected the influence of climatic conditions on trees, e.g., the available soil water and the vapor pressure deficit in 2020 with tree water deficit (TWD) and the relative humidity in 2020 and 2021 with irreversible radial growth (GRO). Transferring these findings to potential tree responses under future climate conditions (Kosanic et al., 2019), especially under the expected increasing frequency of drought during growing seasons such as 2020, all studied tree species will show lower growth performance. In particular, European beech and Scots pine at low-elevation sites revealed the lowest radial growth in the dry and warm growing seasons, implying that climate change will lead to a lower carbon sink capacity of these tree species. Therefore, we accept our research hypothesis 1. Dendrometer measurements and microcore analysis showed partly significant differences for tree-growth processes, even in the general intra-annual growth course and the final tree-ring width. Hence, we mainly agree with our hypothesis 2 but reject the assumption of similar growth patterns. Both methods showed specific uncertainties and limitations, so combining both is required to achieve a more robust analysis of the intra-annual wood formation. Xylogenesis provides insight into cambial activity on an anatomical level and defines the exact onset and cessation of wood formation processes. Thus, xylogenesis can help to calibrate stem circumference changes measured with dendrometers and to disentangle radial growth from other stem physiological contraction-expansion processes. On the opposite, dendrometer measurements involve the radial growth of the entire stem and not only of a spatially limited stem section. Therefore, our findings confirm that the synthesis of both methods is suitable for analyzing climate-growth relationships.
Data availability statement
The raw data supporting the conclusions of this article will be made available by the authors, without undue reservation.
Author contributions
AD: Conceptualization, Methodology, Visualization, Writing – original draft, Writing – review and editing. ZF: Resources, Writing – review and editing. MH: Resources, Writing – review and editing. SR: Resources, Writing – review and editing. AB: Conceptualization, Project administration, Supervision, Writing – review and editing.
Funding
The author(s) declare financial support was received for the research, authorship, and/or publication of this article. This research was funded by the Bavarian State Ministry of Science and Arts, as part of the Bavarian Climate Research Network (bayklif), project “Talking Trees: Schnittstelle von Klimadynamik, Dendroökologie und Bildung für nachhaltige Entwicklung.”
Acknowledgments
We would like to thank the Bavarian State Forestry, the Bavarian State Institute for Forestry, and the Departments for Food, Agriculture and Forestry Bavaria. Furthermore, we want to thank all persons who regularly collected the microcore wood samples in the field.
Conflict of interest
The authors declare that the research was conducted in the absence of any commercial or financial relationships that could be construed as a potential conflict of interest.
Publisher’s note
All claims expressed in this article are solely those of the authors and do not necessarily represent those of their affiliated organizations, or those of the publisher, the editors and the reviewers. Any product that may be evaluated in this article, or claim that may be made by its manufacturer, is not guaranteed or endorsed by the publisher.
Supplementary material
The Supplementary Material for this article can be found online at: https://www.frontiersin.org/articles/10.3389/ffgc.2024.1342413/full#supplementary-material
References
Aryal, S., Häusser, M., Grießinger, J., Fan, Z., and Bräuning, A. (2020). “dendRoAnalyst”: A tool for processing and analysing dendrometer data. Dendrochronologia 64:125772. doi: 10.1016/j.dendro.2020.125772
Begum, S., Nakaba, S., Yamagishi, Y., Oribe, Y., and Funada, R. (2013). Regulation of cambial activity in relation to environmental conditions: Understanding the role of temperature in wood formation of trees. Physiol. Plant. 147, 46–54. doi: 10.1111/j.1399-3054.2012.01663.x
Boeing, F., Rakovec, O., Kumar, R., Samaniego, L., Schrön, M., Hildebrandt, A., et al. (2022). High-resolution drought simulations and comparison to soil moisture observations in Germany. Hydrol. Earth Syst. Sci. 26, 5137–5161. doi: 10.5194/hess-26-5137-2022
Bräuning, A., de Ridder, M., Zafirov, N., García-González, I., Petrov Dimitrov, D., and Gärtner, H. (2016). Tree-ring features: Indicators of extreme event impacts. IAWA J. 37, 206–231. doi: 10.1163/22941932-20160131
Cartenì, F., Deslauriers, A., Rossi, S., Morin, H., De Micco, V., Mazzoleni, S., et al. (2018). The Physiological Mechanisms behind the earlywood-to-latewood transition: A process-based modeling approach. Front. Plant Sci. 9:1053. doi: 10.3389/fpls.2018.01053
Chen, Y., Rademacher, T., Fonti, P., Eckes-Shephard, A. H., LeMoine, J. M., Fonti, M. V., et al. (2022). Inter-annual and inter-species tree growth explained by phenology of xylogenesis. N. Phytol. 235, 939–952. doi: 10.1111/nph.18195
Choat, B., Brodribb, T. J., Brodersen, C. R., Duursma, R. A., López, R., and Medlyn, B. E. (2018). Triggers of tree mortality under drought. Nature 558, 531–539. doi: 10.1038/s41586-018-0240-x
Cocozza, C., Palombo, C., Tognetti, R., La Porta, N., Anichini, M., Giovannelli, A., et al. (2016). Monitoring intra-annual dynamics of wood formation with microcores and dendrometers in Picea abies at two different altitudes. Tree Physiol. 36, 832–846. doi: 10.1093/treephys/tpw009
Cruz-García, R., Balzano, A., Čufar, K., Scharnweber, T., Smiljanić, M., and Wilmking, M. (2019). Combining dendrometer series and xylogenesis imagery—DevX, a simple visualization tool to explore plant secondary growth phenology. Front. For. Glob. Chang. 2:220. doi: 10.3389/ffgc.2019.00060
Čufar, K., Prislan, P., de Luis, M., and Gričar, J., (2008a). Tree-ring variation, wood formation and phenology of beech (Fagus sylvatica) from a representative site in Slovenia, SE Central Europe. Trees 22, 749–758. doi: 10.1007/s00468-008-0235-6
Čufar, K., Prislan, P., and Gričar, J. (2008b). Cambial activity and wood formation in beech (Fagus sylvatica) during the 2006 growth season. Wood Res. 53, 1–11.
Cuny, H. E., Fonti, P., Rathgeber, C. B. K., von Arx, G., Peters, R. L., and Frank, D. C. (2019). Couplings in cell differentiation kinetics mitigate air temperature influence on conifer wood anatomy. Plant Cell Environ. 42, 1222–1232. doi: 10.1111/pce.13464
Cuny, H. E., Rathgeber, C. B. K., Frank, D., Fonti, P., Mäkinen, H., Prislan, P., et al. (2015). Woody biomass production lags stem-girth increase by over one month in coniferous forests. Nat. Plants 1:15160. doi: 10.1038/nplants.2015.160
Cuny, H. E., Rathgeber, C. B. K., Kiessé, T. S., Hartmann, F. P., Barbeito, I., and Fournier, M. (2013). Generalized additive models reveal the intrinsic complexity of wood formation dynamics. J. Exp. Bot. 64, 1983–1994. doi: 10.1093/jxb/ert057
Daudet, F.-A., Améglio, T., Cochard, H., Archilla, O., and Lacointe, A. (2005). Experimental analysis of the role of water and carbon in tree stem diameter variations. J. Exp. Bot. 56, 135–144. doi: 10.1093/jxb/eri026
De Micco, V., Carrer, M., Rathgeber, C. B. K., Julio Camarero, J., Voltas, J., Cherubini, P., et al. (2019). From xylogenesis to tree rings: Wood traits to investigate tree response to environmental changes. IAWA J. 40, 155–182. doi: 10.1163/22941932-40190246
De Micco, V., de, Campelo, F., de Luis, M., Bräuning, A., Grabner, M., et al. (2016). Intra-annual density fluctuations in tree rings: How, when, where, and why? IAWA J. 37, 232–259. doi: 10.1163/22941932-20160132
De Swaef, T., De Schepper, V., Vandegehuchte, M. W., and Steppe, K. (2015). Stem diameter variations as a versatile research tool in ecophysiology. Tree Physiol. 35, 1047–1061. doi: 10.1093/treephys/tpv080
Debel, A., Meier, W. J.-H., and Bräuning, A. (2021). Climate signals for growth variations of F. sylvatica, P. abies, and P. sylvestris in Southeast Germany over the past 50 years. Forests 12:1433. doi: 10.3390/f12111433
Deslauriers, A., and Morin, H. (2005). Intra-annual tracheid production in balsam fir stems and the effect of meteorological variables. Trees 19, 402–408. doi: 10.1007/s00468-004-0398-8
Deslauriers, A., Morin, H., Urbinati, C., and Carrer, M. (2003). Daily weather response of balsam fir (Abies balsamea (L.) Mill.) stem radius increment from dendrometer analysis in the boreal forests of Qubec (Canada). Trees 17, 477–484. doi: 10.1007/s00468-003-0260-4
Deslauriers, A., Rossi, S., and Anfodillo, T. (2007). Dendrometer and intra-annual tree growth: What kind of information can be inferred? Dendrochronologia 25, 113–124. doi: 10.1016/j.dendro.2007.05.003
Deslauriers, A., Rossi, S., Anfodillo, T., and Saracino, A. (2008). Cambial phenology, wood formation and temperature thresholds in two contrasting years at high altitude in southern Italy. Tree Physiol. 28, 863–871. doi: 10.1093/treephys/28.6.863
D’Orangeville, L., Itter, M., Kneeshaw, D., Munger, J. W., Richardson, A. D., Dyer, J. M., et al. (2022). Peak radial growth of diffuse-porous species occurs during periods of lower water availability than for ring-porous and coniferous trees. Tree Physiol. 42, 304–316. doi: 10.1093/treephys/tpab101
Drew, D. M., and Downes, G. M. (2009). The use of precision dendrometers in research on daily stem size and wood property variation: A review. Dendrochronologia 27, 159–172. doi: 10.1016/j.dendro.2009.06.008
DWD Climate Data Center (2020). Station observations for Germany, version v19.3. Available online at: https://cdc.dwd.de/portal/ (accessed January 31, 2023).
Federer, C. A. (2021). BROOK90: A simulation model for evaporation, soil water, and streamflow. Available online at: http://www.ecoshift.net/brook/brook90.htm (accessed March 14, 2023).
Federer, C. A., Vörösmarty, C., and Fekete, B. (2003). Sensitivity of annual evaporation to soil and root properties in two models of contrasting complexity. J. Hydrometeorol. 4, 1276–1290. doi: 10.1175/1525-75412003004<1276:SOAETS<2.0.CO;2
Gazol, A., and Camarero, J. J. (2022). Compound climate events increase tree drought mortality across European forests. Sci. Total Environ. 816:151604. doi: 10.1016/j.scitotenv.2021.151604
Gharun, M., Hörtnagl, L., Paul-Limoges, E., Ghiasi, S., Feigenwinter, I., Burri, S., et al. (2020). Physiological response of Swiss ecosystems to 2018 drought across plant types and elevation. Philos. Trans. R. Soc. B 375:2019052. doi: 10.1098/rstb.2019.0521
Gričar, J., Zupančič, M., Čufar, K., Koch, G., Schmitt, U., and Oven, P. (2006). Effect of local heating and cooling on cambial activity and cell differentiation in the stem of Norway spruce (Picea abies). Ann. Bot. 97, 943–951. doi: 10.1093/aob/mcl050
Grossiord, C., Buckley, T. N., Cernusak, L. A., Novick, K. A., Poulter, B., Siegwolf, R. T. W., et al. (2020). Plant responses to rising vapor pressure deficit. N. Phytol. 226, 1550–1566. doi: 10.1111/nph.16485
Haberstroh, S., Werner, C., Grün, M., Kreuzwieser, J., Seifert, T., Schindler, D., et al. (2022). Central European 2018 hot drought shifts scots pine forest to its tipping point. Plant Biol. 24, 1186–1197. doi: 10.1111/plb.13455
Hammel, K., and Kennel, M. (2001). Charakterisierung und analyse der wasserverfügbarkeit und des wasserhaushalts von waldstandorten in bayern mit dem simulationsmodell BROOK90. München: Frank, 135.
Hammond, W. M., Williams, A. P., Abatzoglou, J. T., Adams, H. D., Klein, T., López, R., et al. (2022). Global field observations of tree die-off reveal hotter-drought fingerprint for earth’s forests. Nat. Commun. 13, 1–11. doi: 10.1038/s41467-022-29289-2
Hartmann, H., and Trumbore, S. (2016). Understanding the roles of nonstructural carbohydrates in forest trees – from what we can measure to what we want to know. N. Phytol. 211, 386–403. doi: 10.1111/nph.13955
Häusser, M., Aryal, S., Barth, J. A. C., Bendix, J., Garel, E., van Geldern, R., et al. (2023). Xylem formation patterns from Mediterranean to subalpine climate conditions reveal high growth plasticity of pine species on Corsica. Trees 37, 1027–1039. doi: 10.1007/s00468-023-02402-8
Häusser, M., Szymczak, S., Knerr, I., Bendix, J., Garel, E., Huneau, F., et al. (2021). The dry and the wet case: Tree growth response in climatologically contrasting years on the island of Corsica. Forests 12:1175. doi: 10.3390/f12091175
Huang, J.-G., Ma, Q., Rossi, S., Biondi, F., Deslauriers, A., Fonti, P., et al. (2020). Photoperiod and temperature as dominant environmental drivers triggering secondary growth resumption in Northern Hemisphere conifers. Proc. Natl. Acad. Sci. U.S.A. 117, 20645–20652. doi: 10.1073/pnas.2007058117
Jevšenak, J., Tychkov, I., Gričar, J., Levanič, T., Tumajer, J., Prislan, P., et al. (2021). Growth-limiting factors and climate response variability in Norway spruce (Picea abies L.) along an elevation and precipitation gradients in Slovenia. Int. J. Biometeorol. 65, 311–324. doi: 10.1007/s00484-020-02033-5
Jochner, M., Bugmann, H., Nötzli, M., and Bigler, C. (2018). Tree growth responses to changing temperatures across space and time: A fine-scale analysis at the treeline in the Swiss Alps. Trees 32, 645–660. doi: 10.1007/s00468-017-1648-x
Knüsel, S., Peters, R. L., Haeni, M., Wilhelm, M., and Zweifel, R. (2021). Processing and extraction of seasonal tree physiological parameters from stem radius time series. Forests 12:765. doi: 10.3390/f12060765
Kosanic, A., Kavcic, I., van Kleunen, M., and Harrison, S. (2019). Climate change and climate change velocity analysis across Germany. Sci. Rep. 9:2196. doi: 10.1038/s41598-019-38720-6
Kunert, N. (2020). Preliminary indications for diverging heat and drought sensitivities in Norway spruce and scots pine in central Europe. iForest Biogeosci. For. 13:89. doi: 10.3832/ifor3216-012
Leeper, R. D., Matthews, J. L., Cesarini, M. S., and Bell, J. E. (2021). Evaluation of air and soil temperatures for determining the onset of growing season. J. Geogr. Res. Biogeosci. 126:156. doi: 10.1029/2020JG006171
Mäkinen, H., Seo, J.-W., Nöjd, P., Schmitt, U., and Jalkanen, R. (2008). Seasonal dynamics of wood formation: A comparison between pinning, microcoring and dendrometer measurements. Eur. J. For. Res. 127, 235–245. doi: 10.1007/s10342-007-0199-x
Makowski, D., Ben-Shachar, M., Patil, I., and Lüdecke, D. (2020). Methods and algorithms for correlation analysis in R. J. Open Source Softw. 5:2306. doi: 10.21105/joss.02306
Marchand, L. J., Dox, I., Gričar, J., Prislan, P., van den Bulcke, J., Fonti, P., et al. (2021). Timing of spring xylogenesis in temperate deciduous tree species relates to tree growth characteristics and previous autumn phenology. Tree Physiol. 41, 1161–1170. doi: 10.1093/treephys/tpaa171
Martinez del Castillo, E., Prislan, P., Gričar, J., Gryc, V., Merela, M., Giagli, K., et al. (2018). Challenges for growth of beech and co-occurring conifers in a changing climate context. Dendrochronologia 52, 1–10. doi: 10.1016/j.dendro.2018.09.001
Martínez-Sancho, E., Gutiérrez, E., Valeriano, C., Ribas, M., Popkova, M. I., Shishov, V. V., et al. (2021). Intra– and inter-annual growth patterns of a mixed pine-oak forest under mediterranean climate. Forests 12:1746. doi: 10.3390/f12121746
Martínez-Vilalta, J., Cochard, H., Mencuccini, M., Sterck, F., Herrero, A., Korhonen, J. F. J., et al. (2009). Hydraulic adjustment of Scots pine across Europe. N. Phytol. 184, 353–364. doi: 10.1111/j.1469-8137.2009.02954.x
Mencuccini, M., Salmon, Y., Mitchel, P., Hölttä, T., Choat, B., Meir, P., et al. (2017). An empirical method that separates irreversible stem radial growth from bark water content changes in trees: Theory and case studies. Plant Cell Environ. 40, 290–303. doi: 10.1111/pce.12863
Menzel, A., and Fabian, P. (1999). Growing season extended in Europe. Nature 397:659. doi: 10.1038/17709
Michelot, A., Simard, S., Rathgeber, C., Dufrêne, E., and Damesin, C. (2012). Comparing the intra-annual wood formation of three European species (Fagus sylvatica, Quercus petraea and Pinus sylvestris) as related to leaf phenology and non-structural carbohydrate dynamics. Tree Physiol. 32, 1033–1045. doi: 10.1093/treephys/tps052
Ortega, J. K. E. (2017). Dimensionless number is central to stress relaxation and expansive growth of the cell wall. Sci. Rep. 7:3016. doi: 10.1038/s41598-017-03002-6
Peters, R. L., Steppe, K., Cuny, H. E., de Pauw, D. J. W., Frank, D. C., Schaub, M., et al. (2021). Turgor – a limiting factor for radial growth in mature conifers along an elevational gradient. N. Phytol. 229, 213–229. doi: 10.1111/nph.16872
Poljanšek, S., Jevšenak, J., Gričar, J., and Levanič, T. (2019). Seasonal radial growth of black pine (Pinus nigra Arnold) from Bosnia and Herzegovina, monitored by the pinning method and manual band dendrometers. Acta Silvae Ligni 119, 1–11. doi: 10.20315/ASetL.119.1
Pretzsch, H., Rötzer, T., Matyssek, R., Grams, T. E. E., Häberle, K.-H., Pritsch, K., et al. (2014). Mixed Norway spruce (Picea abies [L.] Karst) and European beech (Fagus sylvatica [L.]) stands under drought: From reaction pattern to mechanism. Trees 28, 1305–1321. doi: 10.1007/s00468-014-1035-9
Prislan, P., Del Castillo, E. M., Skoberne, G., Špenko, N., and Gričar, J. (2022). Sample preparation protocol for wood and phloem formation analyses. Dendrochronologia 73:125959. doi: 10.1016/j.dendro.2022.125959
Quinn, G. P., and Keough, M. (2002). Experimental design and data analysis for biologists. Cambridge: Cambridge University Press.
Rathgeber, C. B. K., Cuny, H. E., and Fonti, P. (2016). Biological basis of tree-ring formation: A crash course. Front. Plant Sci. 7:734. doi: 10.3389/fpls.2016.00734
Rathgeber, C. B. K., Longuetaud, F., Mothe, F., Cuny, H., and Le Moguédec, G. (2011). Phenology of wood formation: Data processing, analysis and visualisation using R (package CAVIAR). Dendrochronologia 29, 139–149. doi: 10.1016/j.dendro.2011.01.004
Rathgeber, C. B. K., Santenoise, P., and Cuny, H. E. (2018). CAVIAR: An R package for checking, displaying and processing wood-formation-monitoring data. Tree Physiol. 38, 1246–1260. doi: 10.1093/treephys/tpy054
Rossi, S., Anfodillo, T., and Menardi, R. (2006a). Trephor: A new tool for sampling microcores from tree stems. IAWA J. 2006, 89–98. doi: 10.1163/22941932-90000139
Rossi, S., Deslauriers, A., Anfodillo, T., Morin, H., Saracino, A., Motta, R., et al. (2006b). Conifers in cold environments synchronize maximum growth rate of tree-ring formation with day length. N. Phytol. 170, 301–310. doi: 10.1111/j.1469-8137.2006.01660.x
Rossi, S., Anfodillo, T., Cufar, K., Cuny, H. E., Deslauriers, A., Fonti, P., et al. (2013). A meta-analysis of cambium phenology and growth: Linear and non-linear patterns in conifers of the northern hemisphere. Ann. Bot. 112, 1911–1920. doi: 10.1093/aob/mct243
Rossi, S., Anfodillo, T., Čufar, K., Cuny, H. E., Deslauriers, A., Fonti, P., et al. (2016). Pattern of xylem phenology in conifers of cold ecosystems at the Northern Hemisphere. Glob. Chang. Biol. 22, 3804–3813. doi: 10.1111/gcb.13317
Rossi, S., Deslauriers, A., and Morin, H. (2003). Application of the gompertz equation for the study of xylem cell development. Dendrochronologia 21, 33–39. doi: 10.1078/1125-7865-00034
Rossi, S., Deslauriers, A., Griçar, J., Seo, J.-W., Rathgeber, C., Anfodillo, T., et al. (2008). Critical temperatures for xylogenesis in conifers of cold climates. Glob. Ecol. Biogeogr. 17, 696–707. doi: 10.1111/j.1466-8238.2008.00417.x
Rossi, S., Girard, M.-J., and Morin, H. (2014). Lengthening of the duration of xylogenesis engenders disproportionate increases in xylem production. Glob. Chang. Biol. 20, 2261–2271. doi: 10.1111/gcb.12470
Scharnweber, T., Manthey, M., Criegee, C., Bauwe, A., Schröder, C., and Wilmking, M. (2011). Drought matters – declining precipitation influences growth of Fagus sylvatica L. and Quercus robur L. in north-eastern Germany. For. Ecol. Manag. 262, 947–961. doi: 10.1016/j.foreco.2011.05.026
Schmidt-Walter, P., Ahrends, B., Mette, T., Puhlmann, H., and Meesenburg, H. (2019). NFIWADS: The water budget, soil moisture, and drought stress indicator database for the German national forest inventory (NFI). Ann. For. Sci. 76:39. doi: 10.1007/s13595-019-0822-2
Sedlmeier, K., Feldmann, H., and Schädler, G. (2018). Compound summer temperature and precipitation extremes over central Europe. Theor. Appl. Climatol. 131, 1493–1501. doi: 10.1007/s00704-017-2061-5
Spathelf, P., van der Maaten, E., van der Maaten-Theunissen, M., Campioli, M., and Dobrowolska, D. (2014). Climate change impacts in European forests: The expert views of local observers. Ann. For. Sci. 71, 131–137. doi: 10.1007/s13595-013-0280-1
Stangler, D. F., Kahle, H.-P., Raden, M., Larysch, E., Seifert, T., and Spiecker, H. (2021). Effects of intra-seasonal drought on kinetics of tracheid differentiation and seasonal growth dynamics of Norway spruce along an elevational gradient. Forests 12:274. doi: 10.3390/f12030274
Steppe, K., De Pauw, D. J. W., Lemeur, R., and Vanrolleghem, P. A. (2006). A mathematical model linking tree sap flow dynamics to daily stem diameter fluctuations and radial stem growth. Tree Physiol. 26, 257–273. doi: 10.1093/treephys/26.3.257
Thonfeld, F., Gessner, U., Holzwarth, S., Kriese, J., da Ponte, E., Huth, J., et al. (2022). A first assessment of canopy cover loss in Germany’s forests after the 2018–2020 drought years. Remote Sens. 14:562. doi: 10.3390/rs14030562
Vaganov, E. A., Anchukaitis, K. J., and Evans, M. N. (2011). “How well understood are the processes that create dendroclimatic records? A mechanistic model of the climatic control on conifer tree-ring growth dynamics,” in Dendroclimatology: Developments in paleoenvrionmental research, Vol. 11, eds M. Hughes, T. Swetnam, and H. Diaz (Dordrecht: Springer), 37–75. doi: 10.1007/978-1-4020-5725-0_3
Vaganov, E. A., Shiyatov, S. G., and Mazepa, V. S. (1996). Dendroclimatological investigations in the Urals-Siberian Sub-Artic. Novosibirsk: Nauka, 204.
van der Maaten, E., Pape, J., van der Maaten-Theunissen, M., Scharnweber, T., Smiljanic, M., Cruz-García, R., et al. (2018). Distinct growth phenology but similar daily stem dynamics in three co-occurring broadleaved tree species. Tree Physiol. 38, 1820–1828. doi: 10.1093/treephys/tpy042
van der Maaten, E., van der Maaten-Theunissen, M., Smiljanić, M., Rossi, S., Simard, S., Wilmking, M., et al. (2016). dendrometeR: Analyzing the pulse of trees in R. Dendrochronologia 40, 12–16. doi: 10.1016/j.dendro.2016.06.001
Zeileis, A., and Grothendieck, G. (2005). zoo: S3 infrastructure for regular and irregular time series. J. Stat. Softw. 6, 1–27. doi: 10.48550/arXiv.math/0505527
Zierl, B. (2001). A water balance model to stimulate drought in forested ecosystems and its application to the entire area in Switzerland. J. Hydrol. 242, 115–136. doi: 10.1016/S0022-1694(00)00387-5
Zweifel, R. (2016). Radial stem variations – a source of tree physiological information not fully exploited yet. Plant Cell Environ. 39, 231–232. doi: 10.1111/pce.12613
Keywords: xylogenesis, dendrometer, intra-annual growth dynamics, Gompertz model, temperate forests
Citation: Debel A, Foroozan Z, Häusser M, Raspe S and Bräuning A (2024) Assessing intra-annual growth dynamics in climatically contrasting years, sites, and tree species using dendrometers and wood anatomical data. Front. For. Glob. Change 7:1342413. doi: 10.3389/ffgc.2024.1342413
Received: 21 November 2023; Accepted: 13 February 2024;
Published: 27 February 2024.
Edited by:
Aldo Rafael Martínez Sifuentes, National Institute of Forestry and Agricultural Research (INIFAP), MexicoReviewed by:
Pavel Janda, Czech University of Life Sciences Prague, CzechiaUlises Manzanilla Quiñones, Michoacana University of San Nicolás de Hidalgo, Mexico
Edwin Amir Briceño Contreras, Higher Technological Institute of Lerdo, Mexico
Copyright © 2024 Debel, Foroozan, Häusser, Raspe and Bräuning. This is an open-access article distributed under the terms of the Creative Commons Attribution License (CC BY). The use, distribution or reproduction in other forums is permitted, provided the original author(s) and the copyright owner(s) are credited and that the original publication in this journal is cited, in accordance with accepted academic practice. No use, distribution or reproduction is permitted which does not comply with these terms.
*Correspondence: Annette Debel, YW5uZXR0ZS5kZWJlbEBmYXUuZGU=