Abstract
Automatic, wall-to-wall monitoring of forests from remote sensing data is a dream slowly becoming a reality. One barrier to development is the laborious task of developing quality ground reference data. Structural information captured by terrestrial laser scanners (TLS) or unmanned aerial systems (UAS) would expedite the collection of ground reference data if tree species could be automatically determined from point clouds. This study aims to improve species classification from point clouds by identifying detectable structural features useful for classifying species. We compare the effectiveness of multiple feature design strategies for classifying dominant hardwood species (oaks and sugar maples) from single-scan TLS and UAS data of natural hardwood forests, and analyze the separability of these species within and across the canopy layers. We find that oaks and sugar maples have distinct profile shapes that both single-scan TLS data and UAS LiDAR data can capture. TLS captures species-specific profile shapes through direct measurement of canopy width. UAS LiDAR, with its characteristically occluded understory, relies more on canopy density features. Our results emphasize the importance of tailoring data processing and feature extraction for capturing understory structure and highlight the need for modality-specific feature design. Implementing these insights will improve the accuracy and efficiency of automated tree-level inventories in hardwood forests, ultimately supporting more robust forest monitoring and management practices.
1 Introduction
Timely information about the size, health, and species composition of forests is critical for preserving and promoting ecosystem services. Carbon absorption, urban cooling, and timber value are major environmental and economic metrics that fluctuate with forest coverage, health, and species diversity (Jonsson et al., 2019; Gauthier et al., 2014; Jaganmohan et al., 2016; Bonan, 2008; Oswalt et al., 2019). In recent years, forests across the globe have experienced increased tree mortality caused by the rising frequency and severity of fires, insects, disease, and extreme weather events (Allen et al., 2015; Fei et al., 2019; Hartmann et al., 2022). To mitigate these changes, the forestry industry and the research community need methods for monitoring large forested areas quickly and seamlessly.
Remote sensing technology has long been seen as the key to forest monitoring at scale. Since the 1990s, research has focused on exploiting airborne laser scanning (ALS) for stand-level monitoring of forests (Vauhkonen et al., 2014a). Currently, ALS has been incorporated as an essential component of stand-level monitoring operations in multiple countries (Næsset, 2007; Maltamo and Packalen, 2014). Wall-to-wall descriptors of standard canopy variables may be generated from airborne data, but only when paired with ground references. Generally, these references are forest inventories. Forest inventories directly measure biometric features, identify the species, and generate qualitative assessments of individual trees within sample plots. Traditionally, forest inventory workflows manually measure tree attributes, such as diameter at breast height (DBH) and tree positions, using calipers, compasses, and hypsometers (Kangas and Maltamo, 2006; Gollob et al., 2019). Though costly and labor-intensive, these inventories form the “keystone” for stand-level monitoring in Finland (Maltamo and Packalen, 2014), and have become the default training data for tree-mapping algorithms (Kangas et al., 2018; Li et al., 2013b) and accuracy assessment (Lister et al., 2020; Chirici et al., 2020). Yet, more reference datasets are needed to train and assess the models being designed to automate individual tree-level monitoring at scale (Kükenbrink et al., 2022).
To increase the accuracy, coverage, and collection rate of forest inventories, researchers have long worked to integrate terrestrial laser scanning (TLS) and unmanned aerial system (UAS) mapping into the forest inventory workflow (Gollob et al., 2019; Kankare et al., 2015; Oveland et al., 2018). UAS-based remote sensing is widely recognized as the technology most suited to advance the forest monitoring framework (Krok et al., 2020). Not only can these platforms cover significantly larger areas than manual forest inventories, but advances in close-range remote sensing hardware have made LiDAR and image collection from UAS cheap and accessible. On the other hand, since ground-based scanners can rapidly digitize the forest with millimeter accuracy (Liang et al., 2018a), TLS data is widely recognized as the most accurate remote sensing modality for tree-level feature measurement (Liang et al., 2018b; Krok et al., 2020; Schneider et al., 2019; Kükenbrink et al., 2022) [though photogrammetric techniques are also producing precision results (Huang et al., 2018)]. In addition to height and DBH, TLS data can estimate biometric traits that cannot be easily measured manually, such as tree volume (Abegg et al., 2023), biomass (Stovall et al., 2023), stem curve and taper (Liang et al., 2014), and vegetation density (Ashcroft et al., 2014; Batchelor et al., 2022). Despite the advances, data interpretation methods for extracting typical forest inventory features from TLS or UAS data are developing slowly, and manual forest inventory sampling remains the standard for tree-level feature measurement (Breidenbach et al., 2020).
A major reason TLS or UAS data have not replaced manual forest inventory sampling is that these technologies struggle to duplicate non-geometric assessments. Species identification is an integral part of the forest inventory process. Growth models and treatment schedules are species dependent (Vauhkonen et al., 2014b), as is the accuracy of allometrically-derived biomass estimations (Korpela and Tokola, 2006; Vorster et al., 2020). Initially, LiDAR data was not considered adequate for species classification (Vauhkonen et al., 2014b). As point density improved, however, LiDAR data collected by TLS, ALS, or UAS began to be useful for capturing the 3D architecture of trees—a feature known to vary by species and local biodiversity (Hakkenberg et al., 2016). Several researchers have utilized high-density data to classify individual tree species and have shown promising results (Terryn et al., 2020; Liu et al., 2021, 2022; Allen et al., 2023). Despite these previous efforts, more investigation on individual tree species classification is needed, given the diversity of tree structures by species and environments, and the different abilities of platforms to capture this structural information.
The objective of this work is to aid in the advancement of LiDAR-based species classification by identifying structural features detectable in TLS and UAS data that can be used to aid in species identification. We see the difficulty in extracting qualitative assessments of individual trees—especially species identification—as a primary reason TLS and UAS data have not replaced manual forest inventory methods in hardwood forests. Automating forest inventories is necessary to quickly increase available ground validation data and, thereby, catalyze the development and testing of data-driven models for using remotely sensed data for wall-to-wall forest monitoring.
We see several gaps in the literature. The first gap is the lack of modality-specific feature design. It is well known that data modality determines which element of a tree's structural architecture is most easily detected; however, few studies have offered insight into designing features for species detection that account for modality bias. The work of Lin and Herold (2016) points out that TLS is increasingly being used in forest inventory procedures, but relatively little work has been done on identifying species with specific attention to the difference in occlusion pattern in TLS data. Rather, many TLS-based studies simply apply methods designed for aerially collected point clouds to TLS data sets (Puttonen et al., 2011). Lin and Herold argue that direct application of these methods to TLS data may not be optimal. Since feature design strategies for TLS cannot be assumed to produce equivalent results when calculated from UAS data (or vice versa), this study aims to determine which structural elements are most detectable in the respective modalities and which feature design strategy best captures species-variable structural elements.
The second gap is the limited use of single-scan TLS data for species classification. Although TLS data has been used effectively for individual tree modeling, most previous studies use high-quality multi-scan TLS point clouds (Terryn et al., 2020; Åkerblom et al., 2017; Lin and Herold, 2016). While multi-scan point clouds result in very low occlusion rates, the additional fieldwork and processing time needed to produce high-quality point clouds (described in Wilkes et al., 2017) prevents them from gaining widespread use in current forest inventory procedures (Reddy et al., 2018). Meanwhile, several studies demonstrated the potential of single-scan TLS data in different applications, even with high occlusion rates and uneven point density (Batchelor et al., 2022). Motivated by this demonstrated potential, this study extracts valuable features from single-scan TLS data, which can be easily collected in the field, and utilizes them to classify tree species.
The third gap is that little work has focused on structural feature extraction and species classification from LiDAR data in the northern forests of North America. Most work on species classification from LiDAR data has been conducted in the boreal forests of Scandinavia, where forests have fewer species and less understory, and where distinguishing between conifers and deciduous trees may be sufficient for many applications (Vauhkonen et al., 2014b). In northern forests, like the hardwood stands used in this study, the understory contains many trees of significant size. This calls for more complex methods for segmenting individual trees from the point cloud scene. Many studies simply segment individual trees by crown perimeter (Brandtberg et al., 2003; Holmgren and Persson, 2004; Li et al., 2013a). While a reasonable choice for forests that have little to no understory (such as shorter coniferous forests), these methods fail in upland hardwood forests, where oaks and maples are among the most dominant species and have become critical indicators of the effect of climate change and deer population on forest composition (Brandt et al., 2014). Motivated by the need to develop features and workflows that are useful for species classification in environments where understory is critical, this study focuses its application on northern hardwood forests.
In this work, we pair manually-measured forest inventory plot measurements with single-scan TLS data and UAS LiDAR within natural northern hardwood forest. We use an algorithm designed for complex deciduous forests to segment individual trees from the point clouds and extract a series of structural features from each tree. We then use these features to discriminate between oaks and sugar maples in both the canopy and understory to identify detectable structure differences and suggest feature design strategies tailored to specific data modalities. The findings of this work will aid in improving species classification from TLS and UAS LiDAR data, increasing the collection rate of forest inventory reference data, and ultimately accelerating the pace and accuracy of remote sensing for forest monitoring. The main contributions of this work are:
-
demonstrating that below-canopy structural features are critical for structure-based species classification, and proposing feature design strategies for leveraging the understory differences tailored to TLS or UAS data modalities;
-
performing species classification from single-scan TLS data of natural forest with robust tree segmentation; and
-
discriminating between oaks (quercus) and sugar maple (acer saccharum) from mixed northern hardwood forest from both the canopy and understory.
2 Materials and methods
2.1 Test site
The site of this study is Martell Forest, a 195-hectare research forest in northern Indiana, USA (40.44105, –87.03353). The most dominant topographical feature within the forest is Indian Creek. The creek flows southward through a flood plain cut into the surrounding glacial till, dropping about 8 m across the forest as it descends into the Wabash River. As a result, the forest covers three distinct terrain regions: the flat upland plains at 205 m elevation, the flat lowland flood plain averaging 165 m in elevation, and the steep, transitional slopes (Figure 1). Forest research has been conducted at Martell Forest since the mid-twentieth century. For several decades, forest inventories have been periodically performed at 112 plots scattered throughout the forest (Figure 1A). Of these plots, 61 are used in this study and have been designated as “upland,” “lowland,” or “slope” plots (Figure 1B). All forest inventory plots are located in mixed natural forest areas, but the varied terrain creates several micro-environments that influence the admixture of species. The upland areas and the slopes are dominated by oaks and sugar maples, with oaks forming the canopy and sugar maples thriving in the understory. Black cherry, hickories, yellow poplar, and basswood are also common. In the lowland floodplain, the trees at Martell tend to be shorter with basswood, oaks, hackberry, elms, and buckeye being most common (Figure 2).
Figure 1
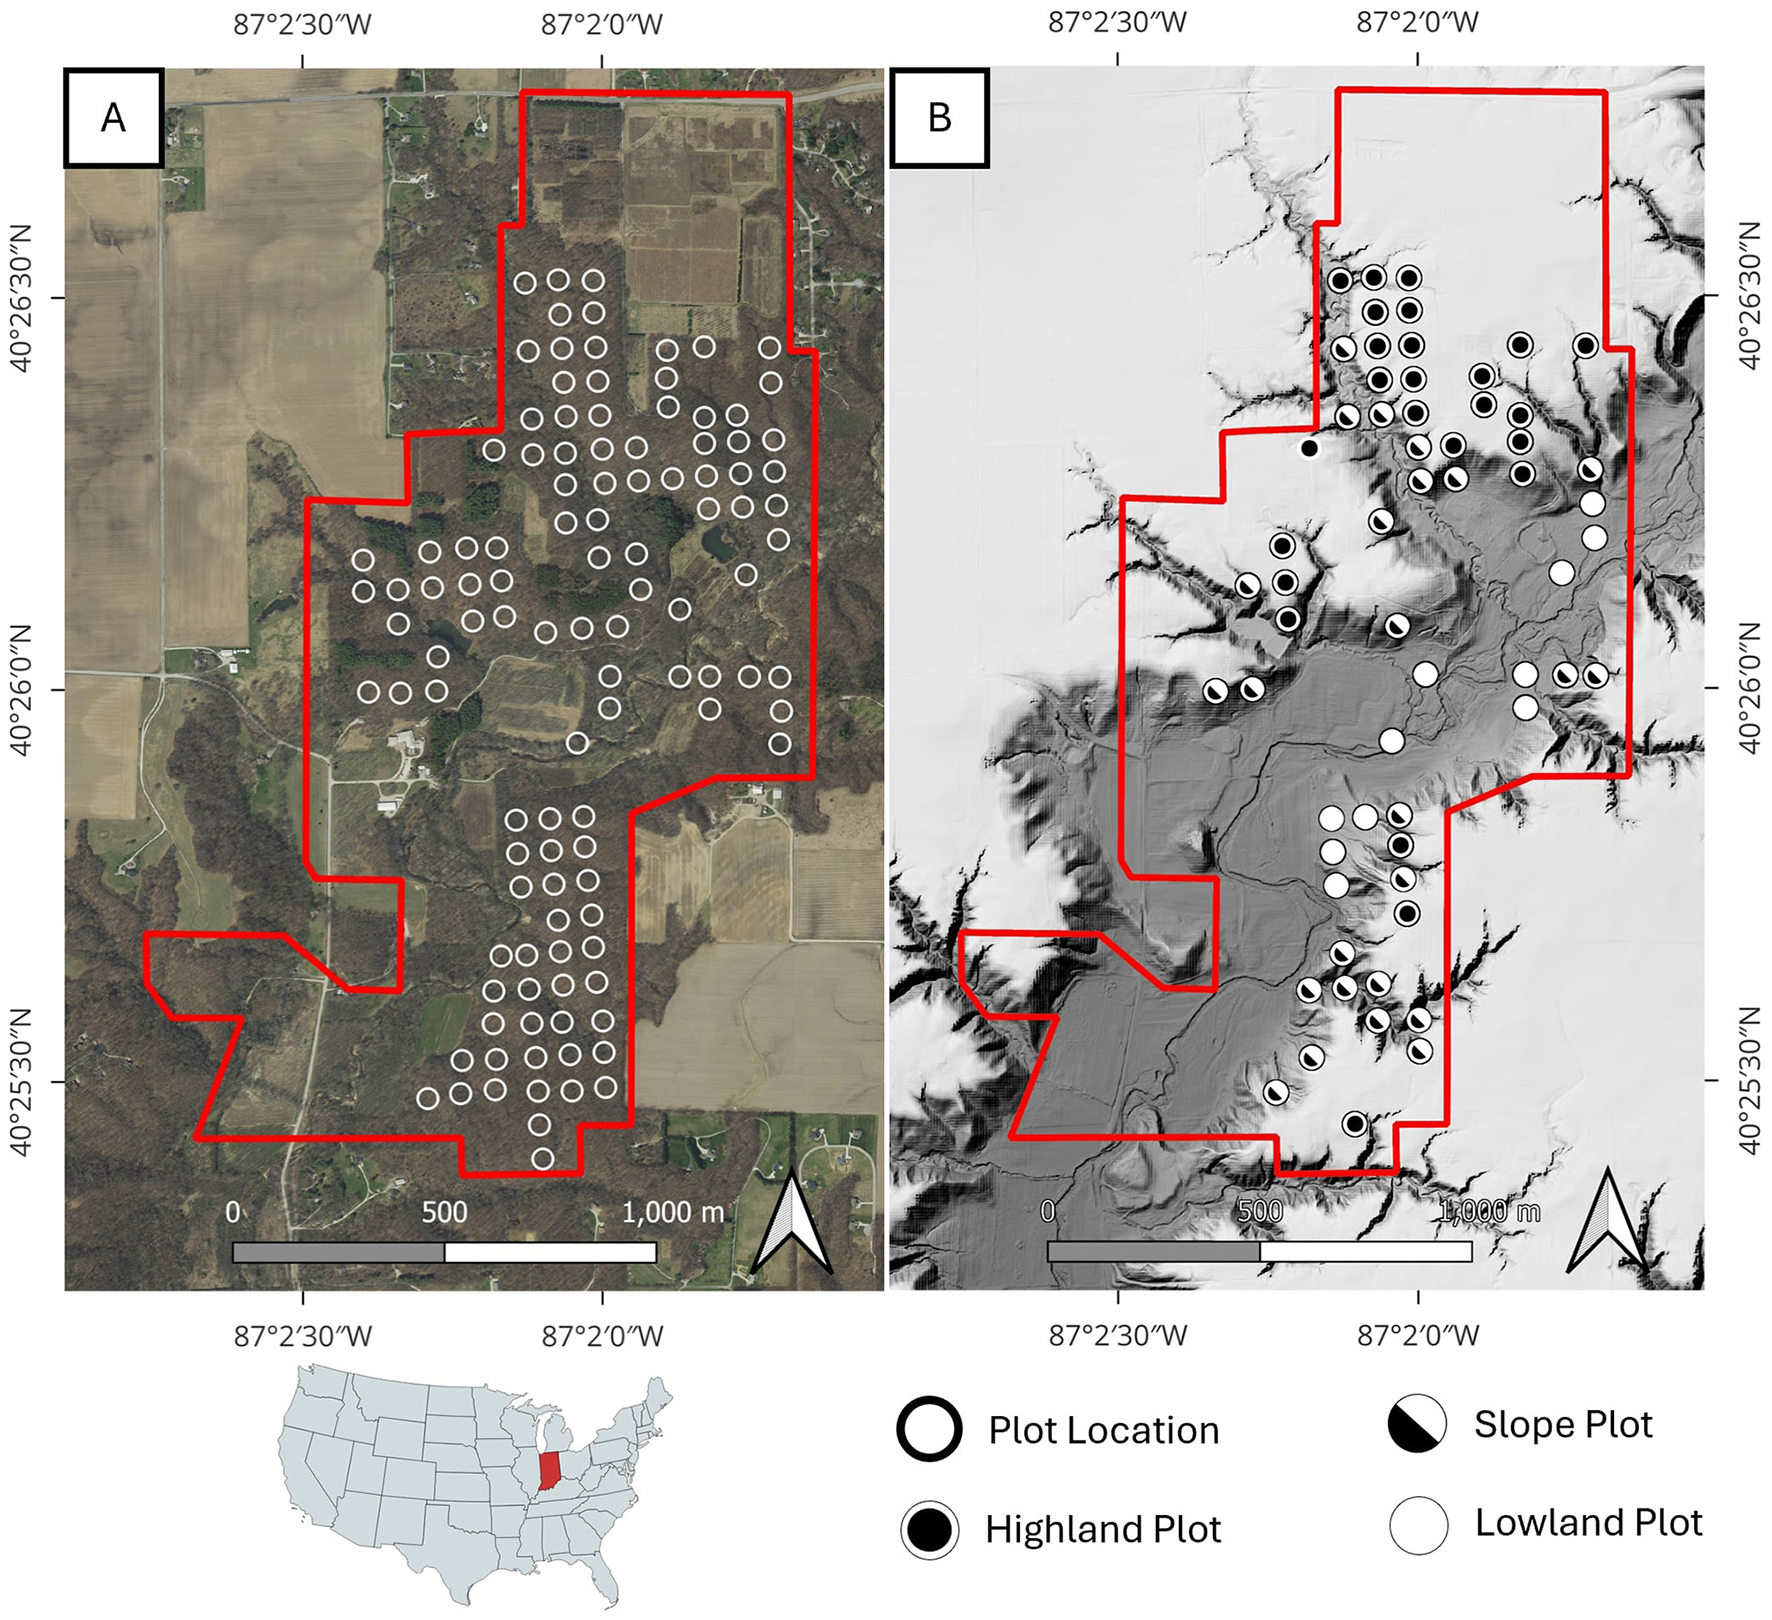
Martell Forest, Indiana, USA. (A) orthoimagery of the forest area showing the location of all 112 forest inventory plots regularly monitored on the site. (B) A digital terrain model of Martell forest showing the location of all plots used in this study. Upland areas (blue hues) sit at about 205 m elevation, while lowland areas (red hues) gradually slope southward from 170 m elevation in the north to 160 m elevation in the south. Forest inventory plots are classified by terrain.
Figure 2
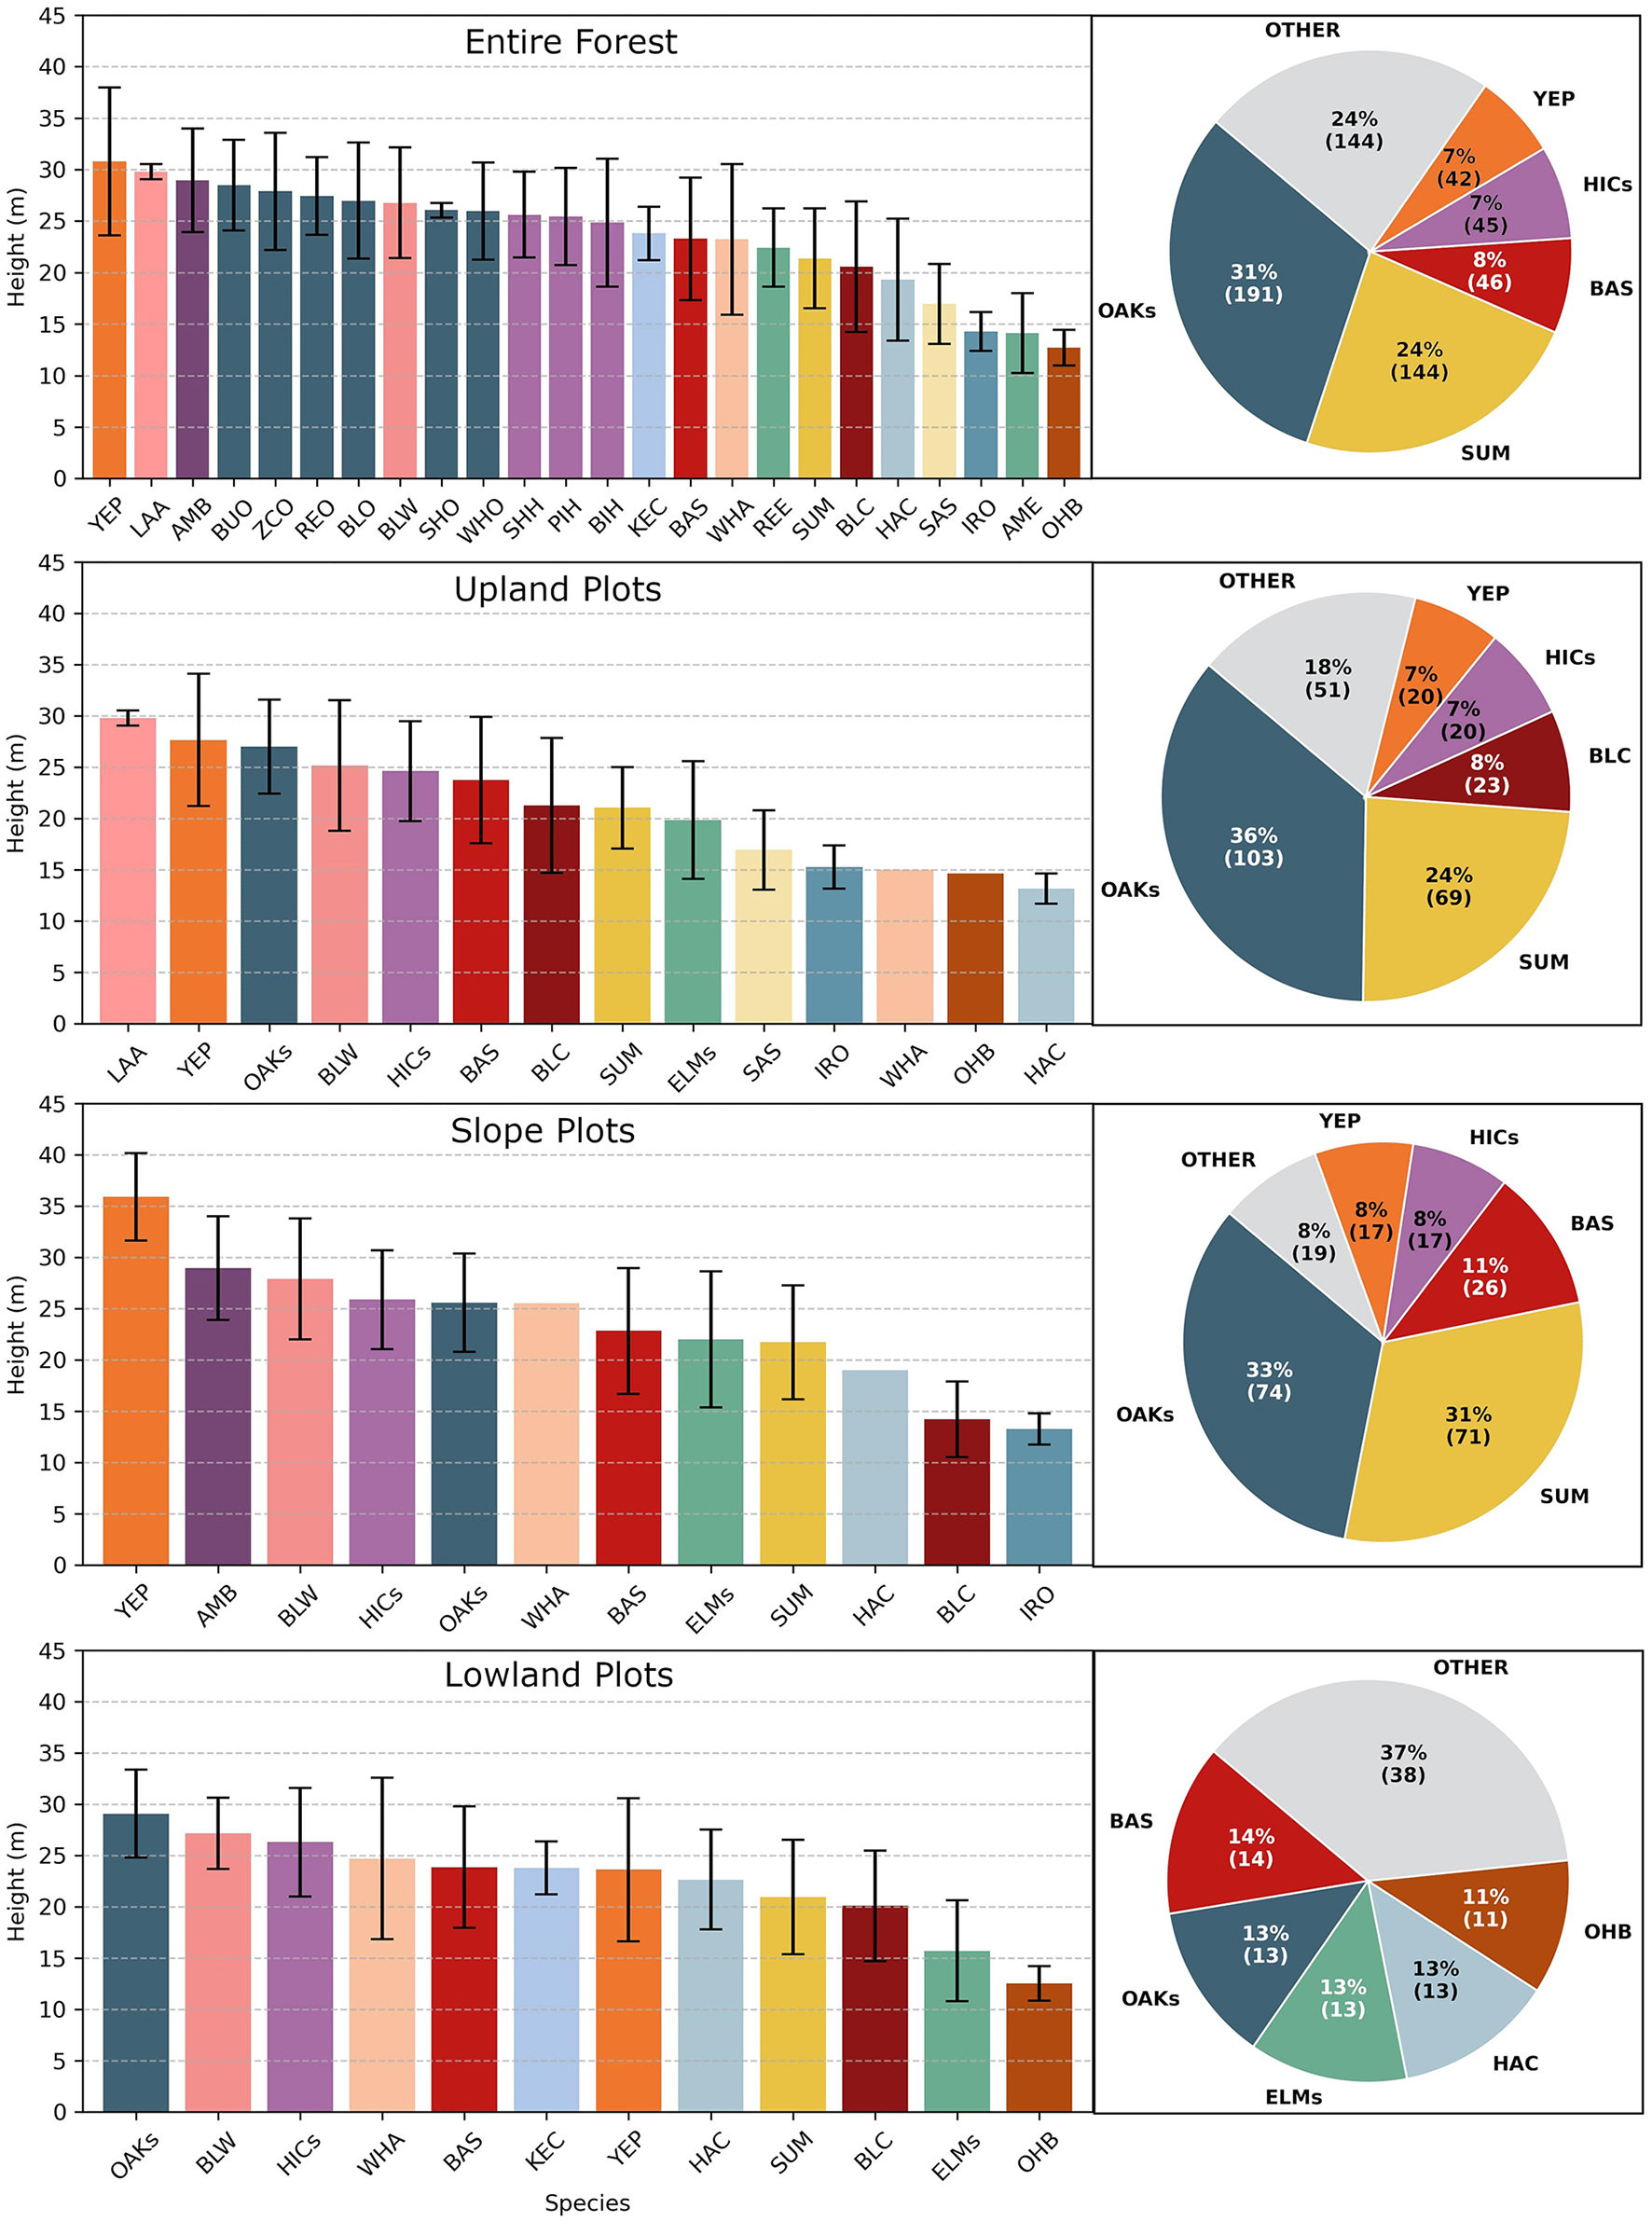
The mean tree heights for each species (bar charts—bars are colored by tree genus) and the tree species make up (pie charts) for both the entire forest and within each of the three terrain classes. These statistics are derived from the forest inventory data.
2.2 Data collection and initial processing
Ground data collection began with the collection of forest inventory data and TLS scans at plot sites. In March and April 2022, trained forestry undergraduate students measured forest inventory data during leaf-off conditions. All living trees within 16 m 52.3 feet) of the center, larger than 12.7 cm (5 inches) in diameter, were located by compass bearing and distance. Dead trees were excluded. For each tree of interest, field crews measured the DBH with a D-tape and identified the species. At each plot, we also collected a TLS scan using a FARO laser scanner (Figure 3).
Figure 3
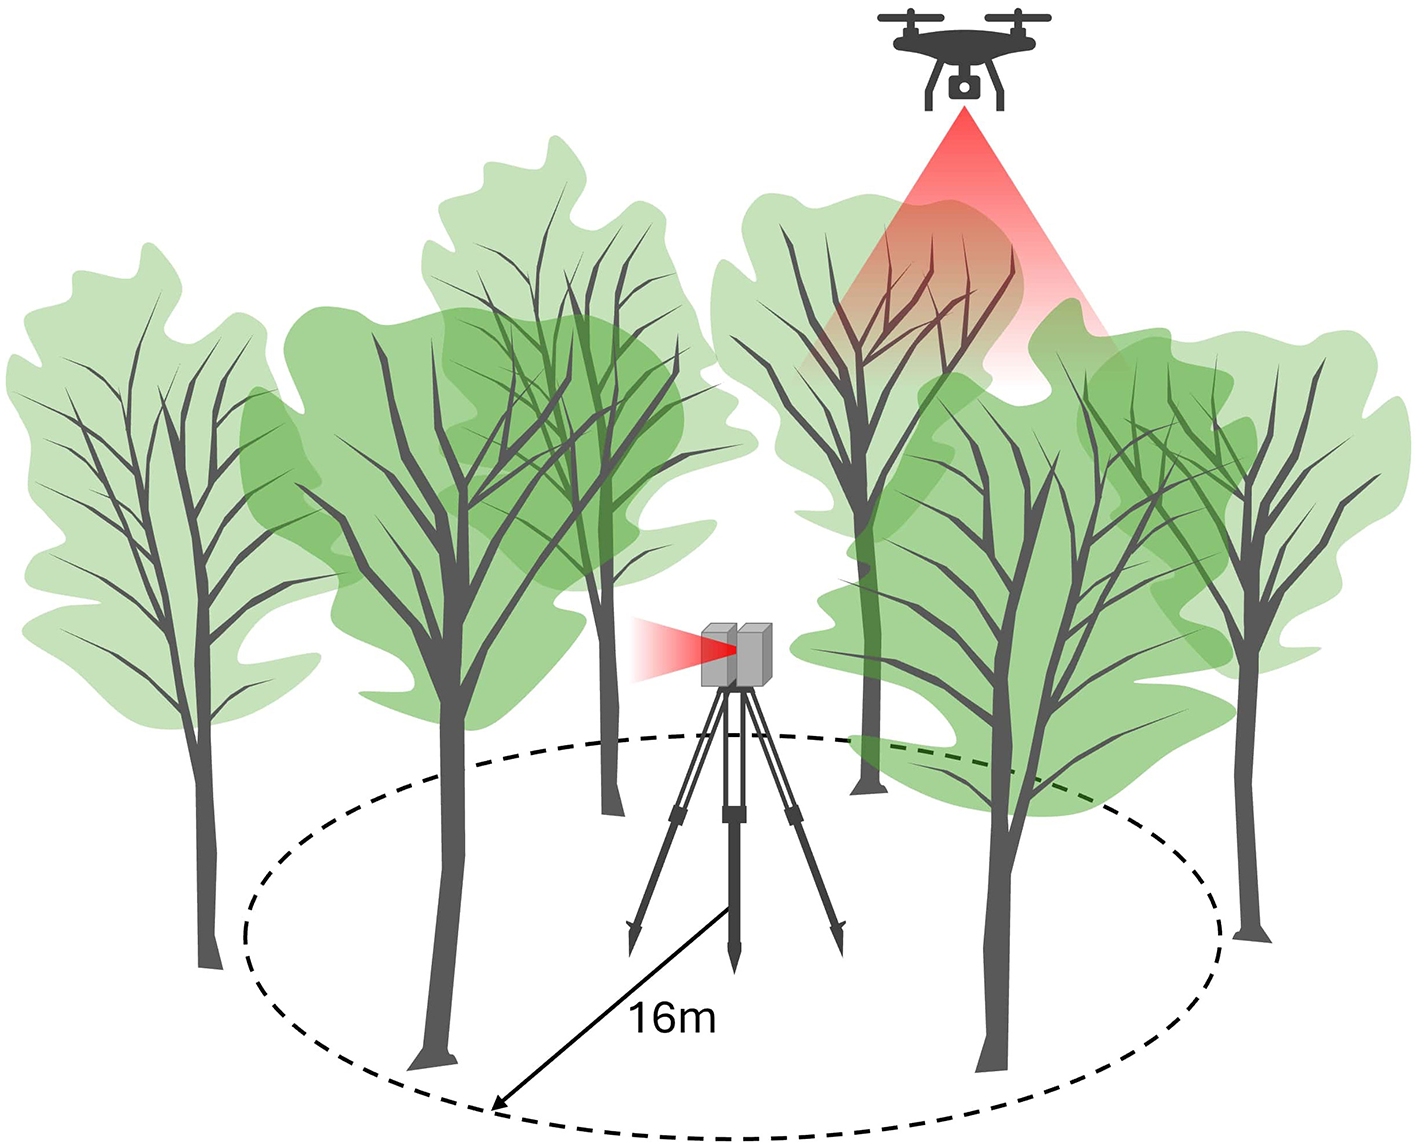
Terrestrial laser scanning data and unmanned aerial system lidar were collected over 61 forest inventory plots, each having a 16-m radius.
To compare how well features from UAS and TLS data capture structural differences in tree species, UAS LiDAR was also collected over the site during leaf-off conditions. We flew a DJI Matrice 300 platform mounted with a Zenmuse L2 LiDAR sensor (DJI, Shenzhen, China) at 120m over the site on March 28, 2024. The raw data was processed using DJI's Terra software to create a point cloud of , which was then co-registered with the photogrammetric point cloud from the 2022 flight.
The geographic alignment between the validation site and any remotely sensed data must be accurate to ensure detected features align with field samples (Maltamo and Packalen, 2014). Misalignment between remotely sensed data and ground reference data is a significant source of error in forest metrics derived from remotely sensed data (Næsset et al., 2004; Fraser and Congalton, 2019; Hernández-Stefanoni et al., 2018; Mayamanikandan et al., 2022). On our site, the stems and dense branches of the canopy prevented precise GNSS observation, so the global coordinates of the plot centers were determined by the method outlined by Carpenter et al. (2023). We deployed disposable targets during the early weeks of March and then flew a DJI Matrice 300 platform mounted with a Zenmuse P1 RGB camera (DJI, Shenzhen, China) at 120 m over the site to capture 2 cm aerial imagery. We processed the images using Agisoft Metashape (version 1.7.1) (Agisoft, St. Petersburg, Russia) to create an orthoimage and point cloud of the forest terrain referenced in UTM Zone 16N (meters). Plot center locations were measured by digitizing each target in the orthoimagery (Figure 4A). These centers were then used to georeference the manual forest inventory measurements (Figure 4C), and the TLS scans were shifted and rotated into the global frame using common ground and trunk features in both the TLS data and the UAS LiDAR point cloud datasets (Figure 4B).
Figure 4
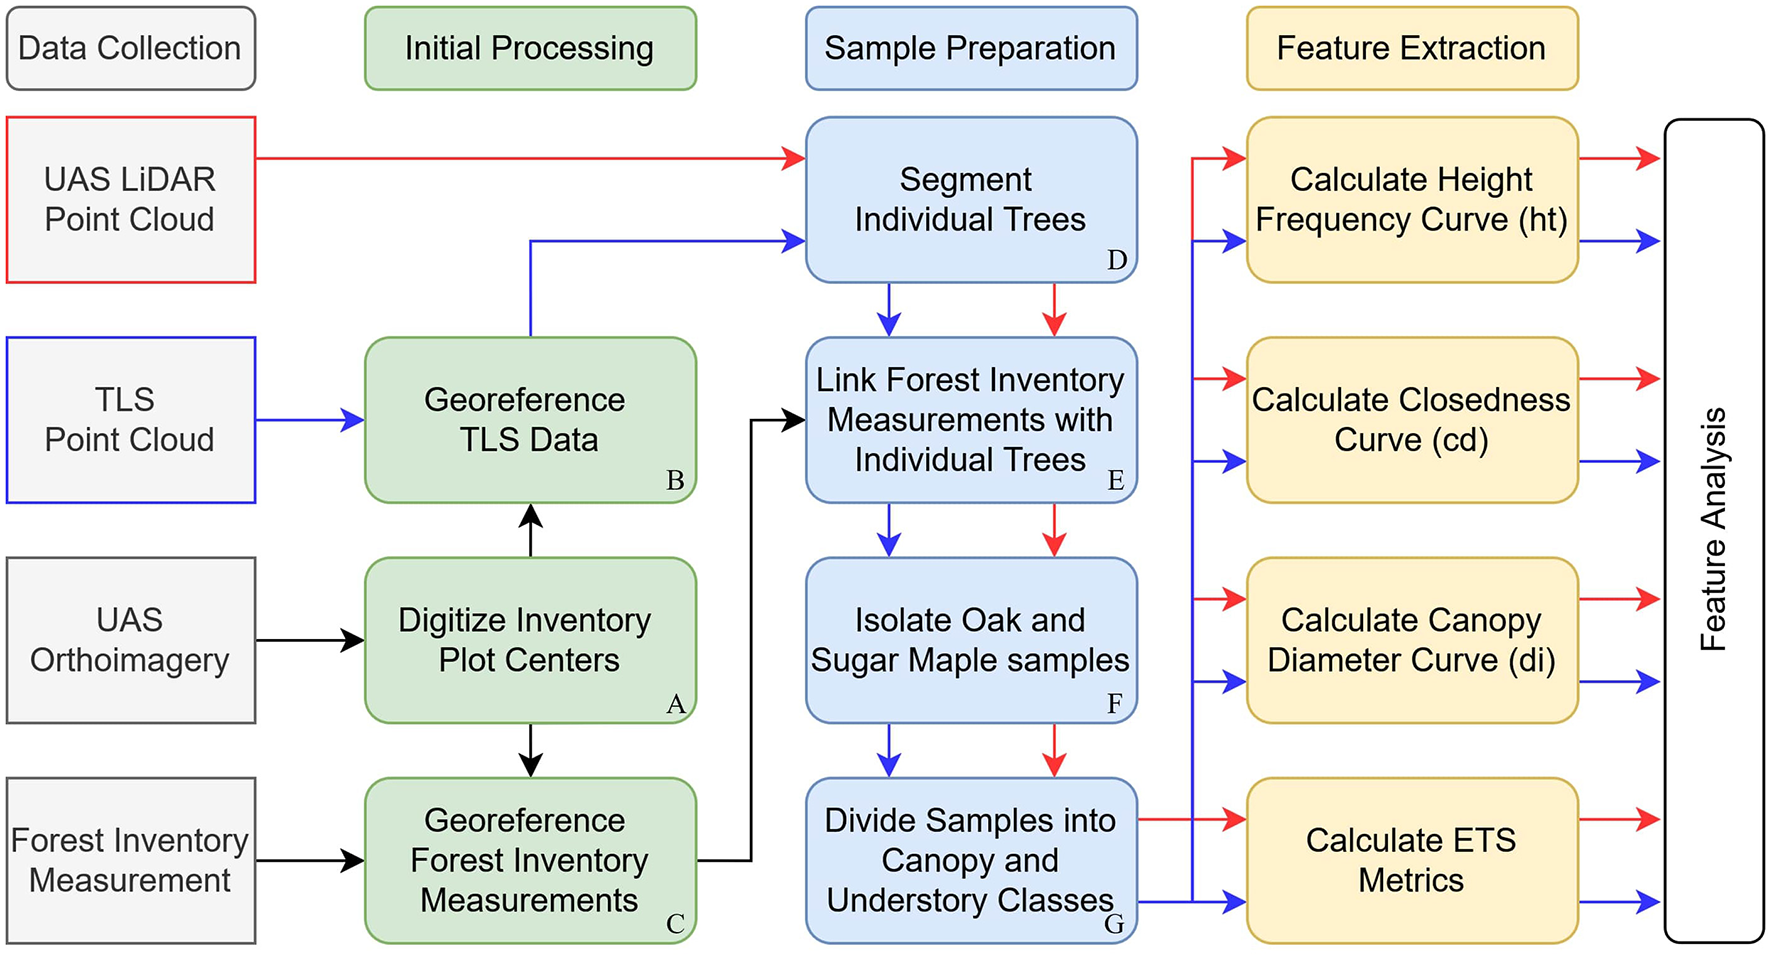
Flow chart of the procedures employed to collect data, georeference the data, segment and select samples, and extract features of interest. Samples from the UAS LiDAR (red arrows) and TLS (blue arrows) point cloud data were passed through the same Sample Preparation and Feature Calculation routine, but the datasets were kept separate for comparative analysis.
2.3 Sample preparation
After the data collection and initial processing steps detailed above, both the TLS and UAS derived point clouds were sent to our individual tree segmentation module (Figure 4D). In contrast with boreal forests, where many studies safely assume that all TLS points falling under the perimeter of the crown represent an individual tree (Li et al., 2013a; Holmgren and Persson, 2004), Martel Forest is a northern hardwood forest where trees large enough to be included in the forest inventory procedure may still be under the canopy. Thus, our work employs an unsupervised method for segmenting individual trees from point clouds (Carpenter et al., 2022) designed to preserve the geometric structure of the tree while separating individuals from environments that have significant understory and entangled tree structures. The TLS data was segmented first, since this data most completely captures individual trunks, then the UAS data was segmented using the TLS segmentation results as a priori knowledge to improve segmentation results.
After segmentation, we linked each tree with the corresponding forest inventory measurements and filtered the samples to create a dataset of individual tree point clouds and labels (Figure 4E). We implemented a modified version of the (Gale and Shapley, 1962) stable marriage algorithm to match each tree with its species label based on geographic proximity and similarity in tree size. The complexity of the environment and the presence of occlusions in the TLS data cause errors in segmentation that would adversely affect the results of our study. So, after creating the TLS-label pairs, we filtered the samples by manually inspecting all pairs to verify the automated matching procedure and to filter out point clouds that were incomplete or poorly segmented. Of the 1,420 matches, 798 were found to either have some segmentation error, contain some major occlusion, or did not match the forest inventory label. Inspection of the samples indicated that lower quality segmentation results were generally further from the plot center and had smaller DBH measures (Figure 5). This indicates that occlusions in the TLS data were the primary cause of poor segmentation results. We removed these samples, leaving 622 high-quality individual tree TLS point clouds with species labels for use in this study. Filtering removed more samples from the UAS data. Because of the lower density and different occlusion patterns of the UAS data, only 591 individual UAS trees were segmented for use in this study.
Figure 5
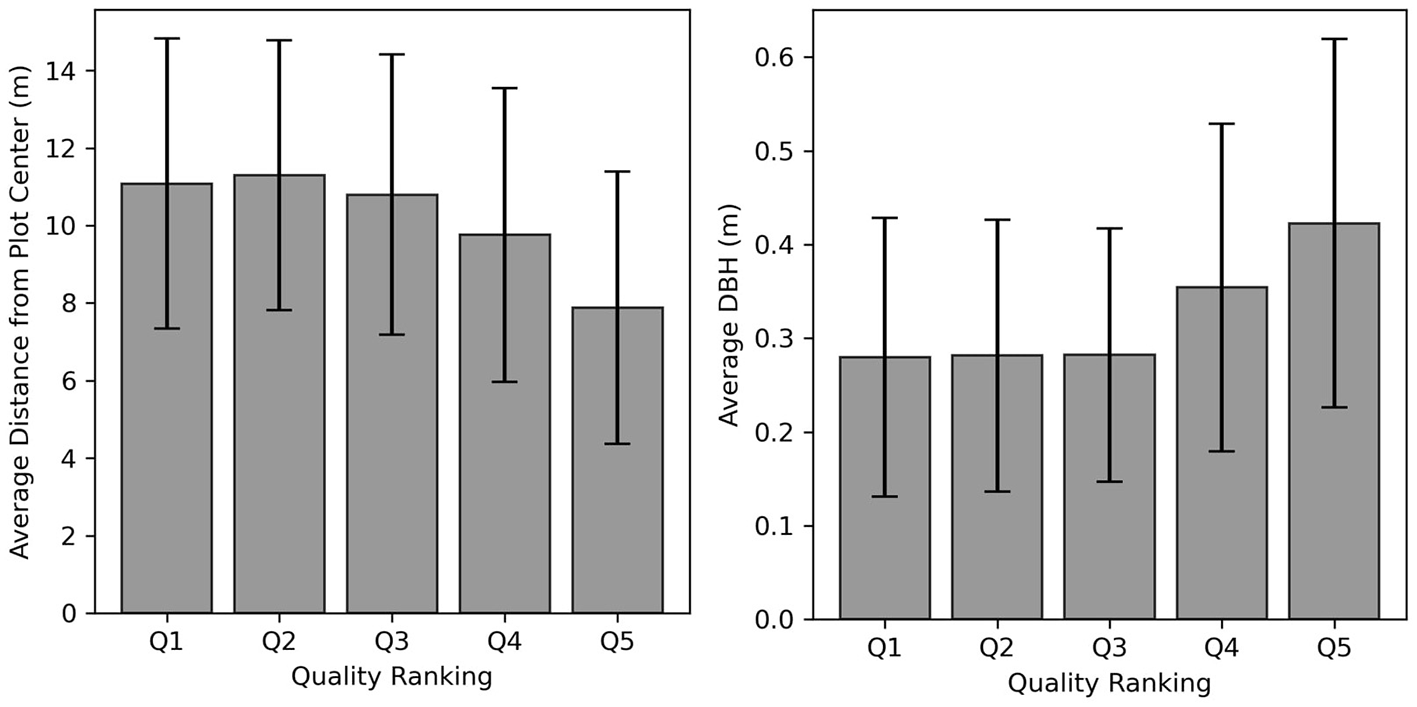
The mean distance from the plot center and DBH for each segmentation quality ranking. High-quality tree segmentation results tend to be nearer the center of the plot (near the scanner) and have larger DBH measurements. Only qualities 4 and 5 were used in this study.
The goal of this study is to identify structural features that have the potential to separate species. To have proper insight into variation indicative of species, it is critical to control for feature variation caused by other factors. To reduce the impact of the growing environment, we removed samples from lowland areas, as trees in these parts of the forest had significantly different structural patterns. Next, to ensure that we had large enough sample sizes to derive statistically meaningful conclusions, we combined species from the same genus into genus-level groups (Table 1). After this merging, only two dominant species, oaks (genus-level) and sugar maples (species-level), had significant numbers for comparison (Figure 4F). Finally, we control for size variation. Terryn et al. (2020) show that the feature variation within a single species can vary significantly depending on a tree's position in the canopy. This intra-species variation is often larger than cross-species variation within the same canopy class. We split the species in this study into canopy and understory groups (Figure 4G). By visual inspection and knowledge of the forest, 22m was determined to be the appropriate threshold between canopy and understory classification. In the end, we compare four classes of trees, canopy oaks (OAKs_C), canopy sugar maples (SUM_C), understory oaks (OAKs_U), and understory sugar maples (SUM_U). Ten of the segmented point clouds of oak and sugar maples from the TLS data are shown in Figure 6.
Table 1
| Species | Abbrev. | Count | Species | Abbrev. | Count |
|---|---|---|---|---|---|
| Sugar maple | SUM | 140 | Red Elm | REE | 7 |
| White oak | WHO | 96 | Chinkapin oak | ZCO | 6 |
| Yellow poplar | YEP | 38 | American elm | AME | 6 |
| Red oak | REO | 36 | Bitternut hickory | BIH | 5 |
| Basswood | BAS | 33 | Iron wood | IRO | 4 |
| Black oak | BLO | 25 | Shingle oak | SHO | 3 |
| Black cherry | BLC | 25 | White ash | WHA | 2 |
| Pignut hickory | PIH | 19 | American beech | AMB | 2 |
| Black walnut | BLW | 17 | Largetooth aspen | LAA | 2 |
| Shagbark hickory | SHH | 15 | Bur oak | BUO | 1 |
| Sassafras | SAS | 12 | Ohio buckeye | OHB | 1 |
| Hackberry | HAC | 8 | |||
| Species counts after grouping | |||||
| Oak[1] | OAKs | 144/34[2] | Sassafras | SAS | 12 |
| Sugar Maple | SUM | 30/110[2] | Hackberry | HAC | 8 |
| Hickory[1] | HICs | 39 | Iron wood | IRO | 4 |
| Yellow poplar | YEP | 38 | White ash | WHA | 2 |
| Basswood | BAS | 33 | American beech | AMB | 2 |
| Black cherry | BLC | 25 | Largetooth aspen | LAA | 2 |
| Black walnut | BLW | 17 | Ohio Buckeye | OHB | 1 |
| Elm[1] | ELMs | 13 | |||
The number of trees in each species from upland and slope plots.
[1] Oaks, Hickories, and Elms emphasized in bold to highlight that they have been grouped at the genus level, reflected in their increased count. [2] For Oaks and Sugar Maples, the count is divided between Canopy and Understory individuals in the format (Canopy Count / Understory Count).
Figure 6
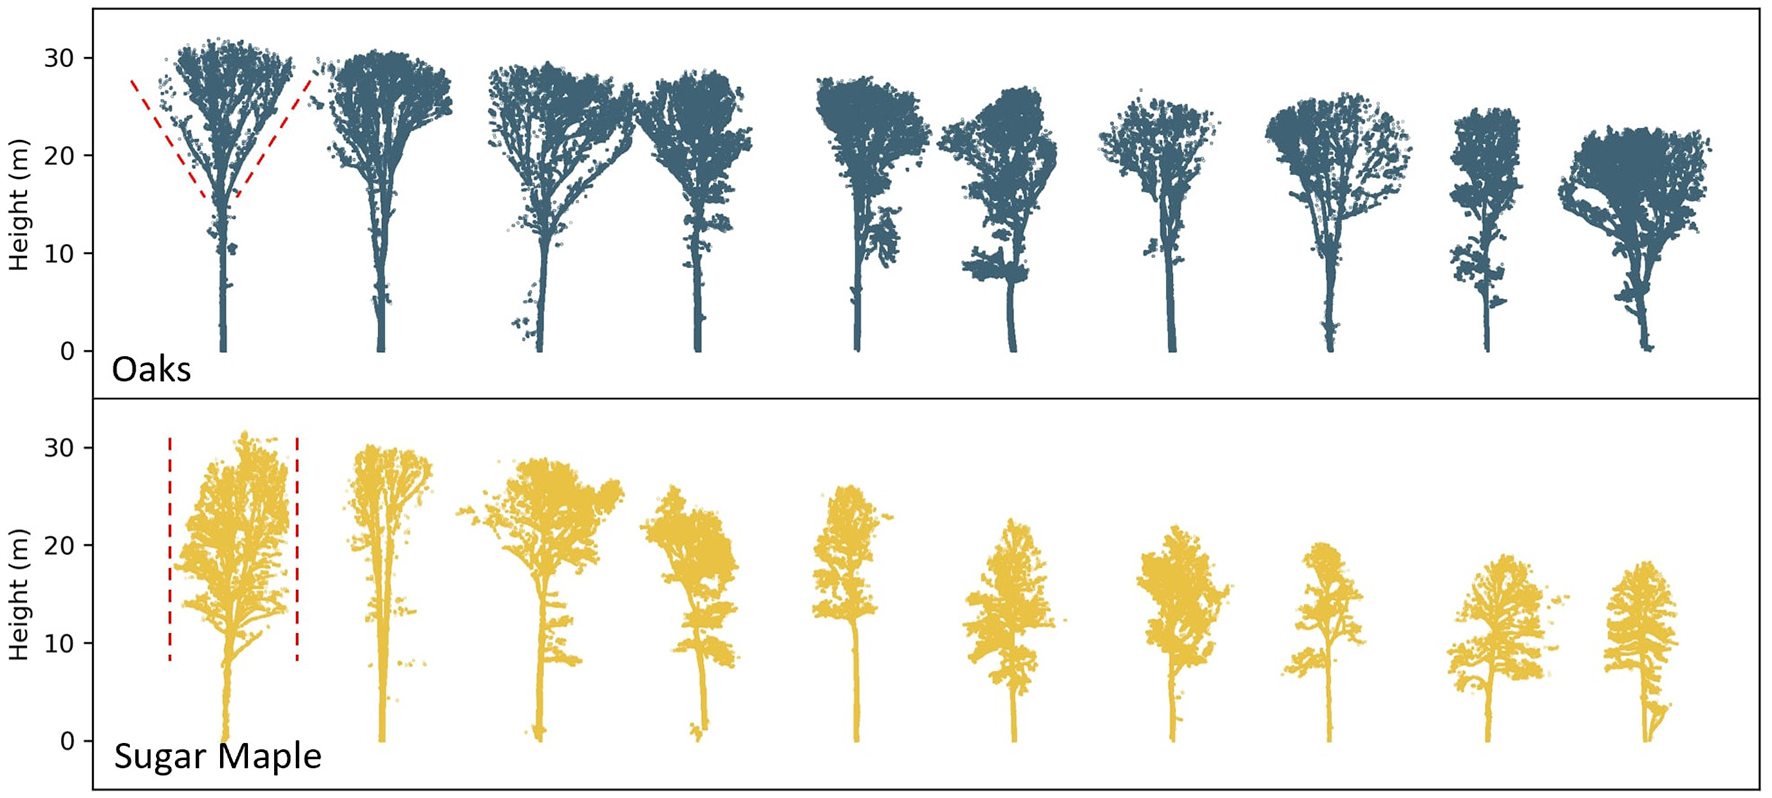
Examples of segmented oak and sugar maple tree point clouds. The red lines along the sides of the first two canopies indicate the canopy shape trend. Oak canopies tend to widen toward the top of the tree, while sugar maple canopies tend to be a consistent width through the canopy.
2.4 Feature extraction
The features for our study are based on three feature curves. Each point cloud of a tree was split horizontally into 20 slices, and a feature was calculated from the points of each slice. Since the number of slices is equal for all trees, the height of the slices changes across samples to accommodate changing tree heights (Li et al., 2013a). Three metrics were calculated to create the three feature curves as shown in Figure 7. The first metric was height frequency (ht) (Figure 7A). This was calculated as the number of points within each height slice.
Figure 7
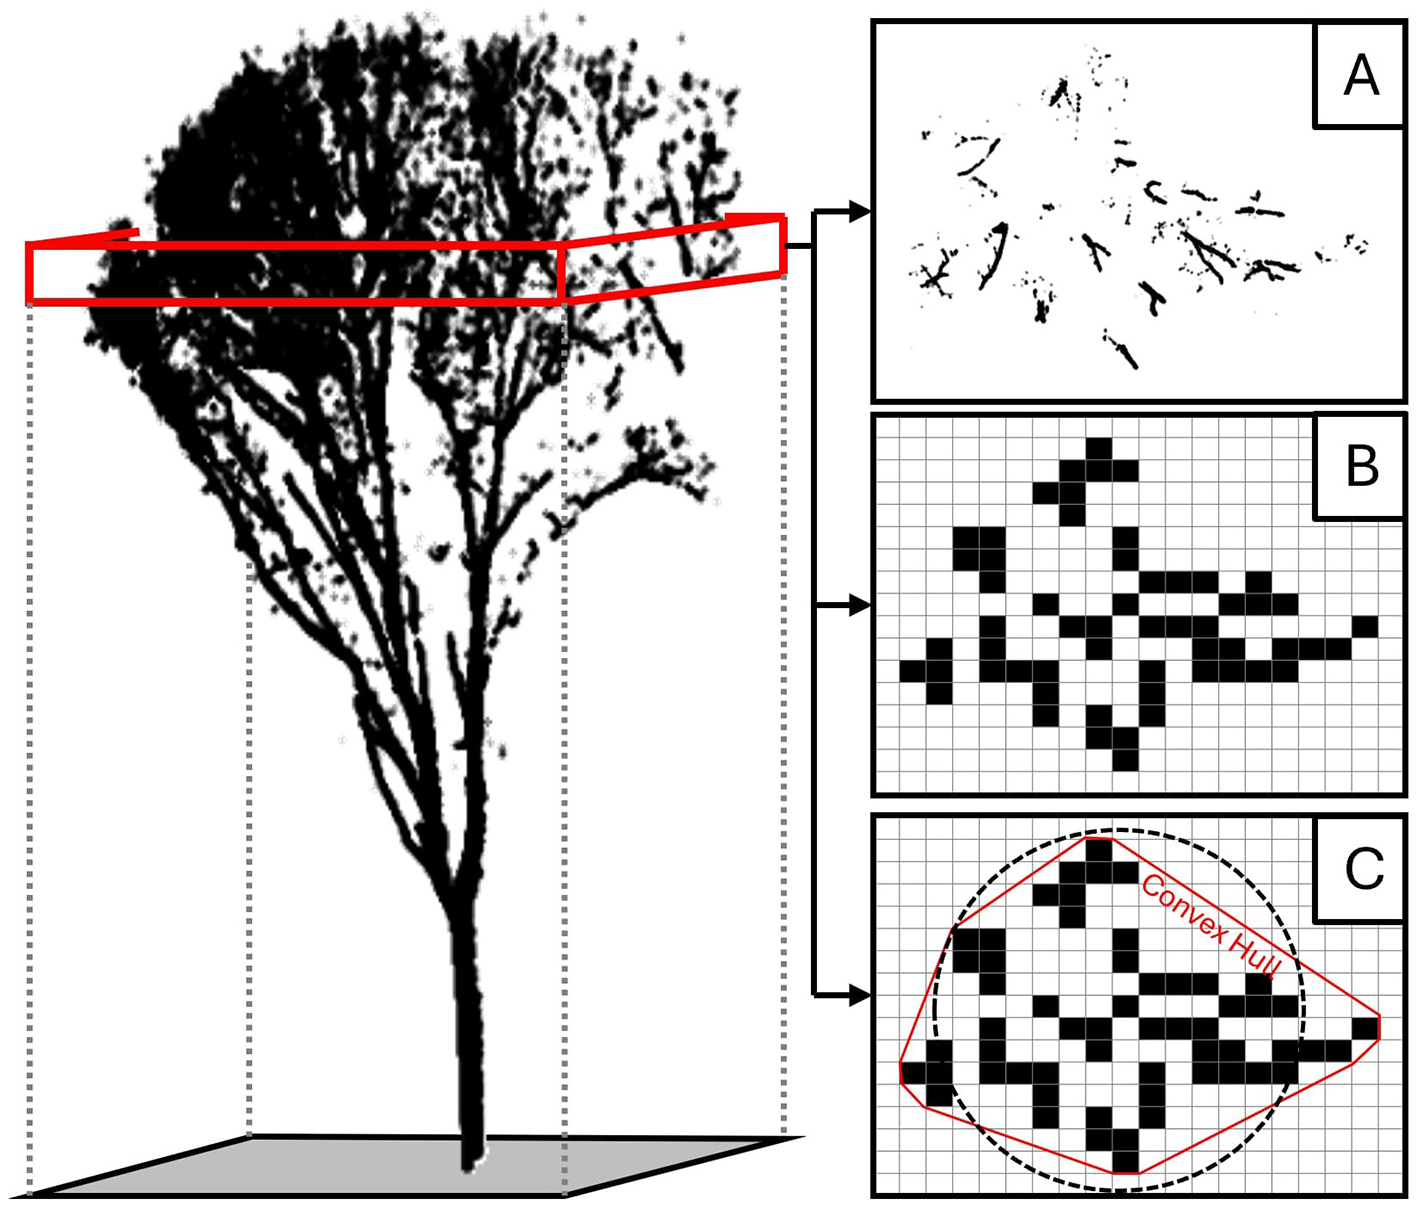
A visual representation of the method for calculating the three curves used for species segmentation. Each tree point cloud was segmented into horizontally oriented slices (the red box represents a single slice). Points falling within a given slice were used to calculate three metrics for that height window: (A) the number of points within the slice, (B) the percentage of occupied voxels within the slice, and (C) the diameter of the circle with an area equal to the area of the convex hull.
The second feature curve is canopy closedness (cd) (Figure 7B). To calculate this metric, the slice was rasterized, and the number of pixels containing points was divided by the number of pixels in the rectangular footprint of the tree. The resolution of the rasterization was equal to the slice height of the particular tree. This size dependency was chosen because it was less sensitive to changes in point density while producing features with meaningful separation between experimental units, and because maintaining equal slices and resolutions allows our method to be implemented with cubic voxels. Calculating canopy closedness in this paper is based on the principles of canopy openness (denoted as “gap fraction”) described in the FORESTR R package (Hardiman et al., 2011; Atkins et al., 2018). However, given the irregularity of TLS point density, we only considered the existence of lidar points within each pixel rather than the number of points. Closedness should be conceptualized as the shading power or the amount of light blocked at each height slice—it is the opposite of openness (Sprugel et al., 2009). The canopy closedness value is correlated with the width of the canopy and the density of the branching architecture within the selected height slice.
The third feature curve is canopy diameter (di) (Figure 7C). This is calculated by finding the area of the convex hull containing all occupied pixels within the height slice. After finding this area, the diameter of the circle of equal area is calculated. Once all absolute diameters are calculated for all slices of a tree, the curve is normalized by the maximum diameter in the curve. This normalized diameter curve directly captures the profile shape of the tree.
Additionally, a few explicit tree structure (ETS) metrics were calculated. These ETS metrics are tree height (et_tree_height), height of the base of the canopy (et_cbh), and the length of the canopy (et_cl). These ETS metrics were designed to further exploit the strengths of the TLS data. Several studies introduce feature normalization to decouple the feature value from the size of the tree (Terryn et al., 2020; Åkerblom et al., 2017; Lin and Herold, 2016). The height curve and ETS features are not normalized, reflecting the true size of the tree. The closedness and diameter features are normalized to reduce their correlation with tree size. Table 2 shows the complete list of features and their description.
Table 2
| Curve | Abbr. | Description |
|---|---|---|
| Height | ht_std | Height standard deviation |
| ht_var | Height variance | |
| ht_cov | Height coefficient of variance | |
| ht_skw | Height skewness | |
| ht_krt | Height kurtosis | |
| ht_ent | Height entropy | |
| ht_avg | Height average | |
| ht_max | Height maximum | |
| Closedness | cd_std | Closedness standard deviation |
| cd_var | Closedness variance | |
| cd_cov | Closedness coefficient of variance | |
| cd_skw | Closedness skewness | |
| cd_krt | Closedness kurtosis | |
| cd_ent | Closedness entropy | |
| cd_avg | Closedness average | |
| cd_max | Closedness maximum | |
| ht_cd_max | Height at closedness maximum | |
| cd_ratio_1 | Height at closedness maximum to tree height ratio | |
| cd_ratio_2 | Closedness maximum to tree height ratio | |
| cd_ratio_7 | Height at closedness maximum to canopy length ratio | |
| cd_ratio_8 | Height at closedness maximum to closedness maximum ratio | |
| cd_bh | Closedness at breast height | |
| cd_cbh | Closedness at canopy base height | |
| Diameter | di_std | Norm'd diameter standard deviation |
| di_cov | Norm'd diameter coefficient of variance | |
| di_skw | Norm'd diameter skewness | |
| di_krt | Norm'd diameter kurtosis | |
| di_ent | Norm'd diameter entropy | |
| di_avg | Norm'd diameter average | |
| d_max | Diameter maximum | |
| ht_di_max | Height at Norm'd diameter maximum | |
| di_ratio_1 | Height at Norm'd diameter maximum to tree height ratio | |
| d_ratio_2 | Diameter maximum to tree height ratio | |
| ETS | et_tree_height | 98th percentile of all heights |
| et_cbh | Canopy base height | |
| et_cl | Canopy length | |
| et_ratio_1 | Canopy base height to tree height ratio | |
| et_ratio_2 | Canopy length to tree height ratio |
Features extracted from the point clouds of individual trees.
2.5 Feature analysis
The objective of this paper is to provide insight into the relationship between features and the tree structural architecture. Understanding this relationship is critical for recognizing the effect different occlusion patterns and point densities will have on calculated features. Such recognition will inform feature design for specific point cloud capture modalities. To this end, our study focuses on identifying feature importance and noting how the usefulness of features changes with data modality.
Our first feature evaluation technique quantifies the separability of the species within each feature. To measure the separability, we employ Fisher's Discriminant Criterion (FDC), which is defined as the ratio of the between-class variance to the within-class variance (Bishop, 2006) as shown in Equation 1:
where σ1 and σ2 are the means of each class within a given feature, and σ1 and σ2 are the standard deviations of the class within the same feature. FDC values closer to zero indicate minimal separability, while increasingly larger positive values (e.g., 0.5–1.5 or higher, depending on the dataset) suggest stronger discrimination between classes. Concretely, an FDC value of 1 indicates that the distance between the means equals the combined standard deviation, suggesting moderate overlap between classes.
We further evaluate the usefulness of the features by performing supervised classification and analyzing the importance of each feature. We use Linear Discriminant Analysis (LDA), a parametric method for finding the linear combination of features that best separates the classes. LDA assumes multivariate normality of features and equal covariance among classes; both assumptions were evaluated and found to be reasonably satisfied based on Mahalanobis QQ plots, the Henze-Zirkler test for multivariate normality, and geometric comparisons of class covariance structures in principal component space. In this paper, the LDA classifier was built using the libraries of scikit-learn in Python (Pedregosa et al., 2011). The model was fit using the default “linear” solver, with class priors estimated from the sample proportions and no shrinkage applied. We chose LDA because the coefficients of the projected scores are easily interpretable, the method is directly related to our separability metric, it performs well with low feature count, and can handle multicollinearity. Further, it has a long track record in remote sensing. LDA has been used heavily for imagery data, including hyperspectral remote sensing (Chan et al., 2021; Alonzo et al., 2013; Zhao et al., 2000) and for tree species classification from point clouds (Ørka et al., 2009; Li et al., 2013a; Alonzo et al., 2014).
3 Results
There are three primary results of this study. First, the density and arrangement of understory branches differ between oaks and sugar maples. Oaks tend to shed their lower branches, resulting in a triangular canopy profile with little understory structure. In contrast, sugar maples retain their lower branches, creating a denser branching mass lower on the tree (exemplified by the first pair of trees in Figure 6). Second, these structural differences are detectable in point cloud data. Both the UAS and TLS data captured separable differences in the understory structure. Third, the most effective feature for leveraging this difference for species classification depends on the modality of data collection. Features describing the diameter of a tree's understory structure provide strong separability between species in TLS data, while features capturing canopy closedness are more effective for UAS data. These three findings are derived from the observations presented in the following subsections.
3.1 Feature evaluation
Analysis of structural features derived from TLS and UAS point clouds reveals three key differences between oaks and sugar maples: (1) canopy oaks have their maximum canopy closedness and diameter positioned high in the tree in both modalities; (2) sugar maples have a relatively uniform canopy width, whereas oaks gradually widen toward the top; and (3) UAS-derived features provide less separability between species than TLS-derived features. Our feature evaluation results are presented in two figures. Figure 8 shows the FDC separability between oaks and sugar maples for each feature, within each canopy class and modality. The right panels of Figure 8 highlight the distributions of a select four features. These four are highlighted because they show the most separability between species within their class, provide useful separability across multiple classes, or capture quantitatively a pattern detected qualitatively in visual analysis. Together, these four best demonstrate how structural differences between oaks and sugar maples manifest themselves in the data modalities tested in this study. Figure 9 displays mean profile shapes for each species and canopy classification. Shading represents the closedness value of each horizontal layer, and dotted lines mark the height of maximum closedness in both TLS and UAS trees.
Figure 8

For each feature, the separability between oaks and sugar maples within each experimental unit was tested. (A) This heatmap shows Fisher's discriminant coefficient describing the separability between oaks and sugar maples captured by each feature, within a specific canopy class and data modality. This heatmap can be used to identify features that capture structural differences between species. Four features are highlighted on the left. The distributions of these features, from which the FDC scores were derived, are shown in panels (B–E), with the FDC separability score displayed above each pair. An asterisk (*) indicates that the difference in mean values is statistically significant. Four features are uniquely indicative of how structural differences exhibit themselves in the tested data modalities. The distributions of these four are highlighted in the following panels. (B) A detail of the normalized height of maximum closedness (cd_ratio_1) feature showing the feature's distribution across species, canopy class, and data modality. (C) A detail of the standard deviation of normalized canopy diameters (di_std) feature. (D) A detail of the skewness of normalized canopy diameters (di_skw) feature. (E) A detail of the normalized height of maximum diameter (di_ratio_1) feature.
Figure 9
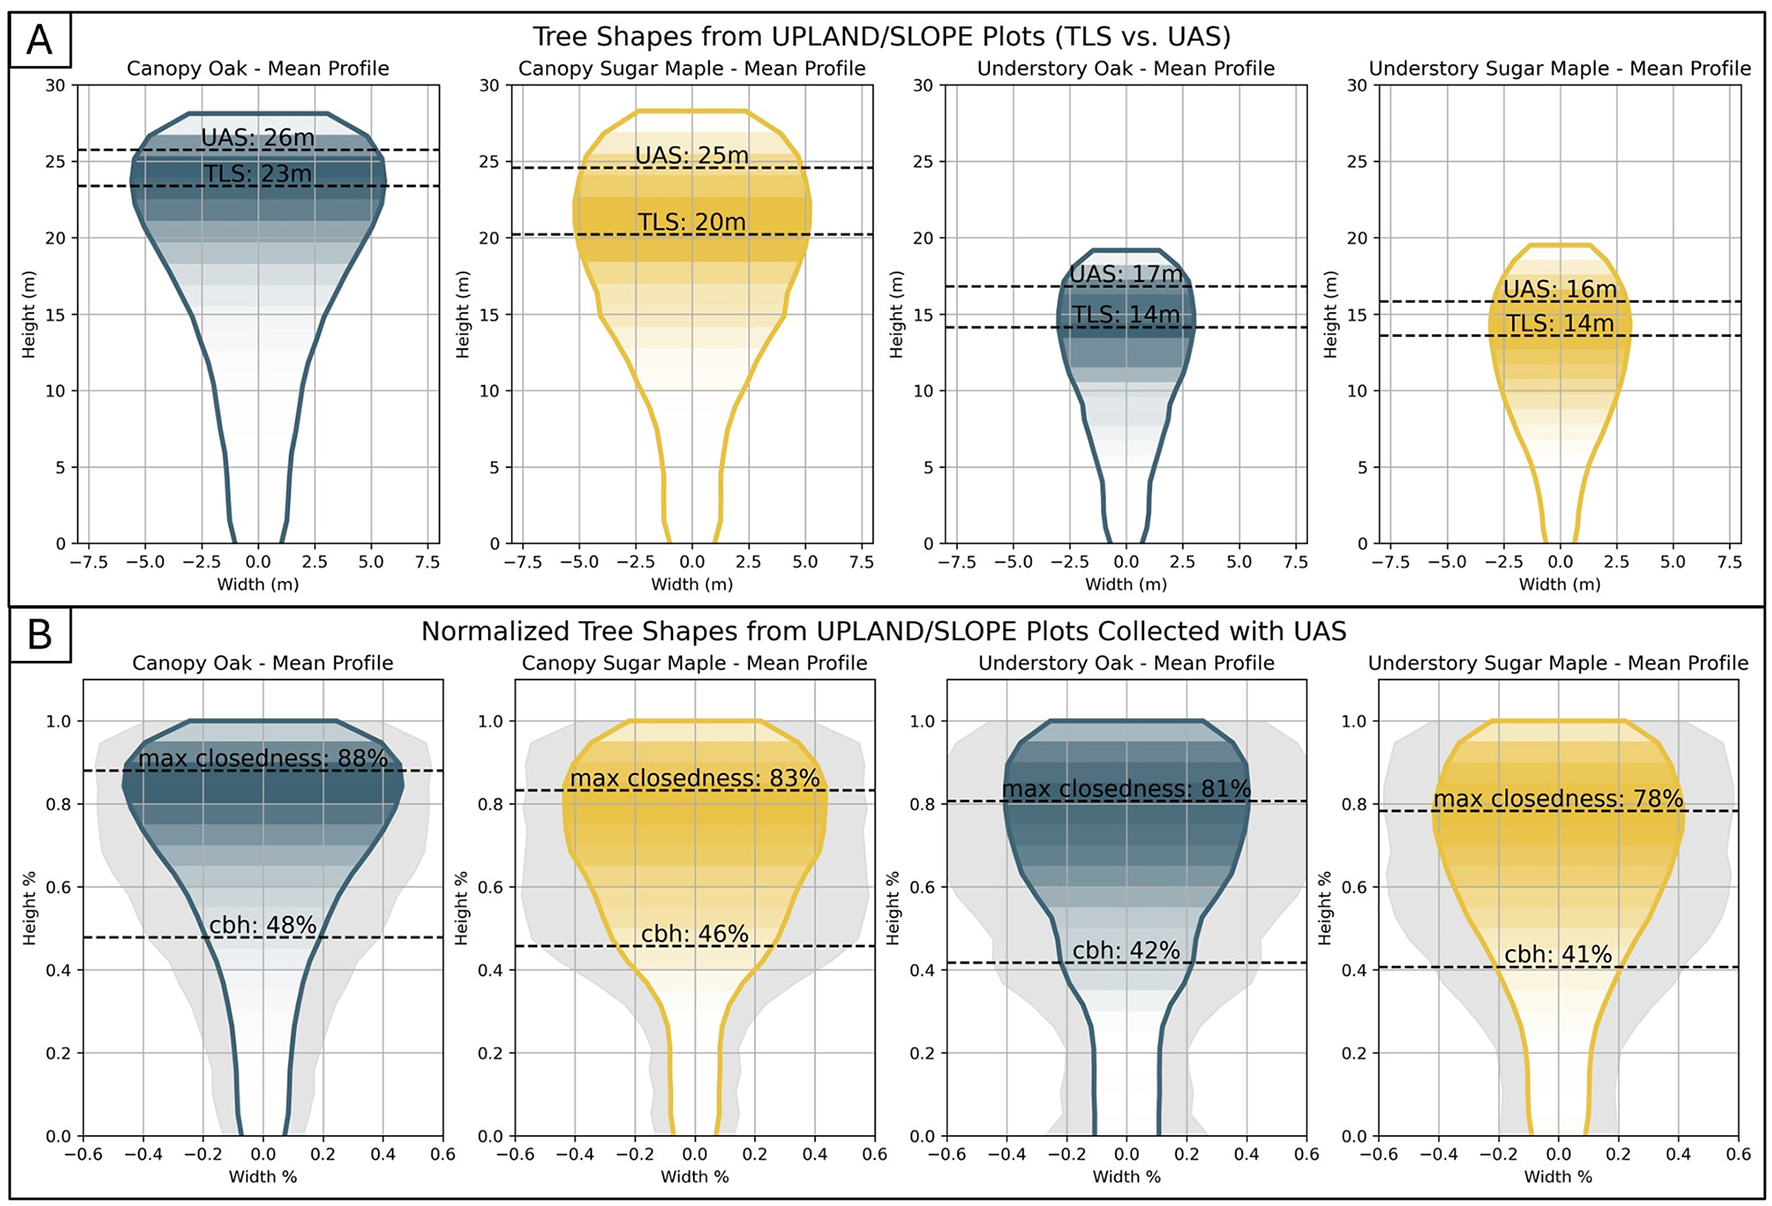
The average profiles of oaks and sugar maples in canopy and understory classes as captured by TLS data. The profile shape is formed from the diameter curve for each height slice, and the shading shows the value of the canopy closedness curve for each height slice. The average height of the maximum closedness calculated from both TLS and UAS is marked by a dotted line. (A) The absolute tree profile. (B) Tree profile represented as a percentage of total width and height to remove the impact of tree size.
Observation 1: Canopy oaks exhibit a distinct structural characteristic where their maximum canopy closedness and maximum diameter occur higher in the tree profile than in sugar maples. While maples and understory oaks reach their maximum closedness at approximately 70% of tree height, canopy oaks reach it at about 83%, with their maximum diameter occurring around 85%. This distinction is easily detected visually in the mean profiles shown in Figure 9. Two features quantify this characteristic: canopy oaks have significantly higher normalized height of maximum closedness (cd_ratio_1) and normalized height of maximum diameter (di_ratio_1) than canopy sugar maples. The FDC score of cd_ratio_1, comparing canopy oaks to canopy sugar maples, is 0.48 (for TLS) and 0.34 (for UAS), and t-test results indicate their means are significantly different. This can be seen graphically by inspecting the box plots in Figure 8B. Likewise, the FDC score of di_ratio_1 comparing canopy oaks to canopy sugar maples is 0.49 (for TLS) and 0.30 (for UAS), also with statistically different means (Figure 8E). These two features have the highest separation scores in both TLS and UAS data, which is why they are highlighted in this analysis.
Observation 2: Sugar maples have a relatively uniform canopy width, while oaks gradually widen toward the top. Once again, this observation is apparent upon visual inspection of the mean profiles, but more insight is to be gained in identifying the features that capture this structural difference. Unlike canopy trees, understory oaks and sugar maples are not well-separated by cd_ratio_1 (FDC: 0.16 for TLS, 0.05 for UAS) and di_ratio_1 (FDC: 0.24 for TLS, 0.01 for UAS). Two other features—the standard deviation of normalized canopy diameters (di_std) and the skewness of normalized canopy diameters (di_skw)—were found by this study to effectively distinguish between oaks and sugar maples regardless of canopy class (though it generally has more separation in the canopy class). Comparison of the distributions shown in Figure 8C indicates that oaks have a lower standard deviation of diameters, while the distributions highlighted in Figure 8D indicate they have a higher skewness. A high skewness means diameter distributions are more right-skewed, with more small-diameter height slices. This reflects a key structural difference: oaks gradually taper toward the canopy, resulting in a smaller mean diameter with lower variance, while sugar maples have a short, distinct “trunk” region, leading to a larger mean diameter with more variance. These two features are not the only features that capture this pattern, but they are the features that show it most clearly and are, therefore, used here as exemplars.
Observation 3: UAS-derived features provide less species separability than TLS-derived features. Occlusion patterns in the point clouds change based on modality. TLS data tends to undersample the top of the canopy, making the canopy appear more open in the upper layers while capturing the trunk and understory in great detail. UAS, in contrast, tends to undersample the lower canopy, making the top of the canopy appear relatively more closed. Referring to the FDC results in Figure 8A, we see that understory trees generally have lower FDC scores (less separable between species), and UAS features have lower FDC scores than the corresponding TLS scores, regardless of canopy class.
These three observations reinforce our primary findings. Observations 1 and 2 demonstrate that oaks and sugar maples differ in sub-canopy structure, a distinction detectable in both TLS and UAS data. Oaks exhibit a widening canopy shape with relatively few understory branches, whereas maples maintain a more uniform canopy width throughout the tree's height. Observation 3—that UAS features show lower species separability—further underscores the importance of understory structure for classification and highlights the need for modality-specific feature design, as differences in occlusion patterns between TLS and UAS impact feature effectiveness.
3.2 Classification
We use LDA classification to perform multivariate analysis of the features. The four target classes were: canopy oaks (OAKs_C), canopy sugar maples (SUM_C), understory oaks (OAKs_U), and understory sugar maples (SUM_U). We implemented stratified five-fold cross-validation for two LDA models—one trained on TLS features and the other trained on UAS features. The TLS features achieved a 75 ± 6% total classification accuracy, and the UAS features achieved a 61 ± 7% accuracy. The results of the LDA classification are presented in Figure 10. Analysis of the coefficients of the LDA axis yielded three additional observations: (4) Species classification is more accurate for canopy trees, (5) tree height-related parameters dominate class separability across the four classes, and (6) separation between species is best captured by diameter curve descriptors in TLS data and by closedness curve descriptors in UAS LiDAR.
Figure 10
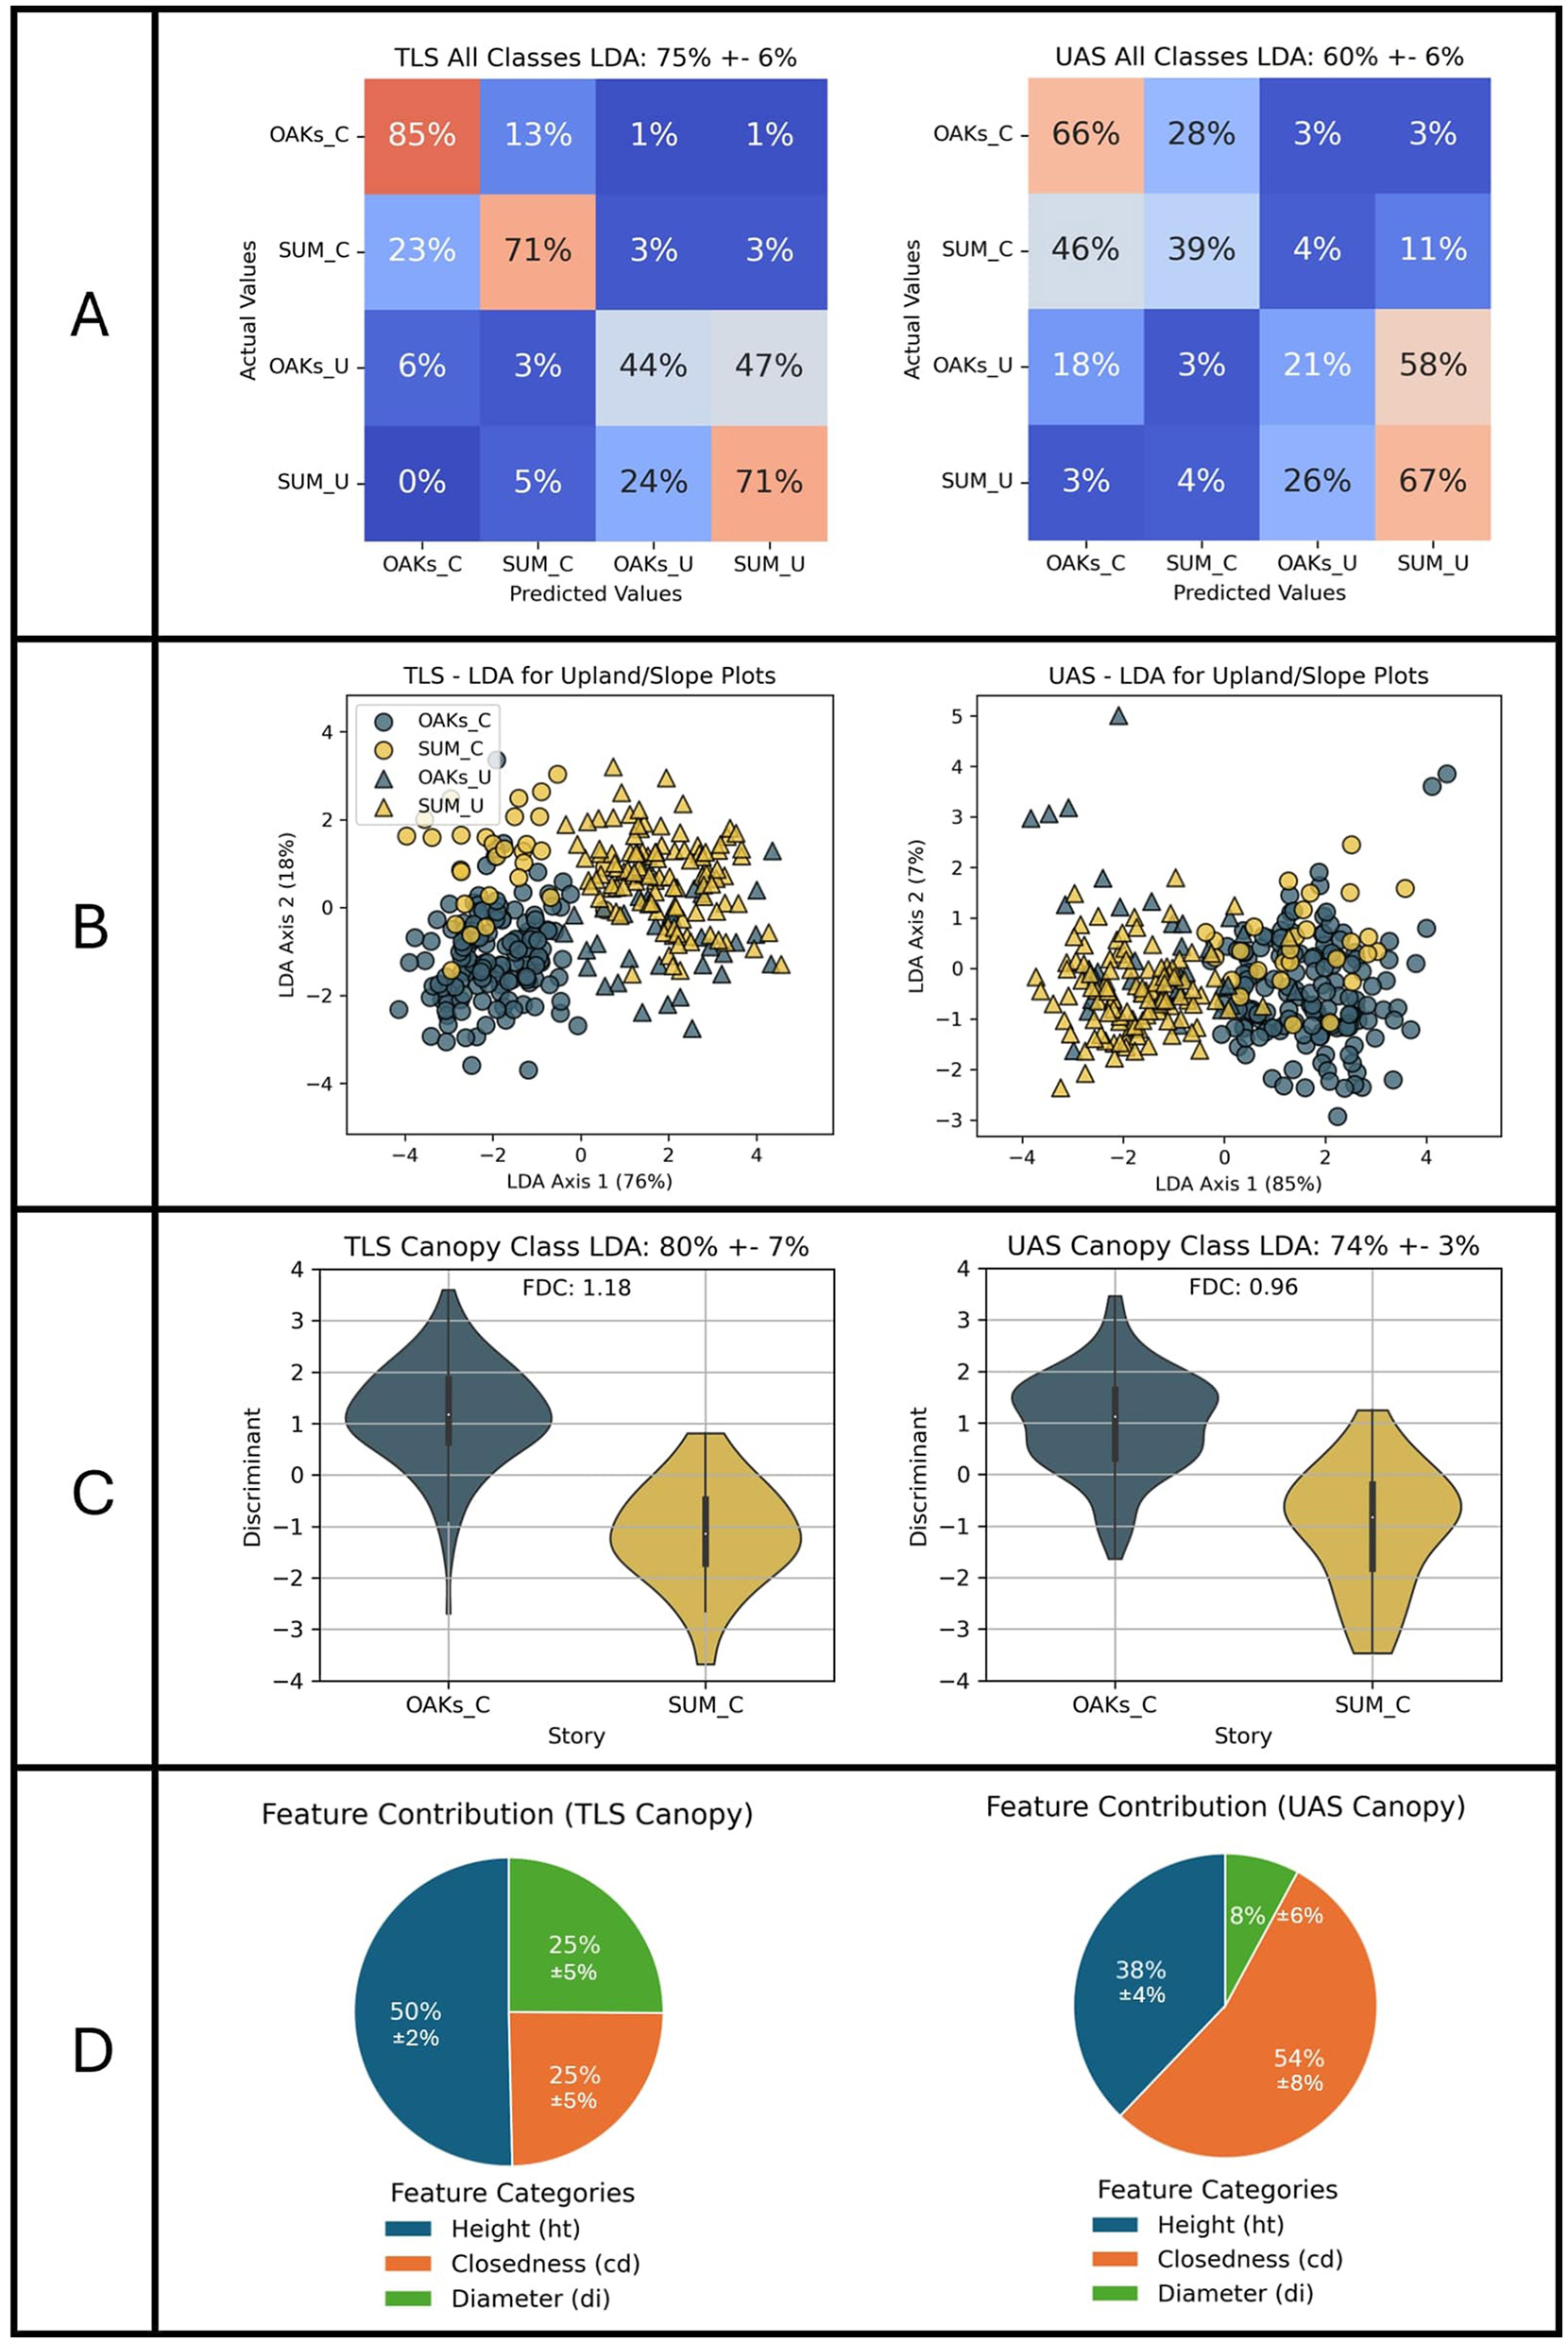
Results of the LDA species classification using TLS and UAS-derived features. (A) Confusion matrices showing the classification performance for each modality. (B) Scatter plots illustrating the separation between the four classes in the reduced feature space. To identify features that differentiate species, classification is performed between the canopy classes (C) and the percentage of contribution of each feature category is observed (D).
Observation 4: Species classification was far more accurate between canopy classed trees. Regardless of modality, the results of LDA classification showed less confusion between oaks and sugar maples within the canopy class than within the understory. In the TLS data, canopy oaks and sugar maples were classified with 85% and 70% accuracy, respectively, while understory oaks and sugar maples were classified with 44% and 72%, respectively. The UAS-based features showed a similar pattern, achieving 71% and 40% in the canopy, and significant misclassification of oaks in the understory. These results match our observations of individual feature separability that indicated there was more separability between canopy species and are shown by the confusion matrix found in Figure 10A.
Observation 5: Tree height-related parameters dominate class separability among the four groups. Following an assessment of classification performance, we examined the coefficients of the LDA axes. We first plotted each tree sample by its LDA axis score (Figure 10B). A visual assessment indicates that canopy (circles) and understory (triangles) trees are primarily separated along LDA axis-1. Deeper investigation of the coefficients of axis-1 shows that the largest contributors to axis-1 are the absolute height parameters (Figure 10C). Features such as average height (ht_avg), the height of the maximum normalized diameter (ht_di_max), maximum height (ht_max), and standard deviation of heights (ht_std) contribute significantly to axis-1 and are highly correlated with it. For TLS-derived features, 78% of the total class separability is driven by tree height, while for UAS-derived features, this proportion increases to 85%. This dominance of height-related parameters suggests that other structural differences between classes may be masked, limiting the discriminative power of additional features.
Observation 6: Diameter features are more important for species classification in TLS data, while closedness features are better for UAS data. While LDA axis-1 primarily separates canopy and understory classes based on height parameters, LDA axis-2 differentiates oaks from sugar maples (this can be seen by again referring to the plot of LDA axes in Figure 10B), Species separation is more pronounced in canopy trees than in understory trees, as seen in the greater distinction between their LDA scores. Examining the coefficient contributions of axis-2 (Figure 10D) reveals that while height-related features still influence class separation, diameter-based features, such as the height of the maximum normalized diameter (ht_di_max) and normalized height of maximum diameter (di_ratio_1), show the strongest correlation with axis-2 in TLS data. In contrast, closedness features, including standard deviation of closedness (cd_std), average closedness (cd_avg), and the normalized maximum closedness (cd_ratio_2), exhibit the highest correlation in UAS data. Although individual feature separability analysis previously identified diameter and closedness as key discriminators for species classification, the LDA results reveal a more nuanced pattern: diameter features play a dominant role in species separation when using TLS data, whereas closedness features are more effective for classification in UAS data.
These observations further highlight that UAS data has more difficulty separating species compared to TLS data. The key reason for this is that the shape of the understory, which holds the most distinct structural features, is obscured by the canopy in UAS LiDAR due to its look angle. As a result, modality influences how features are designed to capture the same physical phenomenon. While TLS data can directly sample the branches of the understory, UAS data must rely on features that capture the density of the canopy layers, limiting its ability to distinguish species effectively.
4 Discussion
4.1 Modality-specific feature design
Our findings underscore the critical role of modality-specific feature design in maximizing species classification performance based on structural differences. Few, if any, studies have directly compared feature extraction strategies for TLS and UAS LiDAR using the same forest samples. We show that structural differences between species manifest differently in the feature space depending on the data modality. In particular, the shape of the understory emerges as a key determinant of species identity, as it reflects species-specific growth strategies. However, the utility of structural features is strongly influenced by how each modality samples the forest.
TLS, with its ground-based perspective, captures the understory in detail and enables direct measurements of tree profile diameters at multiple heights. These width-based features were the strongest species discriminators in our TLS dataset. In contrast, UAS point clouds suffer from significant occlusion in the understory, introducing noise into profile measurements. Instead, features capturing canopy closedness and vertical layering—such as branch density and canopy compactness—proved more informative in UAS data. Our feature importance analysis highlights this contrast: TLS enables species classification through direct structural measurement, while UAS requires indirect proxies, with canopy closedness emerging as a particularly effective feature in this study.
4.2 Use of TLS data in natural forests
While prior studies have used TLS data for species classification, most rely on low-occlusion multi-scan datasets or detailed 3D models of individual trees (Terryn et al., 2020; Åkerblom et al., 2017; Lin and Herold, 2016). In contrast, our study demonstrates that even single-scan TLS data—despite its higher occlusion rates and incomplete sampling—can support species classification when features are carefully designed to capture robust structural patterns. Because single-scan data can be collected more quickly and requires minimal pre-processing, expanding its use from capturing purely structural measurements to qualitative traits, such as species identity, offers a more efficient alternative for field-based ecological assessments. The ability to extract species information from single-scan TLS will be a meaningful step toward integrating TLS data collection into routine forest inventory workflows, thereby propelling existing monitoring efforts and supporting faster development of labeled datasets for training machine learning models.
4.3 Feature extraction in northern hardwood forests
Feature design strategies cannot focus solely on modality; the expected structure of the forest must also be considered. Many published methods for species classification from lidar, particularly those using aerial or UAS LiDAR, segment individual trees using the perimeters of tree crowns. While effective in forests with sparse understory, such as boreal or managed stands, this method often merges dominant trees with neighboring subordinates in denser forests (Holmgren and Persson, 2004; Li et al., 2013a; Jeronimo et al., 2018). In this study, we have implemented many of the curve-based features widely used in previous studies, but adapted the tree segmentation methodology to suit northern hardwood forests and their characteristic dense understories. It is this robust tree segmentation that enabled our study to extract useful metrics from the understory; metrics that captured the most structural difference between the dominant trees.
Our findings highlight the necessity of region-specific structural feature design. The structural differences we observed—oaks forming progressively widening crowns and sugar maples retaining broad lower branches—reflect species-specific responses to local competition dynamics. This is an example of gene-environment interaction: shade-intolerant oaks shed lower branches as they mature (U.S. Department of Agriculture, Natural Resources Conservation Service, 2001, 2002), while shade-tolerant sugar maples allocate resources to lateral growth while maintaining apical dominance in anticipation of canopy recruitment. At Martell Forest, where old oaks dominate the canopy, the differences between species are most apparent in the canopy because maples that have recruited into the canopy class tend to be younger and retain their high-competition, shade-tolerant characteristics, as sugar maple shade tolerance may decline with size (Sendall et al., 2015). Therefore, our feature design would presumably generalize to areas that reflect both the species diversity and the maturity level of Martell Forest, for, as we show, both the geometric complexity of the forest and an understanding of how the target species reshape themselves to accommodate their environment are necessary to consider in feature design.
4.4 Study limitations
While our results are promising, several limitations must be acknowledged. First, our classification focused on oaks and sugar maples, the two most abundant species in our dataset. Although other species were present, sample sizes were too small to support robust analysis, especially after stratifying by canopy position and terrain class. Future studies should incorporate a wider range of species to examine the generalizability of our findings.
Second, our results are site-specific. Martell Forest has a particular species composition, with oaks dominating the canopy and sugar maples dominating the understory. Since competition, age, and local site conditions influence tree shape, other environments may yield different structural patterns. Additional studies are needed in forests with different dominant species in each canopy class to evaluate the repeatability of our structural features and classification results.
4.5 Broader implications and future work
This study contributes to the broader technological push toward automated forest inventory systems by clarifying how structural data, from both terrestrial and aerial LiDAR, can support species identification in structurally complex forests. We offer three primary contributions to this effort. First, we demonstrate that single-scan TLS data, when paired with robust feature design, can extend beyond structural measurement to support species classification. This opens a path for more efficient ground-based workflows that can scale across forest inventories and facilitate the creation of labeled datasets for machine learning.
Second, our findings demonstrate that structural information from occluded modalities can contribute to species identification. It is widely accepted that automating species identification at the individual tree level requires an integration of structural and spectral data inputs (Balestra et al., 2024; Terryn et al., 2020; Pu, 2021). Capturing species-specific structural differences more efficiently from single-scan TLS will expedite the capture of the needed structural metrics. Which, when integrated with other data streams, may provide much more robust insights than structural or spectral features alone. Spectral imagery tracks the physiological and phenotypic responses of the canopy, and is especially effective when used in a time series (Huang et al., 2025). However, the data cannot penetrate the canopy layers. In contrast, structural features derived from TLS and UAS LiDAR can characterize trees across canopy strata. These features change slowly, and thus are complementary to temporally dynamic spectral signatures. Structural features would augment spectral classification methods by accessing understory information invisible to spectral sensors.
Third, our findings offer guidance for designing more effective structural features for UAS-based LiDAR. In Hardwood forests, we've identified structural patterns that distinguish between the two dominant tree species. We further highlight the need for modality and environment-specific feature design. Structural trait visibility depends not only on sensor geometry but also on species-specific growth strategies and forest composition. In particular, the use of features like canopy closedness and vertical layering as proxies for understory structure may improve species classification from the air, even in occlusion-heavy environments.
5 Conclusions
Automating tree-level forest inventories is essential for improving forest monitoring workflows, but the lack of validation data remains a significant barrier to automation. Integrating TLS and UAS LiDAR into forest inventory workflows will accelerate ground reference data generation if automatic species classification can be reliably achieved from point cloud data. This study demonstrates that single-scan TLS and UAS LiDAR can detect structural differences between species. Our findings highlight the importance of understory descriptors for classification and propose modality-specific feature design strategies for capturing understory structure. We compared the effectiveness of multiple features for classifying oaks and sugar maples by analyzing the separability of these species within and across the canopy layers of natural forest. We found that oaks and sugar maples have distinct profile shapes that are detectable in single-scan TLS data and, to a lesser degree, in UAS data. For TLS data, the diameter height curve supplied the most separation between species, since the profile of the tree's shape is directly sampled. However, since the understory is highly occluded in UAS LiDAR, features related to the density of successive canopy layers (such as canopy closedness) contributed more to species separation from the UAS data.
These findings contribute to the development of LiDAR-based species classification by identifying the structural attributes most informative for each modality in complex, mixed-species forests. Importantly, our use of single-scan TLS data demonstrates that meaningful structural differences can be detected with occluded data, significantly reducing the collection and processing time needed to implement TLS data. Our results demonstrate the importance of understory structure in distinguishing species and highlight the need for feature extraction strategies that account for modality-specific constraints, such as occlusion in UAS LiDAR. By demonstrating the effectiveness of modality-specific feature design, species classification from single-scan TLS, and the applicability of these methods in northern hardwood forests, this work provides methodological insights that will improve the accuracy and efficiency of automated tree-level inventories, ultimately supporting more robust forest monitoring and management practices.
Statements
Data availability statement
The datasets generated and analyzed for this study can be found here: https://stac.d2s.org/collections/martell-forest-benchmark-data.
Author contributions
JC: Conceptualization, Data curation, Formal analysis, Investigation, Methodology, Software, Visualization, Writing – original draft, Writing – review & editing. MJ: Conceptualization, Data curation, Investigation, Methodology, Software, Writing – review & editing. AG: Conceptualization, Investigation, Methodology, Visualization, Writing – review & editing. SF: Supervision, Writing – review & editing. JJ: Funding acquisition, Supervision, Writing – review & editing.
Funding
The author(s) declare that financial support was received for the research and/or publication of this article. This research was partially supported by the Purdue Integrated Digital Forestry Initiative. Work by Minyoung Jung and Jinha Jung was supported by the U.S. Department of Agriculture, National Institute of Food and Agriculture, Sustainable Agricultural Systems program, PERSEUS grant, #2023-68012-38992. The findings and conclusions in this work have not been formally disseminated by the U. S. Department of Agriculture and should not be construed to represent any agency determination or policy.
Conflict of interest
The authors declare that the research was conducted in the absence of any commercial or financial relationships that could be construed as a potential conflict of interest.
Generative AI statement
The author(s) declare that no Gen AI was used in the creation of this manuscript.
Any alternative text (alt text) provided alongside figures in this article has been generated by Frontiers with the support of artificial intelligence and reasonable efforts have been made to ensure accuracy, including review by the authors wherever possible. If you identify any issues, please contact us.
Publisher’s note
All claims expressed in this article are solely those of the authors and do not necessarily represent those of their affiliated organizations, or those of the publisher, the editors and the reviewers. Any product that may be evaluated in this article, or claim that may be made by its manufacturer, is not guaranteed or endorsed by the publisher.
References
1
Åkerblom M. Raumonen P. Mäkipää R. Kaasalainen M. (2017). Automatic tree species recognition with quantitative structure models. Remote Sens. Environ. 191, 1–12. 10.1016/j.rse.2016.12.002
2
Abegg M. Bösch R. Kükenbrink D. Morsdorf F. (2023). Tree volume estimation with terrestrial laser scanning—testing for bias in a 3D virtual environment. Agric. For. Meteorol. 331:109348. 10.1016/j.agrformet.2023.109348
3
Allen C. D. Breshears D. D. McDowell N. G. (2015). On underestimation of global vulnerability to tree mortality and forest die-off from hotter drought in the Anthropocene. Ecosphere6:art129. 10.1890/ES15-00203.1
4
Allen M. J. Grieve S. W. D. Owen H. J. F. Lines E. R. (2023). Tree species classification from complex laser scanning data in Mediterranean forests using deep learning. Methods Ecol. Evol. 14, 1657–1667. 10.1111/2041-210X.13981
5
Alonzo M. Bookhagen B. Roberts D. A. (2014). Urban tree species mapping using hyperspectral and lidar data fusion. Remote Sens. Environ. 148, 70–83. 10.1016/j.rse.2014.03.018
6
Alonzo M. Roth K. Roberts D. (2013). Identifying Santa Barbara's urban tree species from AVIRIS imagery using canonical discriminant analysis. Remote Sens. Lett. 4, 513–521. 10.1080/2150704X.2013.764027
7
Ashcroft M. B. Gollan J. R. Ramp D. (2014). Creating vegetation density profiles for a diverse range of ecological habitats using terrestrial laser scanning. Methods Ecol. Evol. 5, 263–272. 10.1111/2041-210X.12157
8
Atkins J. W. Bohrer G. Fahey R. T. Hardiman B. S. Morin T. H. Stovall A. E. L. et al . (2018). Quantifying vegetation and canopy structural complexity from terrestrial LiDAR data using the forestr r package. Methods Ecol. Evol. 9, 2057–2066. 10.1111/2041-210X.13061
9
Balestra M. Marselis S. Sankey T. T. Cabo C. Liang X. Mokroš M. et al . (2024). LiDAR data fusion to improve forest attribute estimates: a review. Curr. For. Rep. 10, 281–297. 10.1007/s40725-024-00223-7
10
Batchelor J. L. Wilson T. M. Olsen M. J. Ripple W. J. (2022). New structural complexity metrics for forests from single terrestrial lidar scans. Remote Sens. 15:145. 10.3390/rs15010145
11
Bishop C. M. (2006). Pattern Recognition and Machine Learning. New York, NY: Springer.
12
Bonan G. B. (2008). Forests and climate change: forcings, feedbacks, and the climate benefits of forests. Science320, 1444–1449. 10.1126/science.1155121
13
Brandt L. He H. Iverson L. Thompson F. R. Butler P. Handler S. et al . (2014). Central Hardwoods Ecosystem Vulnerability Assessment and Synthesis: A Report from the Central Hardwoods Climate Change Response Framework Project. Technical report. Newtown Square, PA: U.S. Department of Agriculture. 10.2737/NRS-GTR-124
14
Brandtberg T. Warner T. A. Landenberger R. E. McGraw J. B. (2003). Detection and analysis of individual leaf-off tree crowns in small footprint, high sampling density lidar data from the eastern deciduous forest in North America. Remote Sens. Environ. 85, 290–303. 10.1016/S0034-4257(03)00008-7
15
Breidenbach J. Granhus A. Hylen G. Eriksen R. Astrup R. (2020). A century of National Forest Inventory in Norway - informing past, present, and future decisions. For. Ecosyst. 7:46. 10.1186/s40663-020-00261-0
16
Carpenter J. Jung J. Oh S. Hardiman B. Fei S. (2022). An unsupervised canopy-to-root pathing (UCRP) tree segmentation algorithm for automatic forest mapping. Remote Sens. 14:4274. 10.3390/rs14174274
17
Carpenter J. Rentauskas D. Makkar N. Jung J. Fei S. (2023). Improving deciduous forest inventory plot center measurement using unoccupied aerial systems imagery. J. For. 121, 262–271. 10.1093/jofore/fvad008
18
Chan A. H. Y. Barnes C. Swinfield T. Coomes D. A. (2021). Monitoring ash dieback (Hymenoscyphus fraxineus) in British forests using hyperspectral remote sensing. Remote Sens. Ecol. Conserv. 7, 306–320. 10.1002/rse2.190
19
Chirici G. Giannetti F. McRoberts R. E. Travaglini D. Pecchi M. Maselli F. et al . (2020). Wall-to-wall spatial prediction of growing stock volume based on Italian National Forest Inventory plots and remotely sensed data. Int. J. Appl. Earth Observ. Geoinf. 84:101959. 10.1016/j.jag.2019.101959
20
Fei S. Morin R. S. Oswalt C. M. Liebhold A. M. (2019). Biomass losses resulting from insect and disease invasions in US forests. Proc. Nat. Acad. Sci. 116, 17371–17376. 10.1073/pnas.1820601116
21
Fraser B. T. Congalton R. G. (2019). Evaluating the effectiveness of Unmanned Aerial Systems (UAS) for collecting thematic map accuracy assessment reference data in New England forests. Forests10:24. 10.3390/f10010024
22
Gale D. Shapley L. S. (1962). College admissions and the stability of marriage. Am. Math. Mon. 69, 9–15. 10.1080/00029890.1962.11989827
23
Gauthier S. Bernier P. Burton P. J. Edwards J. Isaac K. Isabel N. et al . (2014). Climate change vulnerability and adaptation in the managed Canadian boreal forest. Environ. Rev. 22, 256–285. 10.1139/er-2013-0064
24
Gollob C. Ritter T. Wassermann C. Nothdurft A. (2019). Influence of scanner position and plot size on the accuracy of tree detection and diameter estimation using terrestrial laser scanning on forest inventory plots. Remote Sens. 11:1602. 10.3390/rs11131602
25
Hakkenberg C. R. Song C. Peet R. K. White P. S. (2016). Forest structure as a predictor of tree species diversity in the North Carolina Piedmont. J. Veg. Sci. 27, 1151–1163. 10.1111/jvs.12451
26
Hardiman B. S. Bohrer G. Gough C. M. Vogel C. S. Curtis P. S. (2011). The role of canopy structural complexity in wood net primary production of a maturing northern deciduous forest. Ecology92, 1818–1827. 10.1890/10-2192.1
27
Hartmann H. Bastos A. Das A. J. Esquivel-Muelbert A. Hammond W. M. Martínez-Vilalta J. et al . (2022). Climate change risks to global forest health: emergence of unexpected events of elevated tree mortality worldwide. Annu. Rev. Plant Biol. 73, 673–702. 10.1146/annurev-arplant-102820-012804
28
Hernández-Stefanoni J. L. Reyes-Palomeque G. Castillo-Santiago M. N. George-Chacón S. P. Huechacona-Ruiz A. H. Tun-Dzul F. et al . (2018). Effects of sample plot size and GPS location errors on aboveground biomass estimates from LiDAR in tropical dry forests. Remote Sens. 10:1586. 10.3390/rs10101586
29
Holmgren J. Persson S. (2004). Identifying species of individual trees using airborne laser scanner. Remote Sens. Environ. 90, 415–423. 10.1016/S0034-4257(03)00140-8
30
Huang Y. Hou S. Ling H. Xu H. (2018). Trunk volume prediction of individual Populus euphratica trees based on point clouds analysis. Ecol. Indic. 95, 964–971. 10.1016/j.ecolind.2018.06.062
31
Huang Y. Yang B. Carpenter J. Jung J. Fei S. (2025). Temperate forest tree species classification with winter UAV images. Remote Sens. Appl. Soc. Environ. 37:101422. 10.1016/j.rsase.2024.101422
32
Jaganmohan M. Knapp S. Buchmann C. M. Schwarz N. (2016). The bigger, the better? The influence of urban green space design on cooling effects for residential areas. J. Environ. Qual. 45, 134–145. 10.2134/jeq2015.01.0062
33
Jeronimo S. M. A. Kane V. R. Churchill D. J. McGaughey R. J. Franklin J. F. (2018). Applying LiDAR individual tree detection to management of structurally diverse forest landscapes. J. For. 116, 336–346. 10.1093/jofore/fvy023
34
Jonsson M. Bengtsson J. Gamfeldt L. Moen J. Snäll T. (2019). Levels of forest ecosystem services depend on specific mixtures of commercial tree species. Nat. Plants5, 141–147. 10.1038/s41477-018-0346-z
35
Kangas A. Astrup R. Breidenbach J. Fridman J. Gobakken T. Korhonen K. T. et al . (2018). Remote sensing and forest inventories in Nordic countries-roadmap for the future. Scand. J. For. Res. 33, 397–412. 10.1080/02827581.2017.1416666
36
Kangas A. Maltamo M. (2006). Forest Inventory: Methodology and Applications, Volume 10. Cham: Springer Science & Business Media. 10.1007/1-4020-4381-3
37
Kankare V. Liang X. Vastaranta M. Yu X. Holopainen M. Hyyppä J. (2015). Diameter distribution estimation with laser scanning based multisource single tree inventory. ISPRS J. Photogramm. Remote Sens. 108, 161–171. 10.1016/j.isprsjprs.2015.07.007
38
Korpela I. S. Tokola T. E. (2006). Potential of aerial image-based monoscopic and multiview single-tree forest inventory: a simulation approach. Forest Sci. 52, 136–147. 10.1093/forestscience/52.2.136
39
Krok G. Kraszewski B. Stereńczak K. (2020). Application of Terrestrial Laser Scanning in Forest Inventory-An Overview of Selected Issues.Sekocin Stary: Instytut Badawczy Lesnictwa (Forest Research Institute). 10.2478/frp-2020-0021
40
Kükenbrink D. Marty M. Bösch R. Ginzler C. (2022). Benchmarking laser scanning and terrestrial photogrammetry to extract forest inventory parameters in a complex temperate forest. Int. J. Appl. Earth Observ. Geoinf. 113:102999. 10.1016/j.jag.2022.102999
41
Li J. Hu B. Noland T. L. (2013a). Classification of tree species based on structural features derived from high density LiDAR data. Agric. For. Meteorol. 171, 104–114. 10.1016/j.agrformet.2012.11.012
42
Li M. Im J. Beier C. (2013b). Machine learning approaches for forest classification and change analysis using multi-temporal Landsat TM images over Huntington Wildlife Forest. GISci. Remote Sens. 50, 361–384. 10.1080/15481603.2013.819161
43
Liang X. Hyyppä J. Kaartinen H. Lehtomäki M. Pyörälä J. Pfeifer N. et al . (2018a). International benchmarking of terrestrial laser scanning approaches for forest inventories. ISPRS J. Photogramm. Remote Sens. 144, 137–179. 10.1016/j.isprsjprs.2018.06.021
44
Liang X. Kankare V. Xiaowei Yu Hyyppa, J. Holopainen M. (2014). Automated stem curve measurement using terrestrial laser scanning. IEEE Trans. Geosci. Remote Sens. 52, 1739–1748. 10.1109/TGRS.2013.2253783
45
Liang X. Kukko A. Hyyppä J. Lehtomäki M. Pyörälä J. Yu X. et al . (2018b). In-situ measurements from mobile platforms: an emerging approach to address the old challenges associated with forest inventories. ISPRS J. Photogramm. Remote Sens. 143, 97–107. 10.1016/j.isprsjprs.2018.04.019
46
Lin Y. Herold M. (2016). Tree species classification based on explicit tree structure feature parameters derived from static terrestrial laser scanning data. Agric. For. Meteorol. 216, 105–114. 10.1016/j.agrformet.2015.10.008
47
Lister A. J. Andersen H. Frescino T. Gatziolis D. Healey S. Heath L. S. others et al . (2020). Use of remote sensing data to improve the efficiency of national forest inventories: a case study from the United States national forest inventory. Forests11:1364. 10.3390/f11121364
48
Liu B. Huang H. Su Y. Chen S. Li Z. Chen E. et al . (2022). Tree species classification using ground-based LiDAR data by various point cloud deep learning methods. Remote Sens. 14:5733. 10.3390/rs14225733
49
Liu M. Han Z. Chen Y. Liu Z. Han Y. (2021). Tree species classification of LiDAR data based on 3D deep learning. Measurement177:109301. 10.1016/j.measurement.2021.109301
50
Maltamo M. Packalen P. (2014). “Species-specific management inventory in Finland,” in Forestry Applications of Airborne Laser Scanning. Managing Forest Ecosystems, Vol. 27, eds. M. Maltamo, E. Næsset, and J. Vauhkonen (Dordrecht: Springer), 241–252. 10.1007/978-94-017-8663-8_12
51
Mayamanikandan T. Reddy S. Fararoda R. Thumaty K. C. Praveen M. S. S. Rajashekar G. et al . (2022). Quantifying the influence of plot-level uncertainty in above ground biomass up scaling using remote sensing data in central Indian dry deciduous forest. Geocarto Int. 37, 3489–3503. 10.1080/10106049.2020.1864029
52
Næsset E. (2007). Airborne laser scanning as a method in operational forest inventory: status of accuracy assessments accomplished in Scandinavia. Scand J. For. Res. 22, 433–442. 10.1080/02827580701672147
53
Næsset E. Gobakken T. Holmgren J. Hyyppä H. Hyyppä J. Maltamo M. et al . (2004). Laser scanning of forest resources: the Nordic experience. Scand. J. For. Res. 19, 482–499. 10.1080/02827580410019553
54
Ørka H. O. Næsset E. Bollandsås O. M. (2009). Classifying species of individual trees by intensity and structure features derived from airborne laser scanner data. Remote Sens. Environ. 113, 1163–1174. 10.1016/j.rse.2009.02.002
55
Oswalt S. Smith W. Miles P. Pugh S. (2019). Forest Resources of the United States, 2017: A Technical Document Supporting the Forest Service 2020 RPA Assessment.Gen. Tech. Rep. WO-97. Washington, DC: US Department of Agriculture, Forest Service, Washington Office, 97. 10.2737/WO-GTR-97
56
Oveland I. Hauglin M. Giannetti F. Schipper Kjørsvik N. Gobakken T. (2018). Comparing three different ground based laser scanning methods for tree stem detection. Remote Sens. 10:538. 10.3390/rs10040538
57
Pedregosa F. Varoquaux G. Gramfort A. V. Michel B. Thirion B. Grisel O. et al . (2011). Scikit-learn: machine learning in Python. J. Mach. Learn. Res. 12, 2825–2830.
58
Pu R. (2021). Mapping tree species using advanced remote sensing technologies: a state-of-the-art review and perspective. J. Remote Sens. 2021:9812624. 10.34133/2021/9812624
59
Puttonen E. Jaakkola A. Litkey P. Hyyppä J. (2011). Tree classification with fused mobile laser scanning and hyperspectral data. Sensors11, 5158–5182. 10.3390/s110505158
60
Reddy R. S. Jha C. S. Rajan K. S. (2018). Automatic tree identification and diameter estimation using single scan terrestrial laser scanner data in central Indian forests. J. Indian Soc. Remote Sens. 46, 937–943. 10.1007/s12524-018-0753-7
61
Schneider F. D. Kükenbrink D. Schaepman M. E. Schimel D. S. Morsdorf F. (2019). Quantifying 3D structure and occlusion in dense tropical and temperate forests using close-range LiDAR. Agric. For. Meteorol. 268, 249–257. 10.1016/j.agrformet.2019.01.033
62
Sendall K. M. Lusk C. H. Reich P. B. (2015). Becoming less tolerant with age: sugar maple, shade, and ontogeny. Oecologia179, 1011–1021. 10.1007/s00442-015-3428-x
63
Sprugel D. G. Rascher K. G. Gersonde R. Dovčiak M. Lutz J. A. Halpern C. B. (2009). Spatially explicit modeling of overstory manipulations in young forests: Effects on stand structure and light. Ecol. Modell. 220, 3565–3575. 10.1016/j.ecolmodel.2009.07.029
64
Stovall A. E. L. Vorster A. Anderson R. Evangelista P. (2023). Developing nondestructive species-specific tree allometry with terrestrial laser scanning. Methods Ecol. Evol. 14, 280–290. 10.1111/2041-210X.14027
65
Terryn L. Calders K. Disney M. Origo N. Malhi Y. Newnham G. et al . (2020). Tree species classification using structural features derived from terrestrial laser scanning. ISPRS J. Photogramm. Remote Sens. 168, 170–181. 10.1016/j.isprsjprs.2020.08.009
66
U.S. Department of Agriculture Natural Resources Conservation Service. (2001). Northern Red Oak (Quercus rubra L.) Plant Guide.Baton Rouge, LA: National Plant Data Center. Available online at: https://plants.usda.gov/
67
U.S. Department of Agriculture Natural Resources Conservation Service. (2002). White Oak (Quercus alba L.) Plant Guide.Baton Rouge, LA: National Plant Data Center. Available online at: https://plants.usda.gov/
68
Vauhkonen J. Maltamo M. McRoberts R. E. Næsset E. (2014a). “Introduction to forestry applications of airborne laser scanning,” in Forestry Applications of Airborne Laser Scanning. Managing Forest Ecosystems, eds. M. Maltamo, E. Næsset, and J. Vauhkonen (Cham: Springer), 1–16. 10.1007/978-94-017-8663-8_1
69
Vauhkonen J. Ørka H. O. Holmgren J. Dalponte M. Heinzel J. Koch B. (2014b). “Tree species recognition based on airborne laser scanning and complementary data sources,” in Forestry Applications of Airborne Laser Scanning- Concepts and Case Studies, eds. M. Maltamo, E. Næsset, and J. Vauhkonen (Cham: Springer), 135–156. 10.1007/978-94-017-8663-8_7
70
Vorster A. G. Evangelista P. H. Stovall A. E. L. Ex S. (2020). Variability and uncertainty in forest biomass estimates from the tree to landscape scale: the role of allometric equations. Carbon Balance Manag. 15:8. 10.1186/s13021-020-00143-6
71
Wilkes P. Lau A. Disney M. Calders K. Burt A. Gonzalez de Tanago J. et al . (2017). Data acquisition considerations for terrestrial laser scanning of forest plots. Remote Sens. Environ. 196, 140–153. 10.1016/j.rse.2017.04.030
72
Zhao G. Maclean A. L. (2000). A comparison of canonical discriminant analysis and principal component analysis for spectral transformation. PE&RS Photogramm. Eng. Remote Sens. 66, 841–847.
Summary
Keywords
tree structure architecture, unmanned aerial vehicle, forest inventories, species classification, terrestrial laser scanning
Citation
Carpenter J, Jung M, Goel A, Fei S and Jung J (2025) Modality-specific feature design for species classification in forest inventories using TLS and UAS LiDAR. Front. For. Glob. Change 8:1500178. doi: 10.3389/ffgc.2025.1500178
Received
22 September 2024
Accepted
15 October 2025
Published
31 October 2025
Volume
8 - 2025
Edited by
Meili Wang, Northwest A&F University, China
Reviewed by
Emilio Ramírez-Juidías, Universidad de Sevilla Instituto Universitario de Arquitectura y Ciencias de la Construccion, Spain
Yuanshuo Hao, Northeast Forestry University, China
Updates
Copyright
© 2025 Carpenter, Jung, Goel, Fei and Jung.
This is an open-access article distributed under the terms of the Creative Commons Attribution License (CC BY). The use, distribution or reproduction in other forums is permitted, provided the original author(s) and the copyright owner(s) are credited and that the original publication in this journal is cited, in accordance with accepted academic practice. No use, distribution or reproduction is permitted which does not comply with these terms.
*Correspondence: Minyoung Jung jung411@purdue.edu
Disclaimer
All claims expressed in this article are solely those of the authors and do not necessarily represent those of their affiliated organizations, or those of the publisher, the editors and the reviewers. Any product that may be evaluated in this article or claim that may be made by its manufacturer is not guaranteed or endorsed by the publisher.