 Rinto Wiarta1,2,3
 Rato Firdaus Silamon1,2,4
 Mohammed Ishag Arbab1,5
 Muhammad Tariq Badshah1,2
 Umer Hayat6
 Jinghui Meng1,2*
- 1Forest Management, School of Forestry, Beijing Forestry University, Beijing, China
- 2Research Center of Forest Management Engineering of National Forestry and Grassland Administration, Beijing Forestry University, Beijing, China
- 3Environmental Engineering, Faculty of Engineering, Nahdlatul Ulama University Kalimantan Barat, Kubu Raya, Indonesia
- 4Department of Forestry, Faculty of Agriculture, Mataram University, Mataram, Indonesia
- 5State Forestry and Grassland Administration Key Laboratory of Forest Resources and Environmental Management Beijing Forestry University, Beijing, China
- 6State Key Laboratory of Integrated Management of Pest Insects and Rodents, Institute of Zoology, Chinese Academy of Sciences, Beijing, China
Land cover change information is needed to support decision-making in land-based natural resource management, especially in coastal areas and mangrove ecosystems. This study aims to assess the drivers and detect mangrove forest cover change over the last 30 years in Kubu Raya District, Indonesia, using satellite imagery data from the United States Geological Survey (USGS) Earth Explorer. Maximum Likelihood Classification was used to analyze satellite images from four different recording years digitally: 1993 (Landsat 5), 2003 (Landsat 7), 2013 and 2023 (Landsat 8). Getis-Ord Gi* analysis was also used to observe fragmentation distribution patterns to determine areas with hot spots or cold spots with the Reticular Fragmentation Index (RFI) value as a consideration. Binary Logistic Regression (BLR) analysis was used to assess the drivers of social and natural variables, including population density, education, accessibility, soil type, rainfall, temperature, slope, and elevation. The results showed a significant decrease in mangrove forest cover, from 1,011.37 km2 in 1993–964.37 km2 in 2023, with an average loss of mangrove forest cover of 3.25 km2 per year, including mangroves, open areas, ponds, water bodies, agricultural areas, and settlements. The fragmentation pattern that occurs is that in some areas in the northern part, there are insignificant points in 1993 and then turn into hot spots in 2023. Meanwhile, from 1993 to 2023, there were cold spots that shifted and spread in the central part of the study area. In addition, social and natural variables provide values that are directly and inversely proportional to the driving factors. Social factors, especially population density, education, and land access, have a relationship with land change. Regulations made by the government and the presence of an educated community are the main points for mangrove ecosystem conservation; existing land access is not used as exploitation access but only for daily activities. Natural factors, such as alluvial soil types, have a high concentration of nutrients, making them ideal for sustainable agriculture and ponds. Rainfall intensity contributes to higher agricultural production and stable pond water. Conservation efforts must consider these changes and spatial dynamics to effectively protect mangrove ecosystems in the future.
1 Introduction
Globally, mangrove forests are found in approximately 120 countries (Gandhi and Jones, 2019; Menéndez et al., 2020). Indonesia is an archipelago that has the largest mangrove forest area in the world, and Indonesian mangroves can be found around the tropical line with more than 17,504 islands (Das et al., 2022; Giri, 2023; Sumarga et al., 2023). Mangrove forests are unique in their constituent plants, which are a combination of characteristics of plants that live inland and coastal (Lai et al., 2022; Rodda et al., 2022; Wiarta et al., 2019; Worthington et al., 2020). Mangrove forests can protect coastal areas from erosion and flooding caused by storms and tides (Menéndez et al., 2020; Trégarot et al., 2021; Wu, 2021). Indonesia now has 33,640.8 km2 of mangrove forests, accounting for 20% of the world’s total (Sidik et al., 2023), but in the last seventeen years, mangrove forest area has declined in some areas, even at an alarming rate of forest cover change (Bhowmik et al., 2022; Kaskoyo et al., 2023). The continuous increase in human population has converted large areas of mangrove forests into agriculture, aquaculture and plantations, compromising coastal areas’ environmental protection and balance functions (Newton et al., 2020; Sahavacharin et al., 2022).
Land use and land cover (LULC) is an increase in land use from one side to the other, followed by a decrease in the other over time (Montalván-Burbano et al., 2021; Twisa and Buchroithner, 2019). LULC is the result of various interactions between people and their environment, thus reflecting the impact of human activities on nature (Duan et al., 2023; Fang et al., 2022; Liu et al., 2022; Liu et al., 2020). This phenomenon also affects surrounding mangrove ecosystems and occurs in developing countries (Hasan et al., 2023; Hoque et al., 2022; Mishra et al., 2021). Land cover change can affect the magnitude of peak discharge and trigger flooding in forest areas (Aghsaei et al., 2020; Li and Bortolot, 2022; Sugianto et al., 2022), physical and biological soil processes at the earth’s surface (Chaemiso et al., 2021; Kidane et al., 2019; Ozsahin et al., 2018), as well as landscape change, plant and animal extinction, and other environmental consequences (Olorunfemi et al., 2020; Roy et al., 2022). Landscape loss can affect biodiversity stability and connectivity and is one of the consequences of fragmentation and deforestation (Mansori et al., 2023). Forest fragmentation can affect biodiversity through four main mechanisms: (1) sampling effects (representativeness); (2) area size (area effects); (3) isolation (isolation effects); and (4) edge effects (Jacobson et al., 2019; Palmeirim et al., 2021). These effects can also impact population and ecosystem distribution levels (Hending et al., 2023; Hussain et al., 2024; Liu et al., 2019). In the vegetation health perspective, fragmentation can lead to ecosystem degradation due to increased edge effects, resulting in higher environmental stress on smaller, more isolated mangrove patches (Jaramillo et al., 2023), increased exposure to wind, solar radiation and salinity, which contributes to the physiological deterioration of mangrove trees and accelerates the process of structural degradation of the ecosystem (Noor et al., 2020). In the ecosystem services, habitat fragmentation decreases carbon storage capacity, reduces mangroves’ function as a coastal bulwark against abrasion and storms, and reduces fisheries productivity due to loss of spawning habitat for fish and other marine life (Ding et al., 2020; Li et al., 2022). Fragmentation can also increase the vulnerability of mangroves to land conversion as smaller fragments tend to be more susceptible to anthropogenic pressures, such as agricultural expansion, urbanization, and conversion to ponds (Ferreira et al., 2022; Ward et al., 2016). Biodiversity declines can be halted by lowering fragmentation rates and increasing connectivity (Anderson et al., 2023). Understanding the drivers of LULC change is a prerequisite for mitigating and managing the impacts and consequences of LULC (Arficho and Thiel, 2020; Benavidez-Silva et al., 2021). Analysis of the drivers of LULC change became a popular topic in the 1990s, mainly addressing how human and biophysical forces influence land use change (Wu et al., 2021; Zhai et al., 2020). Recent studies in many countries have shown that human activities are the main factor causing LULC change (Bhowmik et al., 2022; Duan et al., 2023; Liu et al., 2020; Newton et al., 2020; Olorunfemi et al., 2020; Zhai et al., 2020). To understand future land use conditions and to develop management plans, preliminary information on the drivers that cause LULC is needed (Benavidez-Silva et al., 2021; Hailu et al., 2020; Wu et al., 2021; Zhai et al., 2020).
Kubu Raya District is one of the areas in West Kalimantan Province that has experienced significant changes in forest cover (Sugiardi, 2020; Suratiningsih, 2023). Mangrove forests, which are high-value wetland forests, dominate Kubu Raya District in this province. Mangrove ecosystems in this area have been severely degraded and are declining, resulting in reduced ecological functions due to various factors. However, it has not been clearly recorded how mangrove forest changes occur, the current condition of the land cover, the pattern of fragmentation, and what are the driving factors that cause LULC changes. One of the first steps to investigate and provide a credible database on LULC change is to use multi-year classified image analysis. For this reason, this study was conducted to provide three comprehensive understandings of mangrove forest change. Specifically, this study aims to (1) evaluate LULC changes over a periodic period (10-year interval) from 1993 to 2023, (2) analyze fragmentation patterns, and (3) analyze drivers of mangrove forest change in Kubu Raya District, Indonesia.
2 Materials and methods
2.1 Study area
According to Central Statistics of Kubu Raya District (2022), Kubu Raya is the newest district in West Kalimantan Province and has been definitive since 2007. Kubu Raya District is geographically (Figure 1) located between 109° 03′ 11.48″ to 109° 58′ 23.50″ east longitude and 0° 13′ 47.16″ north latitude to 1°00′ 51.38″ south latitude. North latitude to 1°00′ 51.38″ South latitude. Kubu Raya District is bordered to the west by the Natuna Sea, Pontianak City and Mempawah to the north, Sanggau and Ketapang to the east, and North Kayong to the south. Amounting 609,392 people live in an area of 6,985.20 square kilometers, consisting of 4,785 square kilometers of land and 2,197 square kilometers of water, 39 small islands, and 149 square kilometers of coastline. The area is generally flat and has an average elevation of 84 m above sea level, with a percentage of 0–100 m by 20.2%, 101–500 m by 27.2%, 501–1,000 m by 26.7%, and 1,001 m and above by 25.9%. The Sub-districts of Sungai Kakap, Teluk Pakedai, Kubu, and Batu Ampar own mangrove forests in Kubu Raya District. In the study area, mangrove forests surround several rivers, tides, small channels, and small bays (Romañach et al., 2018; Sumani et al., 2021). In addition, many man-made waterways may cross mangrove forests (Krishnan and Ramasamy, 2022; Narmada and Annaidasan, 2019).
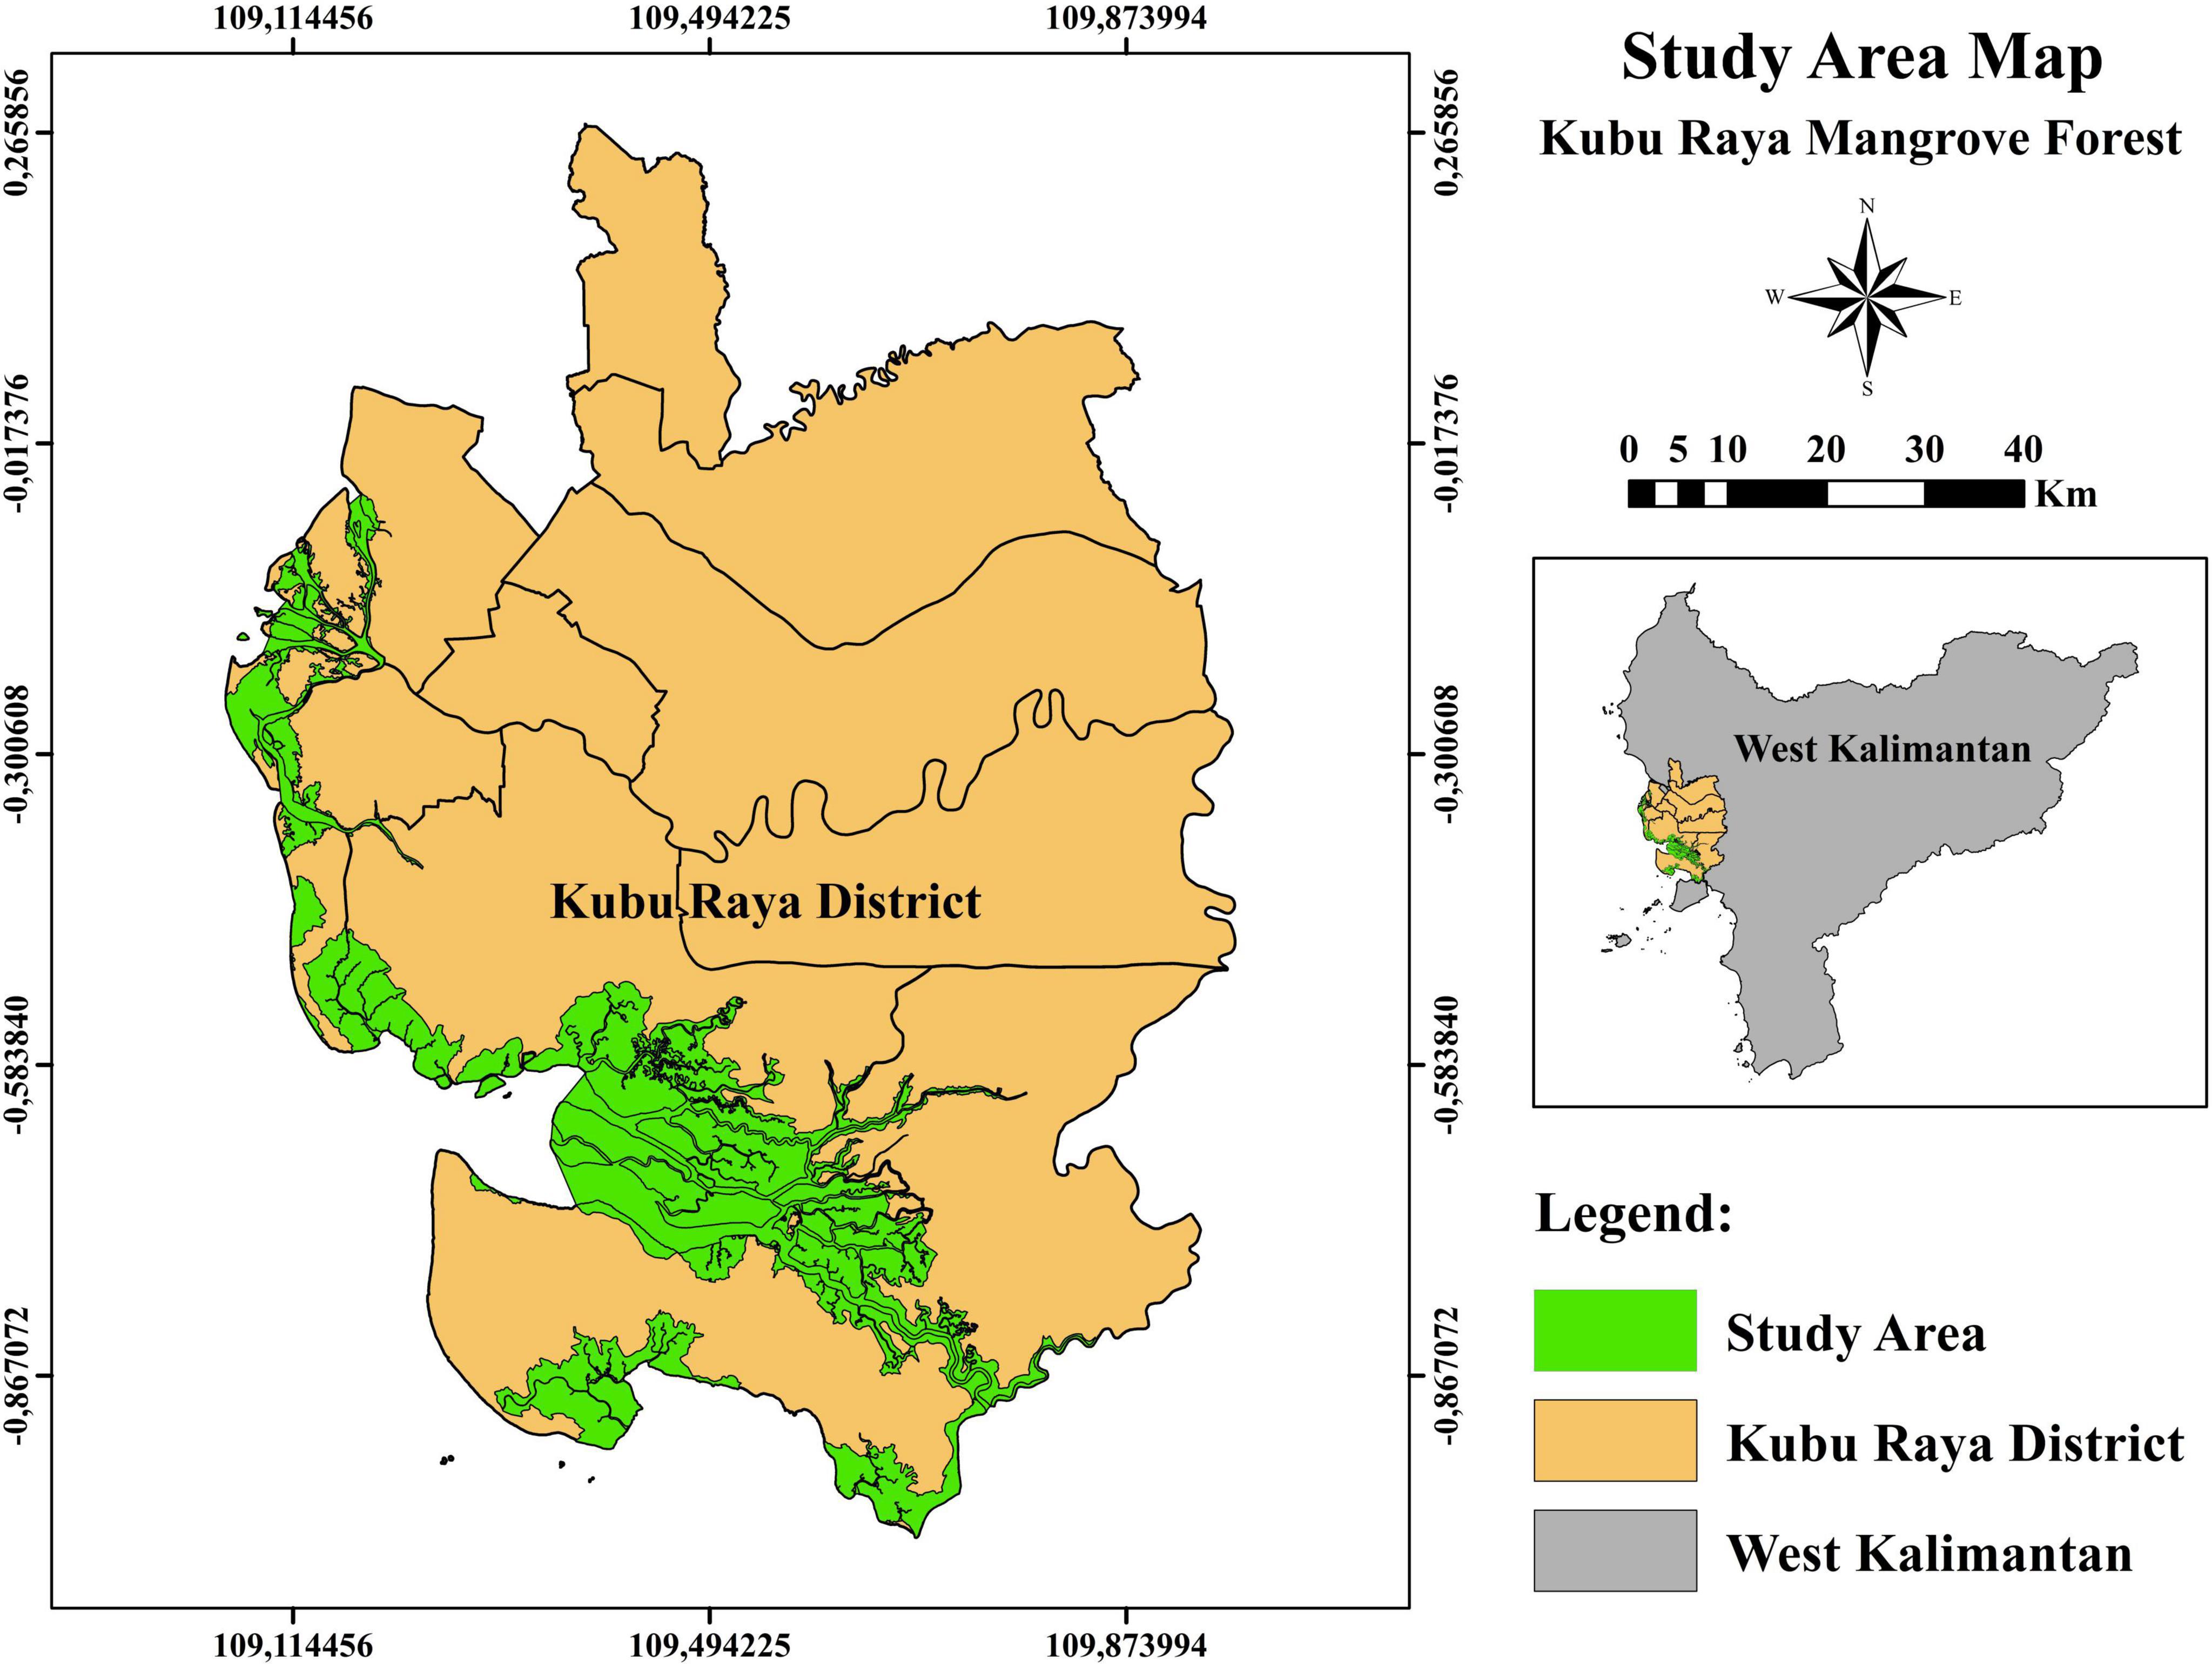
Figure 1. Study area.
2.2 Satellite image data processing and classification
In this study, Landsat image data covering the last 30 years (10-year interval) from 1993 to 2023 was downloaded from the Earth Explorer of the United States Geological Survey (USGS) (Table 1) and used to analyze changes in mangrove forest cover in the study area. In addition, the base map for the analysis was obtained from the Rupa Bumi Indonesia map.

Table 1. Characteristics of satellite imagery.
Digital image processing for each image was completed by creating composite photos, creating mosaic images, and performing classification to obtain land cover classes (Filippi et al., 2022; Saleem et al., 2021) at each year interval using ArcGIS 10.8 software (1993, 2003, 2013, and 2023). A guided classification method with a maximum likelihood classifier was used to determine the land classification (Chowdhury, 2024; Ganesh et al., 2023; Polat and Kaya, 2021). To improve classification accuracy, training samples are selected with sufficient homogeneity to be spectrally and spatially representative of each LULC class (Table 2). The training samples will determine the final LULC map and overall classification accuracy, which is the most important part of supervised classification (Amini et al., 2022; Ganesh et al., 2023).
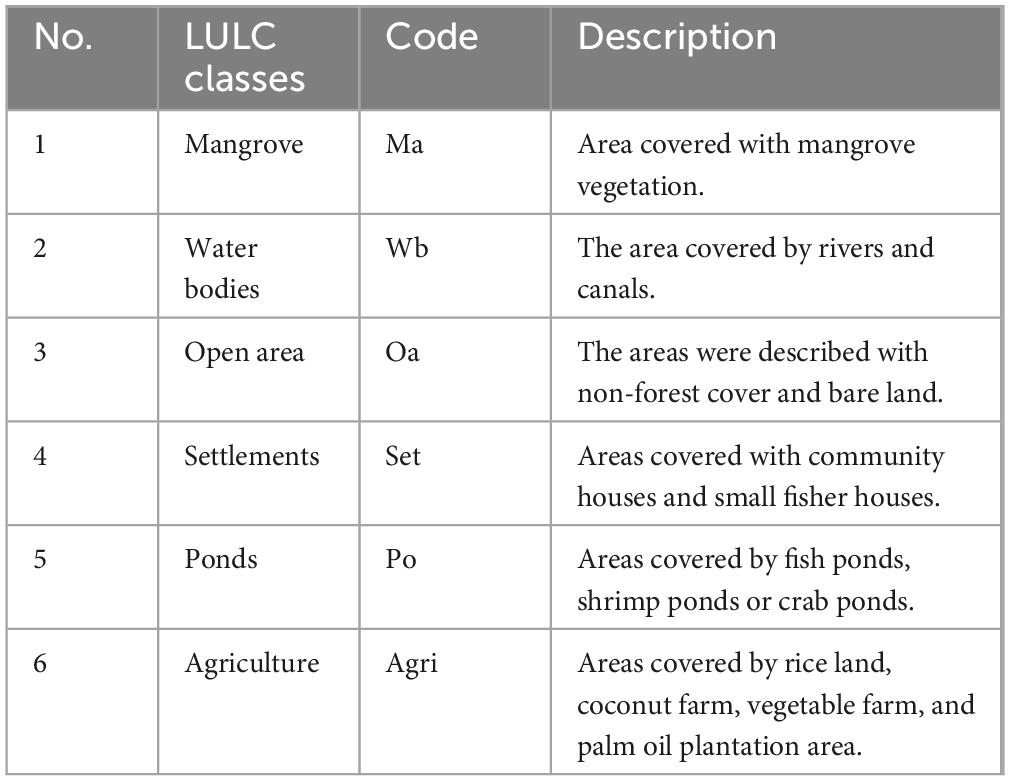
Table 2. Land classification categories.
2.3 Accuracy assessment
Accuracy refers to how well the map is created and conforms to the classification. A good approach to assessing accuracy and analyzing changes in forest areas is essential to ensure the veracity of land use change information (Galiatsatos et al., 2020; Hussain et al., 2024; Stehman and Foody, 2019). Accuracy assessment is conducted to improve classification accuracy to obtain maximum results (Badshah et al., 2024; Chakma et al., 2023). In this study, 150 samples were distributed each period across mangroves, water bodies, open areas, settlements, ponds, and agricultural land in the study area to evaluate the accuracy (Table 3). Google Earth Pro was used to assess accuracy for the period 1993–2013, with ground-truth verification conducted for 2023.

Table 3. Sampling distribution through classes.
The recommended accuracy to be used in the analysis is kappa accuracy, as it is considered the most relevant measure, and kappa accuracy considers all elements in the error matrix (Amini et al., 2022; Ganesh et al., 2023; Satapathy et al., 2024). Accuracy can be determined mathematically using Equations 1–4.
Where:
N = Number of pixels used
r = Number of rows or columns in the error matrix (number of classes)
Xi+ = Number of pixels in row i
X+i = Number of pixels in column i
Xii = Diagonal value of the ith row and ith column contingency matrix
2.4 LULCC detection 1993–2023
The analysis process was carried out using overlay techniques. The overlay technique used was the 1993, 2003, 2013, and 2023 mangrove forest land cover maps with the Kubu Raya Regency administrative boundary map, which resulted in a land cover map of the study area for each period. Then calculate the area per land cover per year and compare at each point of the observation year. The formula used to detect LULC is as follows (Equation 5) (Li S. et al., 2023; Yagoub et al., 2017):
2.5 Fragmentation pattern
Getis-Ord Gi* analysis was used to observe the fragmentation distribution pattern in order to determine which areas have hot spots or cold spots in the study area by considering the Reticular Fragmentation Index (RFI) values. Z-scores and P-values indicate significant differences in RFI values between the ranges considered high and low, with statistical significance at the 5% level (P ≤ 0.05). Z-scores above 1.96 are categorized as hot spots, while Z-scores below −1.96 are categorized as low spots. Z-scores between −1.96 and 1.96 are considered insignificant (P > 0.05), indicating the presence of random spatial processes (Jaramillo et al., 2023; Rivas et al., 2021). Getis-Ord Gi* analysis is a statistical method used to identify statistically significant spatial clusters with high values (hot spots) and low values (cold spots) in a geographic data set (Tola et al., 2021).
2.6 Driving factor analysis
The Binary Logistic Regression (BLR) analysis method was used to find the elements that influence land use change. BLR is a method to identify the relationship between categorical dependent variables and independent variables (Bera et al., 2020; Getu and Gangadhara Bhat, 2024; Pasaribu et al., 2020; Wang et al., 2020). The dependent variable in this study is based on the status of land use change (Y), with y = 0 indicating land change and y = 1 indicating no land change. At the same time the independent variables use variables X1: population density (people/km2), X2: education level (from low to high education), X3: river access, X4: land access [distance between the study area and the road), X5: soil (soil type), X6: rainfall (average/year (30 years)], X7: temperature [average/year (30 years)], X8: slope (flat to very steep), and X9: elevation (low to high). These variables were used to identify the drivers of land change in mangrove forests in the study area. ArcGIS 10.8 was used to combine variables assumed to be drivers of land use change with data on land use change. Each independent variable data uses a scoring system, and the matrix formula (Equation 6):
Where:
Log: the natural logarithm; P: the success probability on the binary dependent variable.
a: constant (intercept); βn: independent variable regression coefficient estimator (Xi)
Xn: a dependent variable whose influence will be studied
3 Results
3.1 Accuracy assessment
The land cover classification successfully categorized the study area into six classes: mangrove, water body, open area, residential, pond, and agriculture. The classification results demonstrated a high level of accuracy. The producer accuracy (PA) and user accuracy (UA) values ranged from 80 to 99%, indicating a strong agreement between classified outputs and reference data. The overall accuracy (OA) reached an average of 94.6%, and the kappa coefficient (KA) values were close to 1, confirming a substantial level of agreement beyond chance (Table 4).
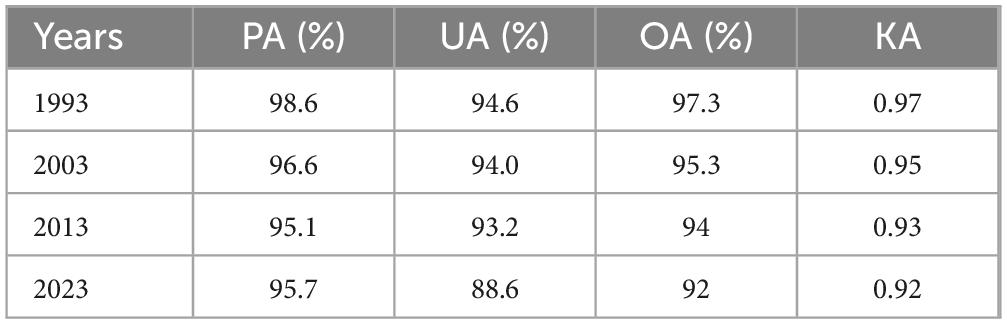
Table 4. Confusing matrix image 1993–2023.
3.2 LULC changes detection from 1993 to 2023
3.2.1 Land cover 1993–2023
The land cover analysis used 1993, 2003, 2013, and 2023 imagery. Land cover is classified into six categories: mangrove, water body, open area, residential, pond, and agriculture (Figure 2). The land cover classification result is displayed in square kilometers (Figure 3). Mangrove forests still dominated in 1993, 2003, 2013, and 2023, with an area of 1011.37, 1011.85, 960.20, and 964.36 km2, respectively. The area of mangrove forest cover decreased from 1,011.37 km2 (1993) to 960.20 km2 (2013) and a slight increase of 964.36 km2 in 2023. The total land area that changed was 97.68 km2, with an average annual change of 3.25 km2 during the monitoring period.
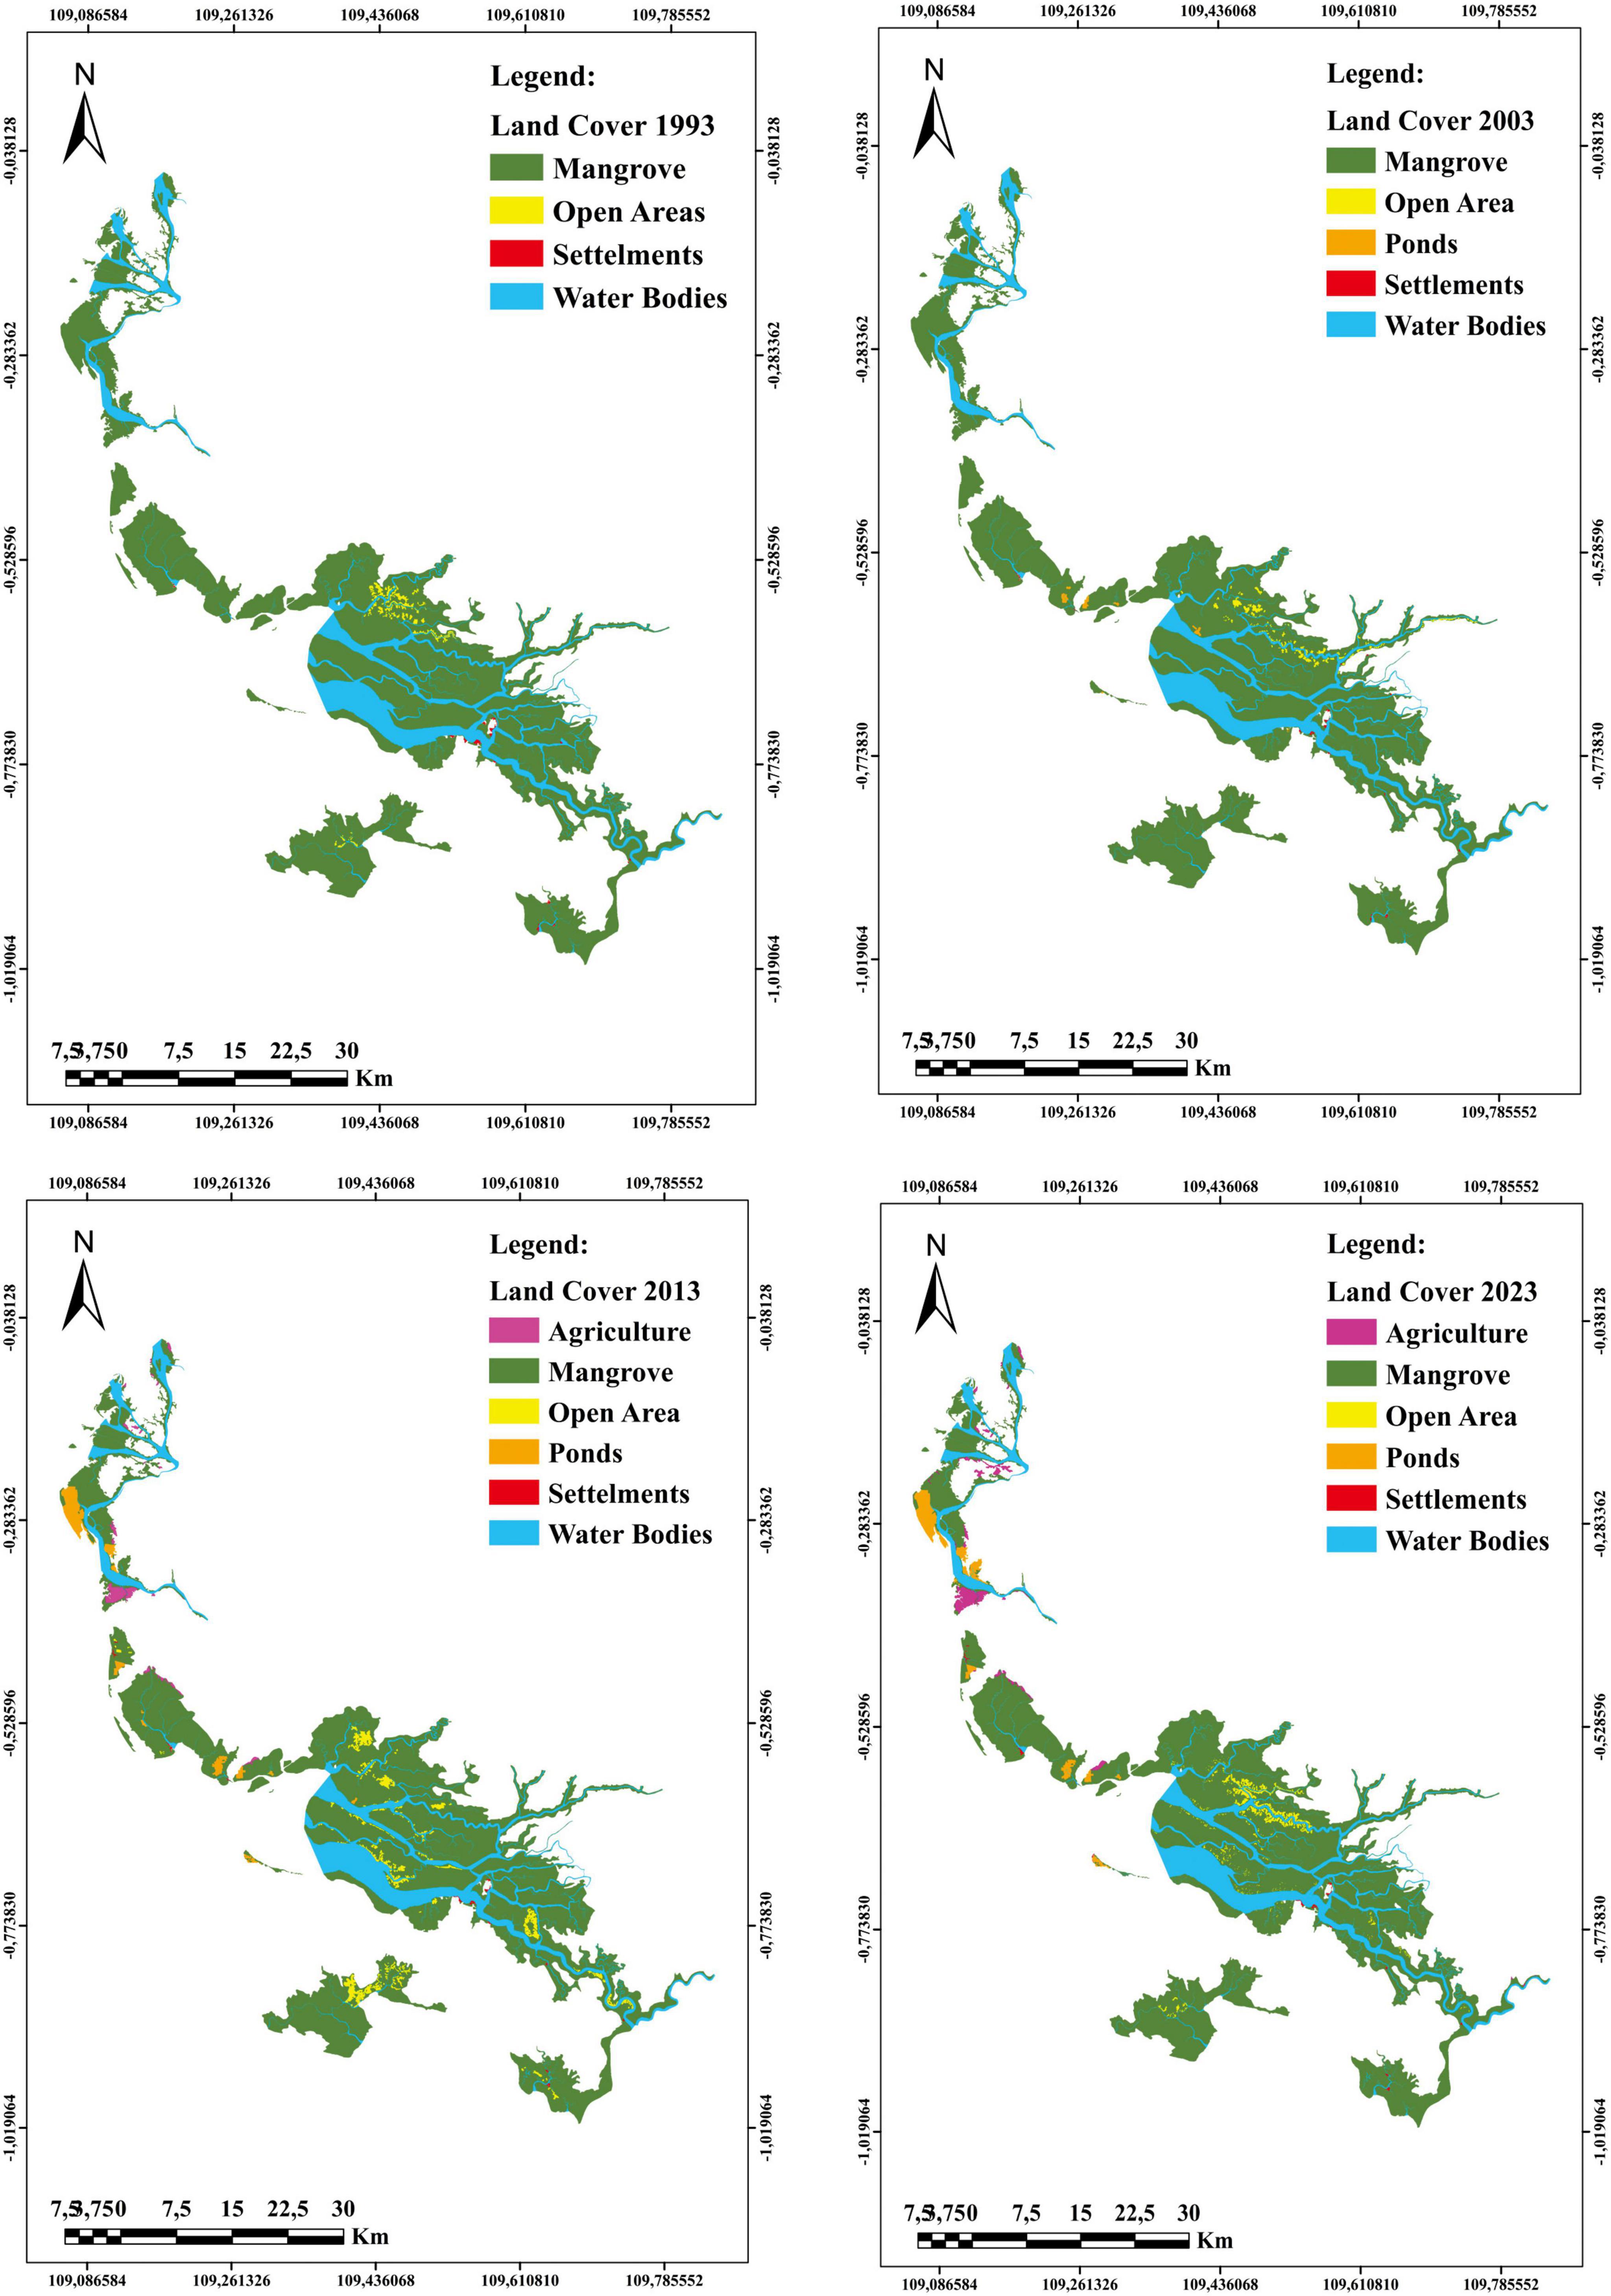
Figure 2. Kubu Raya mangrove forest covers 1993–2023.
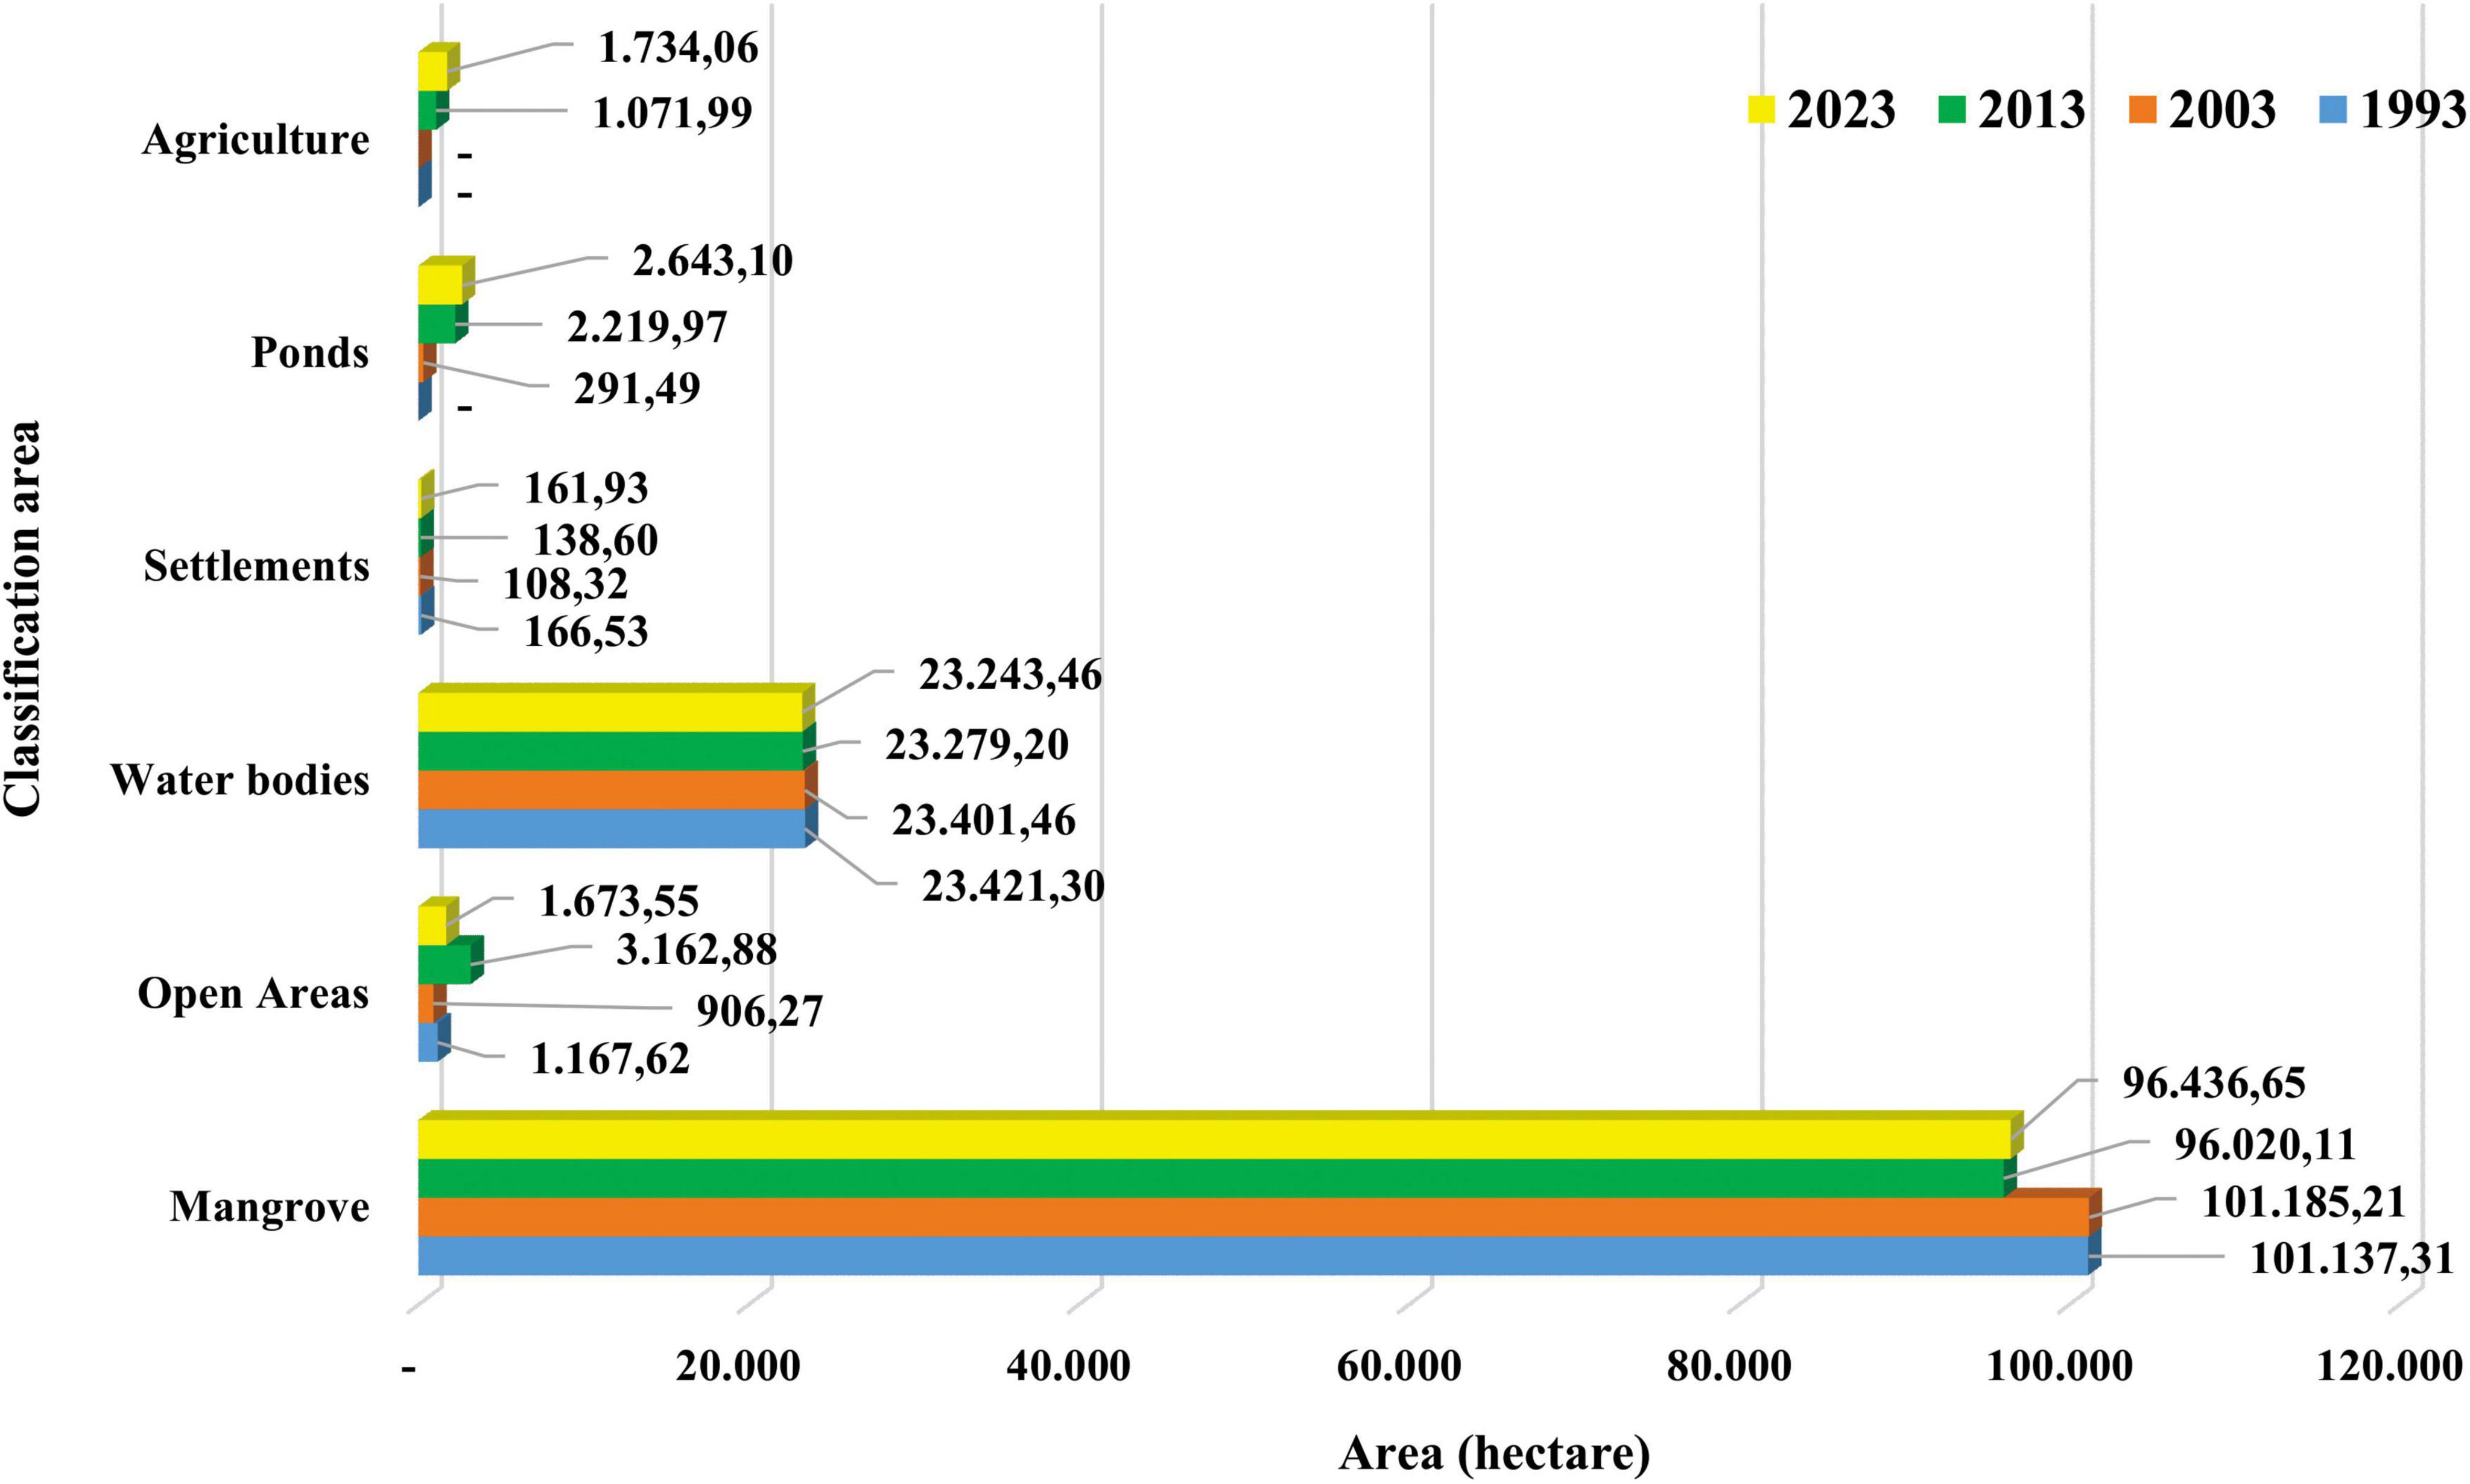
Figure 3. Mangrove forest area in 1993–2023.
3.2.2 Change detection 1993–2023
3.2.2.1 1993–2003
During the LULC identification process, five land cover classes occurred between 1993 and 2003 (Table 5). During this period, significant changes occurred in each class. Mangrove forests changed into open areas by 8.18 km2, mangrove forests into settlements by 0.31 km2, and mangrove forests into ponds by 2.89 km2. In contrast, settlement areas turned into aquaculture and into mangrove forests, totaling 0.016 and 10.90 km2, respectively. In addition, water bodies turned into settlement areas by 0.06 km2 (Figure 4a).
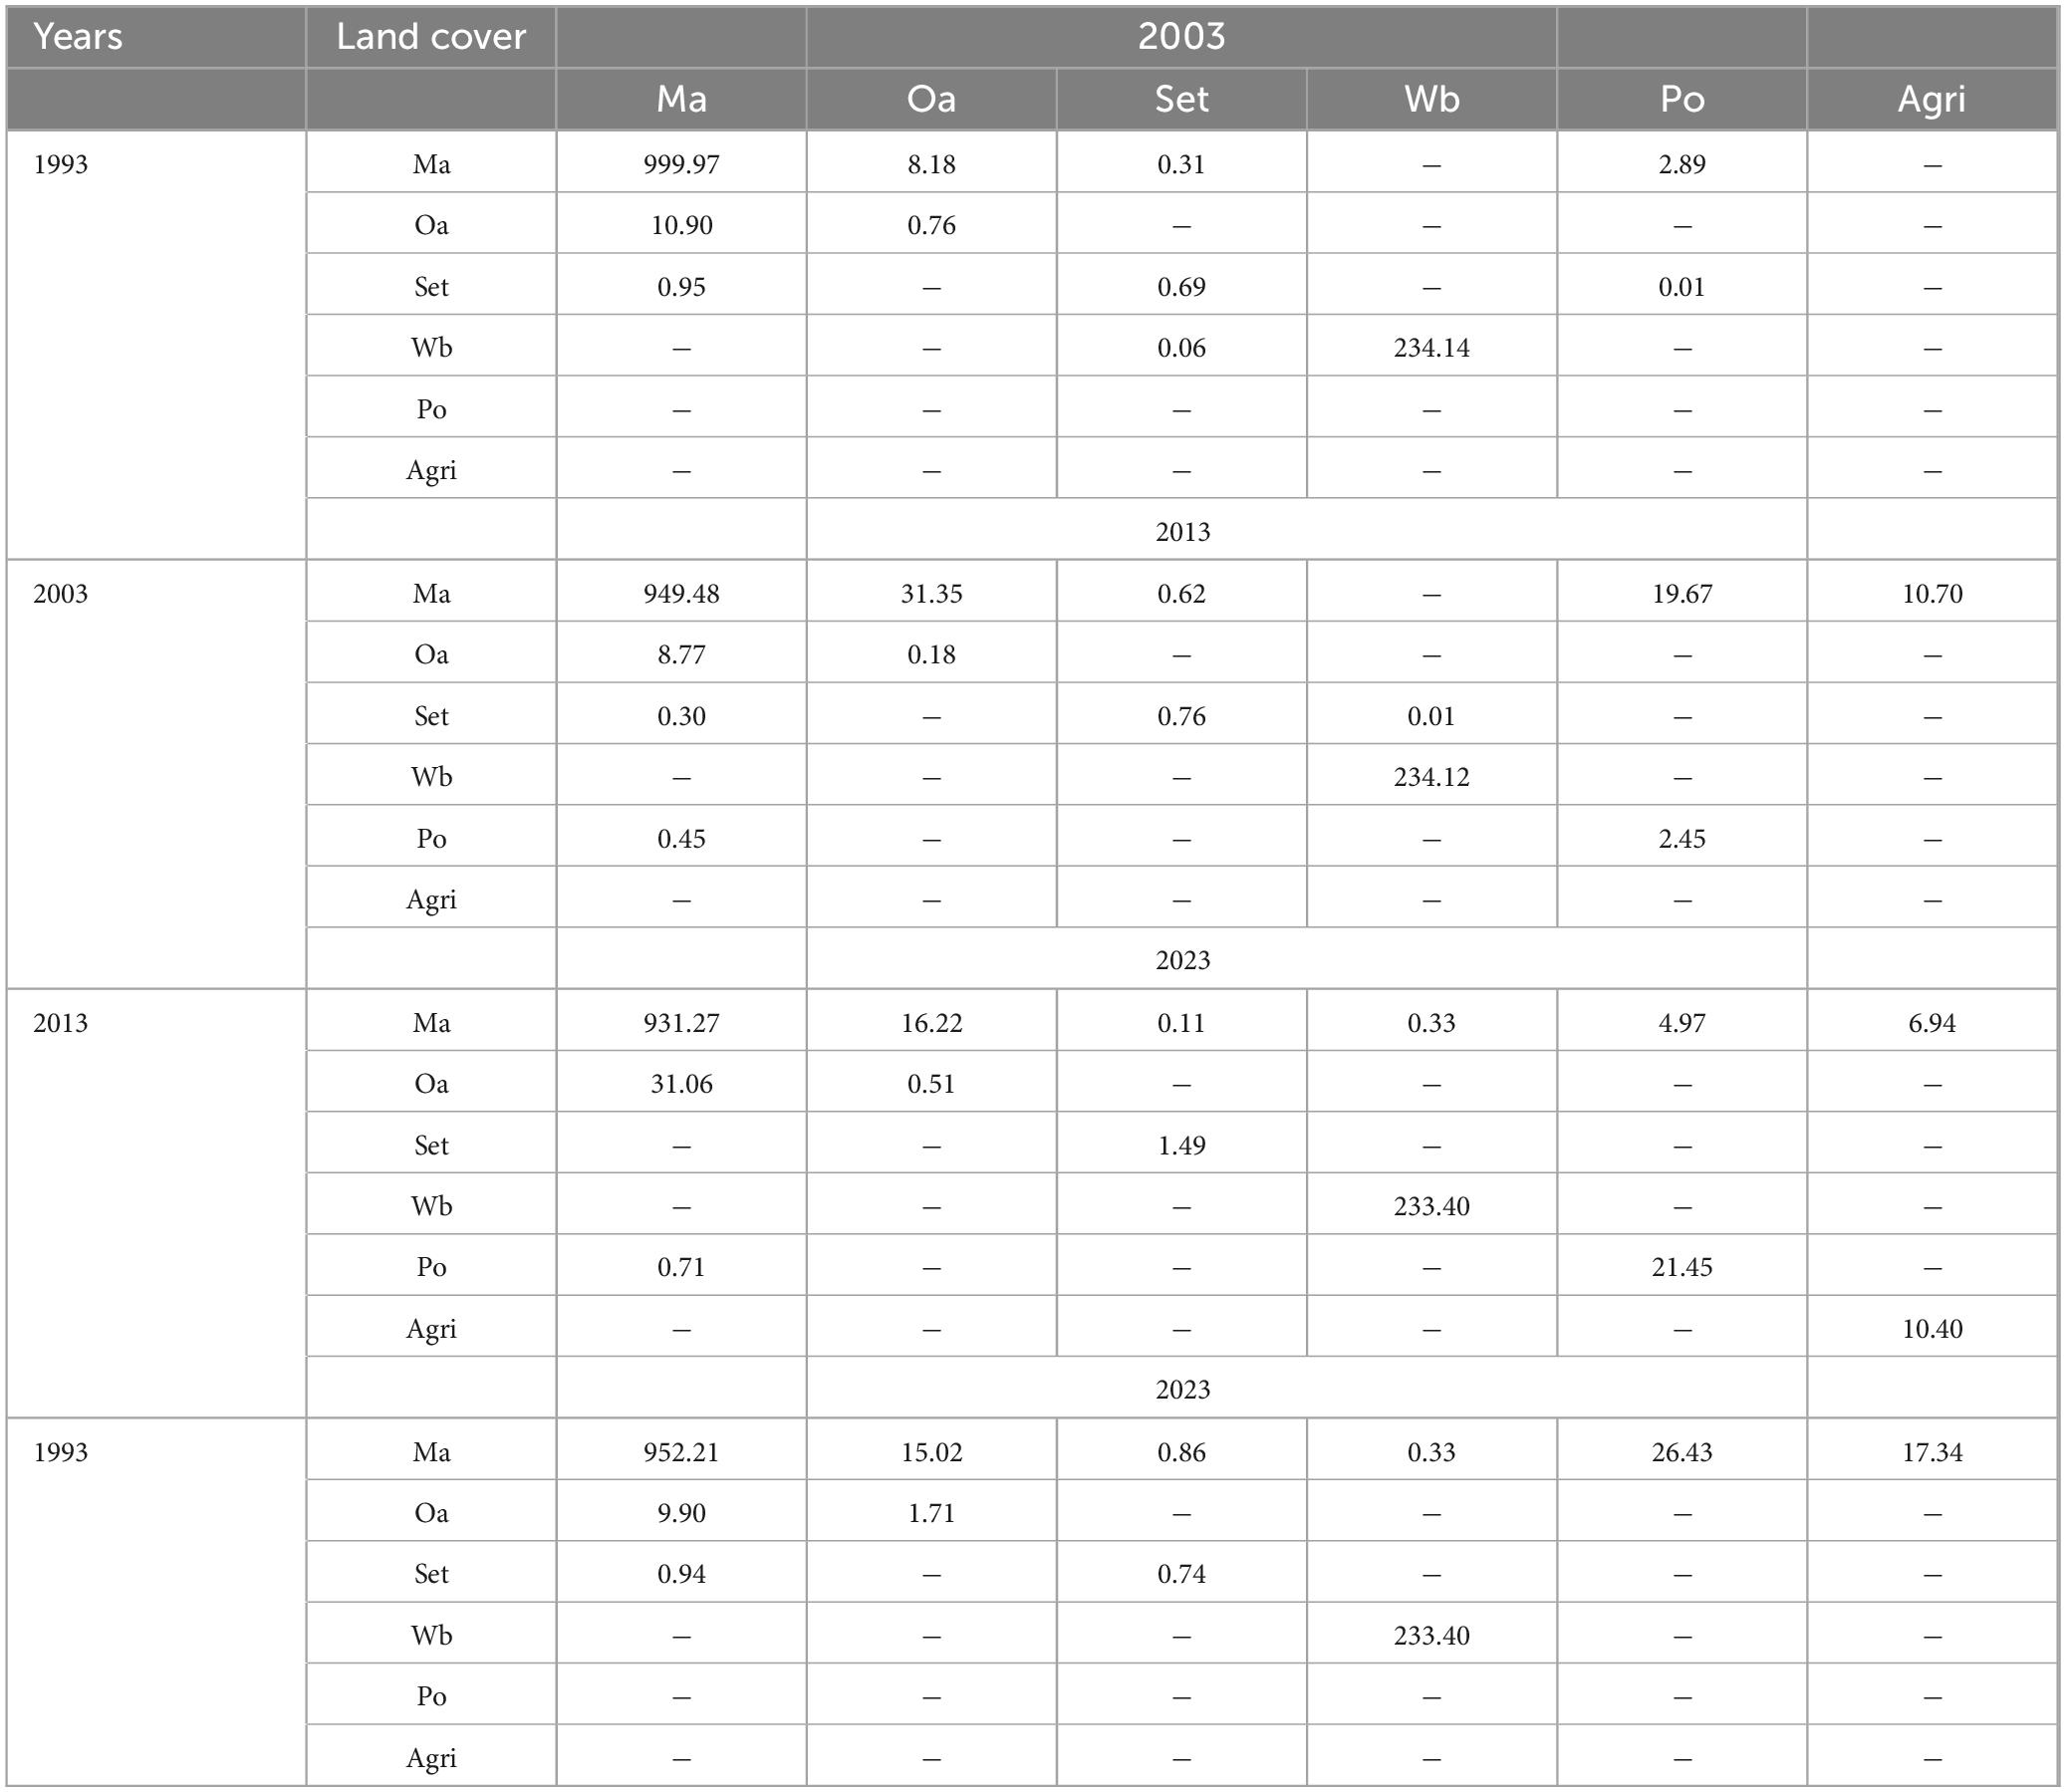
Table 5. Land cover changes from 1993 to 2023.
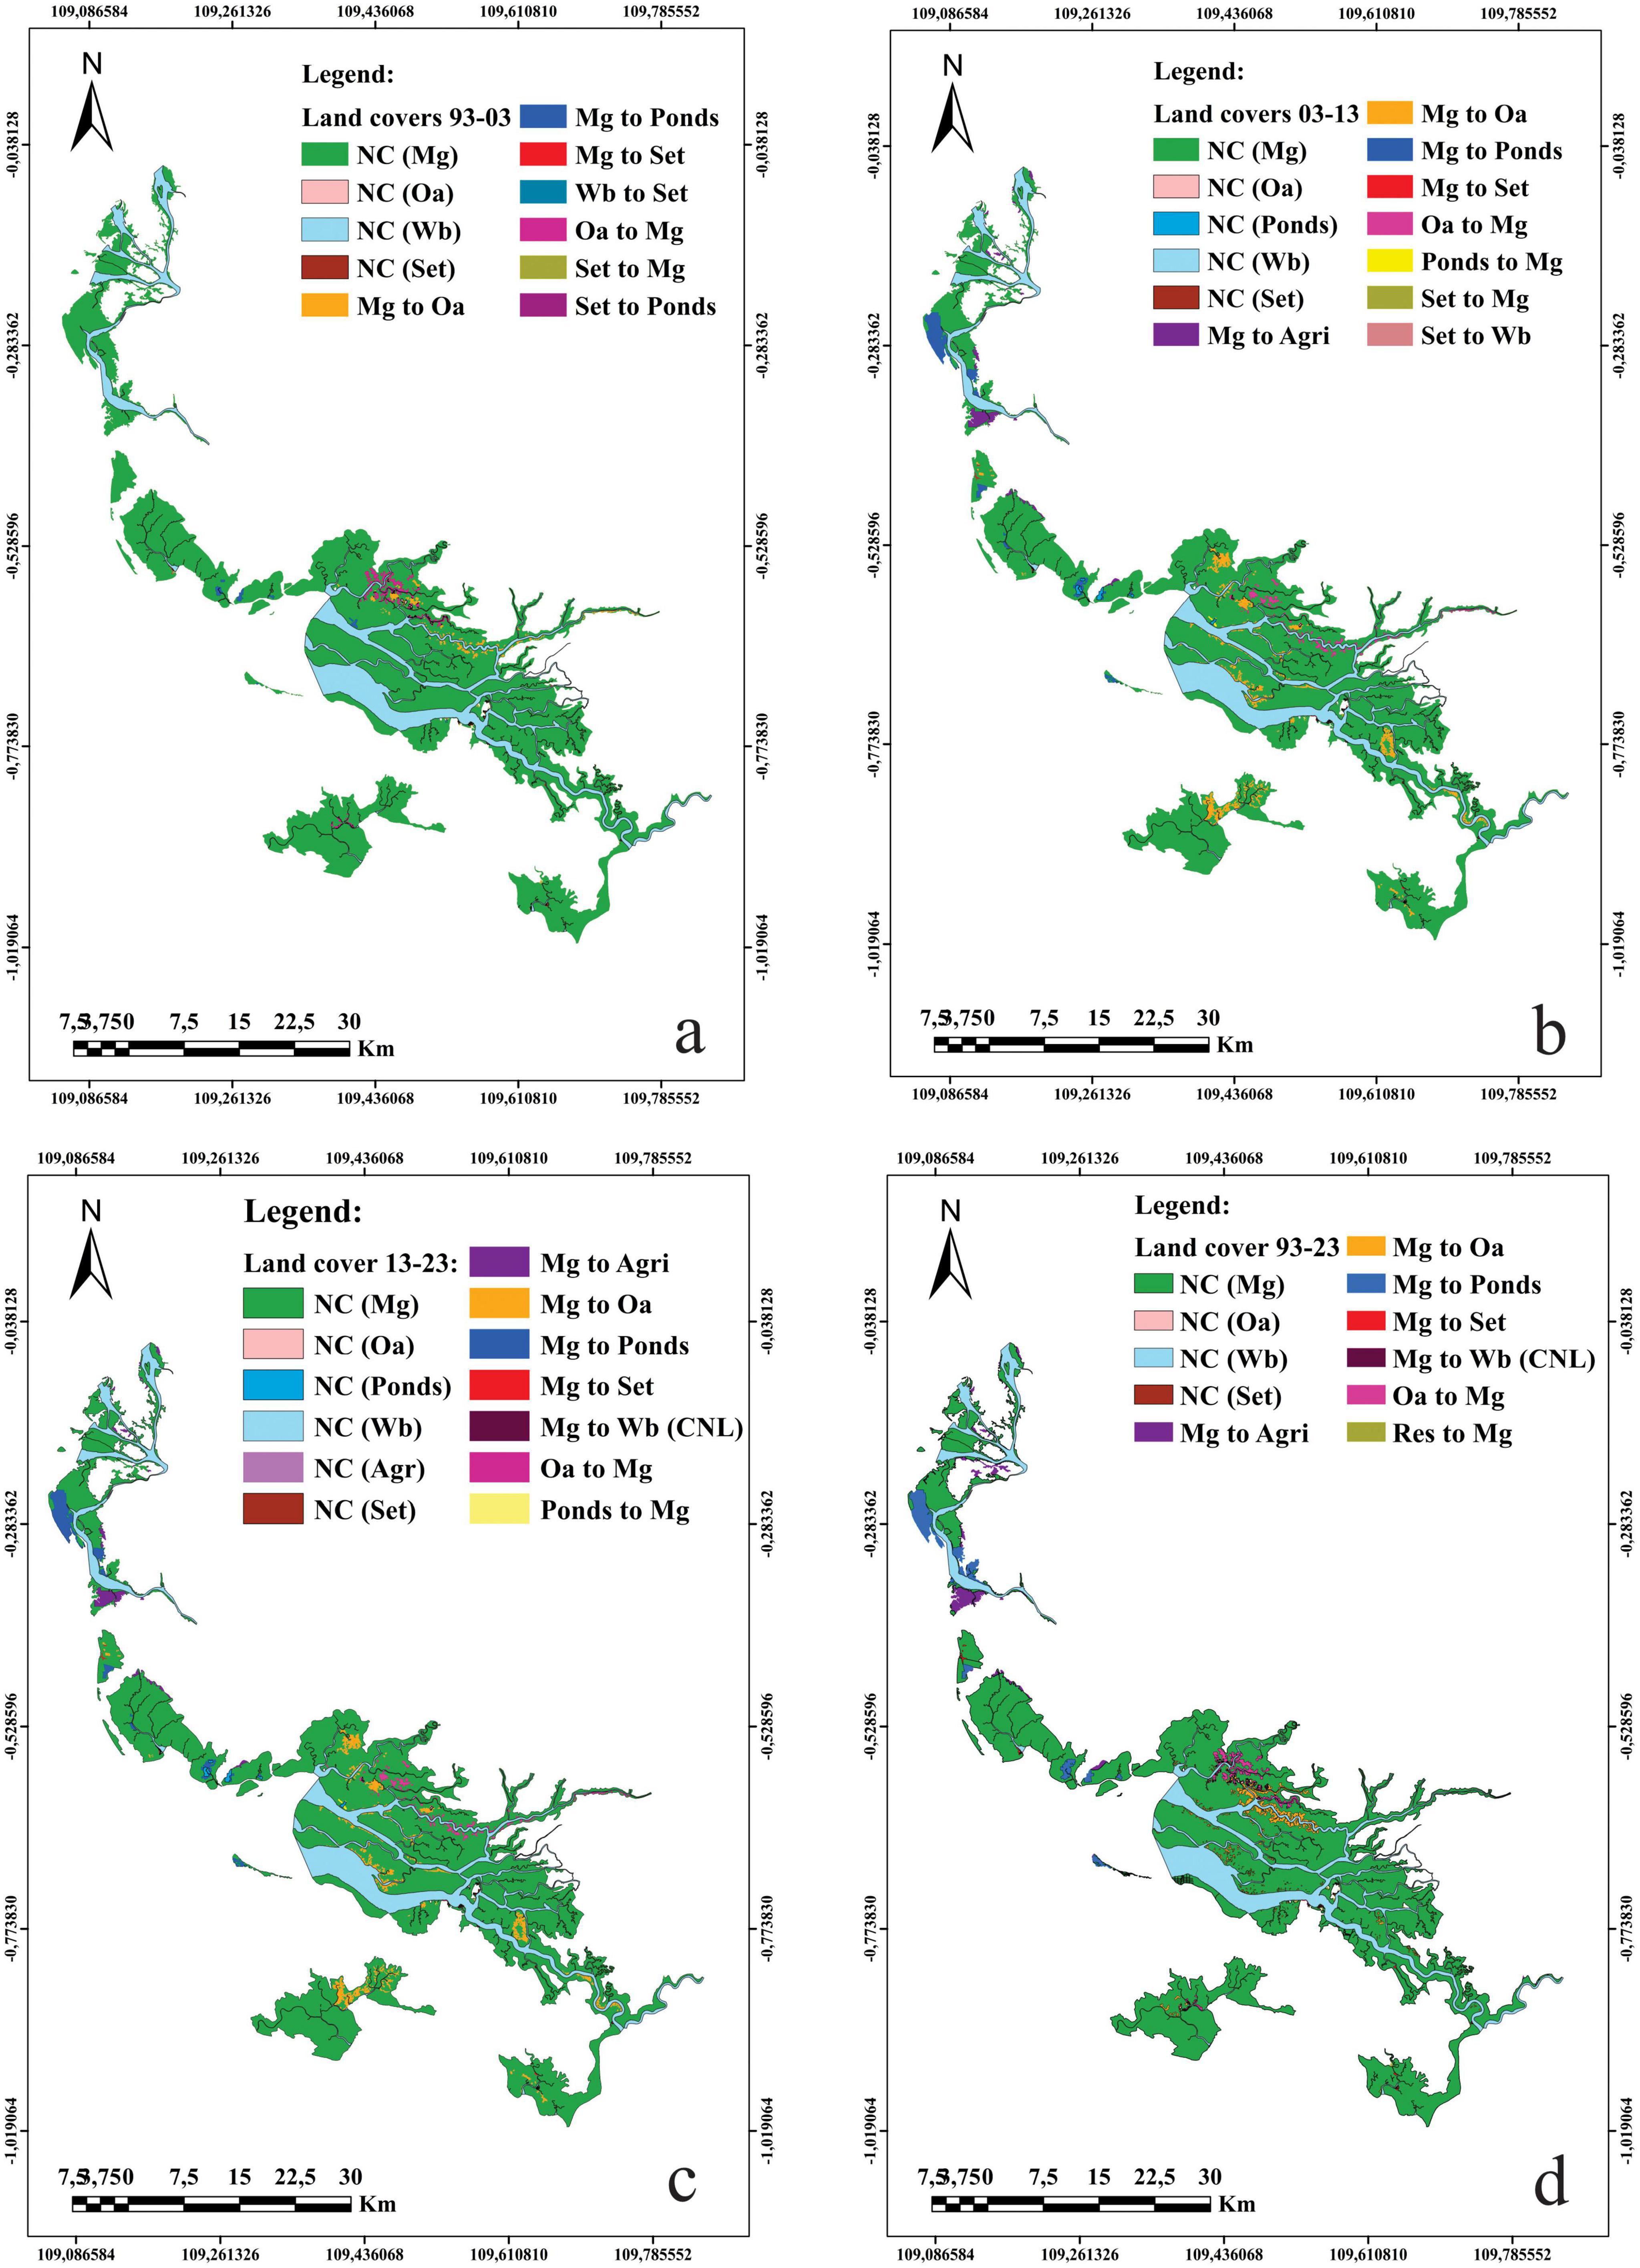
Figure 4. LULCC maps: (a) 1993–2003, (b) 2003–2013, (c) 2013–2023, (d) 1993–2023.
3.2.2.2 2003–2013
Between 2003 and 2013, six land cover classes were identified (Table 5). All classes changed during this period; specifically, mangrove forests changed to open areas by 31.35 km2, to settlements by 0.62 km2, to agricultural areas by 10.70 km2, and to aquaculture areas by 19.67 km2. Conversely, open area changed to mangrove forest by 8.77 km2, settlement area to mangrove area by 0.30 km2, and pond to mangrove forest by 0.45 km2 (Figure 4b).
3.2.2.3 2013–2023
From 2013 to 2023, the mangrove forest changed to open area by 16.22 km2, to settlement area by 0.11 km2, to water body by 0.33 km2, to agricultural area by 6.94 km2, and to pond area by 4.97 km2. In addition, open area changed to mangrove forest by 31.06 km2, and pond area changed to mangrove forest by 0.71 km2 (Table 4 and Figure 4c).
3.2.2.5 Overview 1993–2023
Over the 30 years (1993–2023), each class experienced significant changes, such as mangrove forests turning into agricultural land, open areas, settlements, pond areas, and water bodies. In addition, there was a shift from open area to mangrove forest, settlement area to mangrove forests, and water body to settlement area (Table 5 and Figure 4d).
3.3 Fragmentation pattern
Our results show two distinct patterns of fragmentation distribution, particularly in the northern and central parts of the study area. Some places in the north that previously had insignificant spots (1993) turned into areas with hot spots (2023), indicating a big expansion in the area of hot spots. Our data also shows that from 1993 to 2023, cold spots changed and spread in the center part of the study area, indicating that areas with low of fragmentation are increased, while area with a high fragmentation are decreased.
3.4 Driving factor
The significance level of the independent variables on the dependent variable is 95%. The BLR analysis revealed that social and natural factors have a relationship with land change in the study area, including the variables of population density, education level, land access, soil type, and rainfall. Then, based on the table, the final logit model of land use change is formed as: logit (change) = −2.152 population −0.695 education −0.756 land access + 0.583 soil + 0.665 rainfall. Positive variable values indicate that land change occurs more frequently, while negative variable values indicate that land change occurs less frequently or does not occur at all. The results of the binary logistic regression analysis and the map of driving factors are presented in Table 6 and Figure 5.
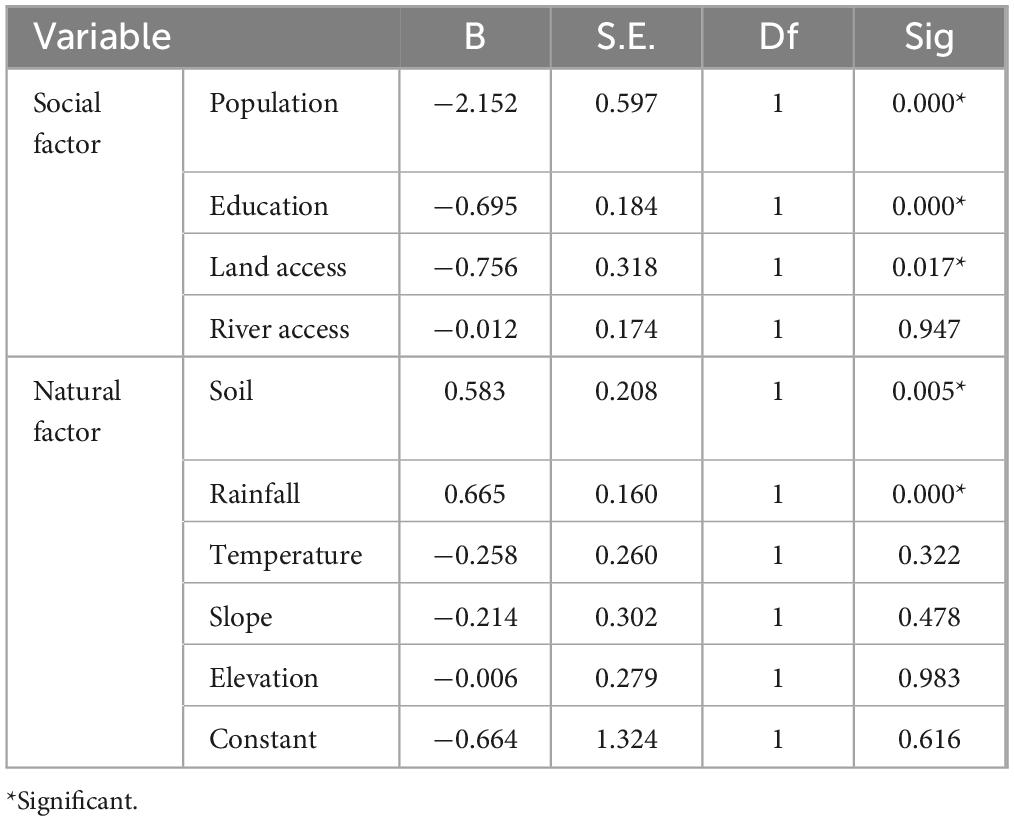
Table 6. Result of binary logistic regression analysis.
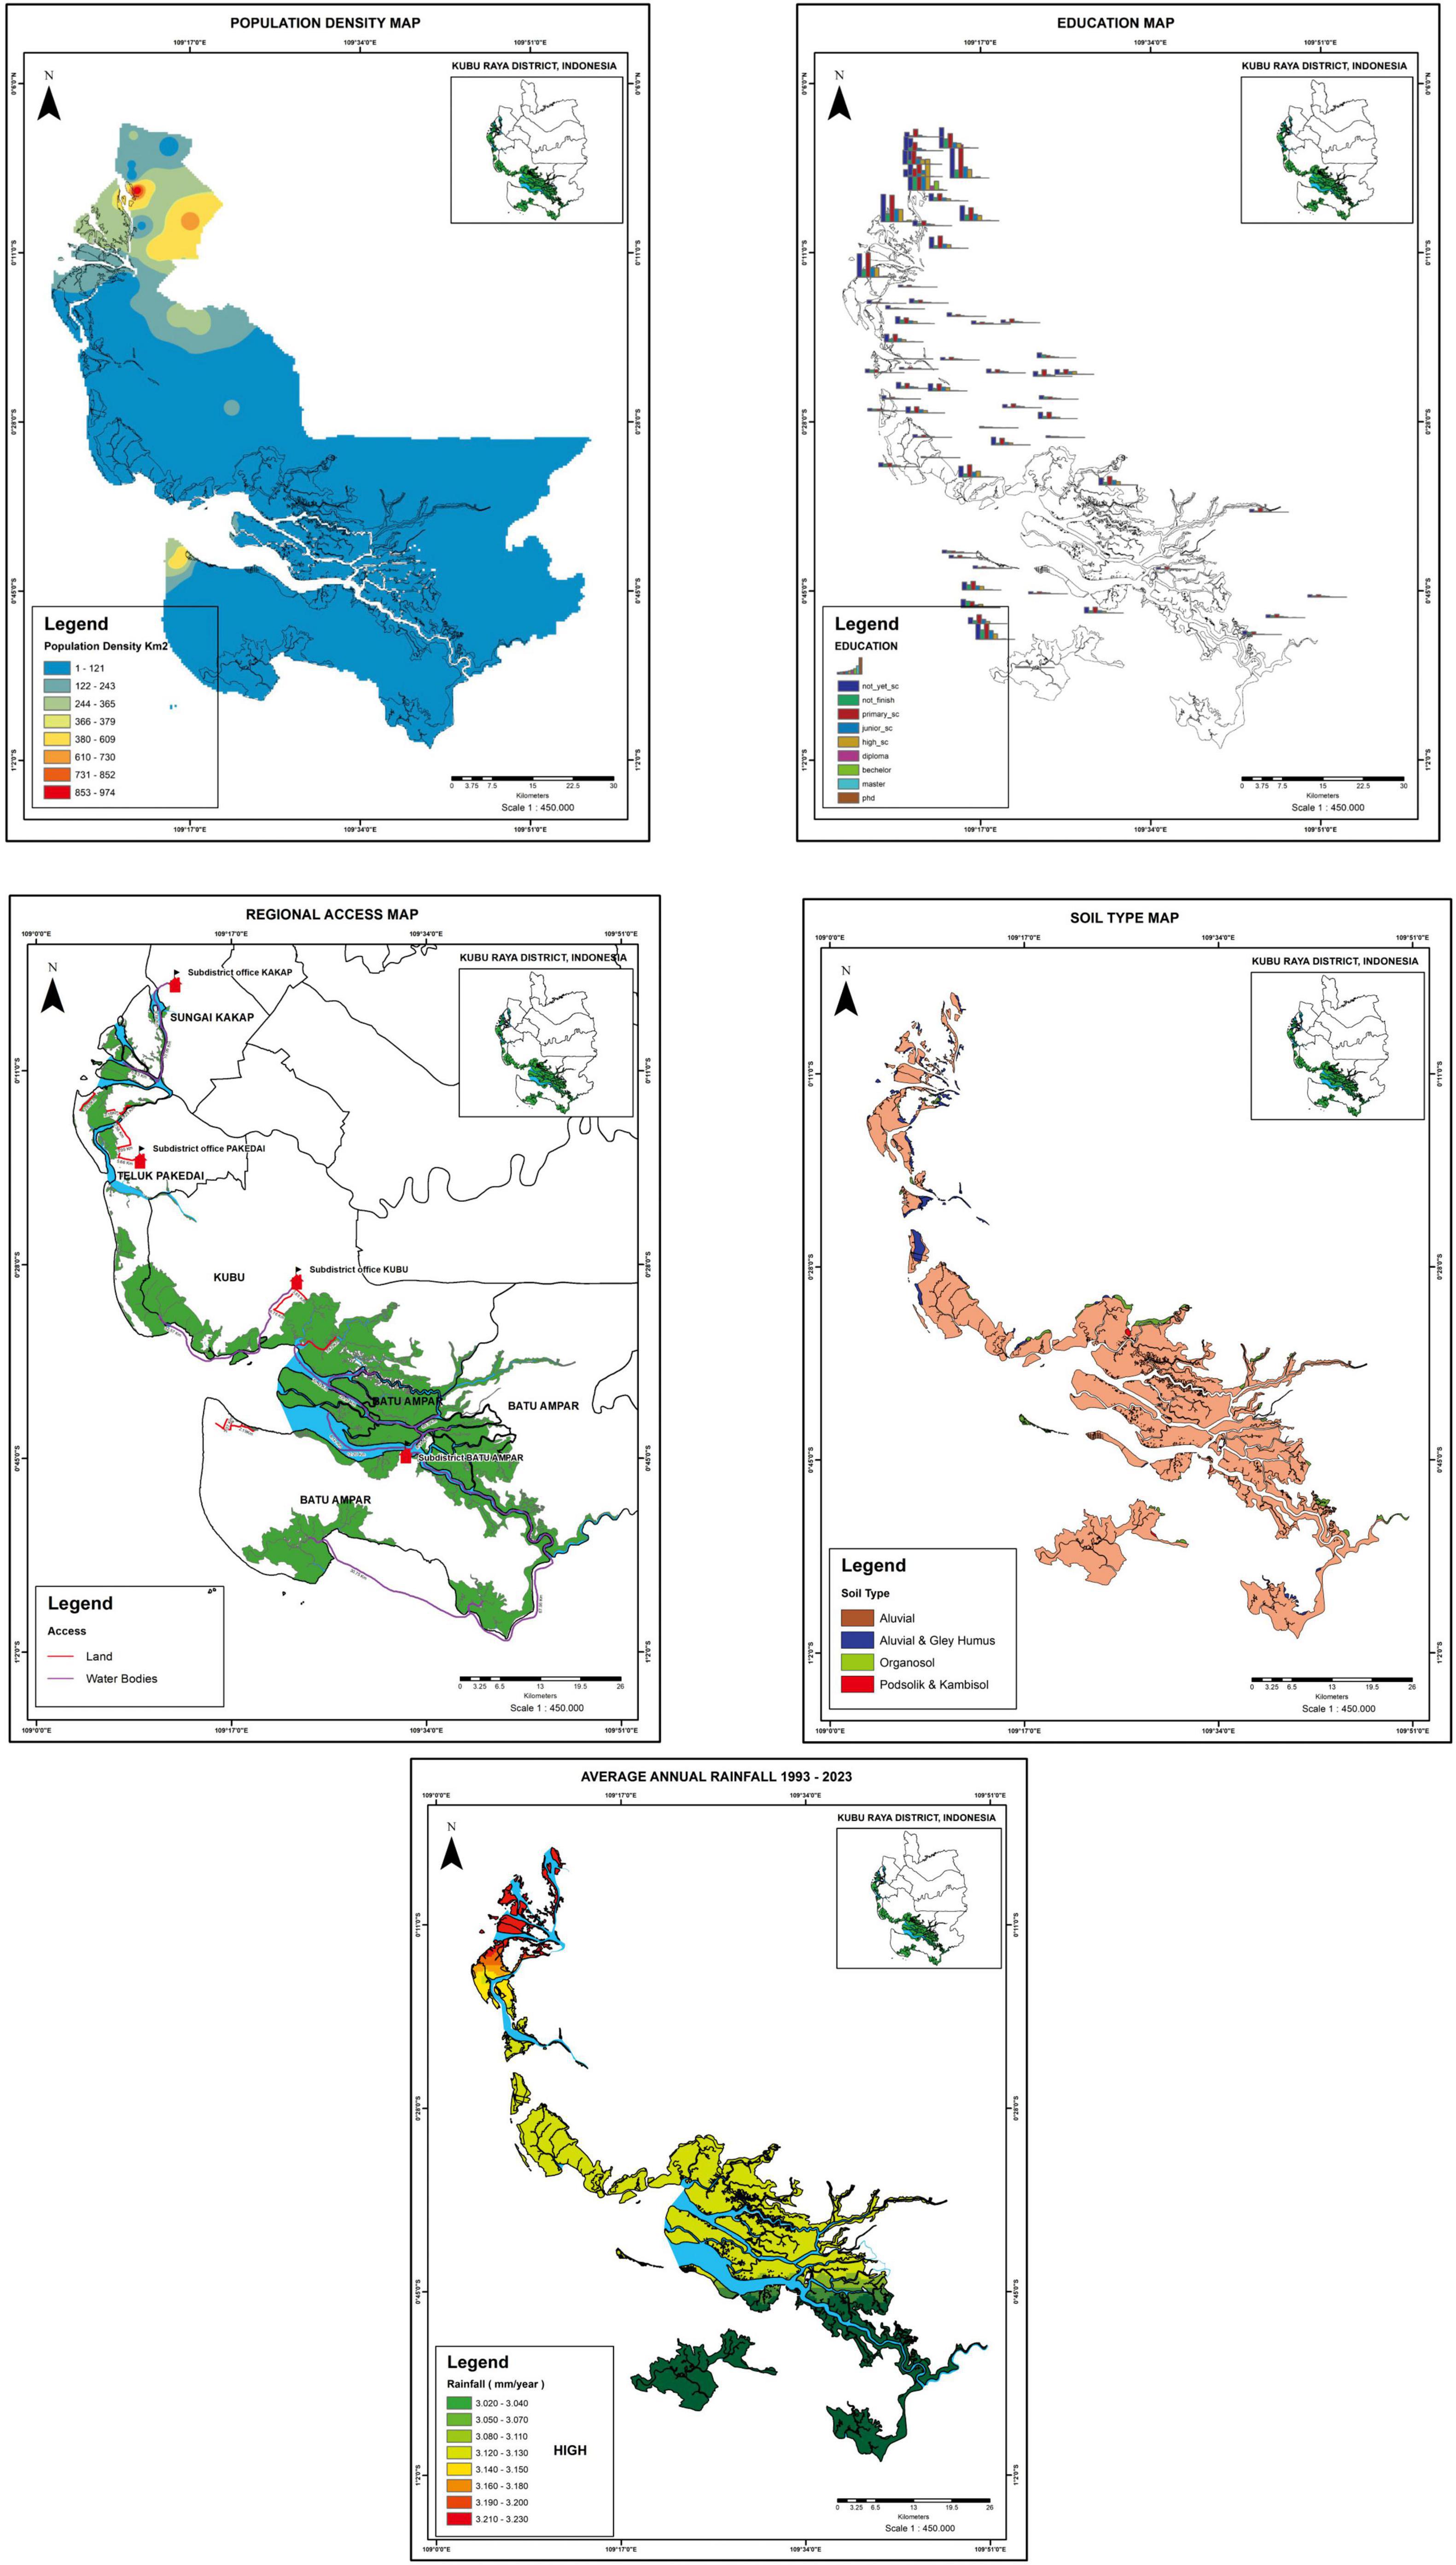
Figure 5. Driving factors maps population density, education level, accessibility, soil type, and average annual rainfall.
4 Discussion
4.1 Accuracy assessment
The kappa statistic takes into account all members of the error matrix other than the diagonal elements and is used to estimate classification accuracy (Foody, 2020; Hassan et al., 2022). The results of the accuracy calculation with guided classification noted that the highest record was in 1993 (97%) and the lowest record was in 2023 (92%) during four different eras (Table 2). This result is in line with several studies that have found more than 85% accuracy in all accuracy classifications (Ebrahimy and Zhang, 2023; Weitkamp and Karimi, 2023; Wu et al., 2023). The Kappa coefficient was higher than 0.9% in each of the four time periods (1993, 2003, 2013, and 2023). In this study, the kappa coefficient was higher than 0.9% in each of the four time periods (1993, 2003, 2013, and 2023). The results of the kappa accuracy test show that the resulting land use map has a high level of accuracy, earning it the title of very good (Near Perfect Agreement). These results are also very similar to several previous studies that assessed the Kappa coefficient of all forest classes to be more than 0.8% (Foody, 2020; Hussain et al., 2024; Selmy et al., 2023; Weitkamp and Karimi, 2023).
4.2 LULC changes detection from 1993 to 2023
The LULC identification process for the period 1993–2023 identified six land cover classes (Table 2). The largest land cover change occurred from mangrove forests to ponds, agriculture, and open areas. From 1993 to 2003, there was also a significant shift in land cover from mangrove forests to open areas and ponds. According to Karstens and Lukas (2014) in the early 1990s, there were several small ponds in Kubu Raya District, and these were first created by transmigrants from Java, and by the end of 2000, larger ponds appeared in Sepuk Laut (Sungai Kakap sub district) and Selat Remis (Teluk Pakedai sub district). Natural mangrove regeneration is well underway, covering open land and settlement areas. Such natural regeneration improves ecological function and structural diversity (Azman et al., 2021; Ferreira et al., 2023; Hanggara et al., 2021). From 2003 to 2013, there was a vast land conversion from mangroves to open area, agriculture, and ponds. These changes have adverse impacts on mangrove ecology and ecosystems, such as loss of animal habitat, reduced biodiversity, and loss of carbon stocks (Goldberg et al., 2020; Saragi-Sasmito et al., 2019). According to Central Statistics of Kubu Raya District (2022), the agriculture, forestry, and fisheries sector contributes 21.08% per year to West Kalimantan’s GDP. For example, charcoal production has become an economic activity with an increase in charcoal-making units by local communities, and this increased use of charcoal raw materials has threatened the ecosystem (Ajibola et al., 2020; Harfadli and Ulimaz, 2021; Ng and Ong, 2022; Nyangoko et al., 2022; Onyena and Sam, 2020). Finally, from 2013 to 2023, mangrove land cover continued to decrease across all land cover classes, but not as much as in the previous period. The most significant change is from open areas to mangrove forests. This change is due to replanting initiatives on open area by the government and businesses and the transition of production forests to ecosystem recovery areas, thus increasing conservation efforts (Ferreira et al., 2023). Mangrove regeneration provides positive support for the future environment (Akram et al., 2023; Numbere, 2021; Sasmito et al., 2023; Yu et al., 2023).
4.3 Fragmentation pattern
Based on Figure 6, the Getis-Ord Gi* analysis identified crucial locations with the highest (hotspots) and lowest (cold spots) levels of fragmentation. In 1993, mangrove forest fragmentation hotspots already existed, but their distribution was relatively limited. Hotspots expanded in 2023, especially in the northern part of the study area. This means the region’s fragmentation intensity has increased dramatically over the past 30 years. Meanwhile, in 1993, areas with shallow fragmentation (cold spots) were more visible in the central part, meaning that there were still areas that were intact or less affected by fragmentation. Where’s in 2023, low fragmentation (cold spots) still presents in some areas; however, the cold spot areas have shifted or shrunk. Meanwhile, in 1993 and 2023, statistically insignificant areas were scattered between hotspots and cold spots. These areas may have experienced inconsistent or fluctuating changes in fragmentation over the period.
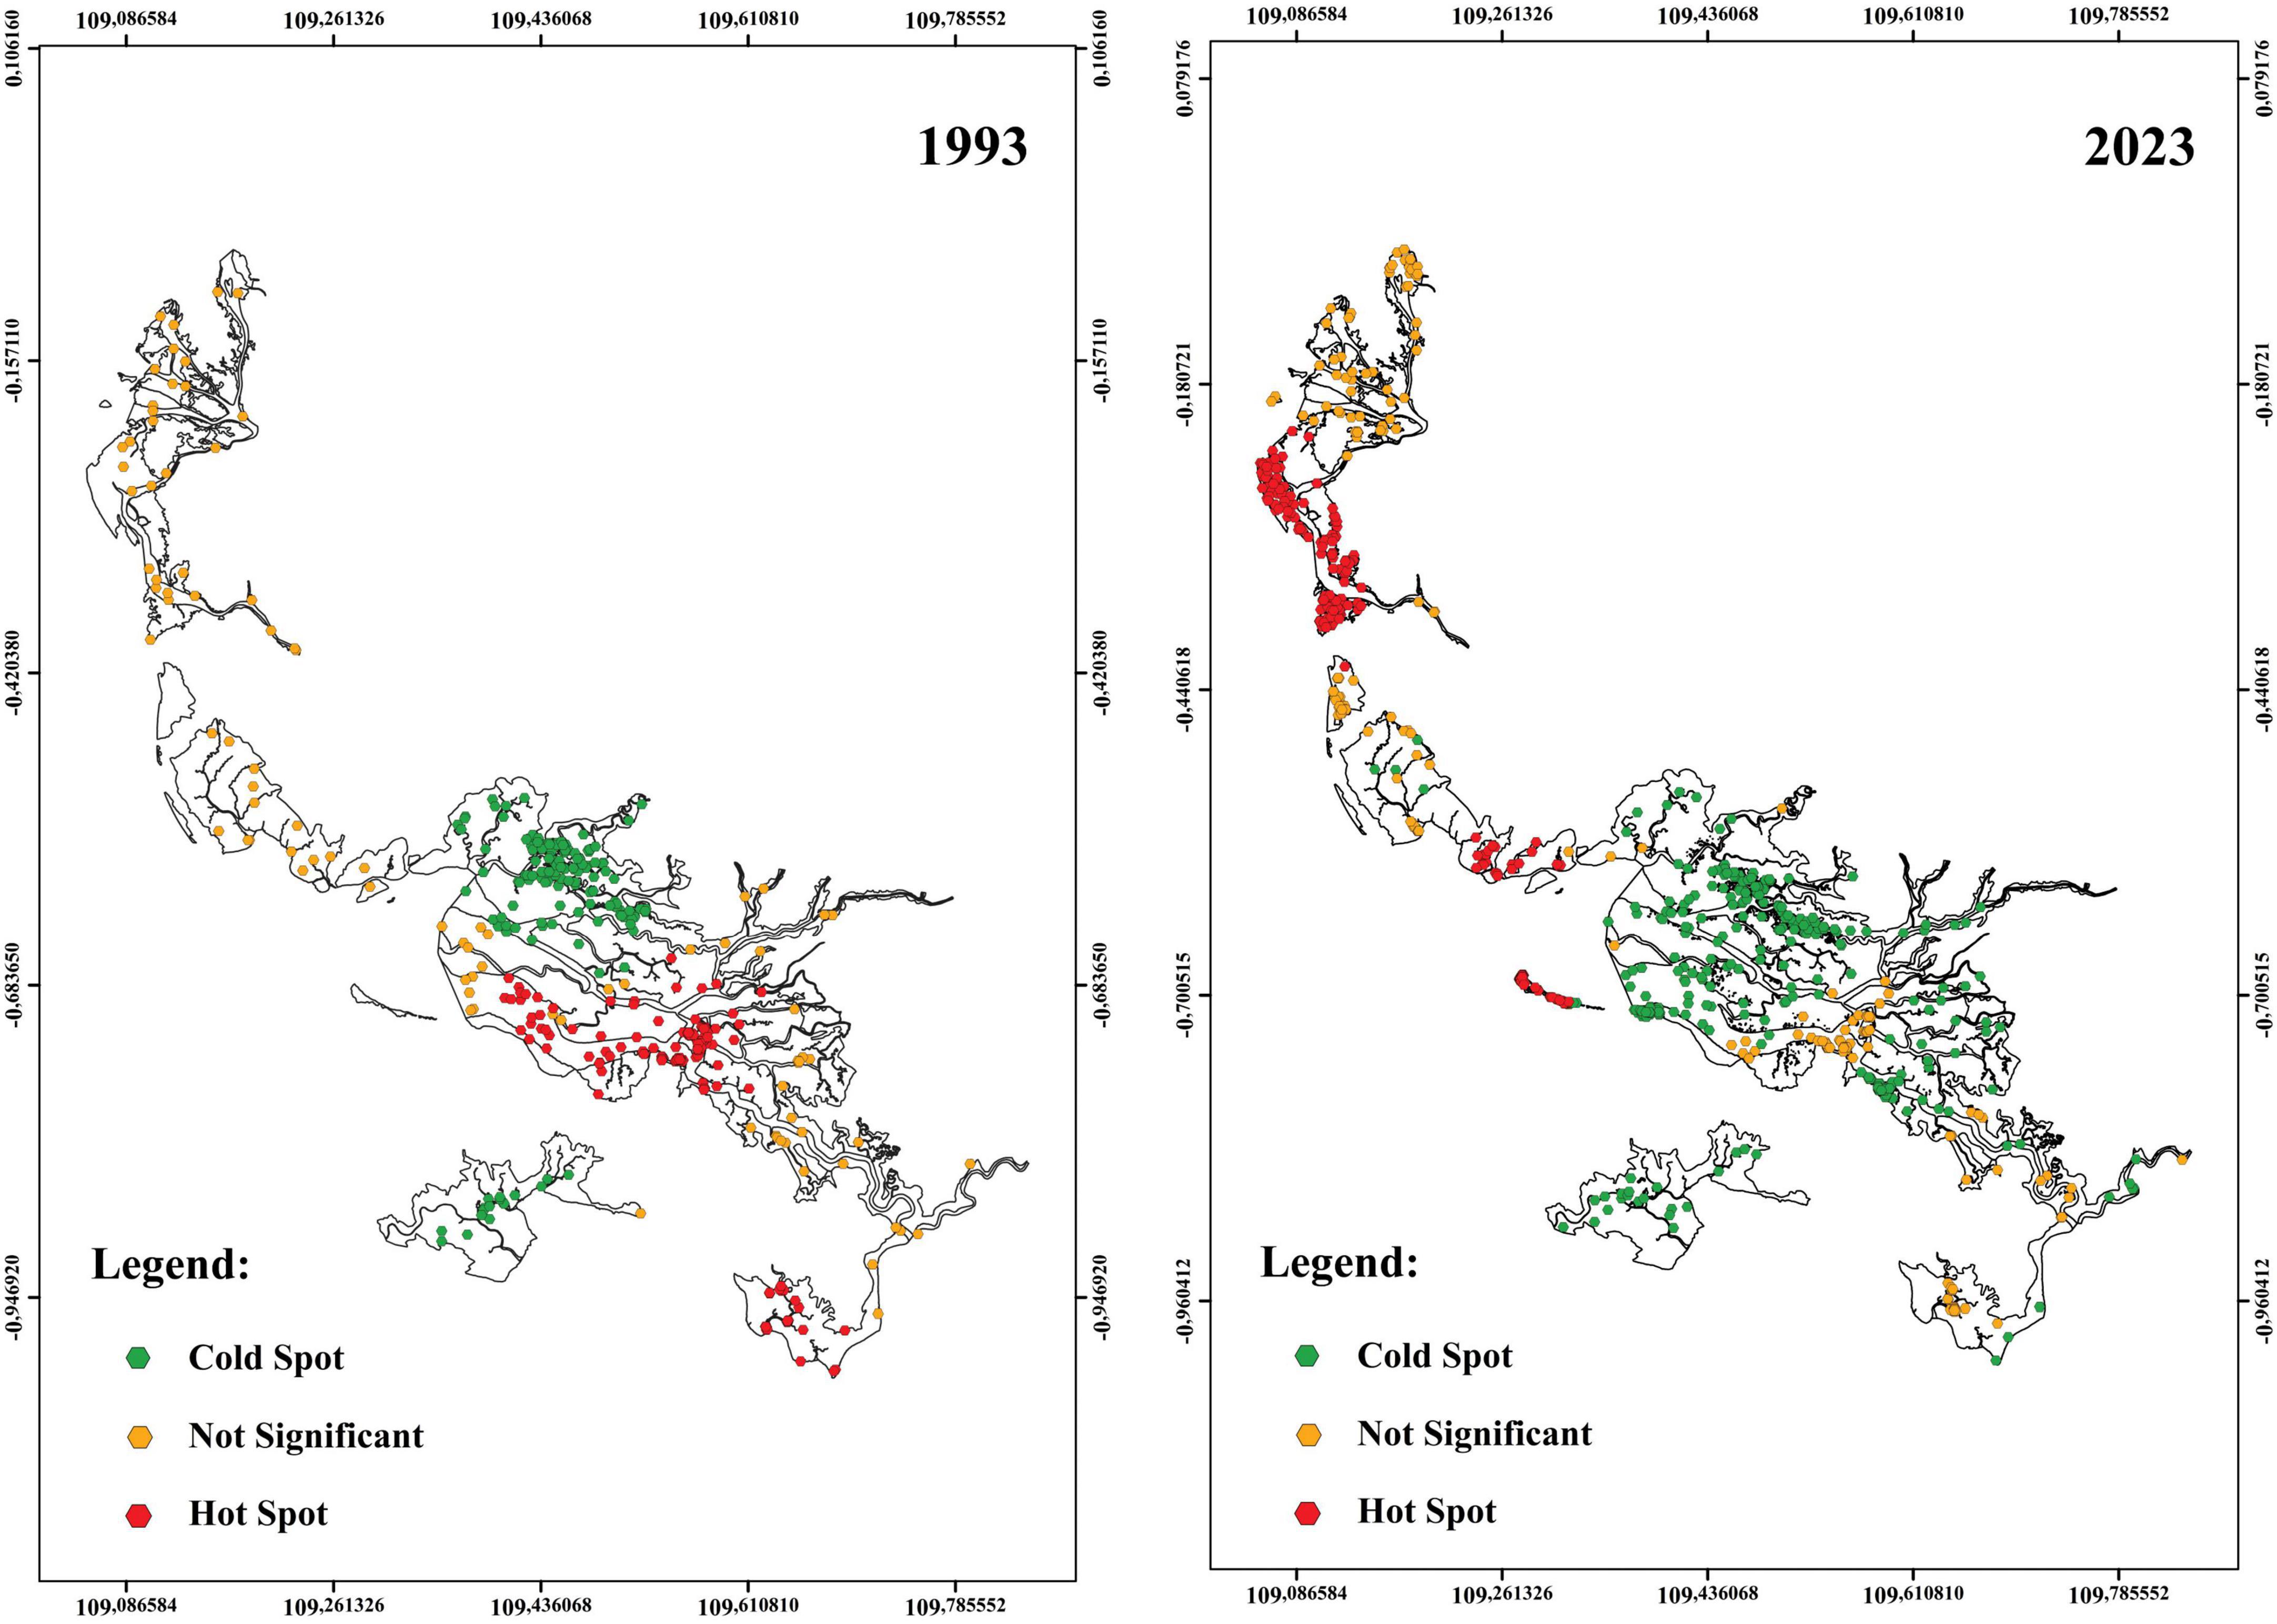
Figure 6. Fragmentation pattern 1993–2023.
Forest or habitat fragmentation is a serious problem worldwide; fragmentation usually results from habitat loss due to land conversion that disrupts mangrove functions (Jaramillo et al., 2023; Ma et al., 2023). However, habitat change is inevitable as no habitat or landscape is permanent (Pu et al., 2024; Zhang and Chen, 2022). Declining habitat quality has a detrimental influence on ecological services, such as the ability of ecosystems to maintain biodiversity (Bai et al., 2019; Onyena and Sam, 2020; Rumondang et al., 2024). Mangrove ecological services can be recognized by physical, chemical, and biological elements, such as ecosystem balancing, aberration control, and habitat for biodiversity (Barletta and Lima, 2019; Islam et al., 2024). As a result, fragmentation that leads to deforestation in mangrove ecosystems reduces their function as nursery, foraging, and nesting grounds for various aquatic biota (Barletta and Lima, 2019). According to Bunting et al. (2022), the expansion of forest edge boundaries affects changes in biodiversity habitat, which in turn affects changes in forest resources. Human disturbance leads to habitat disruption, and human activities contribute to forest fragmentation (Hussain et al., 2024; Kong et al., 2021).
4.4 Driving factor
Binary logistic regression analysis shows that social and natural variables provide directly proportional and inversely proportional values to the driving factors of mangrove forest change that occur in Kubu Raya District, West Kalimantan (Table 6). With every unit increase in population, the log odds of mangrove forest cover change will decrease by 2.152. This means that as the population increases around the mangrove forest, the level of mangrove forest damage in the study area can be reduced. The existence of regulations made by the government to maintain and protect mangrove forest areas has been responded to by the surrounding community and implemented. The involvement of national governments and international organizations can increase the effectiveness of mangrove conservation initiatives (Kairu et al., 2024; Mohamed et al., 2023). The existence of mangrove awareness groups around the study area also supports increased community awareness of coastal environmental issues and provides a strong incentive to protect mangrove forests. Furthermore, the granting of concession licenses by the government to companies or investor groups in the study area restricts the community from directly exploiting the forest because of the rules set by the government and concession managers; only fishermen use mangrove forest areas in the study area to catch fish. This finding is in starkly contrast to previous similar studies, particularly in Asia and Africa, where millions of people depend on mangrove ecosystem services for food, income, and overall well-being. Anthropologic factors are key indicators of forest degradation and major contributors to global mangrove degradation, such as urbanization, population density, logging, and infrastructure development (Akram et al., 2023; Ferreira et al., 2022; Giri, 2023; Goldberg et al., 2020; Newton et al., 2020; Sharma et al., 2022). Some studies show that increasing population pressure in coastal areas has historically led to massive conversion of mangrove forests to other uses. However, this trend is not universal and may have changed in recent years, especially in our study area.
Education level: For every unit increase in education level, the log odds of mangrove forest cover change decreased by 0.695. This means that the higher the education level, the lower the chance of mangrove deforestation. According to Central Statistics of Kubu Raya District (2022), the number of people who continue their education to a higher level is increasing yearly, especially in the four sub-districts in the research area. This has a positive impact on the existence of mangrove forests in the study area. With higher levels of education and knowledge, communities around the study area increasingly understand the importance of maintaining mangrove forests and environmental issues and tend not to depend directly on mangrove forests for resources, potentially reducing exploitation. They understand the value and benefits of mangrove forests so that they can make the right decisions in forest management. This is under several studies state that people with higher education levels are more aware of the importance of forest mitigation and protection and are aware of the negative impacts of land use change on ecosystems, and vice versa (Esengulova et al., 2024; Jadin and Rousseau, 2022; Mallick et al., 2021; Nguyen et al., 2023; Opelele Omeno et al., 2024).
Land access: for every unit increase in land access, the logarithmic probability of change in mangrove forest cover decreases by 0.756. As land access increases, the probability of change in mangrove forest cover decreases. In the study area, the current access road is exclusively used for daily activities by the community, not for mangrove exploitation, and has not changed over time. The concession owner has provided information on clear boundaries to communities living around the mangrove forest so that communities understand the limits of activities carried out around the mangrove forest and they do not interfere with concession activities. Local policies or good management by concessionaires play an important role in maintaining mangrove forests, despite increased accessibility. This contradicts the findings of several studies that state that the proximity of road access to forest areas affects land conversion in the forest area itself, making it easier for local people to convert mangrove forests into non-mangrove forest areas (Gizachew et al., 2024; Salomon et al., 2022; Vu and Shen, 2021; Yu and Liu, 2024).
Soil type: for every unit increase in soil type, the log odds of mangrove forest cover change will increase by 0.583. This means that the more soil types, the greater possibility of mangrove forest cover change. In the study area, there are four soil types, namely alluvial, alluvial (Gley humus), organosol, and podzolic (kambiosol). Most LULC in the study area is agricultural land and ponds, both of which are found in areas with alluvial soil types. In coastal areas, this type of alluvial soil is ideal for agricultural land and fish farming (AbdelRahman and Arafat, 2020; Akram et al., 2023; Akter et al., 2023). Alluvial soil types that are rich in nutrients are very supportive of mangrove growth and the continuity of agriculture and pond (Halder et al., 2024; Mama et al., 2024; Rizki and Leilani, 2020; Sabriyati et al., 2023; Sumani et al., 2021). The conversion of mangrove areas to ponds and agriculture has significant impacts on coastal lands, altering sediment size and quality (Phan and Stive, 2022; Ramos et al., 2023; Solihuddin et al., 2024; Tarunamulia et al., 2024).
Rainfall: For every unit increase in rainfall, the logarithmic probability of mangrove forest cover change increases by 0.665. This means that rainfall patterns can increase the possibility of mangrove forest cover change. Rainfall intensity can lead to changes in land use, such as conversion of mangrove land to agricultural land or ponds (Hasan et al., 2023; Li C. et al., 2023; Nong et al., 2021). Changes in rainfall patterns affect soil moisture levels, salinity, and general ecosystem health, and can lead to the shift of natural ecosystems such as mangrove forests to agricultural or pond environments (Safitri et al., 2022; te Wierik et al., 2021; Wang et al., 2021).
5 Conclusion
Land cover classification results in 1993, 2003, 2013, and 2023 were mangroves, water bodies, open land, settlements, ponds, and agricultural areas. The study results show that the area of mangrove forest cover has decreased along with the growth of open space and other land uses, including ponds and agricultural land. Mangrove forest land cover decreased from 1,011.37 square kilometers (1993) to 963.06 square kilometers (2023). The total area of change was 97.68 square kilometers over three decades, or equivalent to 3.25 km2 per year. The fragmentation pattern is that some areas in the north were insignificant hotspots in 1993, then turned into hotspots in 2023. Meanwhile, in 1993 and 2023, there were cold spots that shifted and also spread in the central part of the study area. This study proves that there has been considerable fragmentation in the study area. Social factors are related to land change in the study area: population density, education level, and accessibility. Reasonable regulations made by the government and highly educated people are a source of concern for preserving mangrove ecosystems. Coupled with the existing land, access is not used as access to exploit mangrove forests but only for daily activities. In addition, natural factors such as soil type and rainfall also have a mutually beneficial relationship for agriculture and aquaculture, especially alluvial soils. Alluvial soils have a high concentration of nutrients, making them ideal for the sustainability of agriculture and ponds. While rainfall intensity contributes to higher agricultural production and stable pond water. The final logit model of land use change is: 2.152 population, −0.695 education, −0.756 land access, +0.583 soil, and +0.665 rainfall. Based on these finding, we recommend to the local government to enforce spatial planning regulations that strictly limit the conversion of mangrove areas, particularly in areas identified as fragmentation hotspots. We also encourage to regularly monitor fragmentation hotspot and mangrove cover changes in the Kubu Raya District using remote sensing technology, ensuring early detection of land conversion activities and supporting data-driven decision-making processes.
Data availability statement
The original contributions presented in the study are included in the article/supplementary material, further inquiries can be directed to the corresponding author.
Author contributions
RW: Writing – original draft, Writing – review & editing, Conceptualization, Data curation, Formal Analysis, Investigation, Methodology, Resources. RF: Writing – original draft, Conceptualization, Data curation, Formal Analysis, Investigation, Resources, Writing – review & editing. MI: Writing – review & editing, Data curation, Conceptualization. MB: Writing – review & editing, Data curation, Resources. UH: Writing – review & editing, Formal Analysis, Investigation. JM: Data curation, Methodology, Supervision, Writing – review & editing, Conceptualization, Funding acquisition, Writing – original draft.
Funding
The author(s) declare that financial support was received for the research and/or publication of this article. This study was funded by the National Natural Science Foundation of China (grant no. 32271871).
Acknowledgments
We thank you to BAZNAS RI and Prasetyo Rahmat Pratama for supporting my data collection.
Conflict of interest
The authors declare that the research was conducted in the absence of any commercial or financial relationships that could be construed as a potential conflict of interest.
Generative AI statement
The authors declare that no Generative AI was used in the creation of this manuscript.
Publisher’s note
All claims expressed in this article are solely those of the authors and do not necessarily represent those of their affiliated organizations, or those of the publisher, the editors and the reviewers. Any product that may be evaluated in this article, or claim that may be made by its manufacturer, is not guaranteed or endorsed by the publisher.
References
AbdelRahman, M. A. E., and Arafat, S. M. (2020). An approach of agricultural courses for soil conservation based on crop soil suitability using geomatics. Earth Syst. Environ. 4:18113. doi: 10.1007/s41748-020-00145-x
Aghsaei, H., Mobarghaee Dinan, N., Moridi, A., Asadolahi, Z., Delavar, M., Fohrer, N., et al. (2020). Effects of dynamic land use/land cover change on water resources and sediment yield in the Anzali wetland catchment, Gilan, Iran. Sci. Total Environ. 712:136449. doi: 10.1016/j.scitotenv.2019.136449
Ajibola, A. F., Olalekan, R. M., Catherine, S.-A. O., Olusola, A. A., and Adekunle, A. P. (2020). Policy responses to addressing the issues of environmental health impacts of charcoal factory in nigeria: Necessity today; Essentiality tomorrow. Commun. Soc. Medis. 3, 1–36. doi: 10.22158/csm.v3n3p1
Akram, H., Hussain, S., Mazumdar, P., Chua, K. O., Butt, T. E., and Harikrishna, J. A. (2023). Mangrove health: A review of functions, threats, and challenges associated with mangrove management practices. Forests 14:1698. doi: 10.3390/f14091698
Akter, R., Hasan, N., Reza, F., Asaduzzaman, M., Begum, K., and Shammi, M. (2023). Hydrobiology of saline agriculture ecosystem: A review of scenario change in south-west region of bangladesh. Hydrobiology 2, 162–180. doi: 10.3390/hydrobiology2010011
Amini, S., Saber, M., Rabiei-Dastjerdi, H., and Homayouni, S. (2022). Urban land use and land cover change analysis using random forest classification of landsat time series. Remote Sens. 14:2654. doi: 10.3390/rs14112654
Anderson, M. G., Clark, M., Olivero, A. P., Barnett, A. R., Hall, K. R., Cornett, M. W., et al. (2023). A resilient and connected network of sites to sustain biodiversity under a changing climate. Proc. Natl. Acad. Sci. U S Am. 120:e2204434119. doi: 10.1073/pnas.2204434119
Arficho, M., and Thiel, A. (2020). Does land-use policy moderate impacts of climate anomalies on lulc change in dry-lands? An empirical enquiry into drivers and moderators of LULC change in Southern Ethiopia. Sustainability 12:6261. doi: 10.3390/SU12156261
Azman, M. S., Sharma, S., Shaharudin, M. A. M., Hamzah, M. L., Adibah, S. N., Zakaria, R. M., et al. (2021). Stand structure, biomass and dynamics of naturally regenerated and restored mangroves in Malaysia. Forest Ecol. Manag. 482:118852. doi: 10.1016/j.foreco.2020.118852
Badshah, M. T., Hussain, K., Rehman, A. U., Mehmood, K., Muhammad, B., Wiarta, R., et al. (2024). The role of random forest and Markov chain models in understanding metropolitan urban growth trajectory. Front. For. Global Change 7:1345047. doi: 10.3389/ffgc.2024.1345047
Bai, L., Xiu, C., Feng, X., and Liu, D. (2019). Influence of urbanization on regional habitat quality: A case study of changchun city. Habitat Int. 93:102042. doi: 10.1016/j.habitatint.2019.102042
Barletta, M., and Lima, A. R. A. (2019). Systematic review of fish ecology and anthropogenic impacts in South American estuaries: Setting priorities for ecosystem conservation. Front. Mar. Sci. 6:237. doi: 10.3389/fmars.2019.00237
Benavidez-Silva, C., Jensen, M., and Pliscoff, P. (2021). Future scenarios for land use in chile: Identifying drivers of change and impacts over protected area system. Land 10:408. doi: 10.3390/land10040408
Bera, B., Saha, S., and Bhattacharjee, S. (2020). Forest cover dynamics (1998 to 2019) and prediction of deforestation probability using binary logistic regression (BLR) model of Silabati watershed. India. Trees For. People 2:100034. doi: 10.1016/j.tfp.2020.100034
Bhowmik, A. K., Padmanaban, R., Cabral, P., and Romeiras, M. M. (2022). Global mangrove deforestation and its interacting social-ecological drivers: A systematic review and synthesis. Sustainability 14:4433. doi: 10.3390/su14084433
Bunting, P., Rosenqvist, A., Hilarides, L., Lucas, R. M., Thomas, N., Tadono, T., et al. (2022). Global mangrove extent change 1996–2020: Global mangrove watch version 3.0. Remote Sensing 14:3657. doi: 10.3390/rs14153657
Central Statistics of Kubu Raya District. (2022). Central Statistics of Kubu Raya District: Vol. Statistics of Kubu Raya District. Available online at: https://kuburayakab.bps.go.id/id/publication/2022/02/25/669f7f8278f99f66a1a96250/kabupaten-kubu-raya-dalam-angka-2022.html
Chaemiso, S. E., Kartha, S. A., and Pingale, S. M. (2021). Effect of land use/land cover changes on surface water availability in the Omo-Gibe basin, Ethiopia. Hydrol. Sci. J. 66, 83–111. doi: 10.1080/02626667.2021.1963442
Chakma, M., Hayat, U., Meng, J., and Hassan, M. A. (2023). An assessment of landscape and land use/cover change and its implications for sustainable landscape management in the chittagong hill tracts, Bangladesh. Land 12:1610. doi: 10.3390/land12081610
Chowdhury, M. S. (2024). Comparison of accuracy and reliability of random forest, support vector machine, artificial neural network and maximum likelihood method in land use/cover classification of urban setting. Environ. Challenges 14:100800. doi: 10.1016/j.envc.2023.100800
Das, S. C., Thammineni, P., and Ashton, E. C. (2022). “Mangroves: Biodiversity, livelihoods and conservation,” in Mangroves: Biodiversity, Livelihoods and Conservation, eds S. Chandra Das, P. Elizabeth, and C. Ashton (Berlin: Springer Nature), doi: 10.1007/978-981-19-0519-3
Ding, X., Shan, X., Chen, Y., Li, M., Li, J., and Jin, X. (2020). Variations in fish habitat fragmentation caused by marine reclamation activities in the Bohai coastal region, China. Ocean Coastal Manag. 184:105038. doi: 10.1016/j.ocecoaman.2019.105038
Duan, X., Chen, Y., Wang, L., Zheng, G., and Liang, T. (2023). The impact of land use and land cover changes on the landscape pattern and ecosystem service value in Sanjiangyuan region of the Qinghai-Tibet Plateau. J. Environ. Manag. 325:116539. doi: 10.1016/j.jenvman.2022.116539
Ebrahimy, H., and Zhang, Z. (2023). Per-pixel accuracy as a weighting criterion for combining ensemble of extreme learning machine classifiers for satellite image classification. Int. J. Appl. Earth Observ. Geoinformation 122:103390. doi: 10.1016/j.jag.2023.103390
Esengulova, N., Balena, P., De Lucia, C., Lopolito, A., and Pazienza, P. (2024). Key drivers of land use changes in the rural area of gargano (South Italy) and their implications for the local sustainable development. Land 13:166. doi: 10.3390/land13020166
Fang, Z., Ding, T., Chen, J., Xue, S., Zhou, Q., Wang, Y., et al. (2022). Impacts of land use/land cover changes on ecosystem services in ecologically fragile regions. Sci. Total Environ. 831:154967. doi: 10.1016/j.scitotenv.2022.154967
Ferreira, A. C., Borges, R., and de Lacerda, L. D. (2022). Can sustainable development save mangroves? Sustainability 14:1263. doi: 10.3390/su14031263
Ferreira, A. C., de Lacerda, L. D., Rodrigues, J. V. M., and Bezerra, L. E. A. (2023). New contributions to mangrove rehabilitation/restoration protocols and practices. Wetlands Ecol. Manag. 31, 89–114. doi: 10.1007/s11273-022-09903-2
Filippi, A. M., Güneralp, İ, Castillo, C. R., Ma, A., Paulus, G., and Anders, K. H. (2022). Comparison of image endmember-and object-based classification of very-high-spatial-resolution Unmanned aircraft system (UAS) Narrow-band images for mapping riparian forests and other land covers. Land 11:246. doi: 10.3390/land11020246
Foody, G. M. (2020). Explaining the unsuitability of the kappa coefficient in the assessment and comparison of the accuracy of thematic maps obtained by image classification. Remote Sens. Environ. 239:111630. doi: 10.1016/j.rse.2019.111630
Galiatsatos, N., Donoghue, D. N. M., Watt, P., Bholanath, P., Pickering, J., Hansen, M. C., et al. (2020). An assessment of global forest change datasets for national forest monitoring and reporting. Remote Sens. 12:1790. doi: 10.3390/rs12111790
Gandhi, S., and Jones, T. G. (2019). Identifying mangrove deforestation hotspots in South Asia, Southeast Asia and Asia-Pacific. Remote Sens. 11:728. doi: 10.3390/RS11060728
Ganesh, B., Vincent, S., Pathan, S., and Benitez, S. R. G. (2023). Utilizing LANDSAT data and the maximum likelihood classifier for analysing land use patterns in Shimoga, Karnataka. J. Phys. Conf. Ser. 2571:012001. doi: 10.1088/1742-6596/2571/1/012001
Getu, K., and Gangadhara Bhat, H. (2024). Application of geospatial techniques and binary logistic regression model for analyzing driving factors of urban growth in Bahir Dar city. Ethiopia. Heliyon 10:e25137. doi: 10.1016/j.heliyon.2024.e25137
Giri, C. (2023). Frontiers in global mangrove forest monitoring. Remote Sens. 15:3852. doi: 10.3390/rs15153852
Gizachew, B., Shirima, D. D., Rizzi, J., Kukunda, C. B., and Zahabu, E. (2024). Conservation and avoided deforestation: Evidence from protected areas of tanzania. Forests 15:1593. doi: 10.3390/f15091593
Goldberg, L., Lagomasino, D., Thomas, N., and Fatoyinbo, T. (2020). Global declines in human-driven mangrove loss. Glob. Change Biol. 26, 5844–5855. doi: 10.1111/gcb.15275
Hailu, A., Mammo, S., and Kidane, M. (2020). Dynamics of land use, land cover change trend and its drivers in Jimma Geneti District, Western Ethiopia. Land Use Policy 99:105011. doi: 10.1016/j.landusepol.2020.105011
Halder, B., Bandyopadhyay, J., and Sandhyaki, S. (2024). Impact assessment of environmental disturbances triggering aquaculture land suitability mapping using AHP and MCDA techniques. Aquac. Int. 32, 2039–2075. doi: 10.1007/s10499-023-01257-7
Hanggara, B. B., Murdiyarso, D., Ginting, Y. R., Widha, Y. L., Panjaitan, G. Y., and Lubis, A. A. (2021). Effects of diverse mangrove management practices on forest structure, carbon dynamics and sedimentation in North Sumatra, Indonesia. Estuarine Coastal Shelf Sci. 259:107467. doi: 10.1016/j.ecss.2021.107467
Harfadli, M. M., and Ulimaz, M. (2021). Identification of flood vulnerable zones in Batu Ampar Village, Balikpapan City using geographical information system methods. IOP Conf. Ser. Earth Environ. Sci. 623:012031. doi: 10.1088/1755-1315/623/1/012031
Hasan, M. H., Newton, I. H., Chowdhury, M. A., Esha, A. A., Razzaque, S., and Hossain, M. J. (2023). Land use land cover change and related drivers have livelihood consequences in coastal Bangladesh. Earth Syst. Environ. 7, 541–559. doi: 10.1007/s41748-023-00339-z
Hassan, M. A., Ishag Arbab, M., Abdelmanan Hassan, M., Zhang, X., and Abbaker Ibrahim, M. (2022). Land-cover mapping using Landsat Data in a section of Greater Kordofan region of Sudan international journal of advanced multidisciplinary research and studies land-cover mapping using landsat data in a section of Greater Kordofan region of Sudan. Int. J. Adv. Multidisc. Res. Stud. 2, 131–137.
Hending, D., Randrianarison, H., Andriamavosoloarisoa, N. N. M., Ranohatra-Hending, C., Holderied, M., McCabe, G., et al. (2023). Forest fragmentation and its associated edge-effects reduce tree species diversity, size, and structural diversity in Madagascar’s transitional forests. Biodiver. Conserv. 32, 3329–3353. doi: 10.1007/s10531-023-02657-0
Hoque, M. Z., Ahmed, M., Islam, I., Cui, S., Xu, L., Prodhan, F. A., et al. (2022). Monitoring changes in land use land cover and ecosystem service values of dynamic saltwater and freshwater systems in coastal bangladesh by geospatial techniques. Water 14:2293. doi: 10.3390/w14152293
Hussain, K., Mehmood, K., Anees, S. A., Ding, Z., Muhammad, S., Badshah, T., et al. (2024). Assessing forest fragmentation due to land use changes from 1992 to 2023: A spatio-temporal analysis using remote sensing data. Heliyon 10:e34710. doi: 10.1016/j.heliyon.2024.e34710
Islam, M. A., Billah, M. M., Idris, M. H., Bhuiyan, M. K. A., and Kamal, A. H. M. (2024). Mangroves of Malaysia: A comprehensive review on ecosystem functions, services, restorations, and potential threats of climate change. Hydrobiologia 851, 1841–1871. doi: 10.1007/s10750-023-05431-z
Jacobson, A. P., Riggio, J., Tait, A., and Baillie, J. (2019). Global areas of low human impact (‘Low Impact Areas’) and fragmentation of the natural world. Sci. Rep. 9:14179. doi: 10.1038/s41598-019-50558-6
Jadin, J., and Rousseau, S. (2022). Local community attitudes towards mangrove forest conservation. J. Nat. Conserv. 68:126232. doi: 10.1016/j.jnc.2022.126232
Jaramillo, J. J., Rivas, C. A., Oteros, J., and Navarro-Cerrillo, R. M. (2023). Forest fragmentation and landscape connectivity changes in ecuadorian mangroves: Some hope for the future? Appl. Sci. 13:5001. doi: 10.3390/app13085001
Kairu, A., Mbeche, R., Kotut, K., and Kairo, J. (2024). From centralization to decentralization: Evolution of forest policies and their implications on mangrove management in Kenya. Forest Policy Econ. 168:103290. doi: 10.1016/j.forpol.2024.103290
Karstens, S., and Lukas, M. C. (2014). Contested aquaculture development in the protected mangrove forests of the kapuas estuary, west kalimantan. Geoöko 35, 78–121.
Kaskoyo, H., Hartati, F., Bakri, S., Febryano, I. G., Dewi, B. S., and Nurcahyani, N. (2023). Satellite based analysis of mangrove cover and density change in mangroves of Tulang Bawang District, Lampung Province, Indonesia. Biodiversitas 24:d240557. doi: 10.13057/biodiv/d240557
Kidane, M., Bezie, A., Kesete, N., and Tolessa, T. (2019). The impact of land use and land cover (LULC) dynamics on soil erosion and sediment yield in Ethiopia. Heliyon 5:e02981. doi: 10.1016/j.heliyon.2019.e02981
Kong, X., Zhou, Z., and Jiao, L. (2021). Hotspots of land-use change in global biodiversity hotspots. Resour. Conserv. Recycling 174:105770. doi: 10.1016/j.resconrec.2021.105770
Krishnan, A., and Ramasamy, J. (2022). An assessment of land use and land cover changes in muthupet mangrove forest, using time series analysis 1975-2015, Tamilnadu, India. Geosfera Indonesia 7:28077. doi: 10.19184/geosi.v7i2.28077
Lai, J., Cheah, W., Palaniveloo, K., Suwa, R., and Sharma, S. (2022). A systematic review of the physicochemical and microbial diversity of well-preserved, restored, and disturbed mangrove forests: What is known and what is the way forward? Forests 13:2160. doi: 10.3390/f13122160
Li, C., Fang, S., Geng, X., Yuan, Y., Zheng, X., Zhang, D., et al. (2023). Coastal ecosystem service in response to past and future land use and land cover change dynamics in the Yangtze river estuary. J. Cleaner Production 385:135601. doi: 10.1016/j.jclepro.2022.135601
Li, D., Yang, Y., Xia, F., Sun, W., Li, X., and Xie, Y. (2022). Exploring the influences of different processes of habitat fragmentation on ecosystem services. Landsc. Urban Plann. 227:104544. doi: 10.1016/j.landurbplan.2022.104544
Li, J., and Bortolot, Z. J. (2022). Quantifying the impacts of land cover change on catchment-scale urban flooding by classifying aerial images. J. Cleaner Production 344:130992. doi: 10.1016/j.jclepro.2022.130992
Li, S., Wang, L., Zhao, S., Gui, F., and Le, Q. (2023). Landscape ecological risk assessment of zhoushan island based on LULC change. Sustainability 15:9507. doi: 10.3390/su15129507
Liu, J., Coomes, D. A., Gibson, L., Hu, G., Liu, J., Luo, Y., et al. (2019). Forest fragmentation in China and its effect on biodiversity. Biol. Rev. 94:12519. doi: 10.1111/brv.12519
Liu, M., Gao, Y., Wei, H., Dong, X., Zhao, B., Wang, X. C., et al. (2022). Profoundly entwined ecosystem services, land-use change and human well-being into sustainability management in Yushu, Qinghai-Tibet Plateau. J. Geogr. Sci. 32:6926. doi: 10.1007/s11442-022-2021-6
Liu, S., Li, X., Chen, D., Duan, Y., Ji, H., Zhang, L., et al. (2020). Understanding Land use/Land cover dynamics and impacts of human activities in the Mekong Delta over the last 40 years. Glob. Ecol. Conserv. 22:e00991. doi: 10.1016/j.gecco.2020.e00991
Ma, J., Li, J., Wu, W., and Liu, J. (2023). Global forest fragmentation change from 2000 to 2020. Nat. Commun. 14:3752. doi: 10.1038/s41467-023-39221-x
Mallick, B., Priodarshini, R., Kimengsi, J. N., Biswas, B., Hausmann, A. E., Islam, S., et al. (2021). Livelihoods dependence on mangrove ecosystems: Empirical evidence from the Sundarbans. Curr. Res. Environ. Sustainabil. 3:100077. doi: 10.1016/j.crsust.2021.100077
Mama, A., Chougong, D., Dingong, G., Bessa, A., Dicka, E., Ajonina, G., et al. (2024). Dendrometrical structure and physicochemical analysis of mangrove sediments from the nyong river estuary (Cameroon, Atlantic Coast). J. Water Resour. Ocean Sci. 13, 23–41. doi: 10.11648/j.wros.20241302.11
Mansori, M., Badehian, Z., Ghobadi, M., and Maleknia, R. (2023). Assessing the environmental destruction in forest ecosystems using landscape metrics and spatial analysis. Sci. Rep. 13:15165. doi: 10.1038/s41598-023-42251-6
Menéndez, P., Losada, I. J., Torres-Ortega, S., Narayan, S., and Beck, M. W. (2020). The global flood protection benefits of mangroves. Sci. Rep. 10:4404. doi: 10.1038/s41598-020-61136-6
Mishra, M., Acharyya, T., Santos, C. A. G., Silva, R. M., Kar, D., Mustafa Kamal, A. H., et al. (2021). Geo-ecological impact assessment of severe cyclonic storm Amphan on Sundarban mangrove forest using geospatial technology. Estuarine Coastal Shelf Sci. 260:107486. doi: 10.1016/j.ecss.2021.107486
Mohamed, M. K., Adam, E., and Jackson, C. M. (2023). Policy review and regulatory challenges and strategies for the sustainable mangrove management in Zanzibar. Sustainability 15:1557. doi: 10.3390/su15021557
Montalván-Burbano, N., Velastegui-Montoya, A., Gurumendi-Noriega, M., Morante-Carballo, F., and Adami, M. (2021). Worldwide research on land use and land cover in the amazon region. Sustainability 13:6039. doi: 10.3390/su13116039
Narmada, K., and Annaidasan, K. (2019). Estimation of the temporal change in carbon stock of muthupet mangroves in tamil nadu using remote sensing techniques. J. Geogr. Environ. Earth Sci. Int. 19, 1–16. doi: 10.9734/jgeesi/2019/v19i430096
Newton, A., Icely, J., Cristina, S., Perillo, G. M. E., Turner, R. E., Ashan, D., et al. (2020). Anthropogenic, direct pressures on coastal wetlands. Front. Ecol. Evol. 8:144. doi: 10.3389/fevo.2020.00144
Ng, C. K. C., and Ong, R. C. (2022). A review of anthropogenic interaction and impact characteristics of the Sundaic mangroves in Southeast Asia. Estuarine Coastal Shelf Sci. 267:107759. doi: 10.1016/j.ecss.2022.107759
Nguyen, H., Harper, R. J., and Dell, B. (2023). Examining local community understanding of mangrove carbon mitigation: A case study from Ca Mau province, Mekong River Delta, Vietnam. Marine Policy 148:105398. doi: 10.1016/j.marpol.2022.105398
Nong, D. H., Ngo, A. T., Nguyen, H. P. T., Nguyen, T. T., Nguyen, L. T., and Saksena, S. (2021). Changes in coastal agricultural land use in response to climate change: An assessment using satellite remote sensing and household survey data in tien hai district, Thai Binh province, Vietnam. Land 10:627. doi: 10.3390/land10060627
Noor, M., Rehman, N., Jalil, A., Fahad, S., Adnan, M., Wahid, F., et al. (2020). “Climate change and costal plant lives,” in Environment, Climate, Plant and Vegetation Growth, eds S. Fahad, S. Saud, and T. Nawaz (Berlin: Springer). doi: 10.1007/978-3-030-49732-3_
Numbere, A. O. (2021). Natural seedling recruitment and regeneration in deforested and sand-filled Mangrove forest at Eagle Island, Niger Delta, Nigeria. Ecol. Evol. 11, 3148–3158. doi: 10.1002/ece3.7262
Nyangoko, B. P., Shalli, M. S., Mangora, M. M., Gullström, M., and Berg, H. (2022). Socioeconomic determinants of mangrove exploitation and management in the Pangani River Estuary, Tanzania. Ecol. Soc. 27, 686–689. doi: 10.5751/ES-13227-270232
Olorunfemi, I. E., Fasinmirin, J. T., Olufayo, A. A., and Komolafe, A. A. (2020). GIS and remote sensing-based analysis of the impacts of land use/land cover change (LULCC) on the environmental sustainability of Ekiti State, southwestern Nigeria. Environ. Dev. Sustainabil. 22, 661–692. doi: 10.1007/s10668-018-0214-z
Onyena, A. P., and Sam, K. (2020). A review of the threat of oil exploitation to mangrove ecosystem: Insights from Niger Delta, Nigeria. Glob. Ecol. Conserv. 22:e00961. doi: 10.1016/j.gecco.2020.e00961
Opelele Omeno, M., Ying, Y., Fan, W., Tolerant, L., Chen, C., and Kachaka, S. K. (2024). Household dependence on forest resources in the luki biosphere reserve, democratic republic of CONGO. Environ. Manag. 74, 282–298. doi: 10.1007/s00267-024-01960-y
Ozsahin, E., Duru, U., and Eroglu, I. (2018). Land use and land cover changes (LULCC), a key to understand soil erosion intensities in the Maritsa Basin. Water 10:335. doi: 10.3390/w10030335
Palmeirim, A. F., Farneda, F. Z., Vieira, M. V., and Peres, C. A. (2021). Forest area predicts all dimensions of small mammal and lizard diversity in Amazonian insular forest fragments. Landsc. Ecol. 36, 3401–3418. doi: 10.1007/s10980-021-01311-w
Pasaribu, U. S., Virtriana, R., Deliar, A., and Sumarto, I. (2020). Driving-factors identification of land-cover change in west java using binary logistic regression based on geospatial data. IOP Conf. Ser. Earth Environ. Sci. 500:012003. doi: 10.1088/1755-1315/500/1/012003
Phan, M. H., and Stive, M. J. F. (2022). Managing mangroves and coastal land cover in the Mekong Delta. Ocean Coastal Manag. 219:106013. doi: 10.1016/j.ocecoaman.2021.106013
Polat, N., and Kaya, Y. (2021). Investigation of the performance of different pixel-based classification methods in land Use/land cover (LULC) determination. Türkiye İnsansız Hava Araçları Dergisi 3:829656. doi: 10.51534/tiha.829656
Pu, J., Shen, A., Liu, C., and Wen, B. (2024). Impacts of ecological land fragmentation on habitat quality in the Taihu Lake basin in Jiangsu Province, China. Ecol. Ind. 158:111611. doi: 10.1016/j.ecolind.2024.111611
Ramos, J. G., Gracia-Sánchez, J., and Marrufo-Vázquez, L. (2023). Loss of mangroves as a consequence of the anthropic interactions downstream a river basin. J. Ecohydraulics 8:1820913. doi: 10.1080/24705357.2020.1820913
Rivas, C. A., Guerrero-Casado, J., and Navarro-Cerillo, R. M. (2021). Deforestation and fragmentation trends of seasonal dry tropical forest in Ecuador: Impact on conservation. Forest Ecosyst. 8:46. doi: 10.1186/s40663-021-00329-5
Rizki, R., and Leilani, I. (2020). Sebaran Jenis Tumbuhan Mangrove Di Teluk Buo Bungus Padang Indonesia. Biotropika J. Trop. Biol. 8, 1–17. doi: 10.21776/ub.biotropika.2020.008.01.01
Rodda, S. R., Thumaty, K. C., Fararoda, R., Jha, C. S., and Dadhwal, V. K. (2022). Unique characteristics of ecosystem CO2 exchange in Sundarban mangrove forest and their relationship with environmental factors. Estuarine Coastal Shelf Sci. 267:107764. doi: 10.1016/j.ecss.2022.107764
Romañach, S. S., DeAngelis, D. L., Koh, H. L., Li, Y., Teh, S. Y., Raja Barizan, R. S., et al. (2018). Conservation and restoration of mangroves: Global status, perspectives, and prognosis. Ocean Coastal Manag. 154, 72–82. doi: 10.1016/j.ocecoaman.2018.01.009
Roy, P. S., Ramachandran, R. M., Paul, O., Thakur, P. K., Ravan, S., Behera, M. D., et al. (2022). Anthropogenic land use and land cover changes—A review on its environmental consequences and climate change. J. Indian Soc. Remote Sens. 50, 1615–1640. doi: 10.1007/s12524-022-01569-w
Rumondang, R., Feliatra, F., Warningsih, T., and Yoswati, D. (2024). Sustainable management model and ecosystem services of mangroves based on socio-ecological system on the coast of Batu Bara Regency, Indonesia. Environ. Res. Commun. 6:035008. doi: 10.1088/2515-7620/ad2d01
Sabriyati, D., Maulidina, A., and Zulfikar, A. (2023). Mangrove density mapping from landsat 8/9 OLI imagery in Dompak Island, Indonesia: A study from 2017 to 2022. BIO Web Conf. 70:01010. doi: 10.1051/bioconf/20237001010
Safitri, R., Marzuki, M., Shafii, M. A., Yusnaini, H., and Ramadhan, R. (2022). Effects of land cover change and deforestation on rainfall and surface temperature in New Capital city of Indonesia. J. Penelitian Pendidikan IPA 8, 2849–2858. doi: 10.29303/jppipa.v8i6.2182
Sahavacharin, A., Sompongchaiyakul, P., and Thaitakoo, D. (2022). The effects of land-based change on coastal ecosystems. Landsc. Ecol. Eng. 18, 351–366. doi: 10.1007/s11355-022-00505-x
Saleem, A., Awange, J. L., and Corner, R. (2021). Exploiting a texture framework and high spatial resolution properties of panchromatic images to generate enhanced multi-layer products: Examples of Pleiades and historical CORONA space photographs. Int. J. Remote Sens. 42:1820617. doi: 10.1080/01431161.2020.1820617
Salomon, W., Sikuzani, Y. U., Sambieni, K. R., Kouakou, A. T. M., Barima, Y. S. S., Théodat, J. M., et al. (2022). Land cover dynamics along the urban–rural gradient of the port-au-prince agglomeration (Republic of Haiti) from 1986 to 2021. Land 11:355. doi: 10.3390/land11030355
Saragi-Sasmito, M. F., Murdiyarso, D., June, T., and Sasmito, S. D. (2019). Carbon stocks, emissions, and aboveground productivity in restored secondary tropical peat swamp forests. Mitigation Adaptation Strategies Glob. Change 24, 521–533. doi: 10.1007/s11027-018-9793-0
Sasmito, S. D., Basyuni, M., Kridalaksana, A., Saragi-Sasmito, M. F., Lovelock, C. E., and Murdiyarso, D. (2023). Challenges and opportunities for achieving sustainable development goals through restoration of Indonesia’s mangroves. Nat. Ecol. Evol. 7, 62–70. doi: 10.1038/s41559-022-01926-5
Satapathy, S. K., Brahma, B., Panda, B., Barsocchi, P., and Bhoi, A. K. (2024). Machine learning-empowered sleep staging classification using multi-modality signals. BMC Med. Informatics Decision Making 24:119. doi: 10.1186/s12911-024-02522-2
Selmy, S. A. H., Kucher, D. E., Mozgeris, G., Moursy, A. R. A., Jimenez-Ballesta, R., Kucher, O. D., et al. (2023). Detecting, analyzing, and predicting land use/land cover (LULC) changes in arid regions using landsat images, CA-Markov hybrid model, and GIS techniques. Remote Sens. 15:5522. doi: 10.3390/rs15235522
Sharma, D., Rao, K., and Ramanathan, A. (2022). A systematic review on the impact of urbanization and industrialization on indian coastal mangrove ecosystem. Coastal Res. Library 38, 175–199. doi: 10.1007/978-3-030-84255-0_8
Sidik, F., Lawrence, A., Wagey, T., Zamzani, F., and Lovelock, C. E. (2023). Blue carbon: A new paradigm of mangrove conservation and management in Indonesia. Mar. Policy 147:105388. doi: 10.1016/j.marpol.2022.105388
Solihuddin, T., Triana, K., Rachmayani, R., Husrin, S., Pramudya, F. A., Salim, H. L., et al. (2024). The impact of coastal erosion on land cover changes in Muaragembong, Bekasi, Indonesia: A spatial approach to support coastal conservation. J. Coastal Conserv. 28:43. doi: 10.1007/s11852-024-01045-2
Stehman, S. V., and Foody, G. M. (2019). Key issues in rigorous accuracy assessment of land cover products. Remote Sens. Environ. 231:111199. doi: 10.1016/j.rse.2019.05.018
Sugianto, S., Deli, A., Miswar, E., Rusdi, M., and Irham, M. (2022). The effect of land use and land cover changes on flood occurrence in teunom watershed, Aceh Jaya. Land 11:1271. doi: 10.3390/land11081271
Sugiardi, S. (2020). Factors affecting the performance of the traditional fisheries fishing effort in the regency of Kubu Raya, West Borneo. Sustainabil. Manag. Forum 28, 61–71. doi: 10.1007/s00550-020-00495-0
Sumani, Supriyadi, Masiyah, S., and Aryani, W. (2021). The evaluate soil quality of mangrove forest in Merauke, Papua. IOP Conf. Ser. Earth Environ. Sci. 724:012019. doi: 10.1088/1755-1315/724/1/012019
Sumarga, E., Sholihah, A., Srigati, F. A. E., Nabila, S., Azzahra, P. R., and Rabbani, N. P. (2023). Quantification of ecosystem services from urban mangrove forest: A case study in Angke Kapuk Jakarta. Forests 14:1796. doi: 10.3390/f14091796
Suratiningsih, D. (2023). Strategy for establishing the world mangrove center as a climate change mitigation effort. J. Namibian Stud. History. 34, 2474–2494.
Tarunamulia, Ilman, M., Sammut, J., Paena, M., and Basir Kamariah, et al. (2024). Impact of soil and water quality on the sustainable management of mangrove-compatible brackishwater aquaculture practices in Indonesia. Environ. Res. Commun. 6:99. doi: 10.1088/2515-7620/ad6caa
te Wierik, S. A., Cammeraat, E. L. H., Gupta, J., and Artzy-Randrup, Y. A. (2021). Reviewing the impact of land use and land-use change on moisture recycling and precipitation patterns. Water Resour. Res. 57:e2020WR029234. doi: 10.1029/2020WR029234
Tola, A. M., Demissie, T. A., Saathoff, F., and Gebissa, A. (2021). Severity, spatial pattern and statistical analysis of road traffic crash hot spots in Ethiopia. Appl. Sci. 11:8828. doi: 10.3390/app11198828
Trégarot, E., Caillaud, A., Cornet, C. C., Taureau, F., Catry, T., Cragg, S. M., et al. (2021). Mangrove ecological services at the forefront of coastal change in the French overseas territories. Sci. Total Environ. 763:143004. doi: 10.1016/j.scitotenv.2020.143004
Twisa, S., and Buchroithner, M. F. (2019). Land-use and land-cover (LULC) change detection in Wami river basin, Tanzania. Land 8:136. doi: 10.3390/land8090136
Vu, T. T., and Shen, Y. (2021). Land-use and land-cover changes in dong trieu district, vietnam, during past two decades and their driving forces. Land 10:798. doi: 10.3390/land10080798
Wang, X., Cong, P., Jin, Y., Jia, X., Wang, J., and Han, Y. (2021). Assessing the effects of land cover land use change on precipitation dynamics in guangdong–hong kong–macao greater bay area from 2001 to 2019. Remote Sens. 13:1135. doi: 10.3390/rs13061135
Wang, Y., Sha, Z., Tan, X., Lan, H., Liu, X., and Rao, J. (2020). Modeling urban growth by coupling localized spatio-temporal association analysis and binary logistic regression. Comput. Environ. Urban Syst. 81:101482. doi: 10.1016/j.compenvurbsys.2020.101482
Ward, R. D., Friess, D. A., Day, R. H., and Mackenzie, R. A. (2016). Impacts of climate change on mangrove ecosystems: A region by region overview. Ecosyst. Health Sustainabil. 2:e01211. doi: 10.1002/ehs2.1211
Weitkamp, T., and Karimi, P. (2023). Evaluating the effect of training data size and composition on the accuracy of smallholder irrigated agriculture mapping in mozambique using remote sensing and machine learning algorithms. Remote Sens. 15:3017. doi: 10.3390/rs15123017
Wiarta, R., Indrayani, Y., Mulia, F., and Astiani, D. (2019). Carbon sequestration by young Rhizophora apiculata plants in Kubu Raya district, West Kalimantan, Indonesia. Biodiversitas 20, 311–315. doi: 10.13057/biodiv/d200202
Worthington, T. A., Andradi-Brown, D. A., Bhargava, R., Buelow, C., Bunting, P., Duncan, C., et al. (2020). Harnessing big data to support the conservation and rehabilitation of mangrove forests globally. One Earth 22, 429–443. doi: 10.1016/j.oneear.2020.04.018
Wu, H., Lin, A., Xing, X., Song, D., and Li, Y. (2021). Identifying core driving factors of urban land use change from global land cover products and POI data using the random forest method. Int. J. Appl. Earth Observ. Geoinformation 103:102475. doi: 10.1016/j.jag.2021.102475
Wu, N., Crusiol, L. G. T., Liu, G., Wuyun, D., and Han, G. (2023). Comparing machine learning algorithms for Pixel/object-based classifications of semi-arid grassland in Northern China using multisource medium resolution imageries. Remote Sens. 15:750. doi: 10.3390/rs15030750
Wu, T. (2021). Quantifying coastal flood vulnerability for climate adaptation policy using principal component analysis. Ecol. Indicators 129:108006. doi: 10.1016/j.ecolind.2021.108006
Yagoub, Y. E., Li, Z., Musa, O. S., Anjum, M. N., Wang, F., and Bo, Z. (2017). Investigation of climate and land use policy change impacts on food security in Eastern Sudan, Gadarif State. J. Geogr. Information Syst. 9, 546–557. doi: 10.4236/jgis.2017.95034
Yu, C., Liu, B., Deng, S., Li, Z., Liu, W., Ye, D., et al. (2023). Using medium-resolution remote sensing satellite images to evaluate recent changes and future development trends of mangrove forests on Hainan Island, China. Forests 14:2217. doi: 10.3390/f14112217
Yu, L., and Liu, K. (2024). Land green utilization efficiency and its driving mechanisms in the Zhengzhou Metropolitan Area. Sustainability 16:5447. doi: 10.3390/su16135447
Zhai, R., Zhang, C., Li, W., Zhang, X., and Li, X. (2020). Evaluation of driving forces of land use and land cover change in New England area by a mixed method. ISPRS Int. J. Geo-Information 9:350. doi: 10.3390/ijgi9060350
Keywords: driving factor, changes detection, fragmentation pattern, mangrove forest, Kubu Raya District, Indonesia
Citation: Wiarta R, Firdaus Silamon R, Ishag Arbab M, Badshah MT and Hayat U and Meng J (2025) Assessing of driving factors and change detection of mangrove forest in Kubu Raya District, Indonesia. Front. For. Glob. Change 8:1511361. doi: 10.3389/ffgc.2025.1511361
Received: 14 October 2024; Accepted: 11 April 2025;
Published: 28 April 2025.
Edited by:
Mohamed Elhag, King Abdulaziz University, Saudi ArabiaReviewed by:
Rina Kumari, Central University of Gujarat, IndiaAsmaa Hassan Mohammed, National Authority for Remote Sensing and Space Sciences, Egypt
Copyright © 2025 Wiarta, Firdaus Silamon, Ishag Arbab, Badshah, Hayat and Meng. This is an open-access article distributed under the terms of the Creative Commons Attribution License (CC BY). The use, distribution or reproduction in other forums is permitted, provided the original author(s) and the copyright owner(s) are credited and that the original publication in this journal is cited, in accordance with accepted academic practice. No use, distribution or reproduction is permitted which does not comply with these terms.
*Correspondence: Jinghui Meng, am1lbmdAYmpmdS5lZHUuY24=