 Aditi Sharma
 D. R. Bhardwaj1
 J. P. Sharma
- 1Department of Silviculture and Agroforestry, Dr. Yashwant Singh Parmar University of Horticulture and Forestry, Nauni, India
- 2CSIR – Institute of Himalayan Bioresource Technology, Palampur, India
- 3Department of Tree Improvement and Genetic Resources, Dr. Yashwant Singh Parmar University of Horticulture and Forestry, Nauni, India
The floristic composition of Sal forests is paramount for biodiversity and environmental resilience. Monitoring species diversity contributes to conservation and sustainable management. Considering this, the present study was undertaken to assess the floristic composition and diversity of Shorea robusta-dominated stands in the Paonta Forest Range of Himachal Pradesh. Sample plots of 0.1 ha were laid out (systematic random sampling) in seven compartments, recording 33 genera with 34 species belonging to 26 families. The results revealed that the flora of compartments catalogued with Lai C28 had the maximum (9) tree species, Kukron C15 and Rajban C10 had the maximum shrub species, and Rajban C6 and Rajban C7 had maximum herb species among all the compartments. S. robusta was the dominant species, with IVI varying between 126.72 and 156.59 in the compartments. The similarity index of trees in compartments ranged from 0.67 to 1.00. Rajban C6 and Rajban C7 had the maximum similarity index. This research focused on documenting the diversity of plants within the Sal Forest of Himachal Pradesh, India, and produced valuable scientific data and a fundamental understanding for the conservation of biodiversity and sustainable management.
1 Introduction
Vegetation is a community of plants that grow together in a region and are distinguished by their species composition or the combination of structural and functional characteristics that define their phenotypic characteristics (Goldsmith et al., 1986). Phytosociological study is crucial for understanding forest ecology and vegetation dynamics because it evaluates plant species, their distribution, abundance, and structural analysis. This method gives important insights into species diversity and richness in forest ecosystems, which are essential for successful management and understanding of ecosystem functioning (Mandal and Joshi, 2014; Dar and Sundarapandian, 2016; Siraj et al., 2017). The extent of change in forest stands is measured using phytosociological characteristics such as density and total basal cover, which are key metrics for analyzing vegetation types (Mishra et al., 2012; Haq et al., 2023).
Each species in a community is structurally and functionally distinct, with varied ecological amplitude and modality. Thus, floristic composition and phytosociological features can be used to compare communities throughout seasons and years (Singh and Joshi, 1979). The species diversity, floristic composition, and vegetation structure are essential for assessing the status of natural forests in any area and developing conservation and management plans. The ecological characteristics of sites, such as species richness, diversity, distribution, and abundance, have a significant impact on forest community composition. Furthermore, species diversity indices are important indicators of the stability and sustainability of forest ecosystems (Sarkar and Devi, 2014; Pandita et al., 2019).
Assessment of species diversity, floristic composition, and vegetation structure is essential for evaluating the status of natural forests and developing appropriate conservation and management policies. The species diversity, floristic composition, and vegetation structure are essential for assessing the status of natural forests in any region (May and Stumpf, 2000). In fact, those ecological features, such as species richness, diversity, distribution, abundance, and regeneration, very often define the composition of forest communities and influence overall ecosystem health significantly (Lindenmayer et al., 2006; Bhat et al., 2020). A forest with high plant diversity generally indicates fertile soil and supports a wider range of animal species, as biodiversity is a key driver of ecosystem function (Noss, 1999). Studies on ecology concentrate on understanding vegetation composition and ecological factors, such as species richness and diversity, due to their importance (Zhang et al., 2013). Studying vegetation structure in a plant ecosystem can reveal age groups and forest regeneration patterns, which determine future species composition and stocking density (Behera et al., 2023). The floristic assessment and the ecological variations occurring within the Sal forest could be helpful to give scientific silvicultural practices or interventions to increase productivity while maintaining the health of the ecosystem (Saikia et al., 2017). Different forest ecosystems have varied floristic composition and environmental variables, such as temperature, resource availability, herbivorous activity, and anthropogenic activities, all impacting species richness and abundance (Poorter et al., 2024).
Shorea robusta Gaertn. f. is a tropical tree endemic to South Asia, ranging from Myanmar in the east to Bangladesh, Nepal, and India in the west, encompassing nearly 12 million hectares of forest (Troup, 1921; Tewari, 1995). It is a huge deciduous timber species that grows in a mono-specific canopy and requires full overhead light from its early establishment. The tree may grow up to 50 m tall (usually 18–32 m), with a straight cylindrical bole and a diameter of 3–5 m (Kayastha, 1985; Chitale and Behera, 2012; Swaminathan and Kochhar, 2019). Sal is highly adaptable to a wide range of climatic conditions and may thrive in deciduous, semi-evergreen, or evergreen forests, depending on the microclimate, geology, and soil characteristics (Kumar and Saikia, 2020c; Mishra et al., 2021). Its geographical range includes the southern Himalayan slopes, lower foothills, plains, riverbanks, and valleys of India, Nepal, Bangladesh, Bhutan, and South China, with coordinates of 75°–95°E longitude and 20°–32°N latitude (Sapkota, 2009). Sal is an ecologically and commercially significant plant widespread throughout South Asia (Sharma et al., 2022). Recognized as an endangered species by the International Union for Conservation of Nature (IUCN), it holds significant socioeconomic value. Sal is commonly used for timber, medicinal purposes, animal feed, fuelwood, dried leaves for cooking and heating, fresh leaves for plate making, edible seeds, and religious ceremonies (Kumar and Saikia, 2021).
In India, forests cover nearly 21.71% of the country’s total geographical area (Forest Survey of India, 2021). In tropical India, Sal forest comprises approximately 13.30% of the total forest area (Satya and Nayaka, 2005). It stretches up to Assam, Meghalaya, and Tripura in the east to the foothills of north-west Bengal, Uttar Pradesh, Uttarakhand, and Paonta Sahib in Himachal Pradesh in the Himalayan foothill region. In Sal forests, there are generally four separate layers: Shorea robusta and Terminalia alata in the top story, Syzygium cumunii in the middle story with Mallotus philippensis as a co-dominant tree species, and Ardisia solanacea, Clerodendron viscosum, and Lantana camara as understory associate species in the shrub layer and Pogostuimon benghalensis in the herb layer.
Sal forests, which are influenced by microclimate, geology, and soil characteristics, can be deciduous, semi-evergreen, or evergreen in phenological patterns, structure, and composition (Kumar and Saikia, 2020b), resilient to anthropogenic disturbances (Rahman et al., 2009; Sapkota et al., 2010; Behera et al., 2023) and climate change responses (Mishra et al., 2021; Kongkham et al., 2021; Shankar and Garkoti, 2023). In Himachal Pradesh, the Sal Forest is present in the Paonta and Andreta villages of the districts Sirmour and Kangra with a total area of approximately 306.97 km2 (Sharma et al., 2020). Champion and Seth (1968a) classified the division’s forest types as: 3C/C2a Moist Shiwalik Sal Forests, 3C/C2b(i) Moist Bhabar Sal-Bhabhar-Dun Sal Forest, 5b/C1a Dry Shiwalik Sal Forests, and 5b/C2 Northern Dry Mixed Deciduous Forests.
This study was conducted within the framework of sustainable forest management, with an approved silvicultural felling plan in the Paonta Forest Division. It aims to increase forest production, conserve biodiversity, and promote climate resilience. Recognizing the ecological and economic importance of Sal forests, the study hypothesizes a significant research gap by studying inter-compartmental variation in floristic composition, which often goes undetected in large-scale studies. Unlike previous studies conducted over extensive geographical areas, this study emphasizes the significance of site-specific silvicultural planning by accounting for variability driven by site quality, geographical parameters, and human activities. Thus, the current study addresses significant research issues such as how floristic diversity differs between compartments, what phytosociological characteristics and diversity measures (e.g., species richness, Shannon-Wiener index, Simpson’s index) define these compartments and how much inter-compartmental differences in dominance exist, which will form the scientific base for developing a set of targeted silvicultural interventions, and which will leverage inter-compartmental variations to ensure sustainable forest management and balanced ecosystem resilience. Therefore, this study was carried out with the following objectives: (1) to analyze inter-compartmental variation in floristic composition and phytosociology and (2) dominance patterns and diversity indices in Sal forest ecosystems in Himachal Pradesh.
2 Materials and methods
2.1 Study area
The study was conducted in different compartments selected/approved under Experimental Silvicultural Green Felling in Reserve Forest (RF) of the Paonta forest range of the forest division in Himachal Pradesh situated between 300 22′ 37″ and 300 41′ 36″ North latitude and 7707′19″ and 77049′48″ East latitude at elevations ranging from 300 to 400 m above sea level (Table 1; Figure 1). The study area falls under Moist Bhabhar Sal-Bhabhar-Dun Sal Forest [3C/C2b (i)] (Champion and Seth, 1968b). The study area represents a sub-tropical climate with distinct summer, monsoon, and winter seasons.
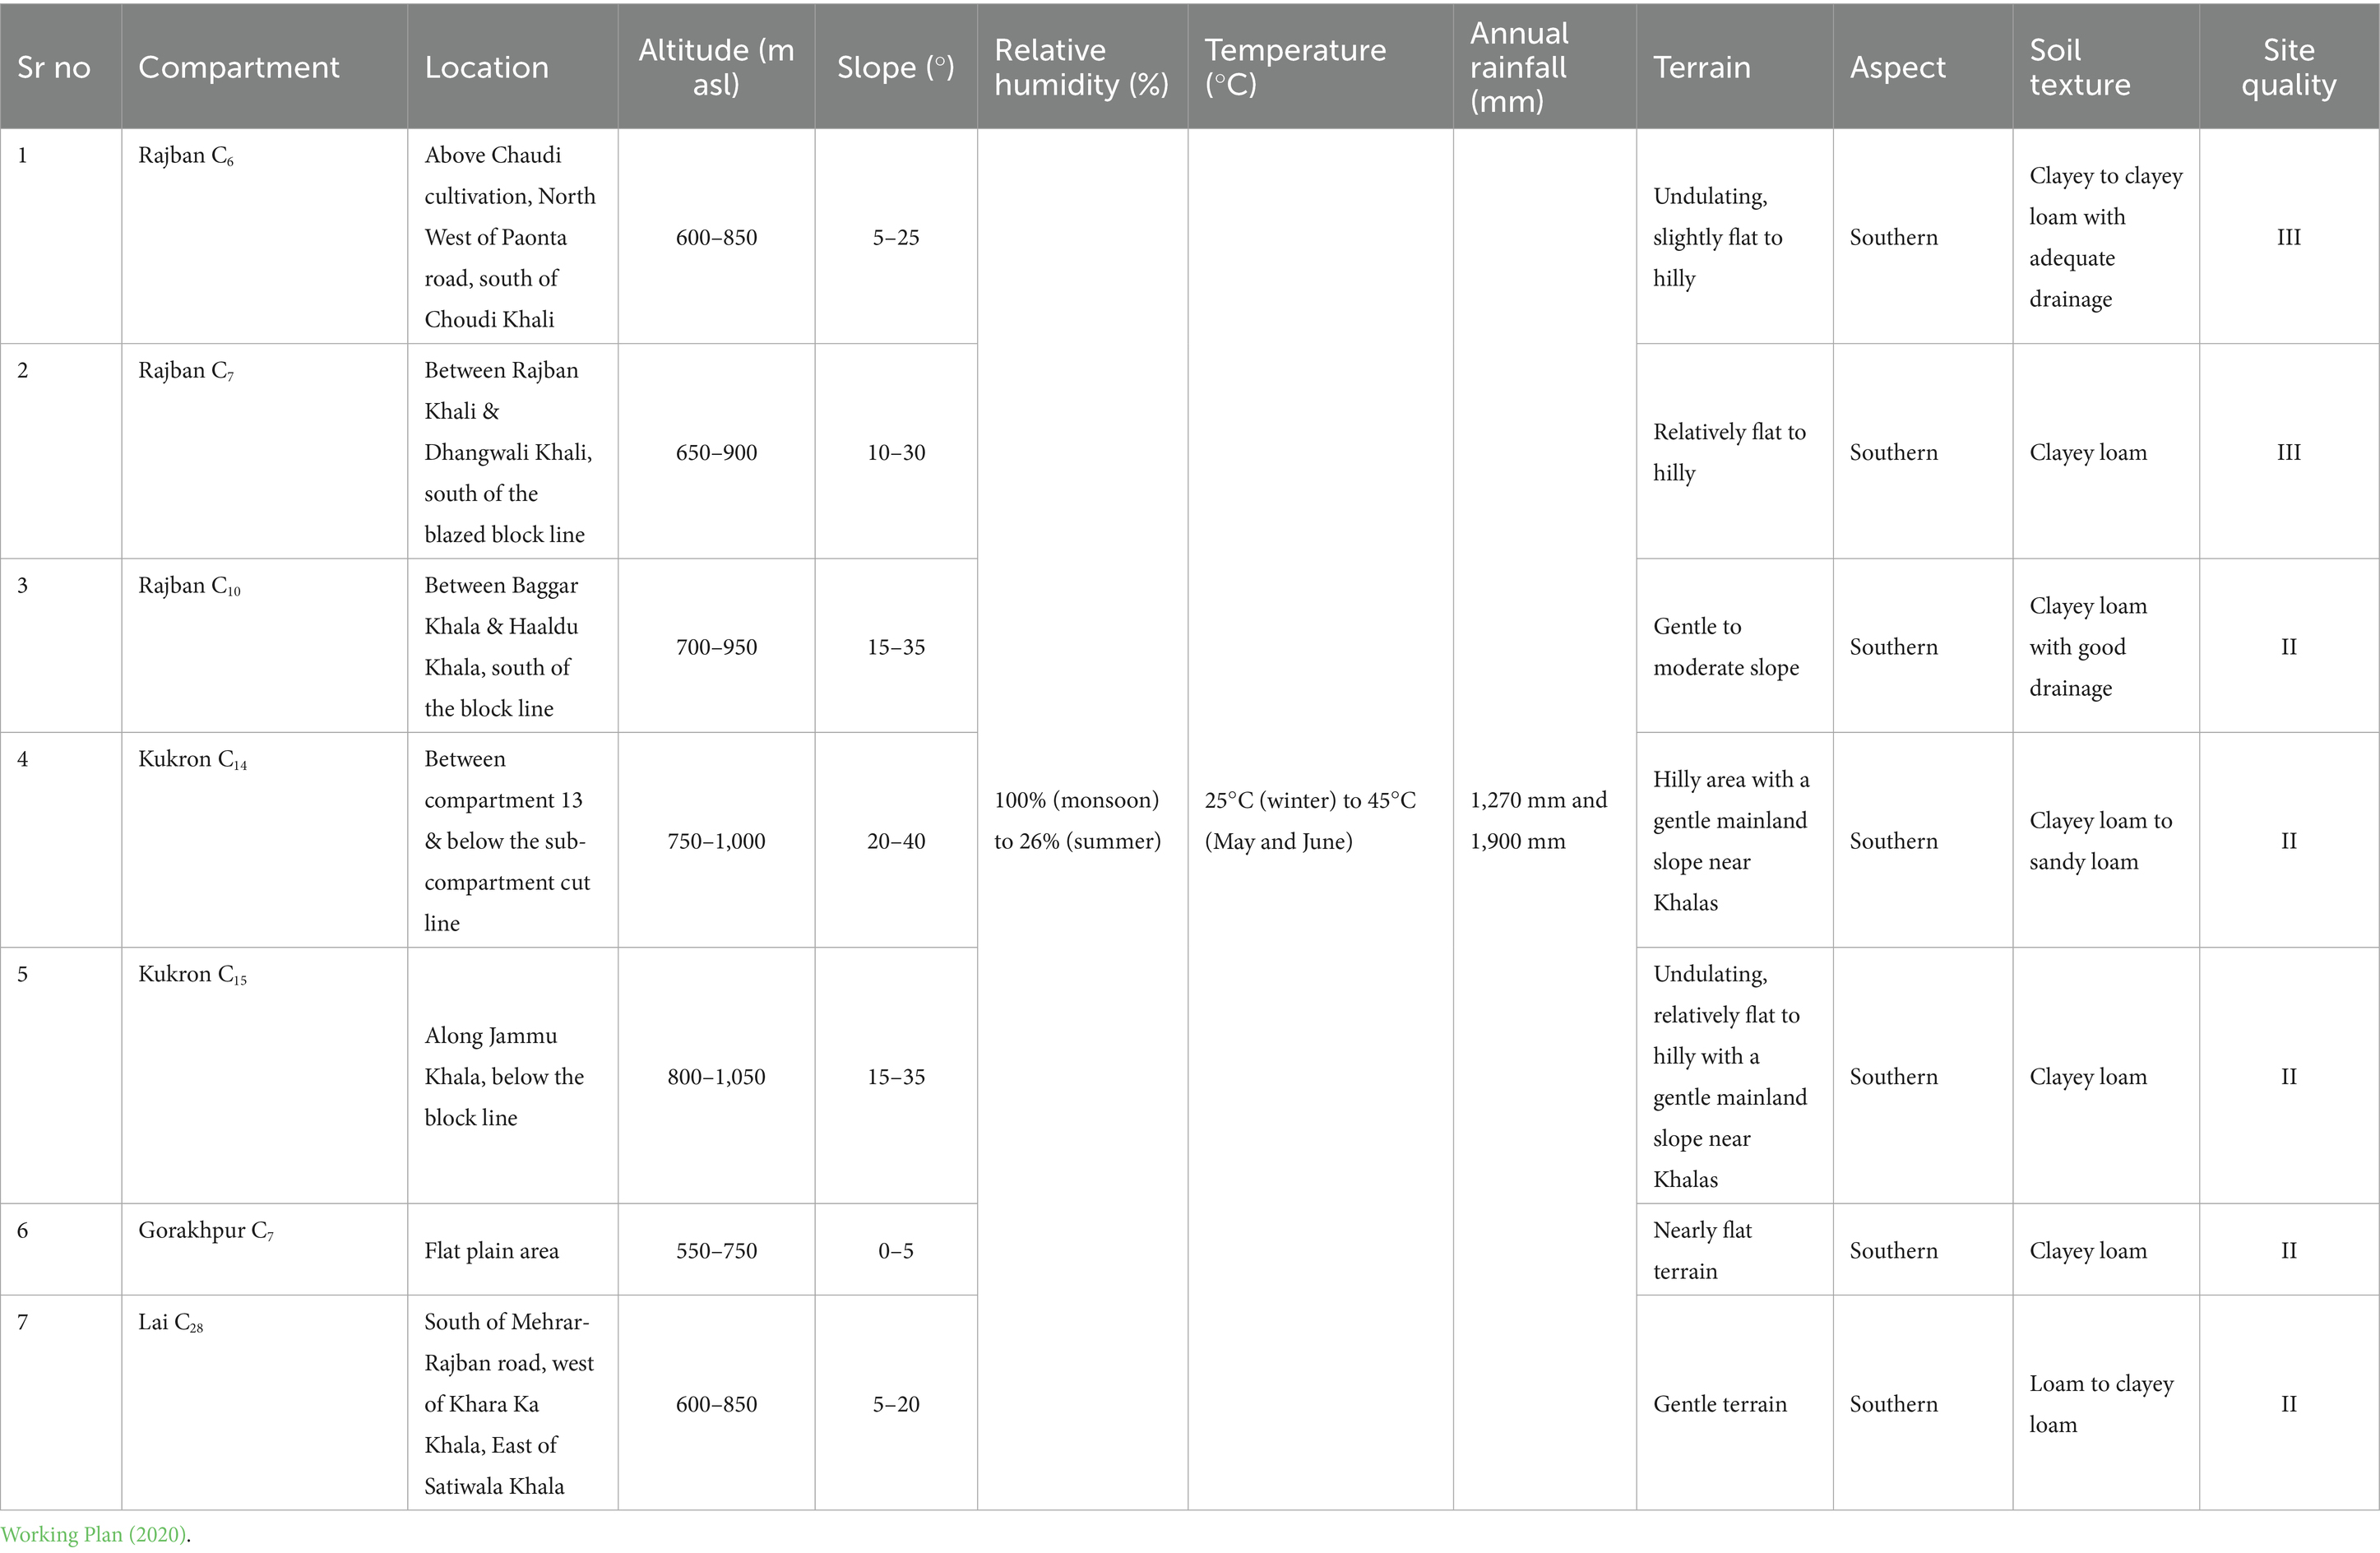
Table 1. Soil and topographical characteristics of different compartments of the Sal Working Circle of Paonta Forest Division, Himachal Pradesh.
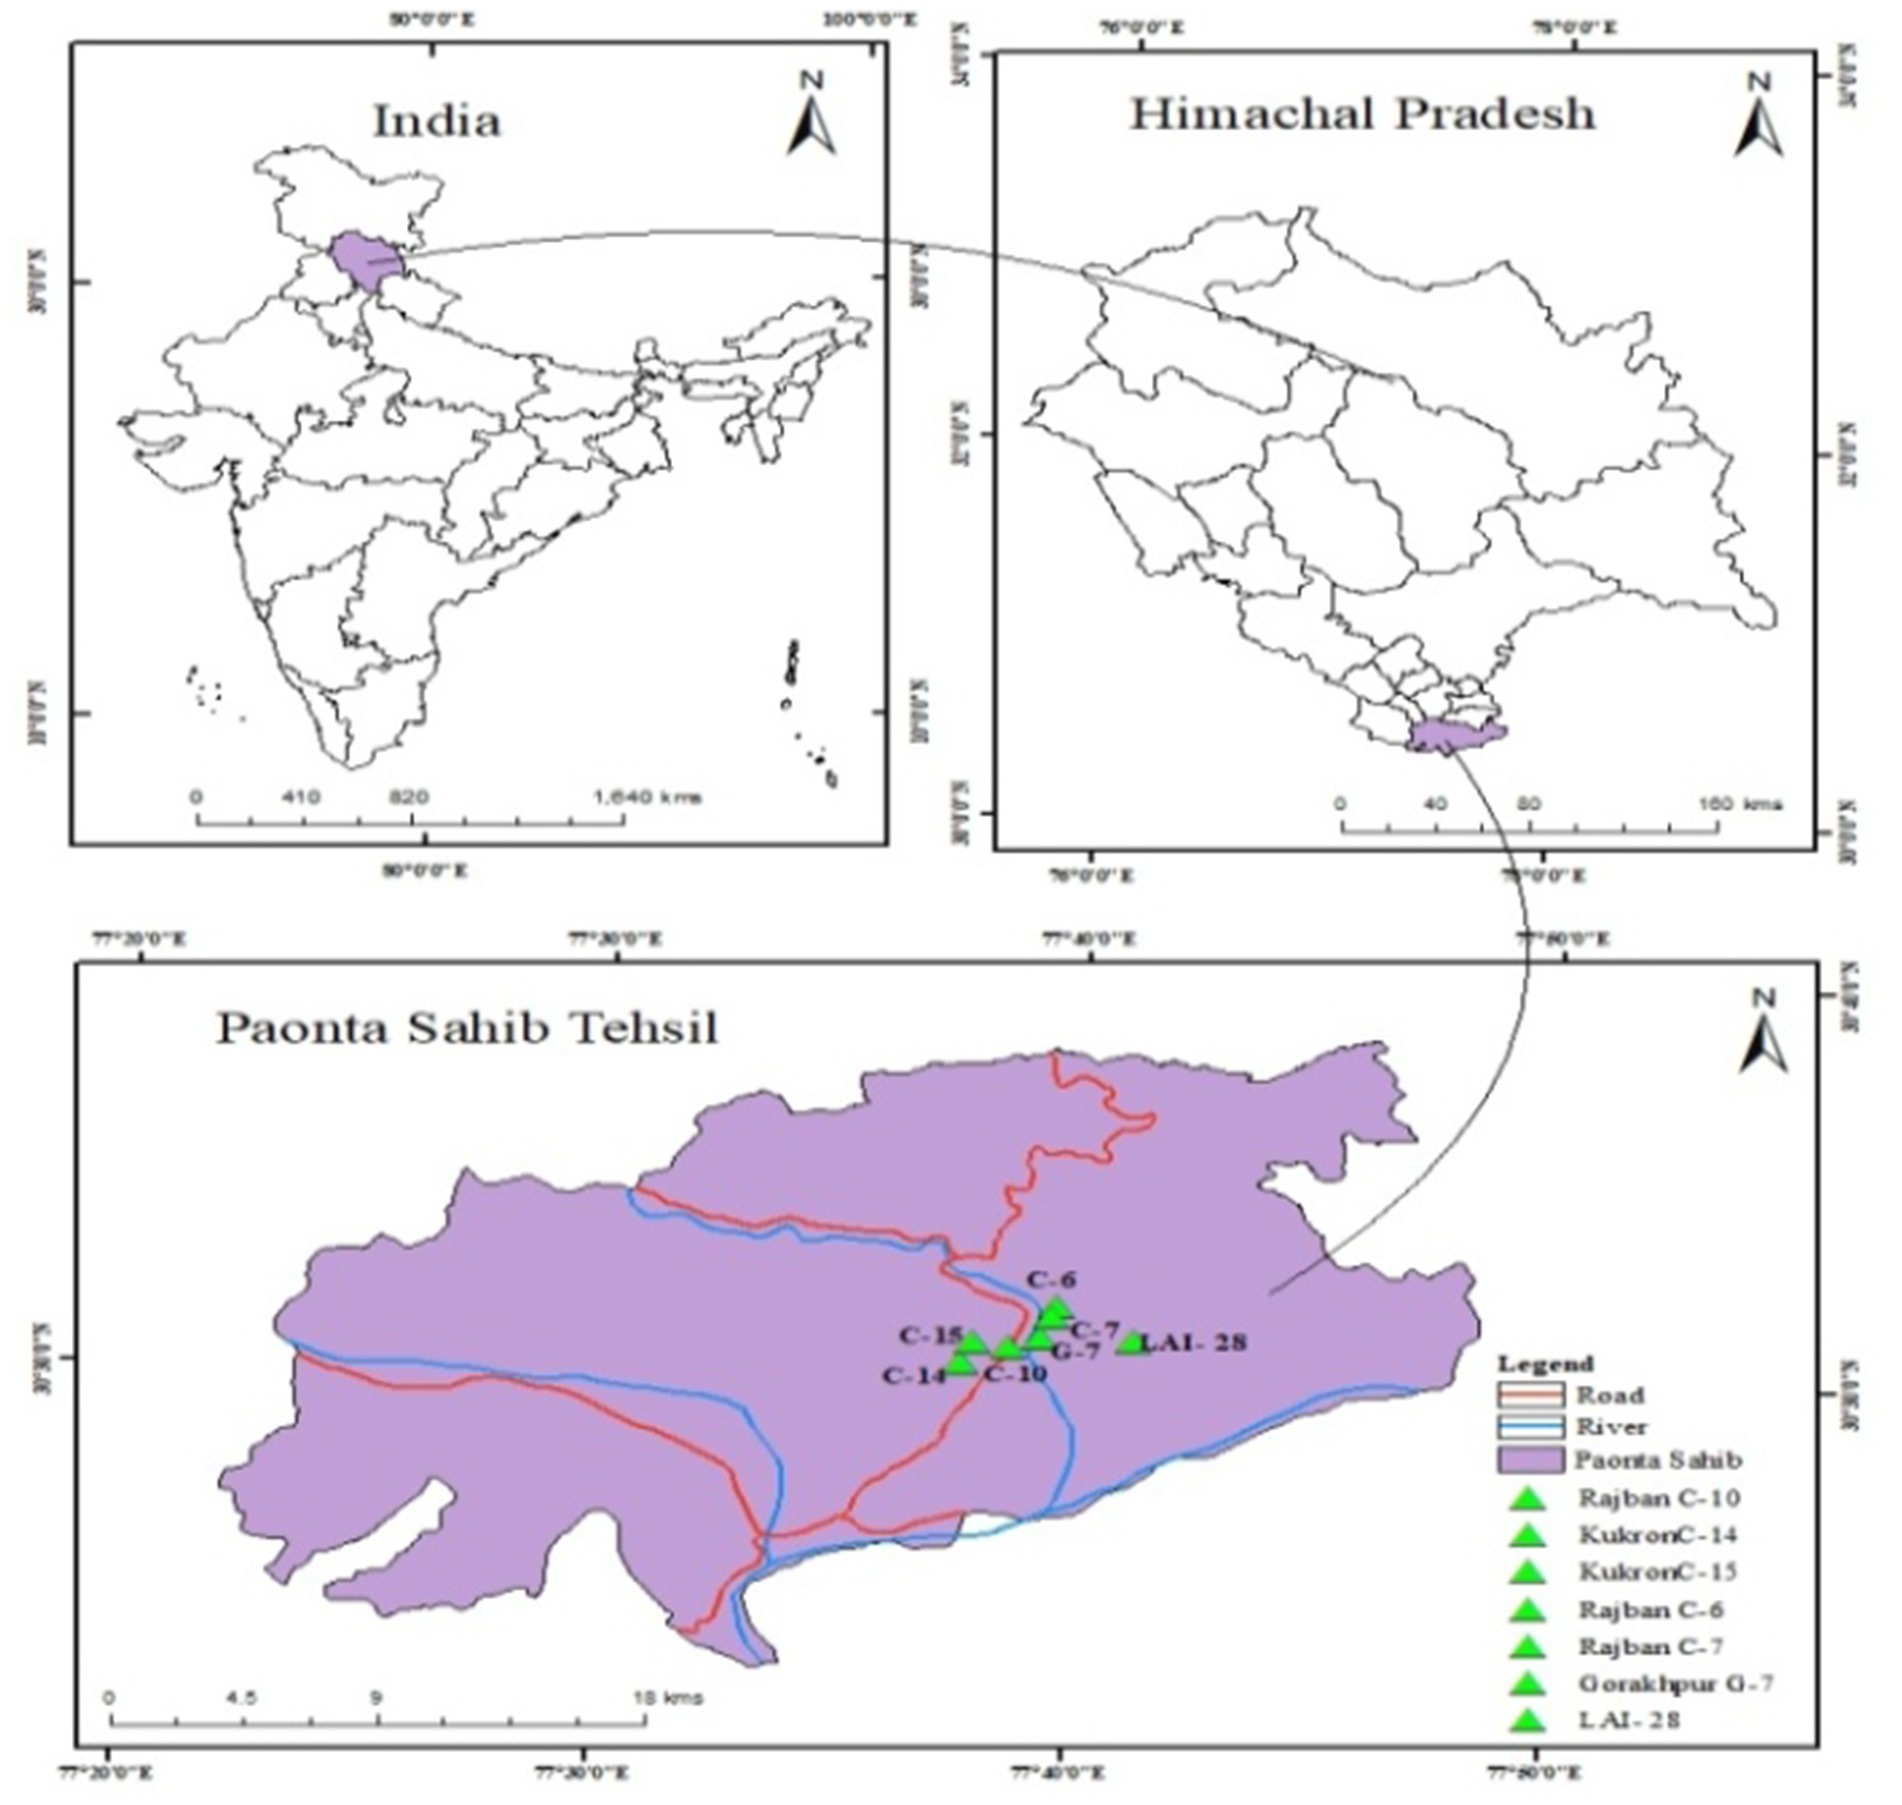
Figure 1. Map of the study area of Paonta Sahib Sal Forest.
In the present study, the seven compartments, viz. Rajban C6,7,10, Kukron C14,15, Gorakhpur C7, and Lai C28, were selected for Experimental Silvicultural Green Felling using a systematic random sampling to represent variations based on site quality (II and III) and periodic blocks (PB I, II, and III) rotation age of the stands within the Sal Conversion Working Circle. Here, the site quality of all the compartments was II except Rajban C7 and Lai C28, which falls in site quality III and all have Sal Conversion Working Circle and PB I with Sal overlapping the silvicultural system of management as per working plan for felling of Sal trees in Paonta Forest Division (2019–2020).
The Hon’ble Supreme Court of India approved the Experimental Silvicultural Felling Program for the reserve forest of Sal in Paonta Forest Division (2018–2020), which strictly adheres to CEC guidelines and ensures compliance with the extended working plan.
In the Sal forests of Site Quality II and III, a 40-cm diameter class is reached in 118 years, resulting in a 120-year rotation period and a 30-year regeneration phase. The working circle is split into four periodic blocks (PBs): PB I (mature and over-mature trees with modest regeneration), PB II (almost mature trees with limited regeneration), and PB III (the remaining regions). Yield control is based on the Von Mantel formula. The Sal Working Circles aim to accomplish sustainable forest management by taking into account management objectives, socioeconomic demands, and biodiversity conservation. The National Working Plan Code-2014 has been utilized to provide detailed mapping, sampling intensity, and distribution of working circles and areas selected for felling operation in the Sal Working Circle. This classification was made to direct silvicultural management inside the Sal Conversion Working Circle, ensuring sustainable growth and regeneration of the stands.
Based on the management framework and compartmental classification outlined in the Working Plan, the same compartments were selected for the present study to ensure consistency in site quality and silvicultural treatment. The area-based sampling approach, as specified in the National Working Plan Code-2014, was used with a standardized sampling unit of 0.1 ha. This method was used to conduct a comprehensive assessment of inter-compartmental variation in floristic composition, diversity indices, and dominance patterns throughout Sal forest ecosystems for the current study.
2.2 Vegetation analysis: sampling, designing, data collection, and analysis
Seven compartments were selected for executing the present study. Under each compartment, a sample plot of 0.1 ha (31.62 × 31.62 m2) was selected for studying structural and functional parameters of tree vegetation. The density of trees was determined by counting trees in each sample plot. The diameter was measured by taking two measurements of stems (major and minor axes) at breast height (1.37 m) with tree calipers, and their mean was calculated as the DBH of a tree. The basal area of each tree in the sample plot was assessed using a tree caliper, and the height was measured with Spiegel Relaskop (Haga Model, 2020). The volume of standing trees was determined using Pressler’s (1865) method. In each 0.1 ha of sample plot for shrub characteristics, two subplots of size 5 m × 5 m were laid out. Furthermore, in each shrub plot, two subplots of size 1 m × 1 m were laid out to study the herb-related traits. Standard measurement procedures were followed for taking primary observations (Figure 2). The specimens were prepared and identified at the Department of Forest Products, Dr. YSP University of Horticulture and Forestry, Nauni, Solan, Himachal Pradesh.
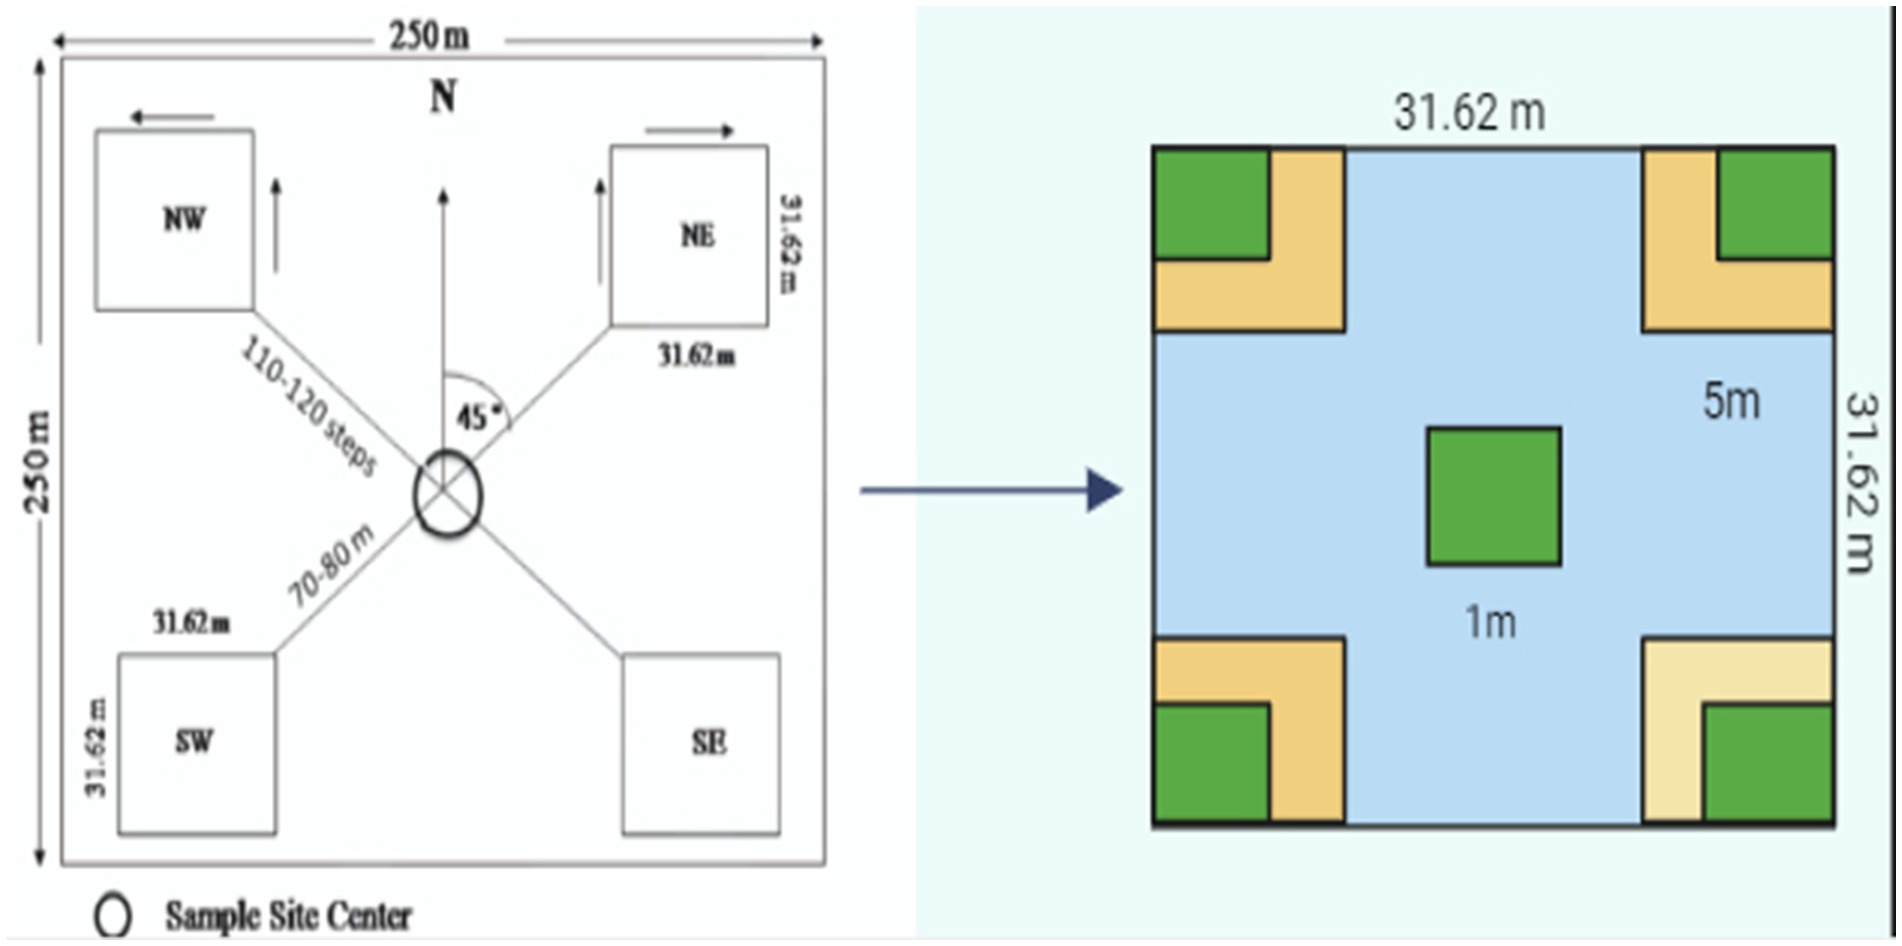
Figure 2. Cluster sample plot design (2-stage sampling) for enumerating trees, shrubs, and herbs sampling.
2.2.1 Sample plot size
Trees: 31.62 m × 31.62 m (0.1 ha)
Shrubs: 5 m × 5 m
Herbs: 1 m × 1 m.
Regeneration: 2 m × 2 m
Replications: 4
2.2.2 Density (N ha−1)
It measured the total number of individuals per unit area and was calculated as:
2.2.3 Basal area (cm2)
It measures the cross-sectional area of the stem, and it is obtained by the following relationship with diameter/girth.
Where; d = Diameter at breast height (1.37 m)
2.2.4 Frequency (%)
It measures the degree of occurrence of a species in sampling units; thus, it expresses the distribution of various species in the community.
2.2.5 Relative density, relative basal area, and relative frequency
These parameters were obtained from percentage frequency, density, and basal area by using the following relationship:
2.2.6 Importance value index (IVI)
IVI is the sum total of relative density, relative basal area, and relative frequency, and was calculated for all herbs, shrubs, and tree species separately for all the compartments.
2.3 Vegetation indices
Community diversity was assessed using non-parametric measures such as diversity indices, and these measures have gradually gained credibility (Magurran, 1988). Simpson diversity index and Simpson concentration of dominance (Simpson, 1949), Margalef index of species richness (Margalef, 1958), the Importance Value Index (IVI) (Phillips, 1959), Shannon–Wiener diversity index (Shannon and Weaver, 1963), Pielou’s equitability (Pielou, 1966), and species richness index of Menheink (Whittaker, 1977) were computed for each compartment under study (Table 2).
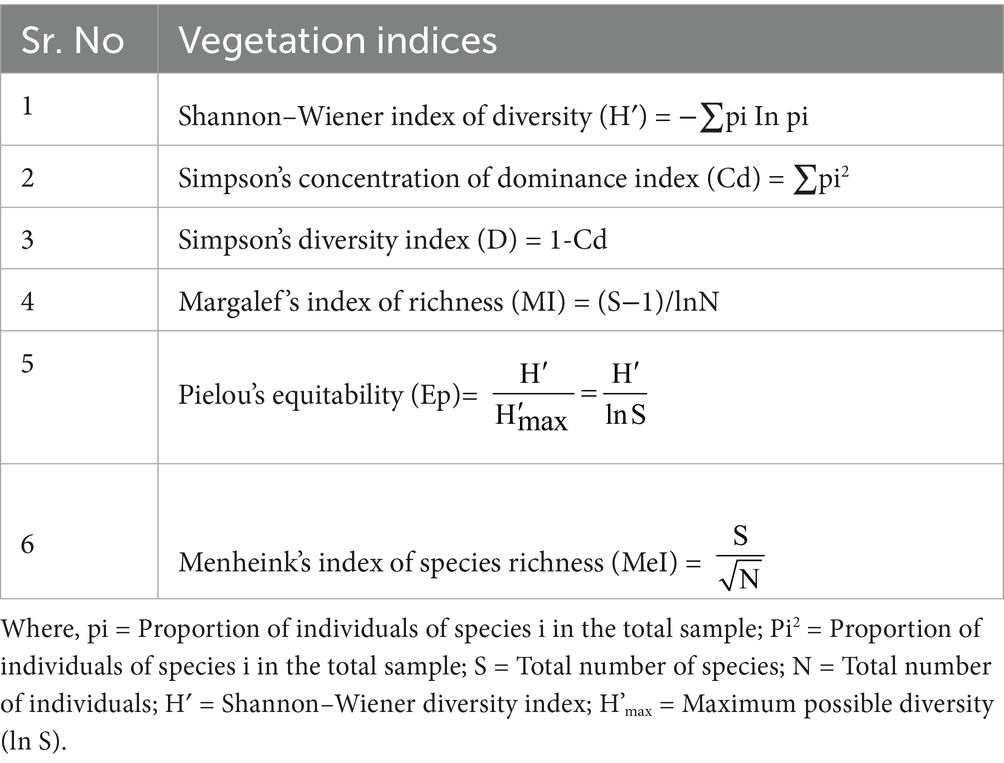
Table 2. Vegetation indices for biodiversity analysis.
2.4 Similarity index and dissimilarity index
Where, A = number of species in community A; B = number of species in community B; C = number of common species in both the communities.
2.5 Statistical analysis
The phytosociological data were analyzed using Microsoft Excel 2010. Species diversity matrices were calculated using the software Past 3.1 program (version 3.1; Oyvind Hammer, Natural History Museum, University of Oslo) (Hammer et al., 2001).
3 Results
The floristic assessment of the Sal Working Circle in Paonta Forest Division found diversity of tree, shrub, and herb species. The phytosociological study of Shorea robusta and its associate plants examined dominance, structural variation, and diversity patterns. Whereas, similarity and dissimilarity indexes measured species composition dynamics, supporting sustainable management and biodiversity conservation in Paonta Forest Division, Himachal Pradesh.
3.1 Species distribution: diversity of trees, shrubs, and herbs
The study of various phytosociological attributes revealed that different compartments of the Sal Working Circle of Paonta Forest Division (Figure 3) constituted 33 genera with 34 species belonging to 26 families. In Rajban C6, six tree species, 10 shrubs, and 10 herbs were identified. Similarly, Rajban C7 had six tree species, 10 shrub species, and 10 herb species. Kukron C14 contained six tree species, nine shrub species, and nine herb species, whereas Rajban C10 comprised 11 shrub species and eight herb species. In addition, seven tree species, 11 shrub species, and eight herb species were documented in Kukron C15; and six tree species, 10 shrub species, and eight herb species were identified in Gorakhpur C7. Finally, Lai C28 included nine tree species, eight shrub species, and nine herb species, respectively.
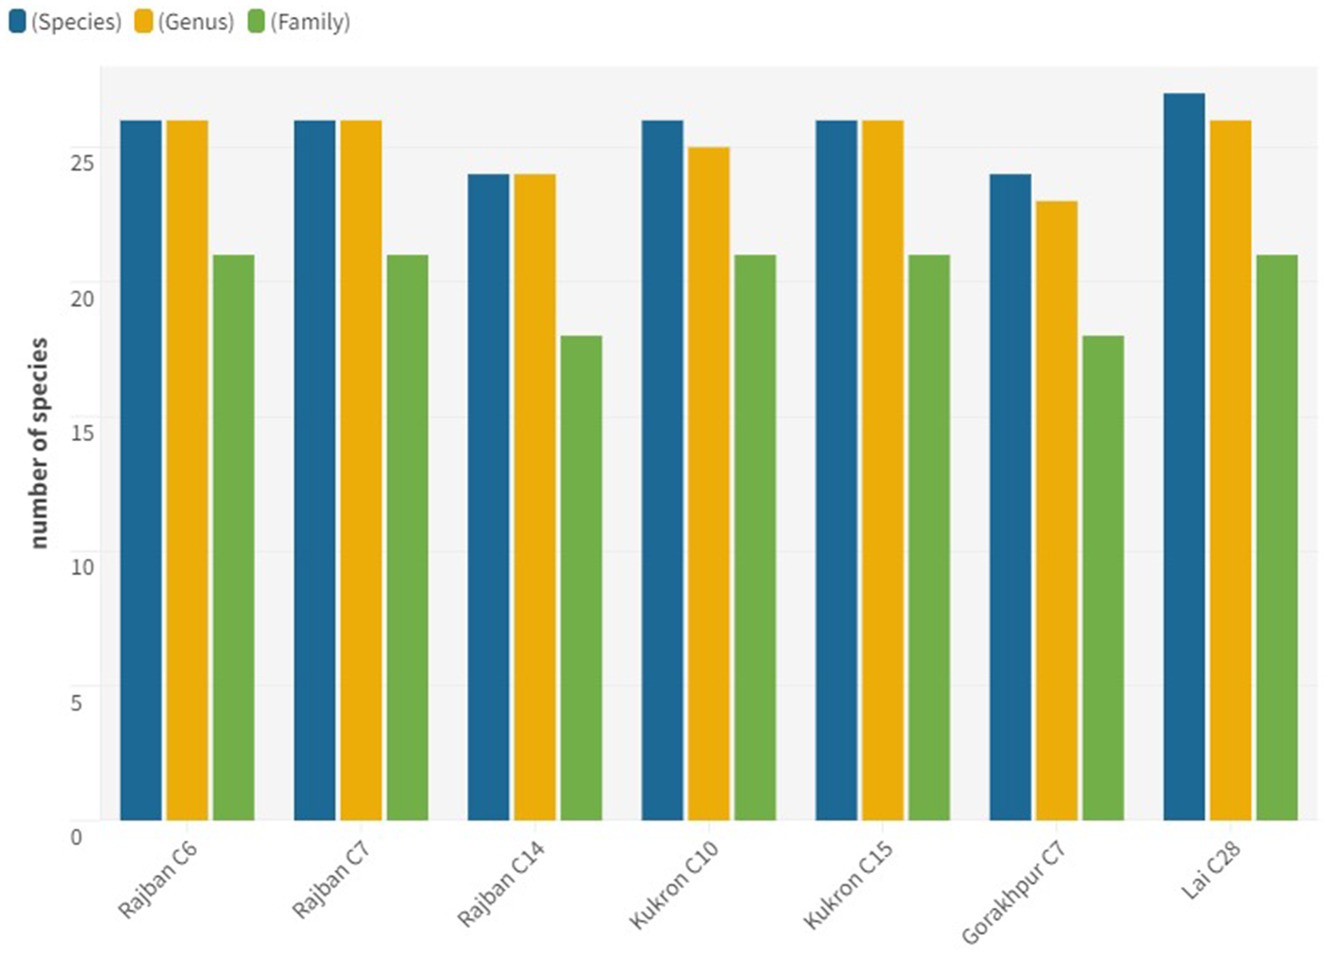
Figure 3. Floral distribution of vegetation under different compartments in the Sal Working Circle.
3.2 Phytosociology of the standing crop of S. robusta and its associates
The phytosociological study of the standing crop of S. robusta and its associates throughout seven compartments (Tables 3–5) revealed that among the tree component, S. robusta is consistently dominant among tree species in all the compartments with Importance Value Index varied between 126.72 in Gorakhpur C7 to 156.59 in Rajban C10 (Figure 4). Among shrubs, Ardisia solanacea had the highest IVI, ranging from 72.35 in Rajban C10 to 109.98 in Gorakhpur C7 (Figure 5). In the herb layer, Apluda mutica was the most prevalent species in most compartments, with an IVI ranging from 55.14 in Rajban C6 to 86.81 in Kukron C15 (Figure 6).
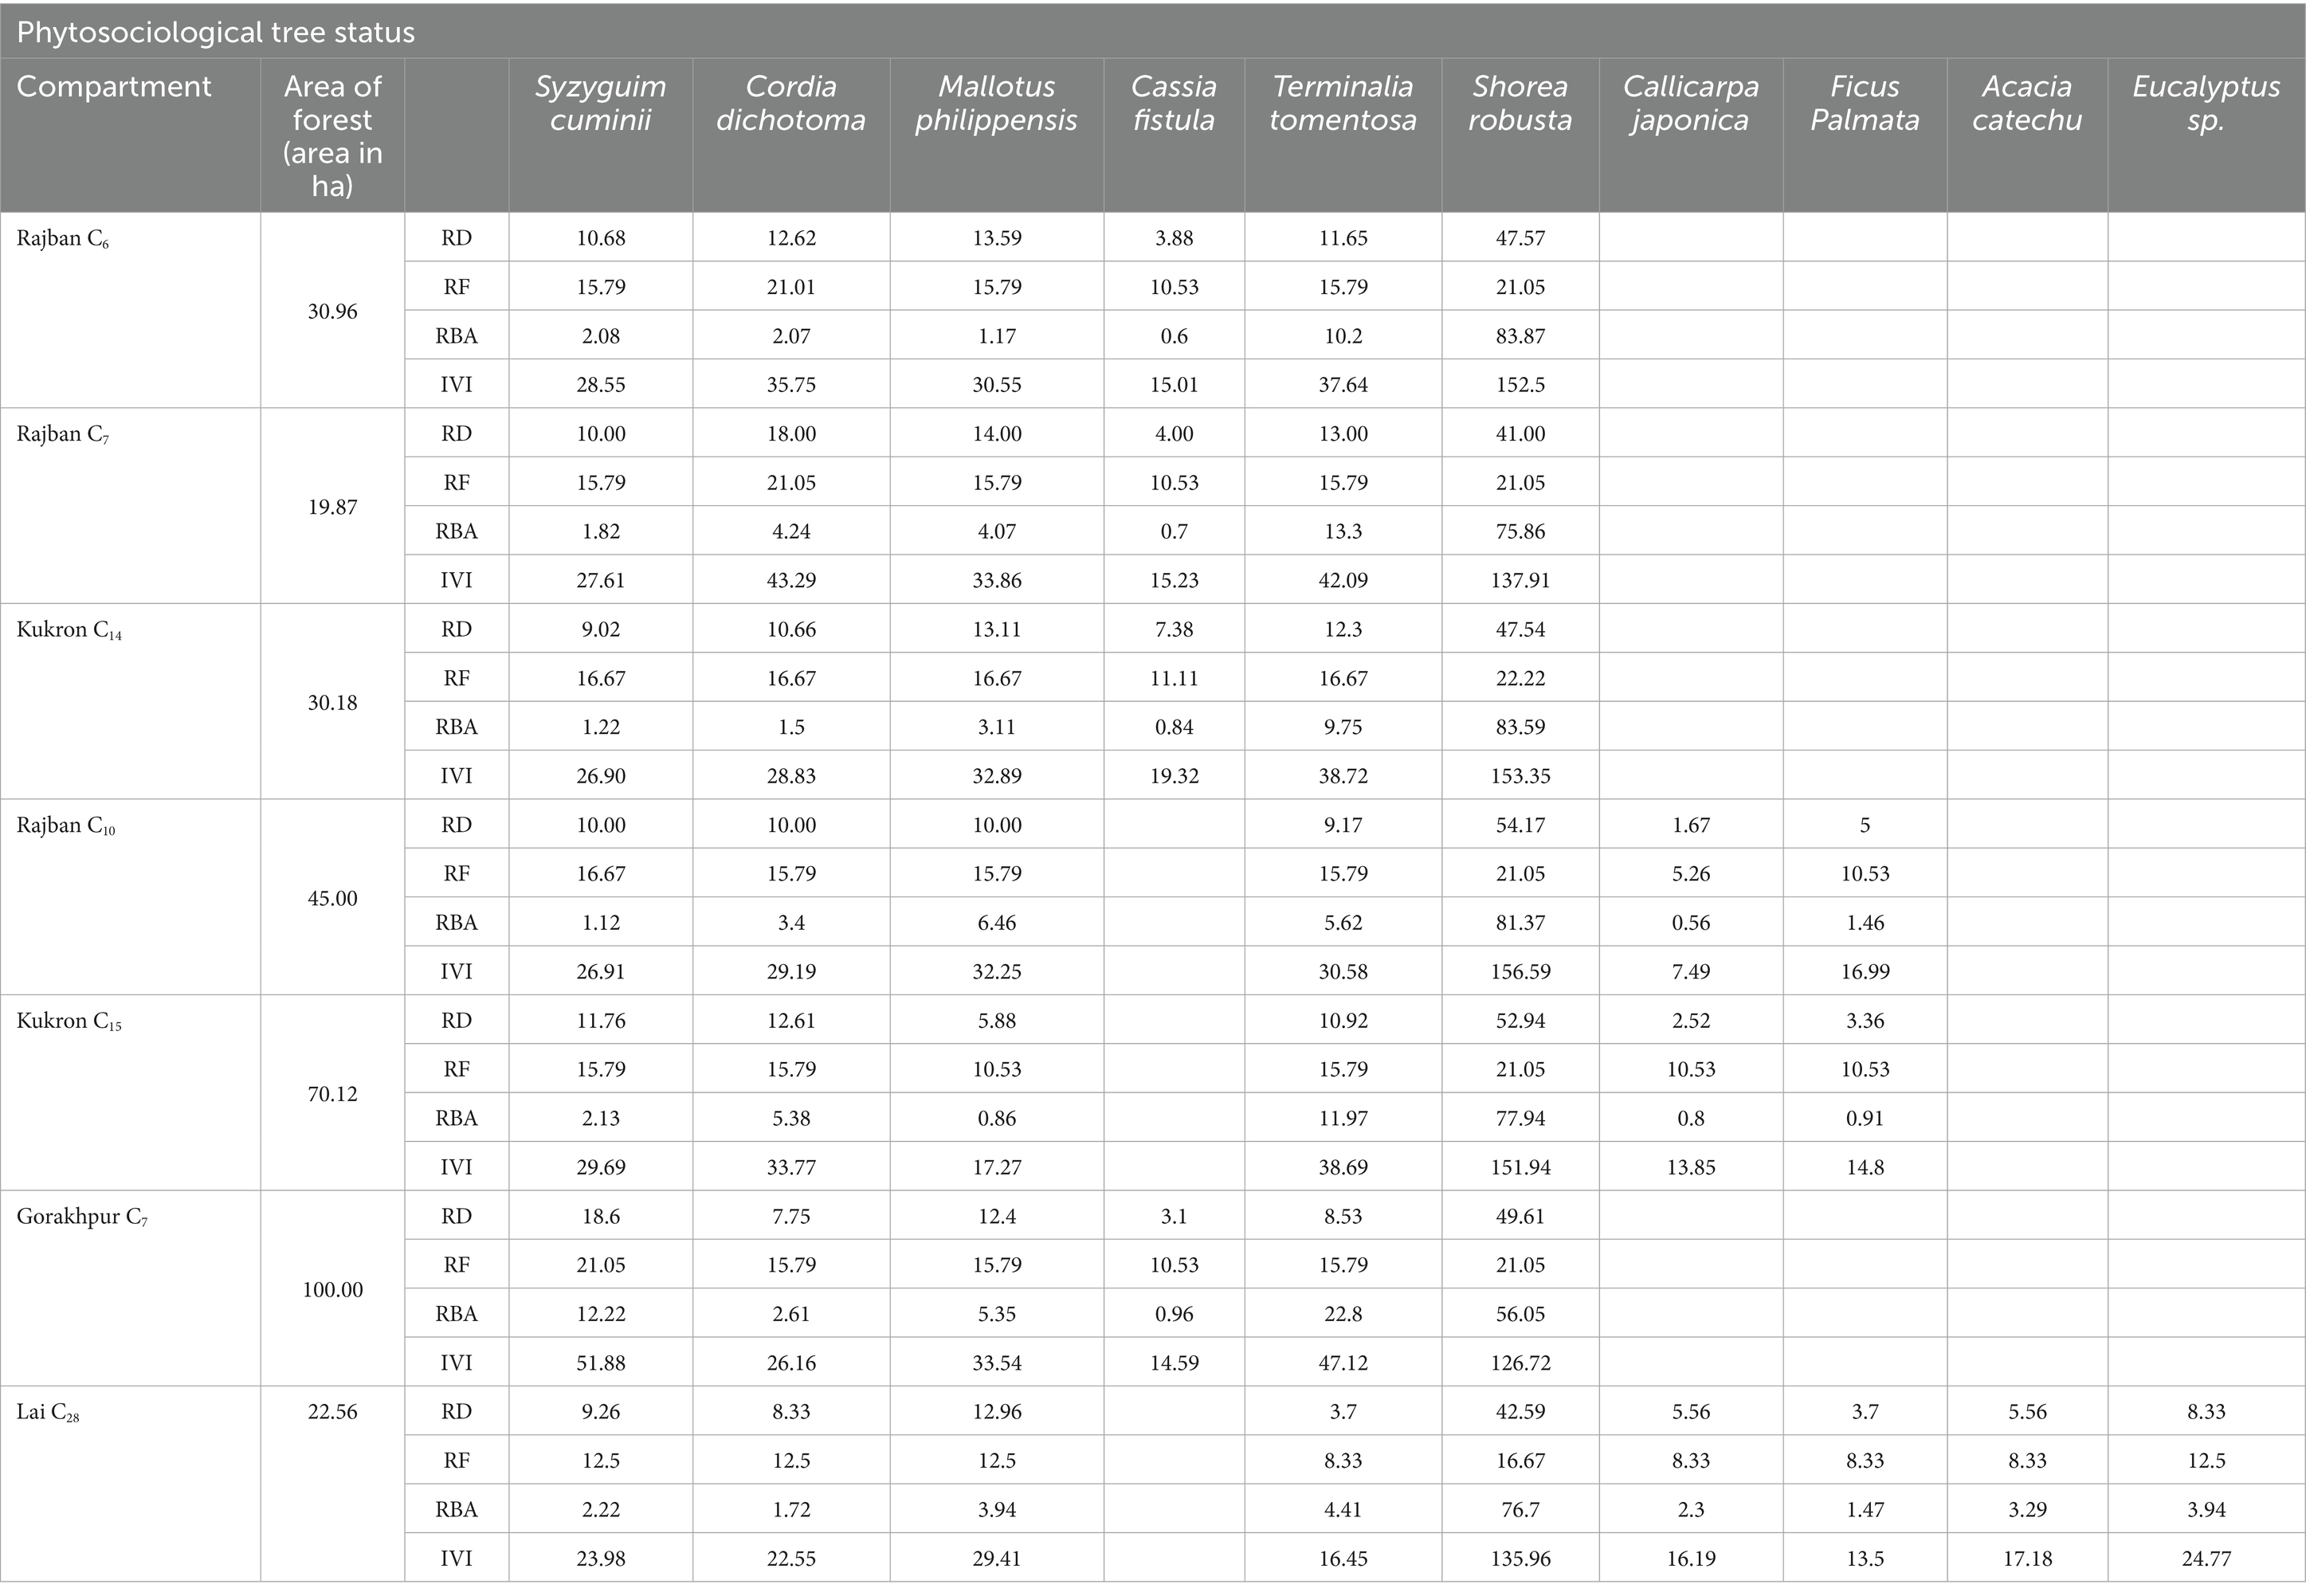
Table 3. Phytosociological tree status of the Sal Working Circle of Paonta Forest Division, Himachal Pradesh.

Table 4. Phytosociological shrub status of the Sal Working Circle of Paonta Forest Division, Himachal Pradesh.
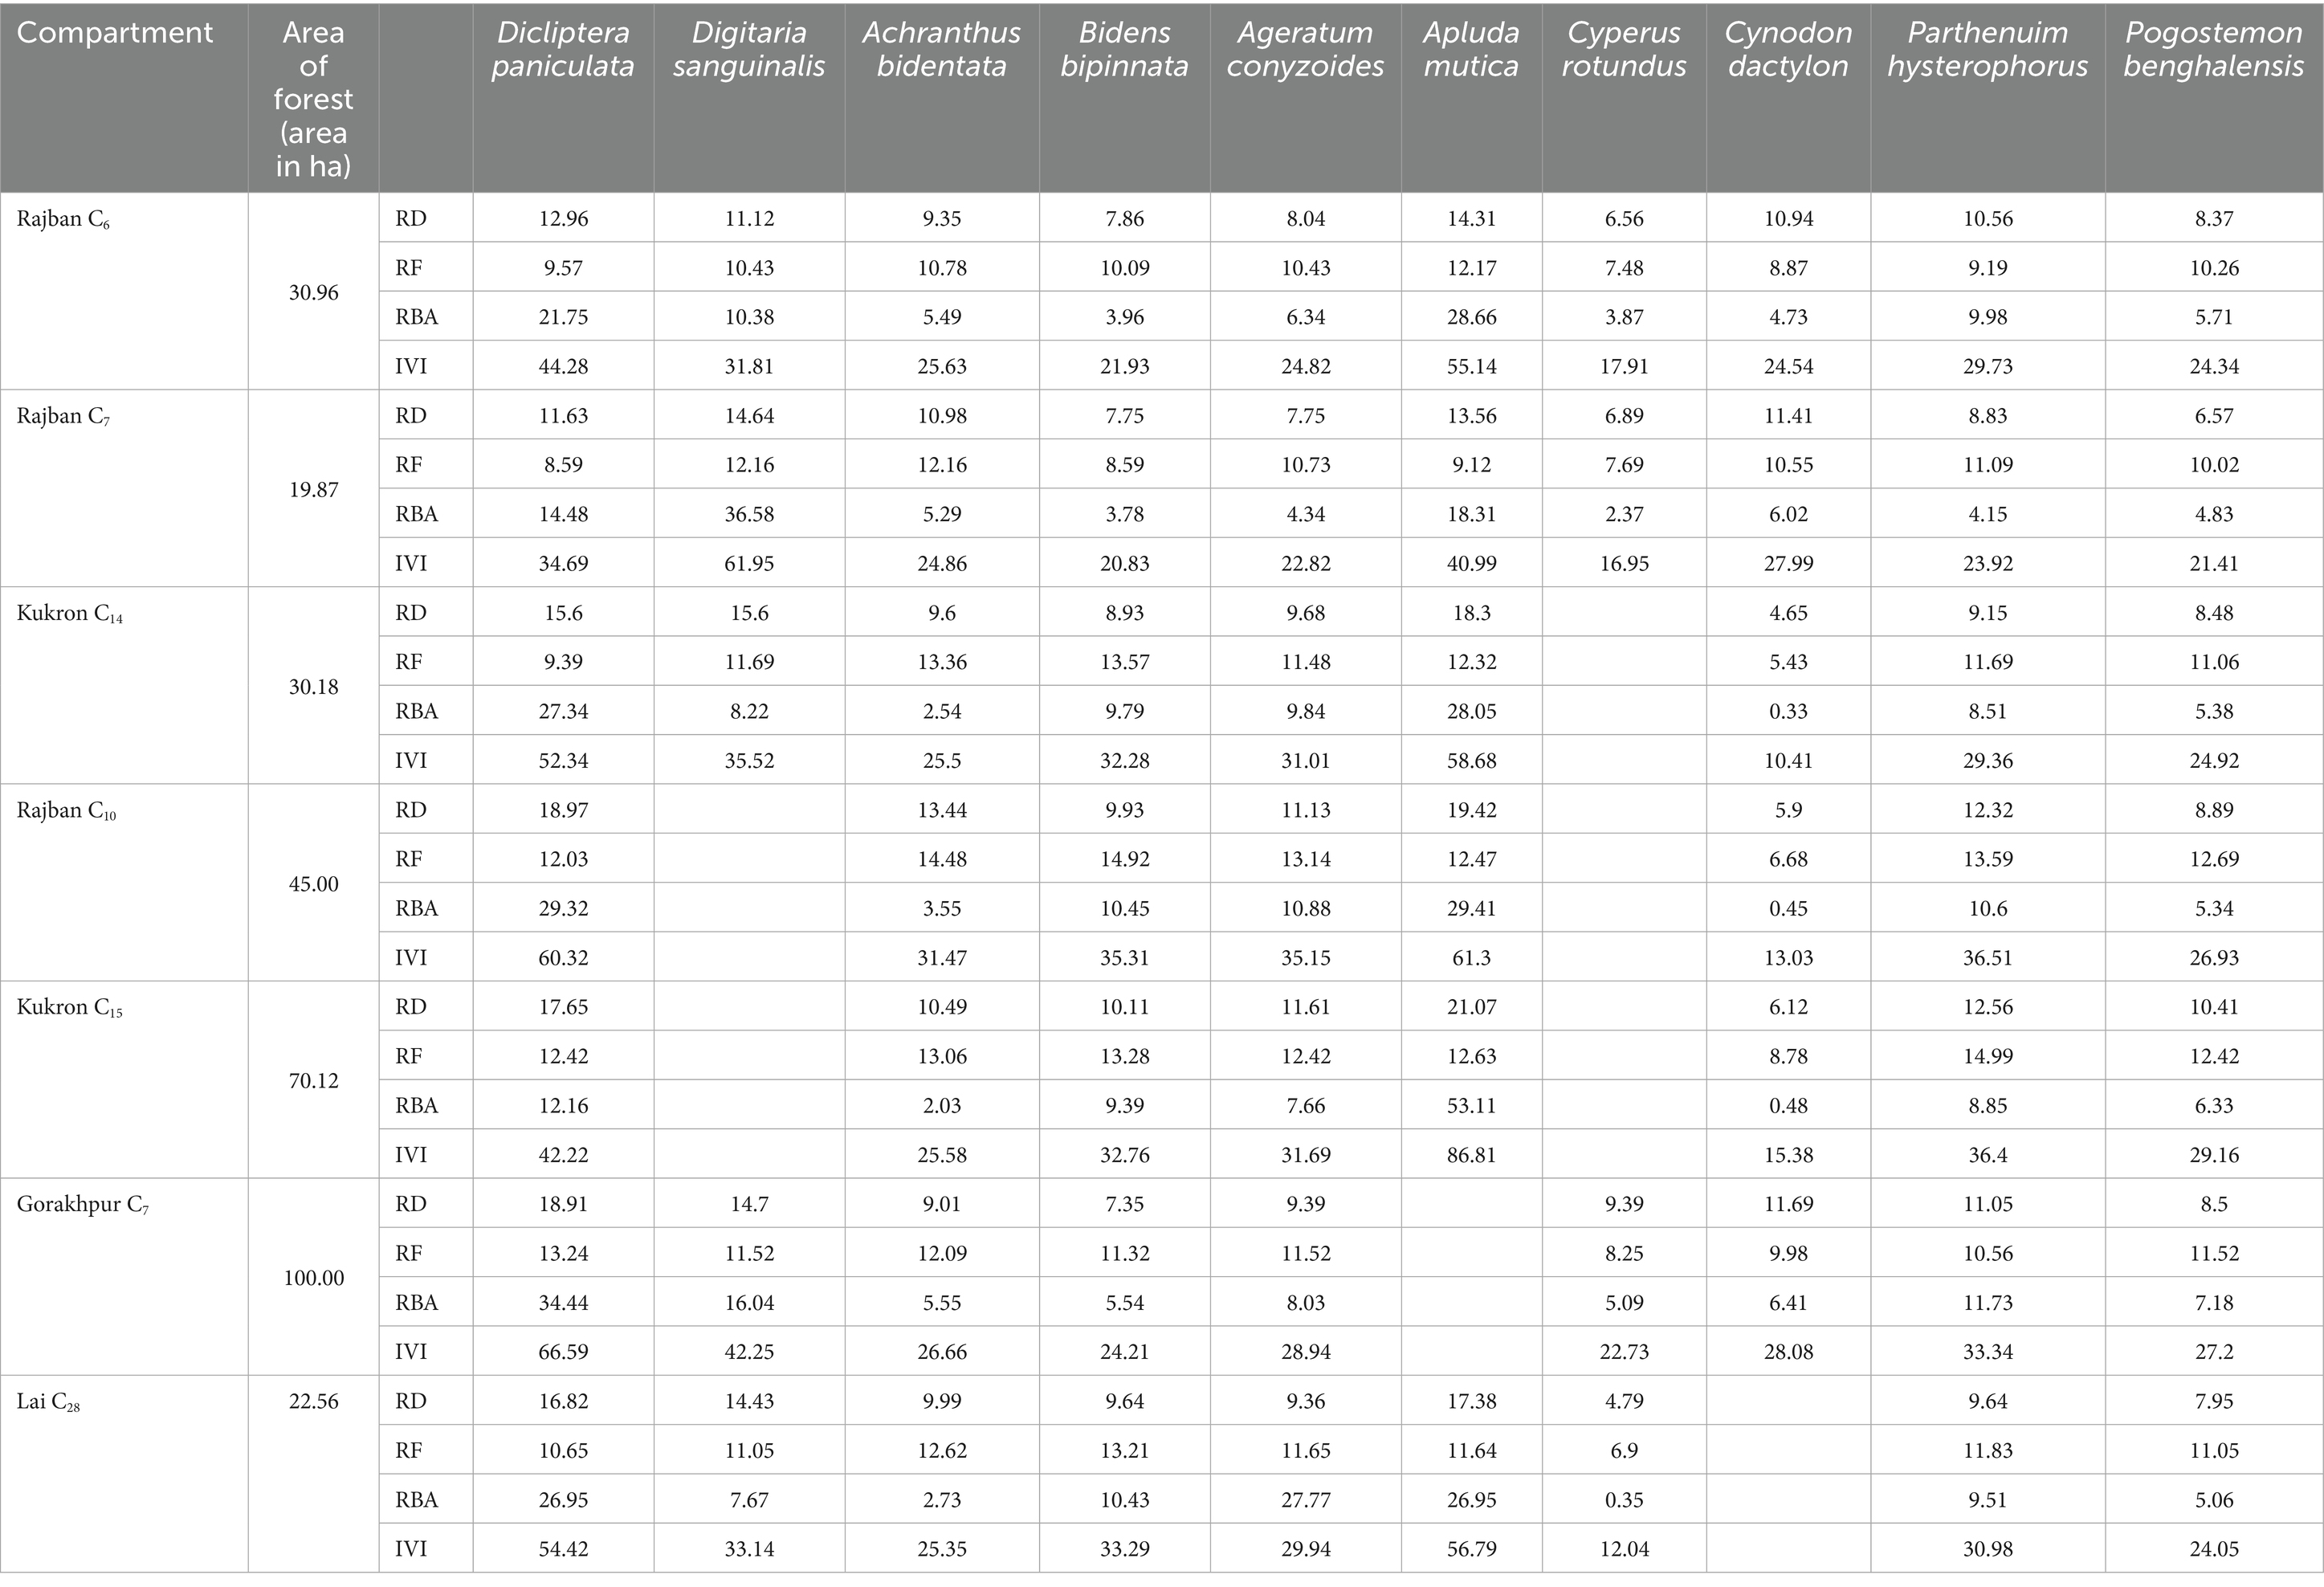
Table 5. Phytosociological herb status of the Sal Working Circle of Paonta Forest Division, Himachal Pradesh.
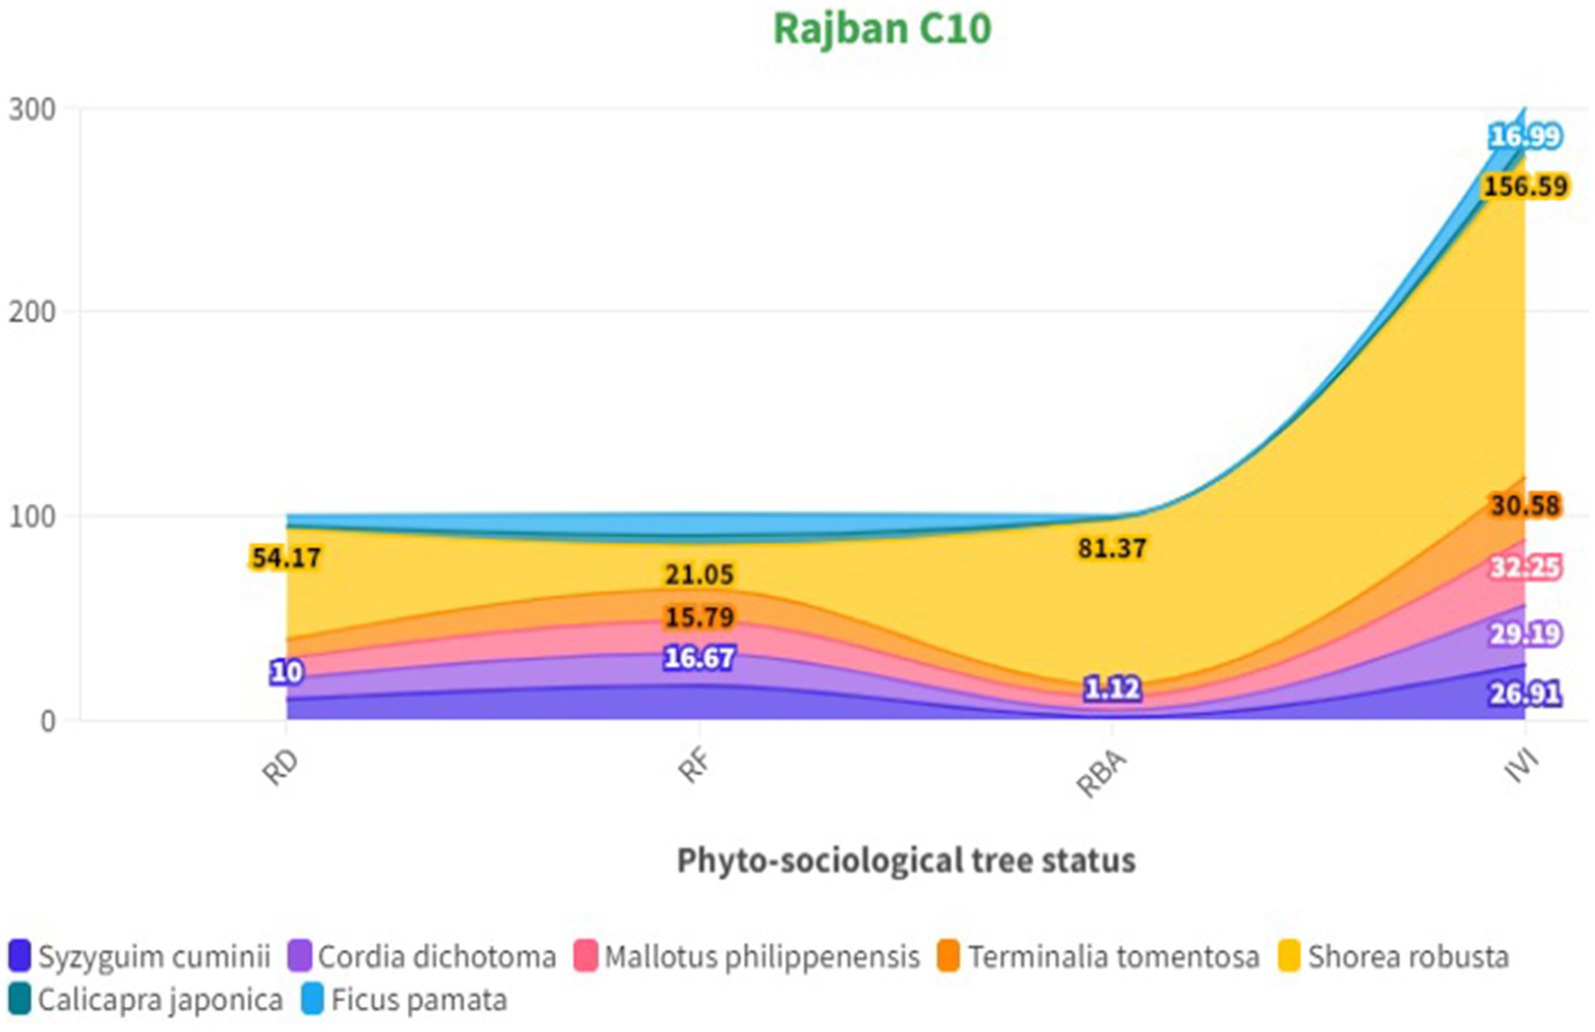
Figure 4. Phytosociological status of trees in the Sal Working Circle.
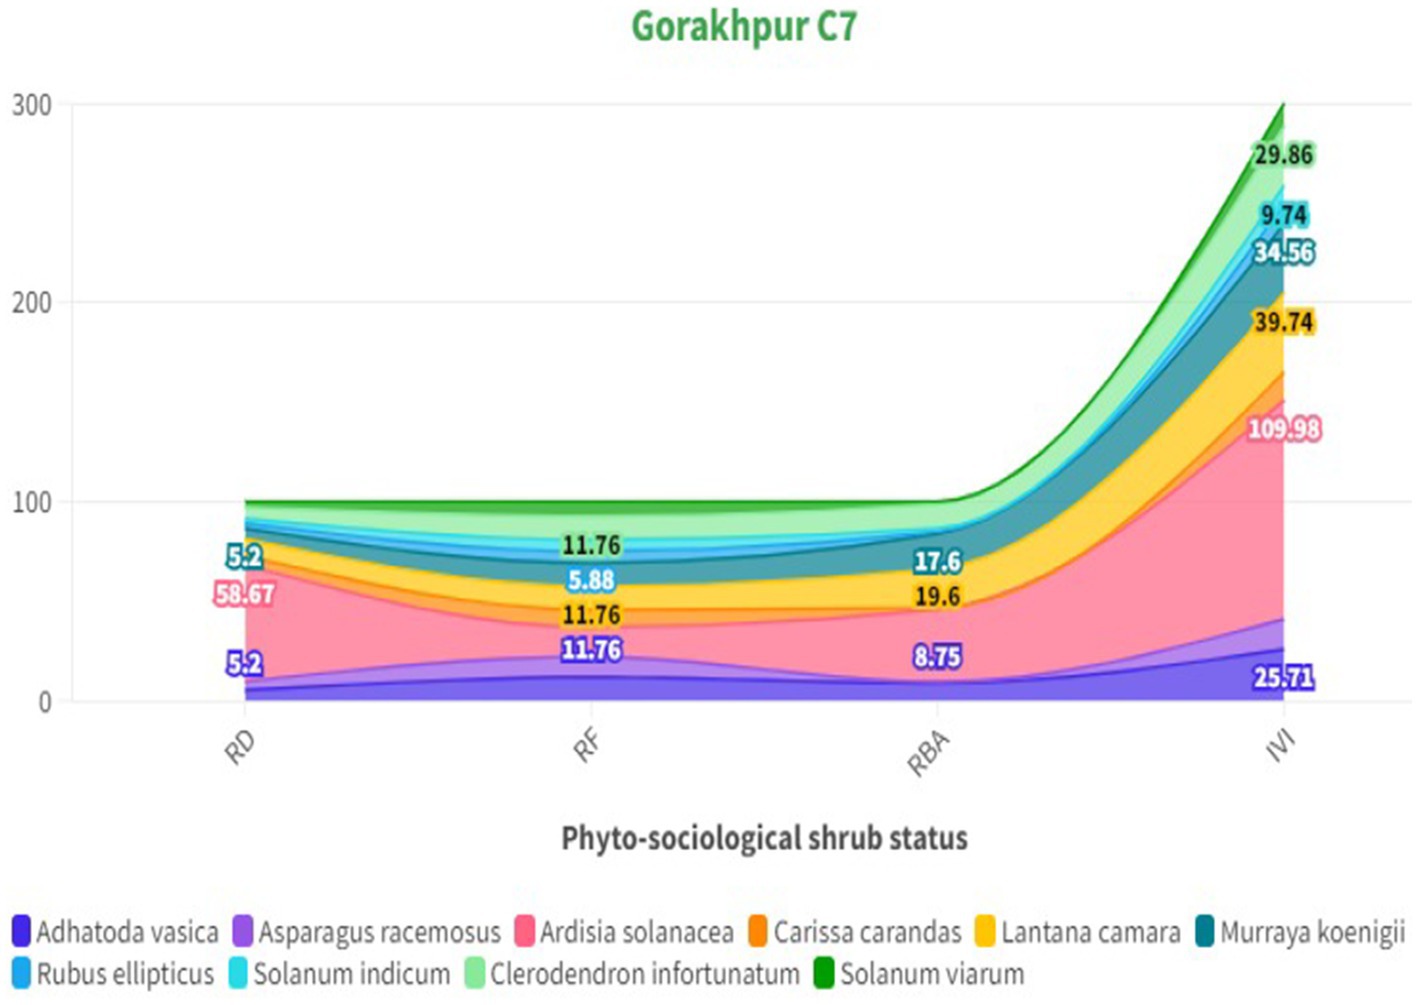
Figure 5. Phytosociological status of shrubs in the Sal Working Circle.
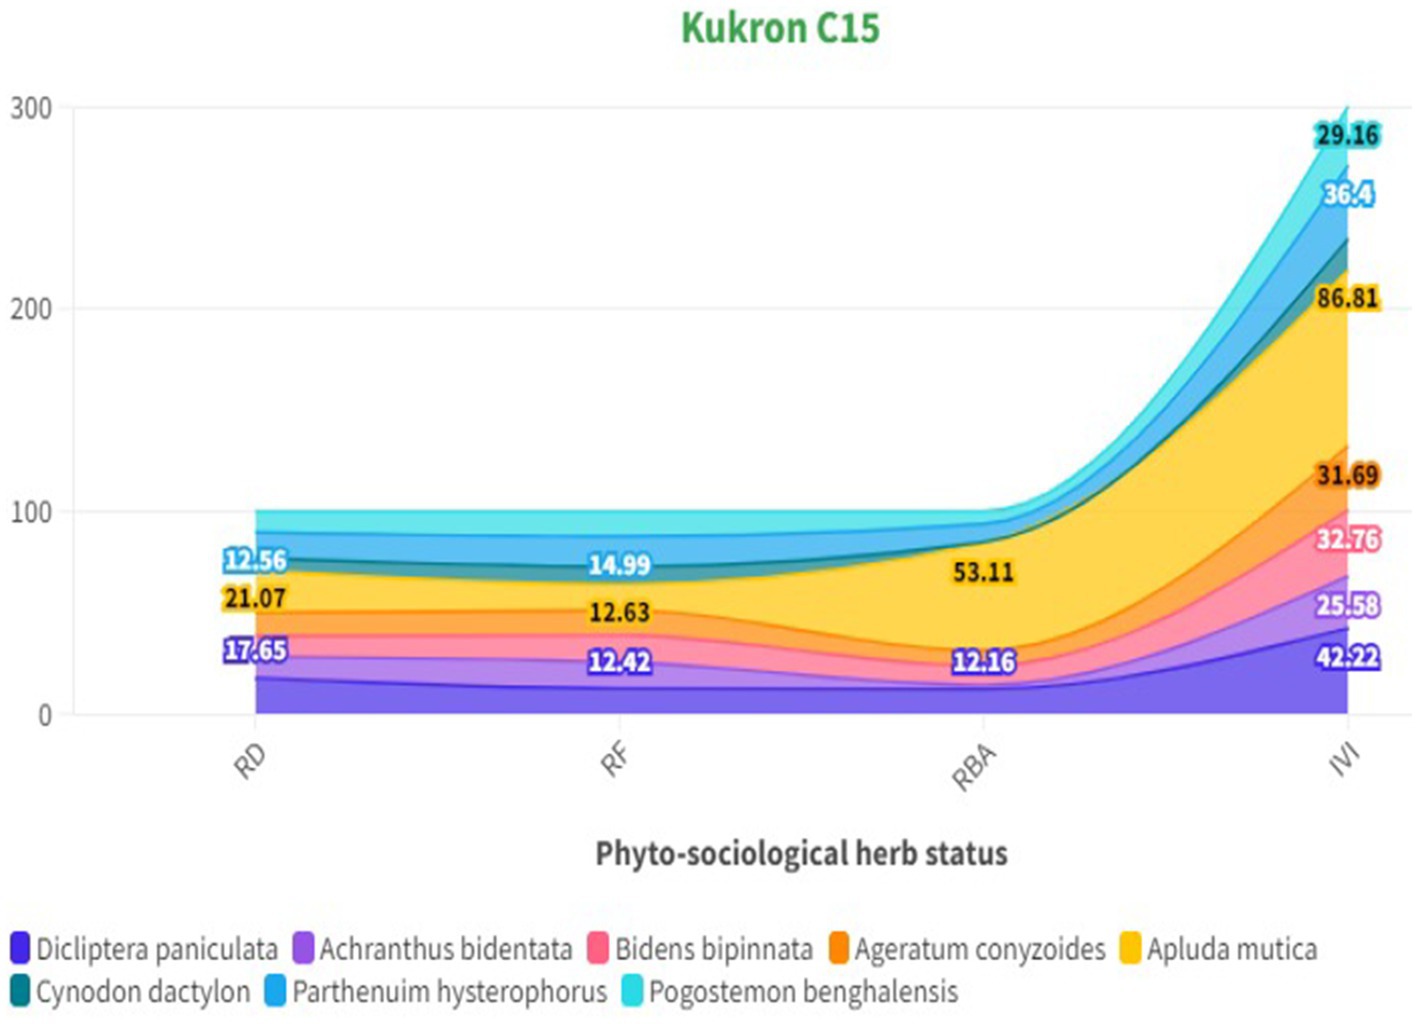
Figure 6. Phytosociological status of herbs in the Sal Working Circle.
3.3 Plant species diversity of the Sal Working Circle of Paonta Forest Division, Himachal Pradesh
The Shannon Index of diversity (H′) for trees ranged between 1.83 (Lai C28) and 1.44 (Gorakhpur C7), for shrubs between 2.02 (Kukron C14) and 1.56 (Gorakhpur C7), and for herbs between 2.28 (Rajban C6) and 2.02 (Kukron C14 and Kukron C15). Simpson Index of diversity (D) for trees ranged between 0.75 (Rajban C7) and 0.67 (Kukron C14), for shrubs between 0.81 (Kukron C14) and 0.63 (Gorakhpur C7), and for herbs between 0.89 (Rajban C6 and Rajban C7) and 0.86 (Kukron C14 and Gorakhpur C7). Simpson Index of dominance (Cd) for trees ranged between 0.33 (Kukron C14) and 0.23 (Lai C28), for shrubs between 0.37 (Gorakhpur C7) and 0.19 (Kukron C14), and for herbs between 0.14 (Kukron C14 and Kukron C15) and 0.11 (Rajban C6 and Rajban C7). Pielou’s equitability (Eq) varied between 0.88 (Rajban C7) and 0.75 (Kukron C14) for trees, between 0.84 (Kukron C14 and Lai C28) and 0.68 (Gorakhpur C7) for shrubs, and between 0.99 (Rajban C6) and 0.97 (Rajban C10, Kukron C14, Kukron C15, and Lai C28) for herbs. Margalef’s Index of richness (MI) ranged for trees between 1.43 (Lai C28) and 0.87 (Rajban C10 and Gorakhpur C7), for shrubs between 1.08 (Kukron C15) and 0.89 (Lai C28), and for herbs between 0.74 (Rajban C6 and Rajban C7) and 0.59 (Kukron C14) (Table 6).
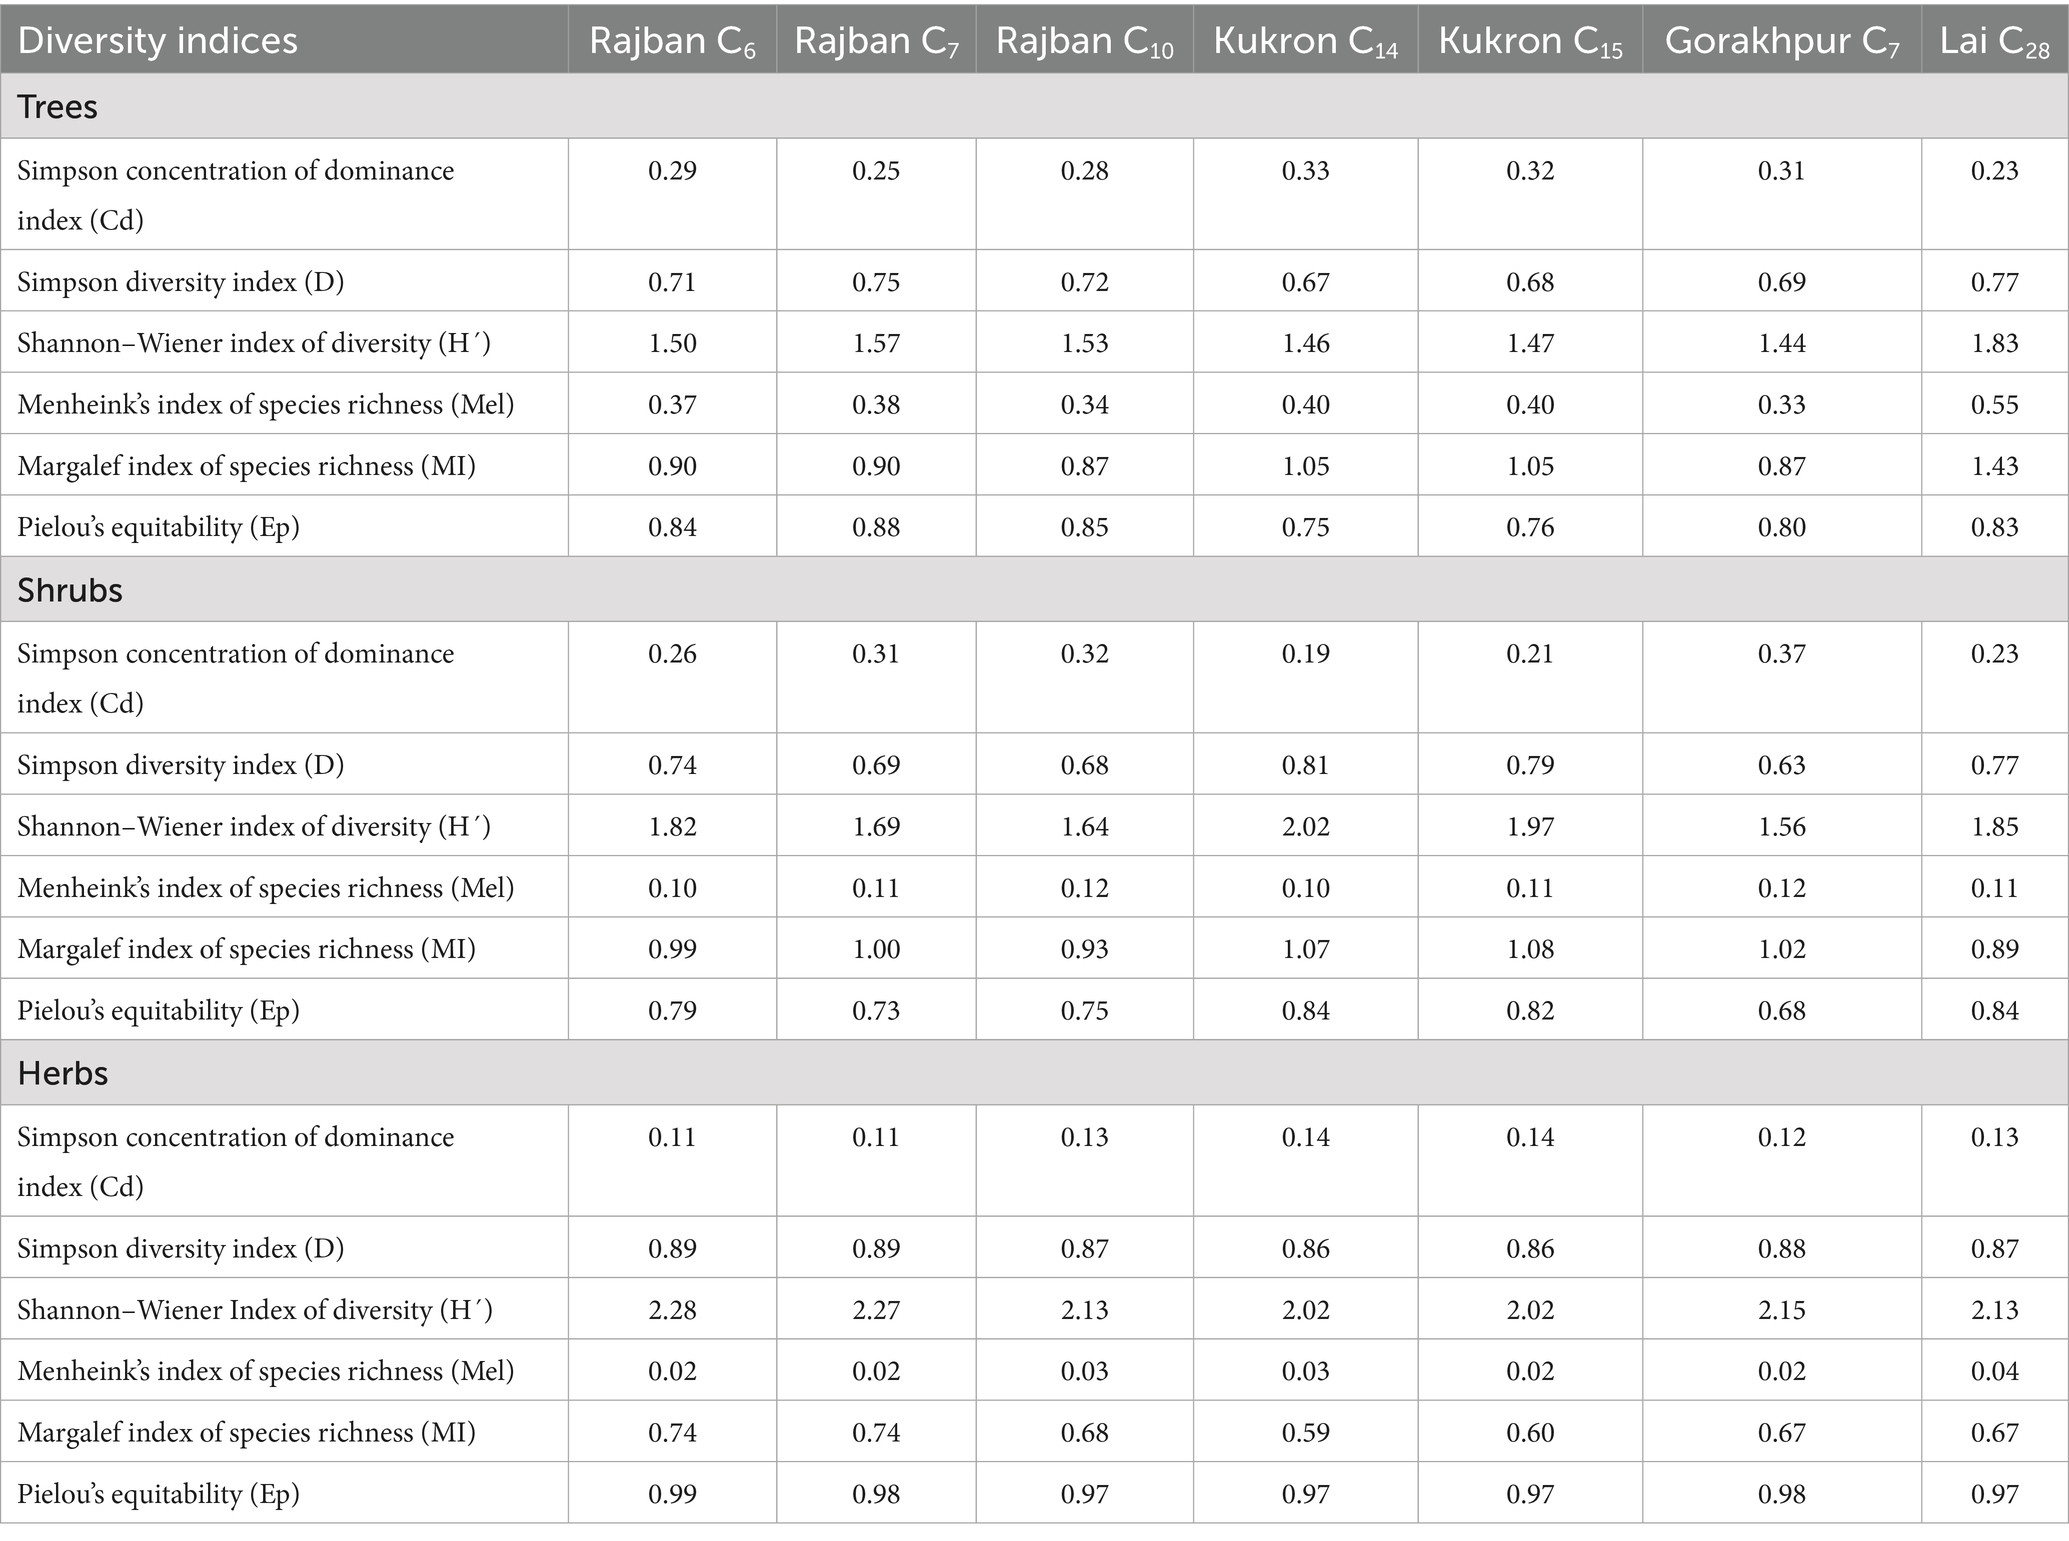
Table 6. Diversity indices of trees, shrubs, and herbs among different compartments in the Sal Working Circle of Paonta Forest Division, Himachal Pradesh.
3.4 Similarity index and dissimilarity index
The dissimilarity index examined in Table 7 illustrated that across tree species, Rajban C6 had the least dissimilarity (0.00) with Rajban C7, C10, and Gorakhpur C7. Similarly, Rajban C7 reported minimum dissimilarity with Rajban C10 and Gorakhpur C7. Gorakhpur C7 and Rajban C10 had a minimum dissimilarity index (0.00) with Kukron C14. Maximum dissimilarity was recorded by Lai C28 with Rajban C6, C7, C10, Gorakhpur C7, Kukron C14, and C15. In case of shrub species, Rajban C6 recorded minimum dissimilarity (0.00) with Rajban C7. Kukron C15 had the maximum dissimilarity (0.24) with Rajban C6 and Rajban C7. In respect of herb species, Rajban C6 reported minimum dissimilarity (0.00) with Rajban C7; however, maximum value was recorded by Kukron C15 (0.22), followed by Lai C28 with Rajban C10, Kukron C15, and Gorakhpur C7.
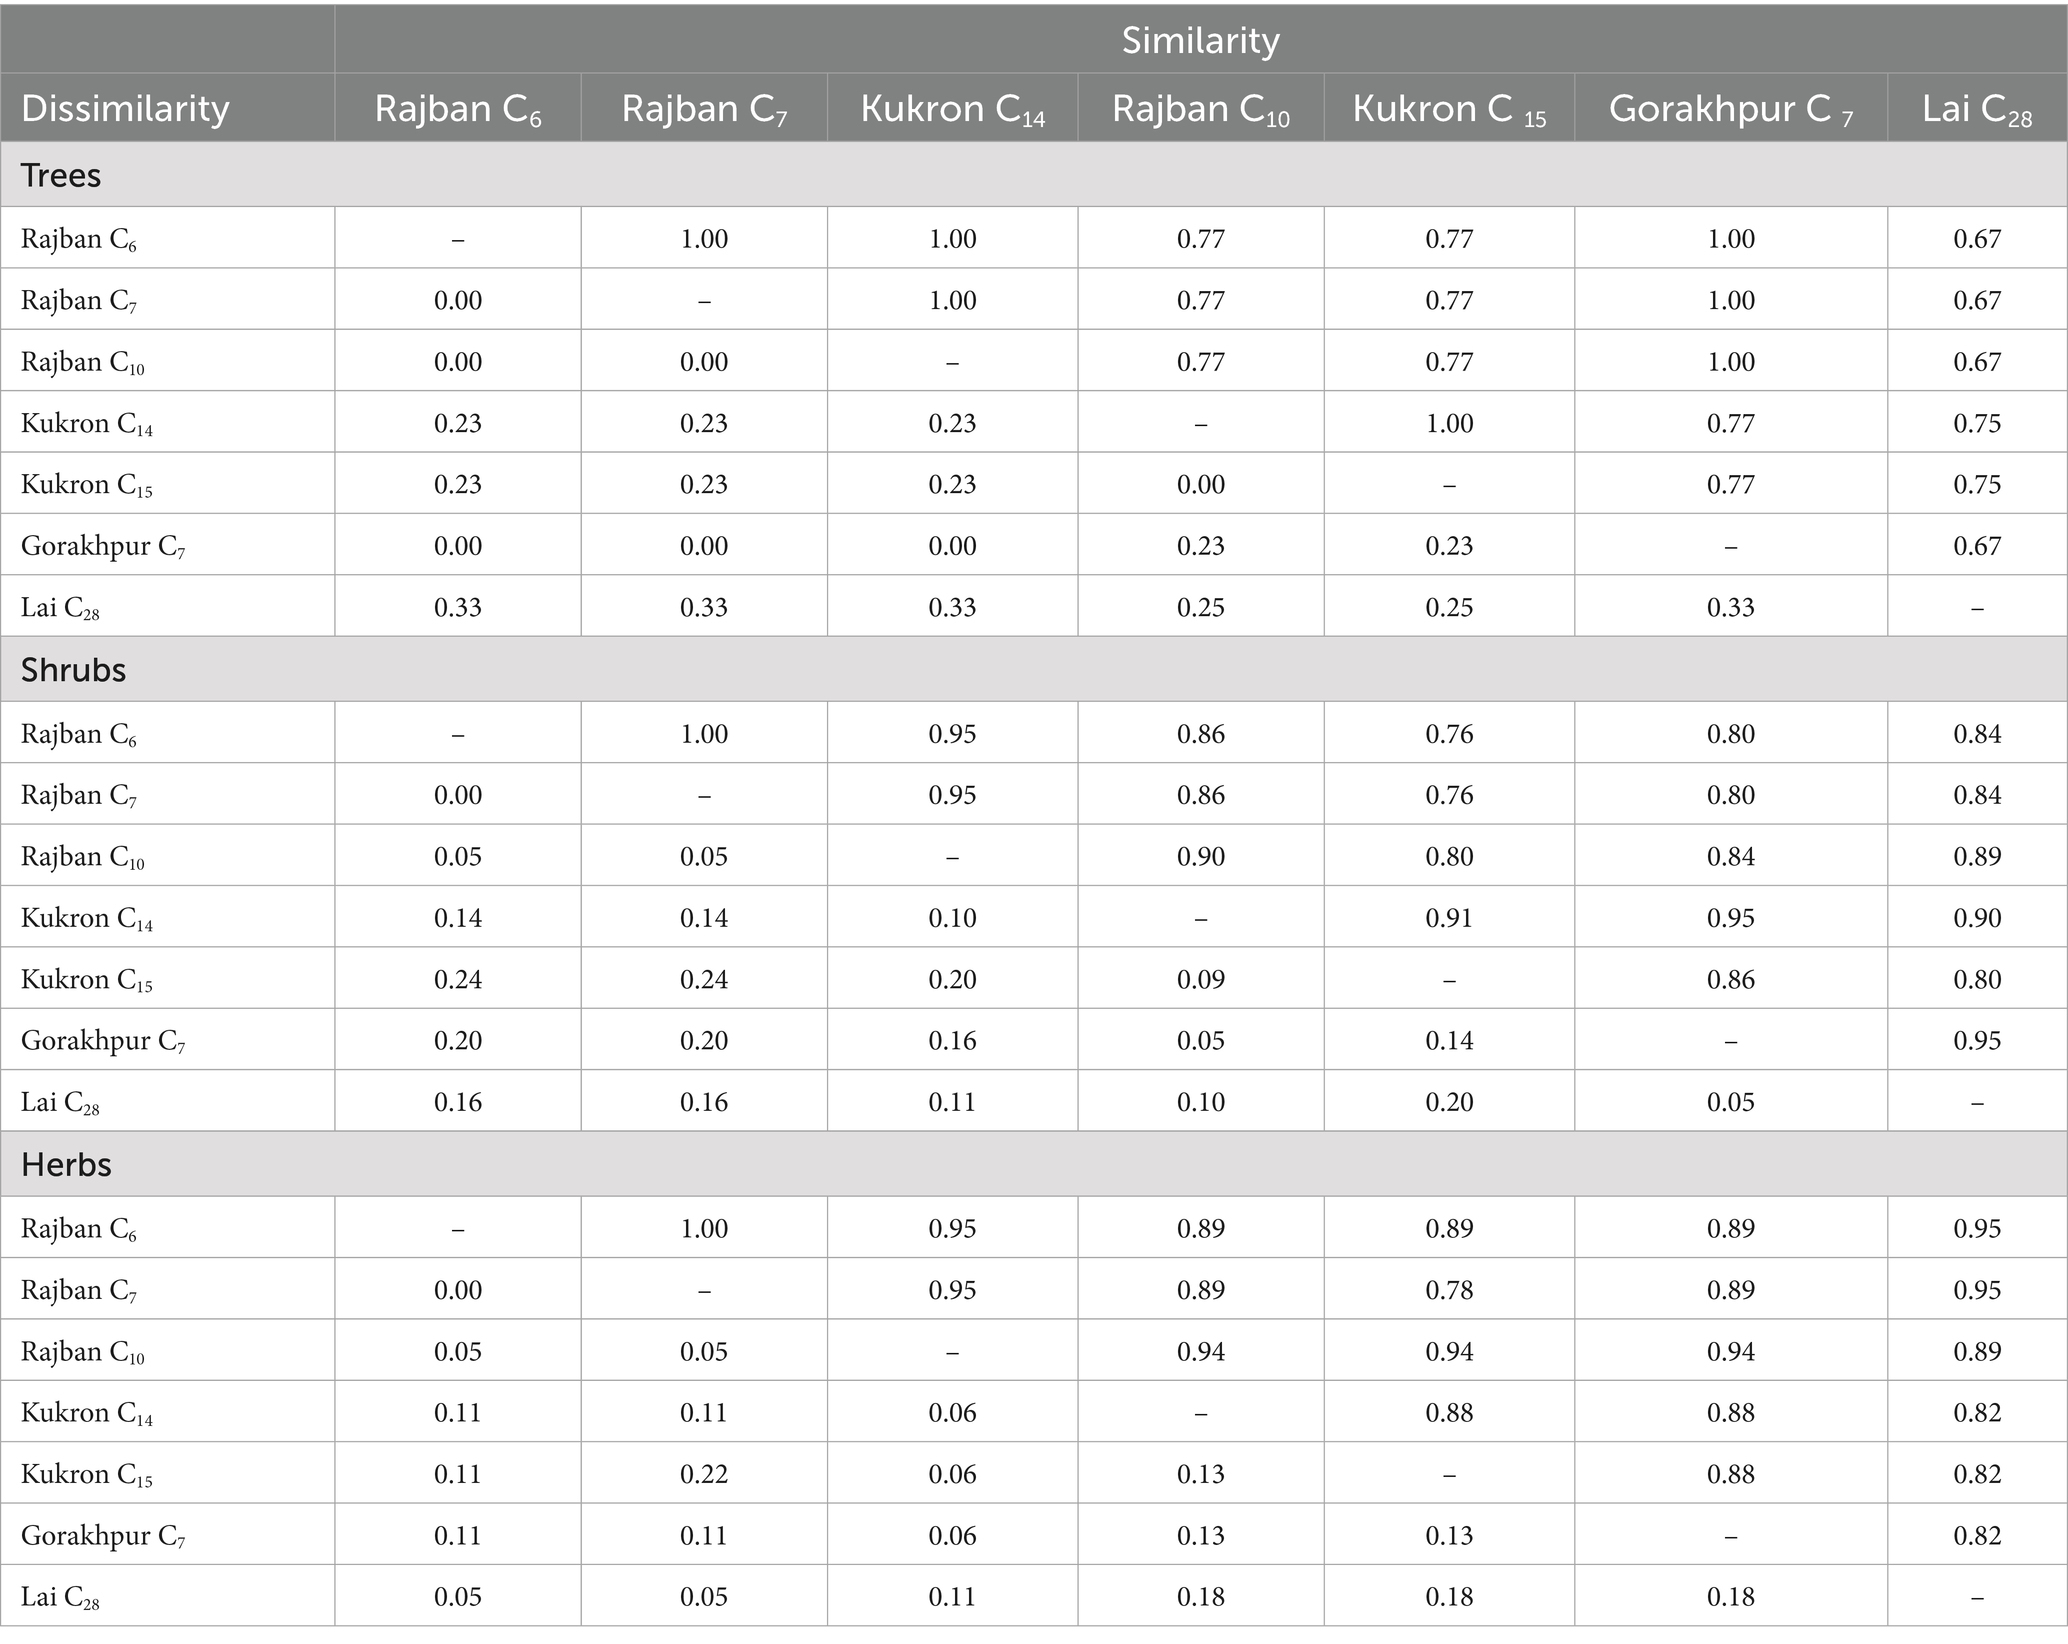
Table 7. Index of similarity and dissimilarity of vegetation in compartments of the Sal Working Circle in Paonta Forest Division, Himachal Pradesh.
4 Discussion
The pattern of vegetation structure, composition, and diversity in tropical forests is influenced by various environmental factors, such as soil characteristics, microclimate, and disturbance regimes (DRYFLOR et al., 2016). Quantitative assessment of the vegetation layers is essential for evaluating biodiversity and monitoring long-term changes in forest ecosystems (Dash et al., 2021). Understanding the variation in floristic composition across different forest compartments is crucial for assessing the overall biodiversity and sustainable management of forest ecosystems. The present study aimed to investigate the comparative floristic composition of trees, shrubs, and herbs across seven compartments within the same forest range, as it was hypothesized that the total inter-compartmental variation in the representation of these vegetation layers would be limited due to the relatively homogeneous microenvironmental conditions (Jucker et al., 2018; Hofhansl et al., 2020).
The site quality classification of the present study indicates a forest site’s potential for productivity, where site quality II (Kukron C14,15, Gorakhpur C7, Rajban C10, and Lai C28) represents moderately productive areas where Sal grows well but with some limitations in soil fertility or moisture. Site quality III (Rajban C6,7) shows lesser productivity due to inferior soil conditions or limited moisture availability, resulting in slower development of vegetation and regeneration. The present study found limited inter-compartmental variation in the representation of trees, shrubs, and herbs, which may be due to the fact that the different compartments under study were located within the same forest range and thus experienced relatively similar microclimate. In the present study, it was found that most of the species of trees, shrubs, and herbs were common among different compartments, except Lai C28, which may be due to uniformity in habitat and topography and prevailing climatic conditions, and thus implies application of similar sustainable management practices for the compartments under investigations with slight variation for Lai C28. Mishra et al. (1997) opined that species composition varies from site to site mostly due to microenvironmental changes and patterns of distribution, depending both on physico-chemical properties of the environment and biological peculiarities between species.
Floristic composition is important to assess the state of natural forests in any region and formulate conservation and management strategies. The floristic composition of the trees, shrubs, and herbs in the present study is lower than that reported by Divakara (2015) in Sal forests of Jharkhand and by Dutta and Devi (2013) in the Doboka reserve forest of Assam’s tropical wet deciduous Sal forest. In the present study, S. robusta was found to be dominant in all compartments, followed by M. philippensis, T. tomentosa, C. dichotoma, and S. cuminii, with the rest of the species displaying a non-frequent population pattern. Similarly, the number of species documented in the current study was found to be lower than that reported by Mandal and Joshi (2014) in different climatic conditions, indicating uniformity within the compartments under consideration in terms of habitat, climate, soil, and geography. They reported M. philippensis, T. tomentosa, and S. cuminii as the principal companions of the Sal forest while examining vegetation dynamics and plant diversity in dry deciduous forests of the Doon valley region.
In forest ecosystems, the magnitude of variation is investigated through phytosociological aspects, mainly by relative density, relative frequency, relative basal area, and IVI values, which reflects factors such as species preference, management practices, utilization, and felling patterns that impact forest composition (Shrestha et al., 2010; Sarkar and Devi, 2014). In all the seven compartments examined in the current investigation, S. robusta has demonstrated large percentage of RD, RBA, and IVI values. Based on RD and IVI values, it is ascertained that S. robusta covers over 50% of these compartments. The most common associates of S. robusta in all the compartments are M. phillippensis, T. tomentosa, C. dichotoma, and S. cuminii, except Lai C28. In Lai C28, besides these associates, E. globulus, B. variegata, A. catechu, and F. palmata were also present in insignificant proportions based on their IVI values. In the shrub layer, A. solanacea was the most common species (IVI values) occurring in almost all the compartments. While, in the herbaceous layer, Apluda mutica was the most dominant associate of S. robusta, the analysis of IVI values showed that S. robusta was the dominant species in all the compartments (IVI value~150), which is well within the limits of earlier studies (Rawat and Bhainsora, 1999). Tree species with higher IVI values for trees, shrubs, and herbs in the compartments may be due to good regenerative capability, better adaptability, and wide ecological amplitude in the forest stand with greater species diversity, providing more diverse ecosystem services, resilience to disturbances, and supporting greater soil nutrient retention and carbon storage than less diverse compartments (Gamfeldt et al., 2013; Liang et al., 2016; Van Rooyen et al., 2017; Zhang et al., 2017; Liu et al., 2018).
Phytosociological data from these forests were quantitatively analyzed to work out the density, relative density, basal area, and important value index (IVI). In our study, the variation under different compartments can be clearly seen for tree density that ranged between 322 and 250 N ha−1 (Rajban C10-322 N ha−1 RD = 54.17), having a basal area of 0.37 to 1.19 m2 ha−1 (Gorakhpur C7− RBA = 126.72) with high dominance of S. robusta in the overstorey layer. It may be because of less competition for space and light at canopy level in compartments (Lai C28, Rajban C10, and Kukron C15) with higher tree density. The soil and climate in compartments constrain development, resulting in heterogeneity in stand characteristics. The present study reveals similar patterns, with both elevation and slope playing a crucial role in determining species association, community structure, and the dominant species within each community. These variables primarily affect the prevailing microclimate, canopy density, and competition (Khan et al., 2013; Nakhoul et al., 2020). Kumar et al. (2006) also observed a similar range for tree density (380 trees ha−1–260 trees ha−1) in the sub-tropical forest of the Garhwal Himalaya, although the basal area (0.78 to 1.43 m2 ha−1) was higher in the present study. The highest IVI (150) indicated dominance of S. robusta. Additionally, similar patterns were observed in the Doboka reserve forest of Assam’s tropical wet deciduous Sal forest. S. robusta had the highest IVI (125.30) density, which was found to be higher in the lower girth class, i.e., 30–60 cm (Dutta and Devi, 2013). In the present study, S. robusta was found to be extensively dispersed in all compartments, followed by M. philippensis, T. tomentosa, C. dichotoma, and S. cuminii, with the rest of the species exhibiting a non-frequent population pattern. In addition, S. robusta showed considerably maximum values in all the compartments with the highest IVI (156.59) for Rajban C10. IVI values for shrubs ranged between 8.35 and 27.33. The high value of IVI of Sal trees denoted that they not only play a critical role in the functioning of their ecosystems but also possess a robust capacity to withstand environmental stresses such as deforestation, fire, and illicit cutting (Pandey and Shukla, 2019). The results confirmed that diversity (species richness) for tree species was highest, followed by shrubs and herbs. Results of present phytosociological studies of trees are in line with similar findings by Deka et al. (2012), who suggested that S. robusta has contributed approximately 90% of the total stand density (2,559 individual ha−1) of the forest and exhibited the highest IVI (212.67). However, the low basal area recorded in our present study resulted from low stocking among the large size diameter classes (i.e., 60–80 cm) despite the presence of some small diameter class trees. Differences in basal area can be related to altitudinal variances, age structure, forest successional stage, species composition, and disturbance (Gogoi and Sahoo, 2018; Yumnam and Ronald, 2022).
In all the compartments, relative basal area, density, and frequency of Ardisia thickets had the maximum share compared to other shrubs and herbs. This may be attributed to thick monoculture of A. solanacea that alters the microenvironment below its understory and inhibit the germination and growth of S. robusta and other associate species that results in the exclusion of native plants, probably through a strong decrease in understory light availability (Sharma and Raghubanshi, 2007; Kumar et al., 2022). In our study, the dominance of A. solanacea, an invasive plant exotic shrub with IVI (71.31–109.98) (Gorakhpur C7 = 109.98, followed by Rajban C6,=86.61 and Rajban C7 = 92.92), may be due to sparse canopy cover and lack of proper canopy distribution at canopy level and lesser competition for light and space at the understory level. The higher ground layer species richness was most likely due to various abiotic and biotic pressures creating a gap in the overstorey, which helps this exotic species to multiply by vegetative propagation (Pandey and Shukla, 2001). It could be another possible reason for the observed trend and lower shrub and herb diversity in other compartments in the current study. In contrast, species dominance demonstrated an inverse correlation with diversity, with climbers and under shrubs (Ardisia solanacea) being more dominant than overstorey species in Gorakhpur C7, indicating a complex ecosystem structure (Bricca et al., 2023). Furthermore, Koop and Horvitz (2005) studied spatial and temporal variation in the population dynamics of an invasive species, A. elliptica, across a range of habitat types to identify contributing factors for its demographic success. Mean population density was highest at the Ardisia thicket (358.5 N m2) and relatively low at the other sites (5.4–47.0 N m2), while deep shade generated by a continuously dense canopy of adults in the Ardisia thicket has suppressed the growth of seedlings and juveniles. However, high water availability has probably resulted in high germination rates of seeds and a dominance of seedlings and small juveniles (Koop, 2003). The invasive potential and population dynamics of A. elliptica on native communities may be strongly influenced by light and water availability (Koop, 2004), which resulted in reduced regeneration capacity and seedling development of S. robusta in the compartments. All these trends may indicate the influence of different forest management regimes in the compartments under study.
The values in the current study were found to be well within the range of values of The Shannon–Wiener diversity index (H0) for Indian forests, which ranged from 0.83 to 4.10 (Jha and Singh, 1990; Ayyappan and Parthasarathy, 1999; Pandey, 2000). In contrast, Kumar and Saikia (2020b) reported higher values of the Shannon diversity index (2.25 for trees, 2.72 for shrubs, and 2.98 for herbs) than in the present study. However, they are in close proximity to the values reported by Banik et al. (2018) for Sal forests under two forest management regimes (Sal forest and Sal plantation) in Tripura, Northeast India. The range of diversity indices from the present study was lower than those found by Divakara (2015), who evaluated the floristic composition of semi-dense and open forests in two districts of different Sal forests in Jharkhand. The maximum Shannon–Wiener diversity index (H′ = 2.5754, R´ = 2.4071), Simpsons index of diversity (D = 0.8900, D = 0.8596), Margalef richness index (R´ = 4.5806, R´ = 4.5122), and evenness index (E = 0.6677, E = 0.6062) were obtained in Latehar. On the other hand, open and dense forests of Hazaribagh showed the lowest for Shannon–Wiener diversity index (H′ = 1.3825, H′ = 1.1658). However, the lowest Simpsons index of diversity (D = 0.6096), Margalef richness index (R´ = 2.2216), and evenness index (E = O.4100) were found in dense forests of Latehar. Simpson’s index value in the present study is lower (0.33) than the value (0.36) of Madhupur National Park (Rahman and Vacik, 2010), Ranchi Sal Forest, Jharkhand, India (Kumar and Saikia, 2020a). Margalef’s species richness index was found to have a lower value (1.43). In contrast, the value is lower (0.77) than the Simpson’s index value (0.98) of Bhawal National Park and Ranchi Sal Forest, Jharkhand, India. Species (Pielou’s) evenness index of the current study is higher (0.88) than that of the Ranchi Sal Forest, Jharkhand, Eastern India (Kumar and Saikia, 2020a).
Several climatic and edaphic factors, including habitat heterogeneity, species composition, forest age, and anthropogenic disturbances, are responsible for differences in diversity and structure of Sal forests along their geographic range (Champion and Seth, 1968a; Gautam and Devoe, 2006a, 2006b). Sal (Shorea robusta Gaertn. f.) forests, known for their economic and ecological values, are under immense anthropogenic pressure, particularly in areas near human settlements, due to illicit logging, lopping, and overexploitation for fodder and fuelwood (Lai C28 and Gorakhpur C7). Such disturbances affect species composition, stand structure, and carbon dynamics (Yohannes et al., 2015), resulting in biomass and biodiversity loss (Sapkota et al., 2010; Gautam and Mandal, 2016). Compartments such as Rajban C6, C7 had lower tree densities, evidently due to poor site quality, restricted soil depth, reduced canopy cover (Rajban C6, C7, and Gorakhpur C7), and higher disturbance levels viz., lopping for non-timber forest products. The proximity to human activities exacerbates these effects, influencing regeneration and composition (Uprety et al., 2023; Shrestha et al., 2023). The similarities across compartments might be due to their location inside the same forest division and uniform management practices. Variations in species association and community structure, determined by elevation and slope, highlight the involvement of site-specific environmental and anthropogenic activities, highlighting the significance of compartment-level analysis for understanding the dynamics of the Sal-dominated ecosystem.
5 Conclusion
This study gives a detailed insight into the floristic diversity of Sal forests in Himachal Pradesh, presenting valuable insights on the forest’s ecological resilience and biodiversity. With 33 genera and 34 species identified, S. robusta emerged as the leading species, with IVI values ranging from 126.72 to 156.59. Variations in species diversity across compartments, such as Lai C28, Kukron C15, and Rajban C6 and C7, demonstrate the importance of microenvironments and site quality in defining forest composition. The similarity index, which ranges from 0.67 to 1.00, identifies distinct yet interrelated tree communities. This overall uniformity demonstrates that similar sustainable management strategies may be adopted throughout compartments, with small variations for sites such as Lai C28. The existence of a diverse range of species offers important ecosystem services such as carbon sequestration, soil enrichment, and species habitat provision. Understanding and acknowledging the complexities of floristic composition is crucial for effective forest management and conservation. The necessity of protecting native species while avoiding the spread of invasive species such as A. solanacea and L. camara. The findings of the study will contribute significantly to develop sustainable forest management for the Sal forests of Himachal Pradesh to safeguard S. robusta, a high-value wood species and its associates.
Data availability statement
The original contributions presented in the study are included in the article/supplementary material, further inquiries can be directed to the corresponding author.
Author contributions
AS: Data curation, Formal analysis, Methodology, Writing – original draft, Writing – review & editing. DB: Conceptualization, Writing – review & editing. CT: Supervision, Visualization, Writing – review & editing. NK: Software, Writing – review & editing. JS: Visualization, Writing – review & editing.
Funding
The author(s) declare that no financial support was received for the research and/or publication of this article.
Conflict of interest
The authors declare that the research was conducted in the absence of any commercial or financial relationships that could be construed as a potential conflict of interest.
Generative AI statement
The authors declare that no Gen AI was used in the creation of this manuscript.
Publisher’s note
All claims expressed in this article are solely those of the authors and do not necessarily represent those of their affiliated organizations, or those of the publisher, the editors and the reviewers. Any product that may be evaluated in this article, or claim that may be made by its manufacturer, is not guaranteed or endorsed by the publisher.
References
Ayyappan, N., and Parthasarathy, N. (1999). Biodiversity inventory of trees in a large-scale permanent plot of tropical evergreen forest at Varagalaiar, Anamalais, Western Ghats, India. Biodivers. Conserv. 8, 1533–1554.
Banik, B., Deb, D., Deb, S., and Datta, B. K. (2018). Assessment of biomass and carbon stock in Sal (Shorea robusta) forests under two management regimes in Tripura, Northeast India. J. For. Environ. Sci. 34, 209–222.
Behera, M. C., Sahoo, U. K., Mohanty, T. L., Prus, P., Smuleac, L., and Pascalau, R. (2023). Species composition and diversity of plants along human-induced disturbances in tropical moist Sal forests of Eastern Ghats, India. Forests 14:1931. doi: 10.3390/f14101931
Bhat, J. A., Kumar, M., Negi, A. K., Todaria, N. P., Malik, Z. A., Pala, N. A., et al. (2020). Species diversity of woody vegetation along altitudinal gradient of the Western Himalayas. Global Ecol. Conserv. 24:e01302. doi: 10.1016/j.gecco.2020.e01302
Bricca, A., Bonari, G., Padullés Cubino, J., and Cutini, M. (2023). Effect of forest structure and management on the functional diversity and composition of understorey plant communities. Appl. Veg. Sci. 26:e12710.
Champion, H. G., and Seth, S. K. (1968a). A revised survey of the forest types of India. Manager of Publications, Government of India.
Chitale, V. S., and Behera, M. D. (2012). Can the distribution of Sal (Shorea robusta Gaertn. f.) shift in the northeastern direction in India due to changing climate? Curr. Sci. 102, 1126–1135.
Dar, J. A., and Sundarapandian, S. (2016). Patterns of plant diversity in seven temperate forest types of Western Himalaya, India. J. Asia-Pacific Biodivers. 9, 280–292. doi: 10.1016/j.japb.2016.03.018
Dash, S. S., Panday, S., Rawat, D. S., Kumar, V., Lahiri, S., Sinha, B. K., et al. (2021). Quantitative assessment of vegetation layers in tropical evergreen forests of Arunachal Pradesh, eastern Himalaya, India. Curr. Sci. 120, 850–858.
Deka, J., Tripathi, O. P., and Khan, M. L. (2012). High dominance of Shorea robusta Gaertn. f. in alluvial plain Kamrup Sal forest of Assam, India. Int. J. Ecosyst. 2, 67–73.
Divakara, B. N. (2015). Floristic analysis, phytosociological studies, and regeneration status of tree species in Sal forests of Jharkhand, India. In XIV World Forestry Congress. Durban, South Africa. Available online at: https://www.researchgate.net/publication/286443392
DRYFLORBanda-R, K., Delgado-Salinas, A., Dexter, K. G., Linares-Palomino, R., Oliveira-Filho, A., et al. (2016). Plant diversity patterns in neotropical dry forests and their conservation implications. Science 353, 1383–1387. doi: 10.1126/science.aaf5080
Dutta, G., and Devi, A. (2013). Plant diversity and community structure in tropical moist deciduous Sal (Shorea robusta Gaertn. f.) forest of Assam, northeast India. J. Environ. Appl. Bioresour. 1, 1–4.
Forest Survey of India. (2021). India state of forest report 2021. Available online at: https://fsi.nic.in/forest-report-2021 (accessed May 30, 2025).
Gamfeldt, L., Snäll, T., Bagchi, R., Jonsson, M., Gustafsson, L., Kjellander, P., et al. (2013). Higher levels of multiple ecosystem services are found in forests with more tree species. Nat. Commun. 4:1340. doi: 10.1038/ncomms2328
Gautam, K. H., and Devoe, N. N. (2006a). Ecological and anthropogenic niches of Sal (Shorea robusta Gaertn. f.) forest and prospects for multiple-product forest management: a review. Forestry 79, 81–101.
Gautam, K. H., and Devoe, N. N. (2006b). Ecology and management of Sal (Shorea robusta) forests in Nepal: current knowledge and future directions. Banko Janakari 16, 3–11.
Gautam, T. P., and Mandal, T. N. (2016). Effect of disturbance on biomass, production and carbon dynamics in moist tropical forest of eastern Nepal. For. Ecosyst. 3:11. doi: 10.1186/s40663-016-0078-9
Gogoi, A., and Sahoo, U. K. (2018). Assessment of biomass and total carbon stock in a tropical wet evergreen rainforest of eastern Himalaya along a disturbance gradient. J. Plant Nutr. Soil Sci. 4, 1–8.
Goldsmith, F. B., Harrison, C. M., and Morton, A. J. (1986). “Description and analysis of vegetation” in Methods in plant ecology. eds. P. D. Moore and S. B. Chapman (Oxford, UK: Blackwell Scientific), 442–482.
Hammer, O., Harper, D. A. T., and Ryan, P. D. (2001). PAST: paleontological statistics software package for education and data analysis. Palaeontol. Electron., 4:9. Available online at: http://palaeo-electronica.org/2001_1/past/issue1_01.htm
Haq, S. M., Khoja, A. A., Lone, F. A., Waheed, M., Bussmann, R. W., Mahmoud, E. A., et al. (2023). Floristic composition, life history traits and phytogeographic distribution of forest vegetation in the Western Himalaya. Front. For. Global Change 6:1169085. doi: 10.3389/ffgc.2023.1169085
Hofhansl, F., Chacón-Madrigal, E., Fuchslueger, L., Jenking, D., Morera-Beita, A., Plutzar, C., et al. (2020). Climatic and edaphic controls over tropical forest diversity and vegetation carbon storage. Sci. Rep. 10:5066. doi: 10.1038/s41598-020-61981-5
Jha, C. S., and Singh, J. S. (1990). Composition and dynamics of dry tropical forest in relation to soil texture. Journal of Vegetation Science, 609–614.
Jucker, T., Bongalov, B., Burslem, D. F. R. P., Nilus, R., Dalponte, M., Lewis, S. L., et al. (2018). Topography shapes the structure, composition, and function of tropical forest landscapes. Ecol. Lett. 21, 989–1000. doi: 10.1111/ele.12964
Khan, A., Page, S., Ahmad, H., and Harper, D. (2013). Identifying plant species and communities across environmental gradients in the Western Himalayas: method development and conservation use. Eco. Inform. 14, 99–103. doi: 10.1016/j.ecoinf.2012.11.010
Kongkham, B., Devi, T., and Singh, N. (2021). Carbon sequestration and climate change mitigation in Sal forests. Environ. Sci. Pollut. Res. 28, 23548–23555. doi: 10.1007/s11356-020-12392-0
Koop, A. L. (2003). Population dynamics and invasion rate of an invasive, tropical understory shrub, Ardisia elliptica (Doctoral dissertation). University of Miami.
Koop, A. L. (2004). Differential seed mortality among habitats limits the distribution of the invasive non-native shrub Ardisia elliptica. Plant Ecol. 172, 237–249. doi: 10.1023/B:VEGE.0000026345.25807.5a
Koop, A. L., and Horvitz, C. C. (2005). Projection matrix analysis of the demography of an invasive, nonnative shrub (Ardisia elliptica). Ecology 86, 2661–2672. doi: 10.1890/04-1827
Kumar, P., Behera, S. K., Nayak, D. K., Mishra, A., Panda, D., and Sahu, H. K. (2022). Impact of forest fire frequency on floristic diversity in the forests of Similipal Tiger Reserve, India. Environ. Challenges 7:100464. doi: 10.1016/j.envc.2022.100464
Kumar, A., Marcot, B. G., and Saxena, A. (2006). Tree species diversity and distribution patterns in tropical forests of Garo Hills. Curr. Sci. 91, 1370–1381.
Kumar, A., and Saikia, P. (2020a). Plant diversity and community structure in tropical moist deciduous Sal (Shorea robusta Gaertn. f.) forest of Assam, Northeast India. Trop. Ecol. 61, 169–181.
Kumar, R., and Saikia, P. (2020b). Floristic analysis and dominance pattern of Sal (Shorea robusta) forests in Ranchi, Jharkhand, eastern India. J. For. Res. 31, 415–427. doi: 10.1007/s11676-018-0829-9
Kumar, R., and Saikia, P. (2020c). “Forest resources of Jharkhand, eastern India: socio-economic and bio-ecological perspectives” in Socio-economic and eco-biological dimensions in resource use and conservation: Strategies for sustainability. eds. P. Saikia, L. R. Singh, and R. Kumar (Berlin: Springer), 61–101.
Kumar, R., and Saikia, P. (2021). Population structure and regeneration status of Shorea robusta and associated trees in Sal forests of Ranchi, eastern India. Trop. Ecol. 62, 34–51.
Liang, J., Crowther, T. W., Picard, N., Wiser, S., Zhou, M., Alberti, G., et al. (2016). Positive biodiversity–productivity relationship predominant in global forests. Science 354:aaf8957. doi: 10.1126/science.aaf8957
Lindenmayer, D. B., Franklin, J. F., and Fischer, J. (2006). Variable retention harvesting in Australian temperate forests and its biodiversity benefits. Austral Ecol. 31, 167–181. doi: 10.1111/j.1442-9993.2006.01600.x
Liu, X., Liang, M., Etienne, R. S., Wang, Y., Staehelin, C., and Yu, S. (2018). Functional diversity enhances tree growth and reduces herbivory damage in secondary broadleaf forests, but does not influence resilience to drought. J. Appl. Ecol. 55, 1282–1292. doi: 10.1111/1365-2664.13051
Magurran, A. E. (1988). Ecological diversity and its measurement. Princeton, NJ: Princeton University Press.
Mandal, G., and Joshi, S. P. (2014). Analysis of vegetation dynamics and phytodiversity from three dry deciduous forests of Doon Valley, Western Himalaya, India. J. Asia-Pacific Biodivers. 7, 292–304. doi: 10.1016/j.japb.2014.07.006
Margalef, D. R. (1958). Information theory in ecology. Int. J. Gen. Syst. 3, 36–71. doi: 10.1080/03081075808559494
May, R. M., and Stumpf, M. P. H. (2000). Ecology: species–area relations in tropical forests. Science 290, 2084–2086. doi: 10.1126/science.290.5499.2084
Mishra, R., Kumar, R., and Singh, A. (2021). Impact of climate change on growth and distribution of Sal (Shorea robusta) in India. Environ. Sci. Pollut. Res. 28, 18612–18625. doi: 10.1007/s11356-020-11998-w
Mishra, D., Mishra, T. K., and Banerjee, S. K. (1997). Comparative phytosociological and soil physiochemical aspects between managed and unmanaged lateritic land. Ann. For. 5, 16–25.
Mishra, R. K., Upadhyay, V. P., Nayak, P. K., Pattanaik, S., and Mohanty, R. C. (2012). “Composition and stand structure of tropical moist deciduous forest of Similipal biosphere reserve, Orissa, India” in Forest ecosystems—more than just trees, 109–136.
Nakhoul, N., Fernandez, C., Bousquet-Mélou, A., Nemer, N., Abboud, J., and Prévosto, B. (2020). Vegetation dynamics and regeneration of Pinus pinea forests in Mount Lebanon: towards the progressive disappearance of pine. Ecol. Eng. 152:105866. doi: 10.1016/j.ecoleng.2020.105866
Noss, R. F. (1999). Assessing and monitoring forest biodiversity: a suggested framework and indicators. For. Ecol. Manag. 115, 135–146. doi: 10.1016/S0378-1127(98)00405-7
Pandey, S. K. (2000). Population status and regeneration strategy of some perennial legumes in plantation forests of north-eastern Uttar Pradesh (doctoral dissertation). DDU Gorakhpur University, India.
Pandey, S. K., and Shukla, R. P. (2001). Regeneration strategy and plant diversity status in degraded Sal forests. Curr. Sci. 81, 95–102.
Pandey, S. K., and Shukla, R. P. (2019). Effect of disturbance on population structure, regeneration and conservation of Moghania Chappar in Sal forests of Gorakhpur, India. Trop. Ecol. 60, 337–349.
Pandita, S., Kumar, V., and Dutt, H. C. (2019). Environmental variables Vis-à-Vis distribution of herbaceous tracheophytes on northern sub-slopes in Western Himalayan ecotone. Ecol. Process. 8, 1–9. doi: 10.1186/s13717-019-0200-x
Pielou, E. C. (1966). The measurement of diversity in different types of biological collections. J. Theor. Biol. 13, 131–144. doi: 10.1016/0022-5193(66)90013-0
Poorter, L., van der Sande, M. T., Amissah, L., Bongers, F., Hordijk, I., Kok, J., et al. (2024) A comprehensive framework for vegetation succession. Ecosphere. 15, e4794.
Rahman, M. M., and Vacik, H. (2010). “Vegetation analysis and tree population structure of Sal (Shorea robusta C. F. Gaertn.) forests: a case study from the Madhupur and Bhawal National Park in Bangladesh” in National parks: Vegetation, wildlife and threats. (New York: Nova Science Publishers), 193–206.
Rahman, M. R., Shi, Z. H., and Chongfa, C. (2009). Soil erosion hazard evaluation—an integrated use of remote sensing, GIS and statistical approaches with biophysical parameters towards management strategies. Ecological Modelling, 220, 1724–1734.
Rawat, G. S., and Bhainsora, N. S. (1999). Woody vegetation of Shivaliks and outer Himalaya in northwestern India. Trop. Ecol. 40, 119–128.
Saikia, D. B. K., Tripathi, S., and Khan, D. (2017). Plant diversity patterns and conservation status of eastern Himalayan forests in Arunachal Pradesh, Northeast India. For. Ecosyst. 4, 1–10. doi: 10.1186/s40663-017-0101-7
Sapkota, I. (2009). Species diversity, regeneration, and early growth of Sal forests in Nepal (Master’s thesis or report, please confirm type and institution). 91 pp.
Sapkota, I. P., Tigabu, M., and Oden, P. C. (2010). Changes in tree species diversity and dominance across a disturbance gradient in Nepalese Sal (Shorea robusta) forests. J. For. Res. 21, 25–32.
Sarkar, M., and Devi, A. (2014). Assessment of diversity, population structure and regeneration status of tree species in Hollongapar Gibbon wildlife sanctuary, Assam, Northeast India. Trop. Plant Res. 1, 26–36.
Satya, U. D. K., and Nayaka, S. (2005). Shorea robusta—an excellent host tree for lichen growth in India. Curr. Sci. 89, 594–595.
Shankar, U., and Garkoti, S. C. (2023). Response of Sal (Shorea robusta) to climate change: a review. Trop. Ecol. 64, 123–135.
Shannon, C. E., and Weaver, W. (1963). The mathematical theory of communication. Champaign, IL: University of Illinois Press.
Sharma, L. N., Adhikari, B., Watson, M. F., Shrestha, B. B., Paudel, E., Karna, B., et al. (2022). Forest canopy resists plant invasions: a case study of Chromolaena odorata in Sal (Shorea robusta) forests of Nepal. J. Trop. Ecol. 38, 49–57.
Sharma, K. P., Bhatta, S. P., and Lamsal, S. K. (2020). Species diversity and regeneration status of community-managed hill Sal (Shorea robusta) forest in Central Nepal. Curr. Sci. 119, 83–92.
Sharma, G. P., and Raghubanshi, A. S. (2007). Effect of Lantana camara L. cover on local depletion of tree population in the Vindhyan tropical dry deciduous forest of India. Appl. Ecol. Environ. Res. 5, 109–121.
Shrestha, U. B., Shrestha, B. B., and Shrestha, S. (2010). Biodiversity conservation in community forests of Nepal: rhetoric and reality. Int. J. Biodivers. Conserv. 2, 98–104.
Shrestha, N., Shrestha, A., and Bhusal, K. P. (2023). Bird Diversity in Bhaludhunga: Exploring Avian Diversity in Eastern Mid-hills of Nepal. Forestry: Journal of Institute of Forestry, Nepal, 20, 112–125.
Singh, R., and Joshi, M. C. (1979). Floristic composition and life forms of sand dune herbaceous vegetation near Pilani, Rajasthan. Indian J. Ecol. 6, 9–19.
Siraj, M., Zhang, K., Sebsebe, D., and Zerihun, W. (2017). Floristic composition and plant community types in maze National Park, Southwest Ethiopia. Appl. Ecol. Environ. Res. 15, 245–262.
Swaminathan, M. S., and Kochhar, S. L. (2019). Major flowering trees of tropical gardens. Cambridge: Cambridge University Press, 39–40.
Tewari, D. N. (1995). A monograph on Sal (Shorea robusta). Dehradun: International Book Distributors.
Uprety, Y., Tiwari, A., Karki, S., Chaudhary, A., Yadav, R. K. P., Giri, S., et al. (2023). Characterization of forest ecosystems in the Chure (Siwalik Hills) landscape of Nepal Himalaya and their conservation need. Forests 14:100.
Van Rooyen, M. W., Botes, F., and Le Roux, A. (2017). Floristic composition, diversity, and community structure of the southern Kalahari dune vegetation. Open J. For. 7, 416–439. doi: 10.4236/ojf.2017.74025
Working Plan (2020). Paonta forest division-working plan 2019–20. Himachal Pradesh, India: Himachal Pradesh State Forest Department, 1093.
Whittaker, R. H., (1977). Evolution of species diversity in land communities Evolutionary Biology. Eds. Hecht, M.K., Steere, W.C., Wallace, B. New York: Plenum. 1–67.
Yohannes, H., Bekele, T., and Amena, G. (2015). Floristic composition, diversity and structure of woody plant species in Menagesha Suba state Forest, Ethiopia. Afr. J. Ecol. 53, 194–204. doi: 10.1111/aje.12182
Yumnam, J. Y., and Ronald, K. (2022). Disparity in phytosociology, biomass and carbon stock of trees in primary and secondary temperate forests. Indian Journal of Ecology, 49, 1613–1620.
Zhang, Y., Li, X., Wang, X., and Niu, B. (2017). Context-dependency of tree species diversity, trait composition and environmental filtering across a 5000 m elevational gradient on the southeastern Tibetan plateau. Sci. Total Environ. 574, 778–791. doi: 10.1016/j.scitotenv.2016.09.119
Keywords: floristic composition, IVI, phytosociology, diversity indices, reserve forest
Citation: Sharma A, Bhardwaj DR, Thakur CL, Katoch N and Sharma JP (2025) Floristic diversity and dominance patterns of Sal (Shorea robusta Gaertn. f.) forests in North Western Himalayas: implications for conservation and sustainable management. Front. For. Glob. Change. 8:1524808. doi: 10.3389/ffgc.2025.1524808
Edited by:
Jinghui Meng, Beijing Forestry University, ChinaReviewed by:
D. S. Chauhan, Hemwati Nandan Bahuguna Garhwal University, IndiaSumit Chakravarty, Uttar Banga Krishi Viswavidyalaya, India
Thiru Selvan, Tripura University, India
Copyright © 2025 Sharma, Bhardwaj, Thakur, Katoch and Sharma. This is an open-access article distributed under the terms of the Creative Commons Attribution License (CC BY). The use, distribution or reproduction in other forums is permitted, provided the original author(s) and the copyright owner(s) are credited and that the original publication in this journal is cited, in accordance with accepted academic practice. No use, distribution or reproduction is permitted which does not comply with these terms.
*Correspondence: Aditi Sharma, c2hhcm1hYWRpdGkuOTE2QGdtYWlsLmNvbQ==