 Hongjun Peng
 Ping Li2
 Yiwei Han
- 1School of Architecture, Tianjin University, Tianjin, China
- 2School of Design, Jiangnan University, Wuxi, China
- 3College of Landscape Architecture and Art, Fujian Agriculture and Forestry University, Fuzhou, China
Cherry blossom scenic spots attract numerous tourists during peak flowering seasons, significantly contributing to outdoor recreation, public health, and tourism development. Existing research has primarily focused on species classification, flowering period regulation, and localized landscape design. However, systematic studies examining these scenic spots’ temporal and spatial patterns remain scarce, hindering effective planning across varying latitudes and urban contexts. This study aims to fill this research gap by conducting spatiotemporal distribution analysis using ArcGIS, in conjunction with the geographical detector and sentiment perception measurement methods. Key findings from the analysis of 253 cherry blossom scenic spots in China include: (1) These spots are found in all provincial-level regions except Qinghai and Hainan, with Hubei Province having the highest concentration. The distribution has shifted from a discrete pattern to a clustering trend in high-density areas of North, East, and Central China, particularly Beijing, Shanghai, and Wuhan. (2) Main applications include parks, campuses, mountains, temples, and roadways, predominantly located in parks. (3) Variations in cherry blossom species and flowering periods are notable across regions, with diverse species in North, East, and Central China. (4) Economic status primarily influences distribution, alongside natural geographic and demographic factors, whose interactions enhance explanatory power. (5) The 10 most reviewed spots show positive visitor perceptions, with distinct emotional responses by region. (6) The layout and evolution of these spots result from both natural and socio-cultural influences. These findings support informed planning and development strategies for cherry blossom scenic spots in China.
Introduction
Cherries are highly favored by the public due to their abundant blooms, vibrant colors, and concentrated flowering periods. Scenic spots dedicated to cherry blossoms prominently showcase their aesthetic appeal. As urbanization progresses and residents’ living standards improve, enthusiasm for tourism in urban peripheries is increasingly rising, leading to a sustained increase in the tourism industry in surrounding cities. Research indicates that cherry blossom viewing can stimulate individuals’ excitement, with springtime observation of cherry blossoms significantly enhancing prefrontal cortex activity, as evidenced by an increase in oxyhemoglobin concentration (Igarashi et al., 2015). The “cherry blossom viewing craze” has emerged as a social and cultural phenomenon. Scholars have utilized landscape narrative analysis to reveal the emotional changes and cultural symbols stimulated by cherry blossom landscapes in the post-pandemic context, exploring their potential for in-depth development (Zhang Y. X. et al., 2021). Therefore, developing supporting tourism and natural landscape parks tailored to the elements surrounding urban areas is beneficial for enhancing the livability index of cities, improving residents’ happiness, and promoting rural ecological revitalization industries. However, due to insufficient research on regional adaptability and economic benefits, certain cherry blossom scenic spots face issues such as mismatched species selection, low aesthetic value, and poor economic returns.
The initial investment costs for cherry blossom scenic spots are high, and their aesthetic value is closely linked to climatic and topographical conditions. Studying the distribution characteristics and influencing factors of cherry blossom scenic spots can contribute to the establishment of a scientifically effective planning and management system for these attractions. This would address the needs of research, landscape application, and industrial development, thus further promoting the expansion of China’s cherry blossom industry. Scholars have integrated street-level imagery with deep learning models to develop the YOLOv4 system for semi-automated detection of cherry blossom blooming, demonstrating the potential for spatial and temporal observational records (Tsutsumida and Funada, 2023). Darbyshire et al. compiled a dataset of cherry blossom dates across various cultivation regions in Australia for the first time, analyzing spatial and interannual variations. By assessing the performance of sequential and chilling overlap models, the study demonstrated the potential applications of these data in optimizing cherry cultivation management (Darbyshire et al., 2020). Due to the extensive manpower and resources required to study cherry blossom flowering patterns, ElQadi et al. revealed the spatiotemporal patterns of cherry blossoms in Japan over a 12-week period by collecting images from the Flickr social media platform, offering a comprehensive and detailed perspective (ElQadi et al., 2023). Additionally, the study found that the greenhouse effect significantly impacts the viewing period of cherry blossom landscapes. By examining the effects of climate warming on the flowering and festival timing of cherry blossoms in two cities, the researchers discovered that moderate warming could enhance the tourism value of cherry blossoms, while excessive warming would diminish their appeal (Nagai et al., 2019).
Some researchers utilized user-generated content (UGC) to generate visitor data for cherry blossom viewing across 220 cities in China and employed climate models to simulate future tourism trends, revealing the relationship between temperature and visitor numbers (Wang et al., 2023). Researchers analyzed the motivations, attitudes, and satisfaction levels of participants at the Wuxi Taihu International Cherry Blossom Festival, finding that residents and tourists exhibited similar responses, with motivations significantly influencing satisfaction levels (Li et al., 2022). However, there remains a gap in research concerning the factors influencing cherry blossom landscape tourism across China. Therefore, analyzing the impact factors of cherry blossom landscape tourism development in conjunction with local economic policies, cultural exchanges, and resident conditions can assist urban planners in developing tailored strategies. This approach can help establish a scientific and rational classification system for urban resources, promoting the reasonable development and efficient utilization of urban cherry blossom landscape tourism resources. Furthermore, with the advancement of internet technology and the proliferation of online positioning, big data recommendations, and social media applications, focusing on representative cherry blossom scenic spots can aid in analyzing actual visitor travel preferences and behavioral habits.
Current research on cherry blossom scenic spots in China primarily aims to enhance landscape effects by proposing landscape configurations and optimal viewing periods. Most studies focus on individual cherry blossom locations. However, theoretical research on the spatiotemporal distribution and influencing factors of cherry blossom scenic spots in China has not been reported. Considering the vast land area of China and the diverse climatic and flowering period variations across regions, studying the trends in the temporal and spatial distribution of cherry blossom scenic spots can assist in analyzing the current development status and future potential of urban cherry blossom attractions. This study seeks to address the existing gap in dynamic research concerning the spatial distribution of cherry blossom scenic spots in China. Specifically, the research objectives are threefold: (1) to analyze the temporal evolution characteristics, overall spatial layout, migration directions, and pattern evolution of cherry blossom scenic spots; (2) to understand the influencing factors of the distribution characteristics of cherry blossom scenic spots in China; (3) based on these analyses, to advance the theoretical understanding of the spatiotemporal evolution of cherry blossom scenic spots from a dynamic perspective, sustainably guiding practical optimization.
2 Methodology
2.1 Data sources
The data on cherry blossom scenic spots in China used in this study were obtained from statistical data provided by the cultural and tourism departments of provincial-level administrative regions, up to December 30, 2023. This statistical data includes basic information such as the names, addresses, establishment dates, and contact details of cherry blossom scenic spots. The selection of 2023 as the reference year was made to ensure the novelty and comprehensiveness of the data, accurately reflecting the current state of cherry blossom tourism in China. To comprehensively enhance the research data, additional information was gathered through various online platforms, including Ctrip, Qunar, official WeChat accounts of specific cherry blossom scenic spots, as well as the China Statistical Yearbook1 and statistical bulletins from 366 prefecture-level administrative units (including municipalities and provincially administered counties). This was complemented by telephone interviews to further collect detailed information on the specific locations, topography, scale, species, and flowering periods of each cherry blossom scenic spot, along with geographical conditions, population demographics, and economic levels of their respective cities. After screening for data completeness, a total of 253 cherry blossom scenic spots with comprehensive data were retained as research subjects, while those lacking critical data were excluded.
As China’s largest travel website, Ctrip offers significant advantages, including a vast scale of data, rapid updates, and reliable content. It contains extensive information on numerous domestic and international attractions, along with visitor review data, which reflect the most authentic perceptual experiences of tourists (Cao et al., 2021). This study employed a Python scraping program to collect information and relevant review data regarding cherry blossom scenic spots from Ctrip, including seven data items for each site: name, address, coordinates, number of reviews, overall rating, textual reviews, and review photos. These data can be categorized into three types: spatiotemporal data, photographic data, and textual data. After data organization and manual verification, the study selected the top ten cherry blossom scenic spots with the highest number of reviews as of December 30, 2023, which included 41,707 textual reviews and 36,127 photos, serving as the foundational dataset for this research. The 2023 edition of the “China Map” was selected as the base map for information collection and spatial analysis in this study. ArcGIS was utilized to register and vectorize the study area (Beijing 1954 geographical coordinate system projection). The base map includes several layers: the administrative division layer of China (polygon), a three-tiered road network layer (line) at the provincial, county, and township levels, and a water body layer (polygon). Digital Elevation Model (DEM) data for the map was obtained from the Geospatial Data Cloud website,2 with the dataset reflecting the topographic conditions as of 2023 to maintain consistency with other data sources in the study.
2.2 Materials and methods
This study focused on 253 cherry blossom scenic spots with comprehensive foundational data obtained from preliminary investigations.
The information regarding the establishment dates of the cherry blossom scenic spots was primarily gathered from the survey results and field verifications. Additionally, each scenic spot’s address information was spatially processed using Google Earth to determine its latitude and longitude coordinates, and a spatiotemporal database was established with ArcGIS 10.8. Natural language processing, average nearest neighbor distance analysis (Zhang and Yang, 1984), and kernel density analysis (Silverman, 1986) were employed to assess public sentiment toward cherry blossom scenic spots and to provide a macro-level understanding of their distribution in China. Furthermore, mean center analysis (Janelle and Goodchild, 1983; Wang et al., 2006) and standard deviation ellipses (Lefever, 1926; Chen et al., 2021) were utilized to reveal the spatial dynamics and trends of cherry blossom scenic spots across different historical periods. The specific methodologies are outlined as follows:
(1) Average nearest neighbor distance analysis
The average nearest neighbor distance analysis (NNA) is employed to reveal the spatial distribution patterns of point features by comparing the actual nearest neighbor distances within a spatial extent to the theoretical nearest neighbor distances (Price, 2012). The calculation formula Equations 1, 2 are as follow:
In the formula, A represents the area of the study region; n is the sample size; rE denotes the theoretical nearest neighbor distance; rI is the actual nearest neighbor distance in the space; and R is the nearest neighbor index. Based on the value of R, the spatial distribution pattern of the study samples within the region can be assessed as follows: random distribution (R = 1); clustered distribution (R < 1); or dispersed distribution (R > 1).
(2) Kernel density estimation
Kernel density estimation (KDE) is a non-parametric estimation method used to analyze the density of geographical features within surrounding areas. By applying a kernel function to assign different weights to sample points within the study area, KDE produces a smoother density map that reveals the density characteristics of unknown regions (Tang and Yang, 2012). The calculation formula Equation 3 is as follows:
In the formula, k[(x-xi)/h] represents the kernel function; h is the bandwidth (where h>0); n is the sample size; and (x-xi) denotes the distance from the sample point xi to the estimation point x.
(3) Standard deviational ellipse
The Standard Deviational Ellipse (SDE) is an important method for exploring the directional and trend characteristics of the spatial distribution of point features, where the mean center indicates the relative position of the point features in space. The azimuth is the angle between true north and the principal axis, measured in the clockwise direction, representing the primary direction of spatial distribution (Zhang and Yang, 1984). The calculation formula Equations 4, 5 are as follow:
In the formula, represents the coordinates of the mean center; θ is the azimuth of the ellipse; xi and yi denote the spatial coordinates of the point features.
(4) Geographical detector
The Geographical Detector (GD) is a spatial analysis method used to determine whether the spatial distributions of a dependent variable and its explanatory factors are consistent (Kaijun and Jialiang, 2023). The calculation formula Equation 6 is as follows:
In the formula, qX represents the influence of factor X on the density of cherry blossom scenic spots, where q∈[0, 1]; a larger value of q indicates a greater influence of factor X on the density of cherry blossom scenic spots. L denotes the stratification of the density of cherry blossom scenic spots or the influencing factor X; Nh and represent the number of units (individuals) and variance for stratum h, respectively; while N and σ2 denote the total number of units (individuals) and variance for the entire study area.
(5) Sentiment perception measurement: natural language processing
This study employs natural language processing methods for sentiment perception measurement, utilizing the natural semantic machine learning algorithms provided by the Baidu AI Open Platform. This approach includes typical opinion extraction and sentiment tendency assessment. Typical opinion extraction identifies tourists’ subjective feelings through the statistical analysis and clustering of keyword frequencies. Sentiment tendency assessment involves analyzing text’s grammatical and syntactic structures in specific contexts to determine the expressed emotional polarity, providing corresponding confidence levels. The emotional polarity can be categorized into three types: positive, negative, and neutral (Cao et al., 2021).
This study defines the sentiment index as the product of the positive index and the confidence level, using this value to represent the emotional tendency expressed by the tourists. The index ranges between [0, 1], as shown in the following Equation 7:
In the formula, Ei represents the sentiment index, Pi is the positive index, 1−αi denotes the confidence level, and i is the review number.
3 Results
3.1 Temporal evolution characteristics
According to the authoritative work “The Great Book of Cherry Blossoms” published in Japan, cherry blossoms are originally native to the Himalayas (Chen, 2016) and were later introduced to the Yangtze River Basin, southwestern regions, and Taiwan through artificial cultivation. To analyze the dynamics of cherry blossom scenic spot construction during different periods (Liu et al., 2024), the establishment years of cherry blossom scenic spots in China were categorized into four historical periods based on key development milestones: prior to 1949, 1949–1979, 1980–2000, and 2001–2023 (Figure 1a). The study involved counting both the new additions and the total number of cherry blossom scenic spots, and creating a temporal distribution map of the quantity changes (Figure 1b). It is evident that the earliest cherry blossom scenic spots were established before 1949, followed by a limited number of new constructions until the late 1980s, while the quantity has surged dramatically from the 1990s to the present.

Figure 1. (a) Distribution of cherry blossom scenic spots in China across different periods. (b) Quantity of cherry blossom scenic spots in China across different periods.
Using ArcGIS 10.8, the nearest neighbor distance analysis method was employed to calculate the nearest neighbor index of cherry blossom scenic spots in China across different temporal cross-sections (Table 1). The kernel density analysis tool was utilized to generate kernel density distribution maps of cherry blossom scenic spots for different temporal cross-sections (Figure 2).
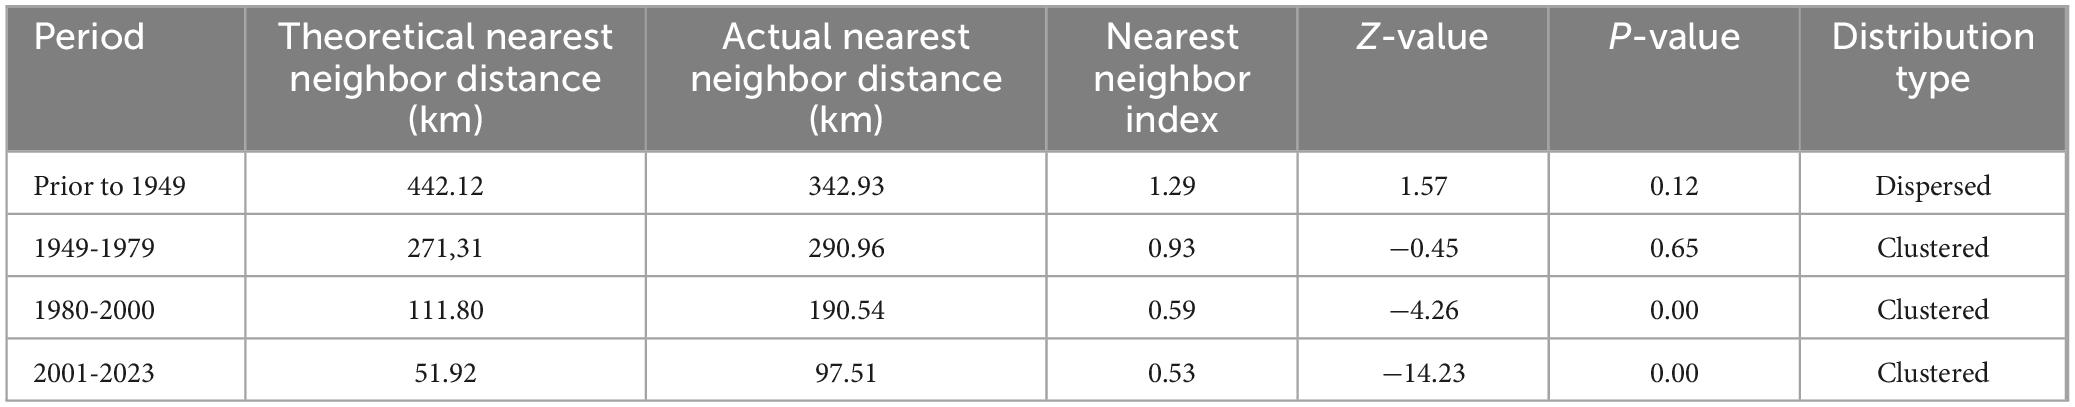
Table 1. Nearest neighbor index of cherry blossom scenic spots in China across different periods.
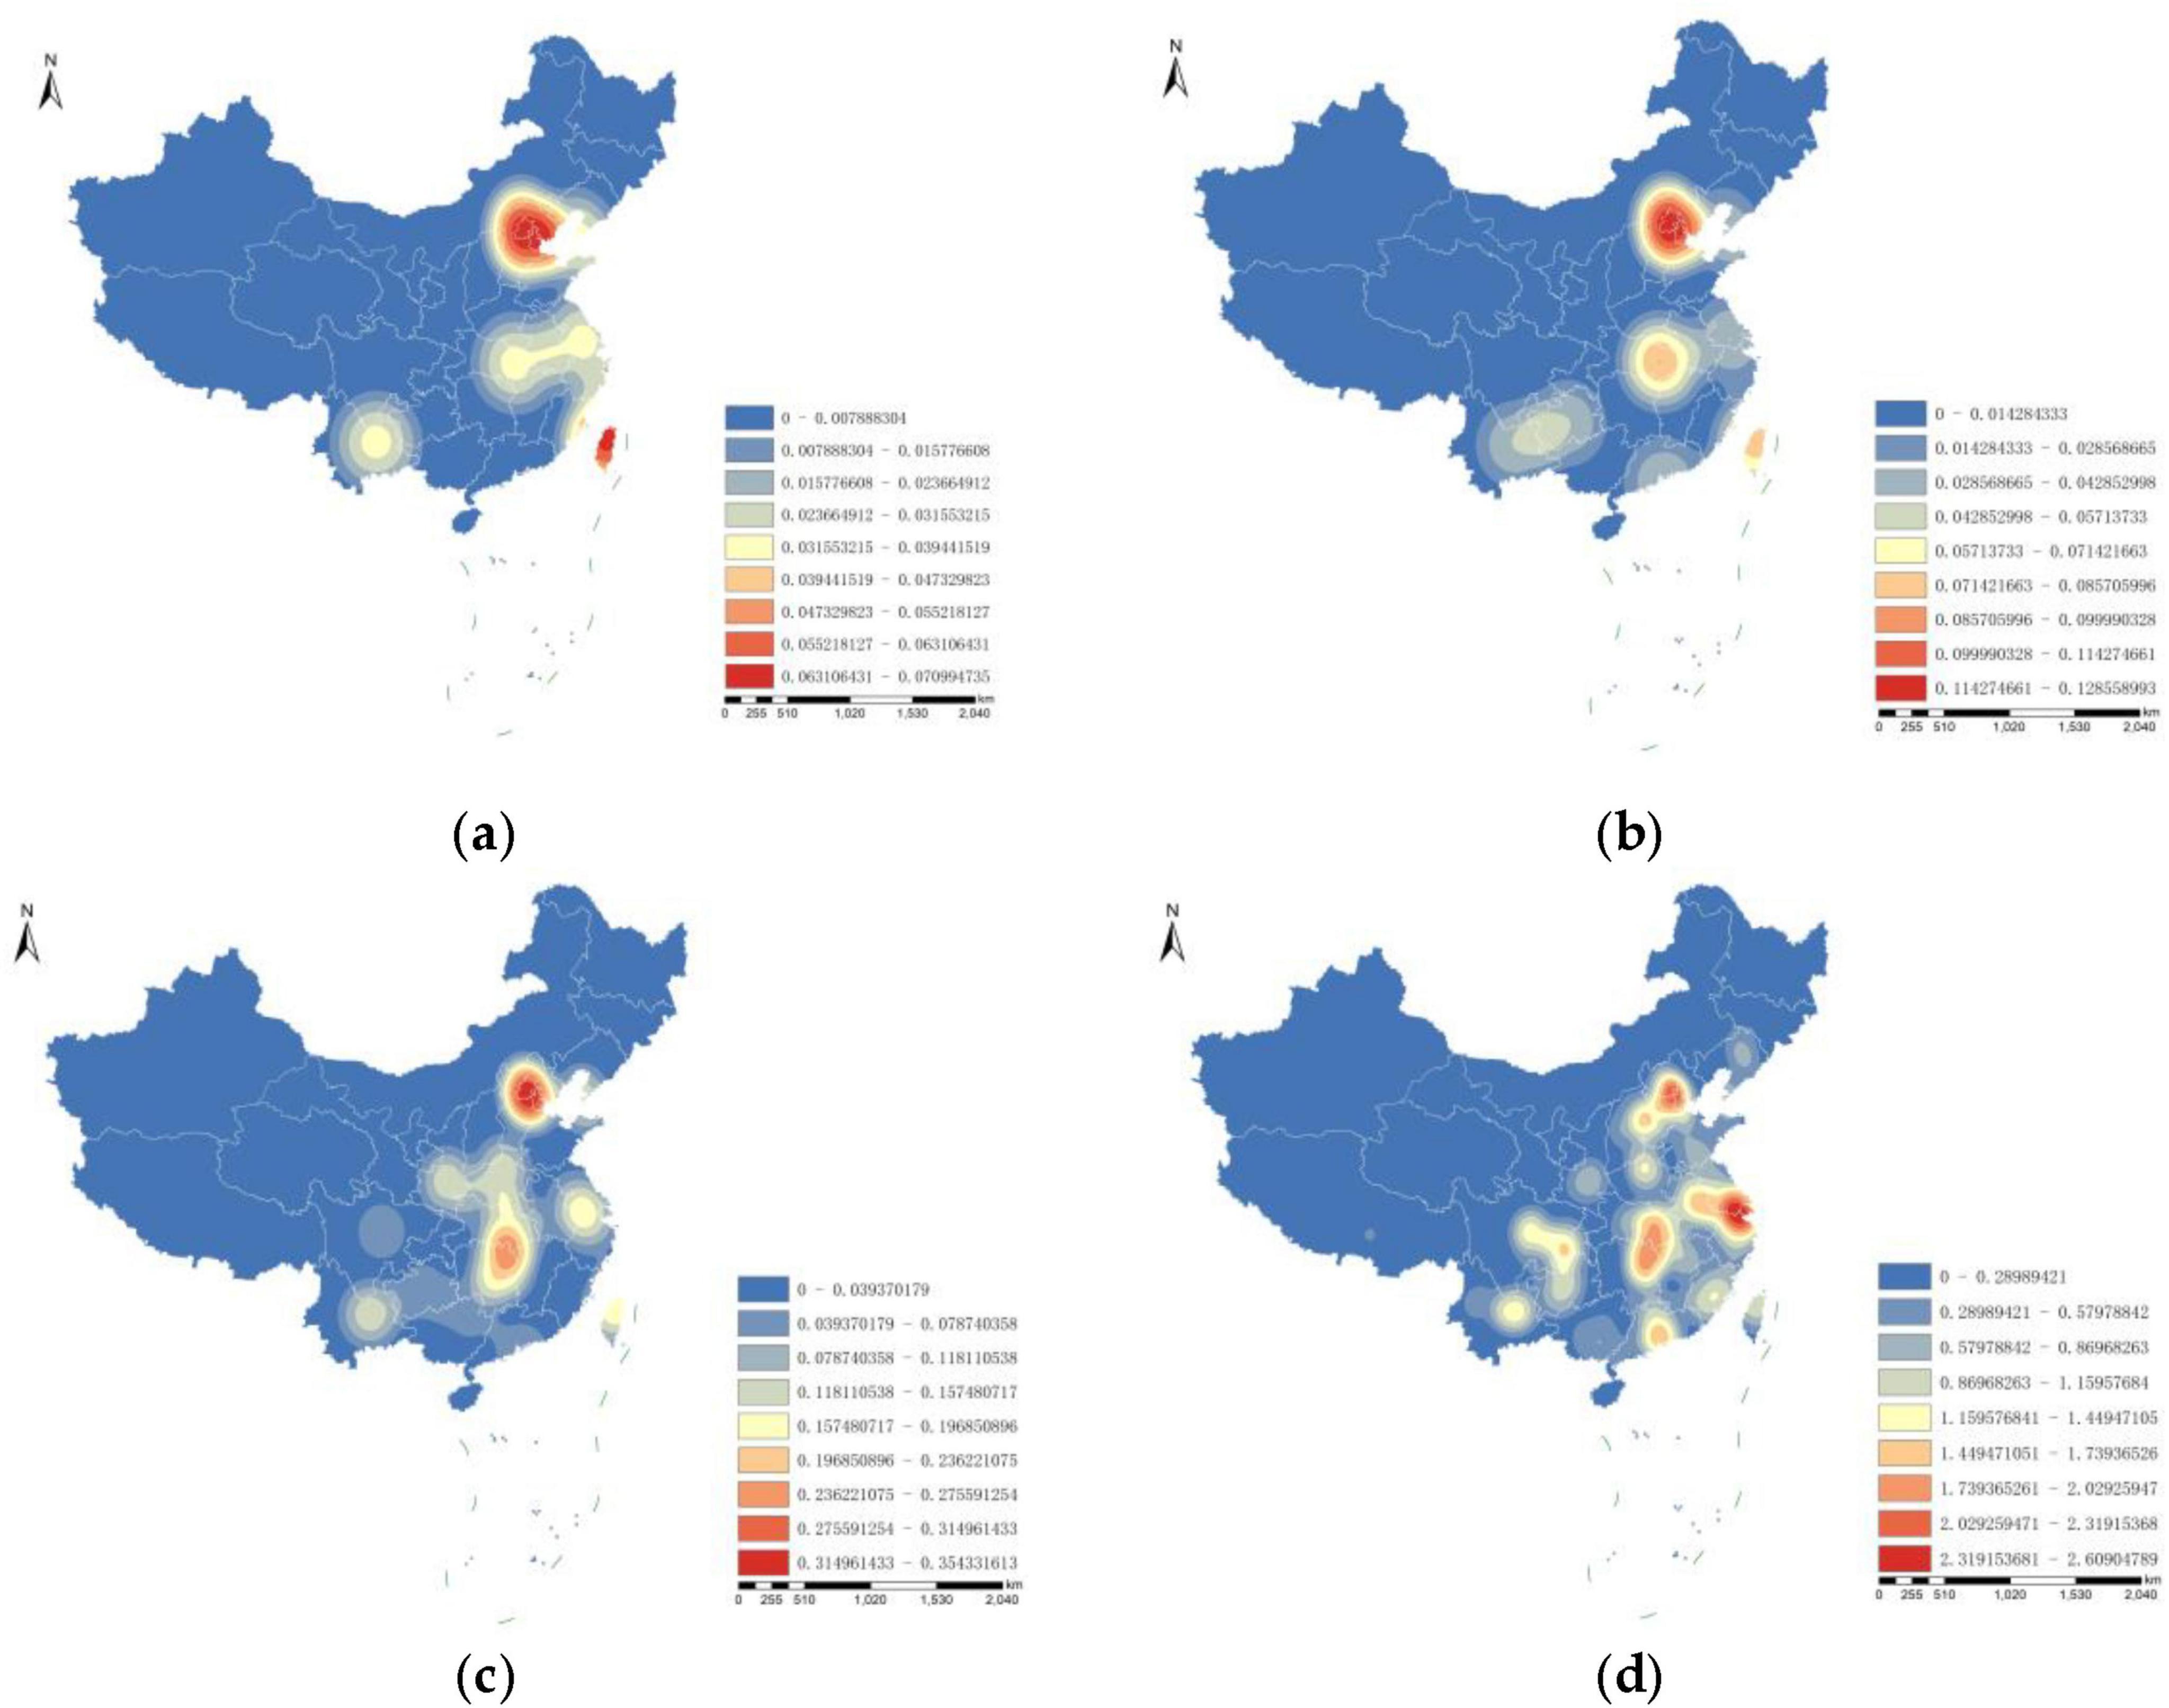
Figure 2. Kernel density map of cherry blossom scenic spot distribution in China across different periods. (a) Prior to 1949. (b) 1949–1979. (c) 1980–2000. (d) 2001–2023.
3.1.1 Prior to 1949
China has a long history of cherry blossom cultivation, with the earliest cherry blossom scenic spots emerging around the 1930s. Prior to 1949, there were a total of eight cherry blossom scenic spots. The nearest neighbor index R = 1.29, indicating a dispersed distribution. As shown in Figure 2a, four preliminary distribution areas have formed, with the North China region and Taiwan being high-density areas.
3.1.2 1949-1979
From the founding of the People’s Republic of China until the late 1970s, the distribution of cherry blossom scenic spots was based on the pre-establishment clustered core, with four new scenic spots added, bringing the total to 12. The nearest neighbor index R = 0.93 indicates a strengthening of clustering. As shown in Figure 2b, the densely populated area in the southwestern region exhibits an eastward expansion trend, while the high density in the central region gradually strengthens and diffuses toward the southern and eastern regions.
3.1.3 1980–2000
From the early 1980s to the end of the twentieth century, 17 new cherry blossom scenic spots were added in China, increasing the total to 29. The nearest neighbor index R = 0.59 and P = 0.00 indicate a significant clustering trend. As shown in Figure 2c, the density in the core area of the central region intensified while diffusing toward the northwest, forming two major core dense areas in conjunction with the North China region. This established the foundational distribution pattern of cherry blossom scenic spots in China after the reform and opening-up period. Additionally, the clustering intensity in the eastern coastal areas of East China and the southwestern region also gradually strengthened. In addition to reinforcing the dominant axial distribution, a scattered distribution outside the dominant axis emerged, indicating a diffusion-based distribution development.
3.1.4 2001–2023
Since the early twenty-first century, the number of cherry blossom scenic spots has rapidly increased compared to the previous period, with an addition of 224 spots, bringing the total to 253. The nearest neighbor index R = 0.53 indicates a strengthened clustering distribution state. As shown in Figure 2d, a highly dense area has formed along the eastern coastal region of East China, enhancing the longitudinal development from east to west. Currently, the clustering intensity is at its highest, creating a high-density region centered around Beijing, Shanghai, and Wuhan in North China, East China, and Central China, with secondary density areas in South China and the southwestern region centered around Guangdong. This distribution pattern coexists with an extension along the North China-Southwest axis and a scattered, diffusion-based distribution.
3.2 Overall spatial layout
By region, the number and proportion of cherry blossom scenic spots are as follows: East China (33.33%), Southwest China (18.04%), Central China (16.08%), North China (13.33%), South China (10.20%), Northeast China (5.10%), and Northwest China (3.92%). East China has the highest number of cherry blossom scenic spots, while Northwest China has the fewest (Figure 3).
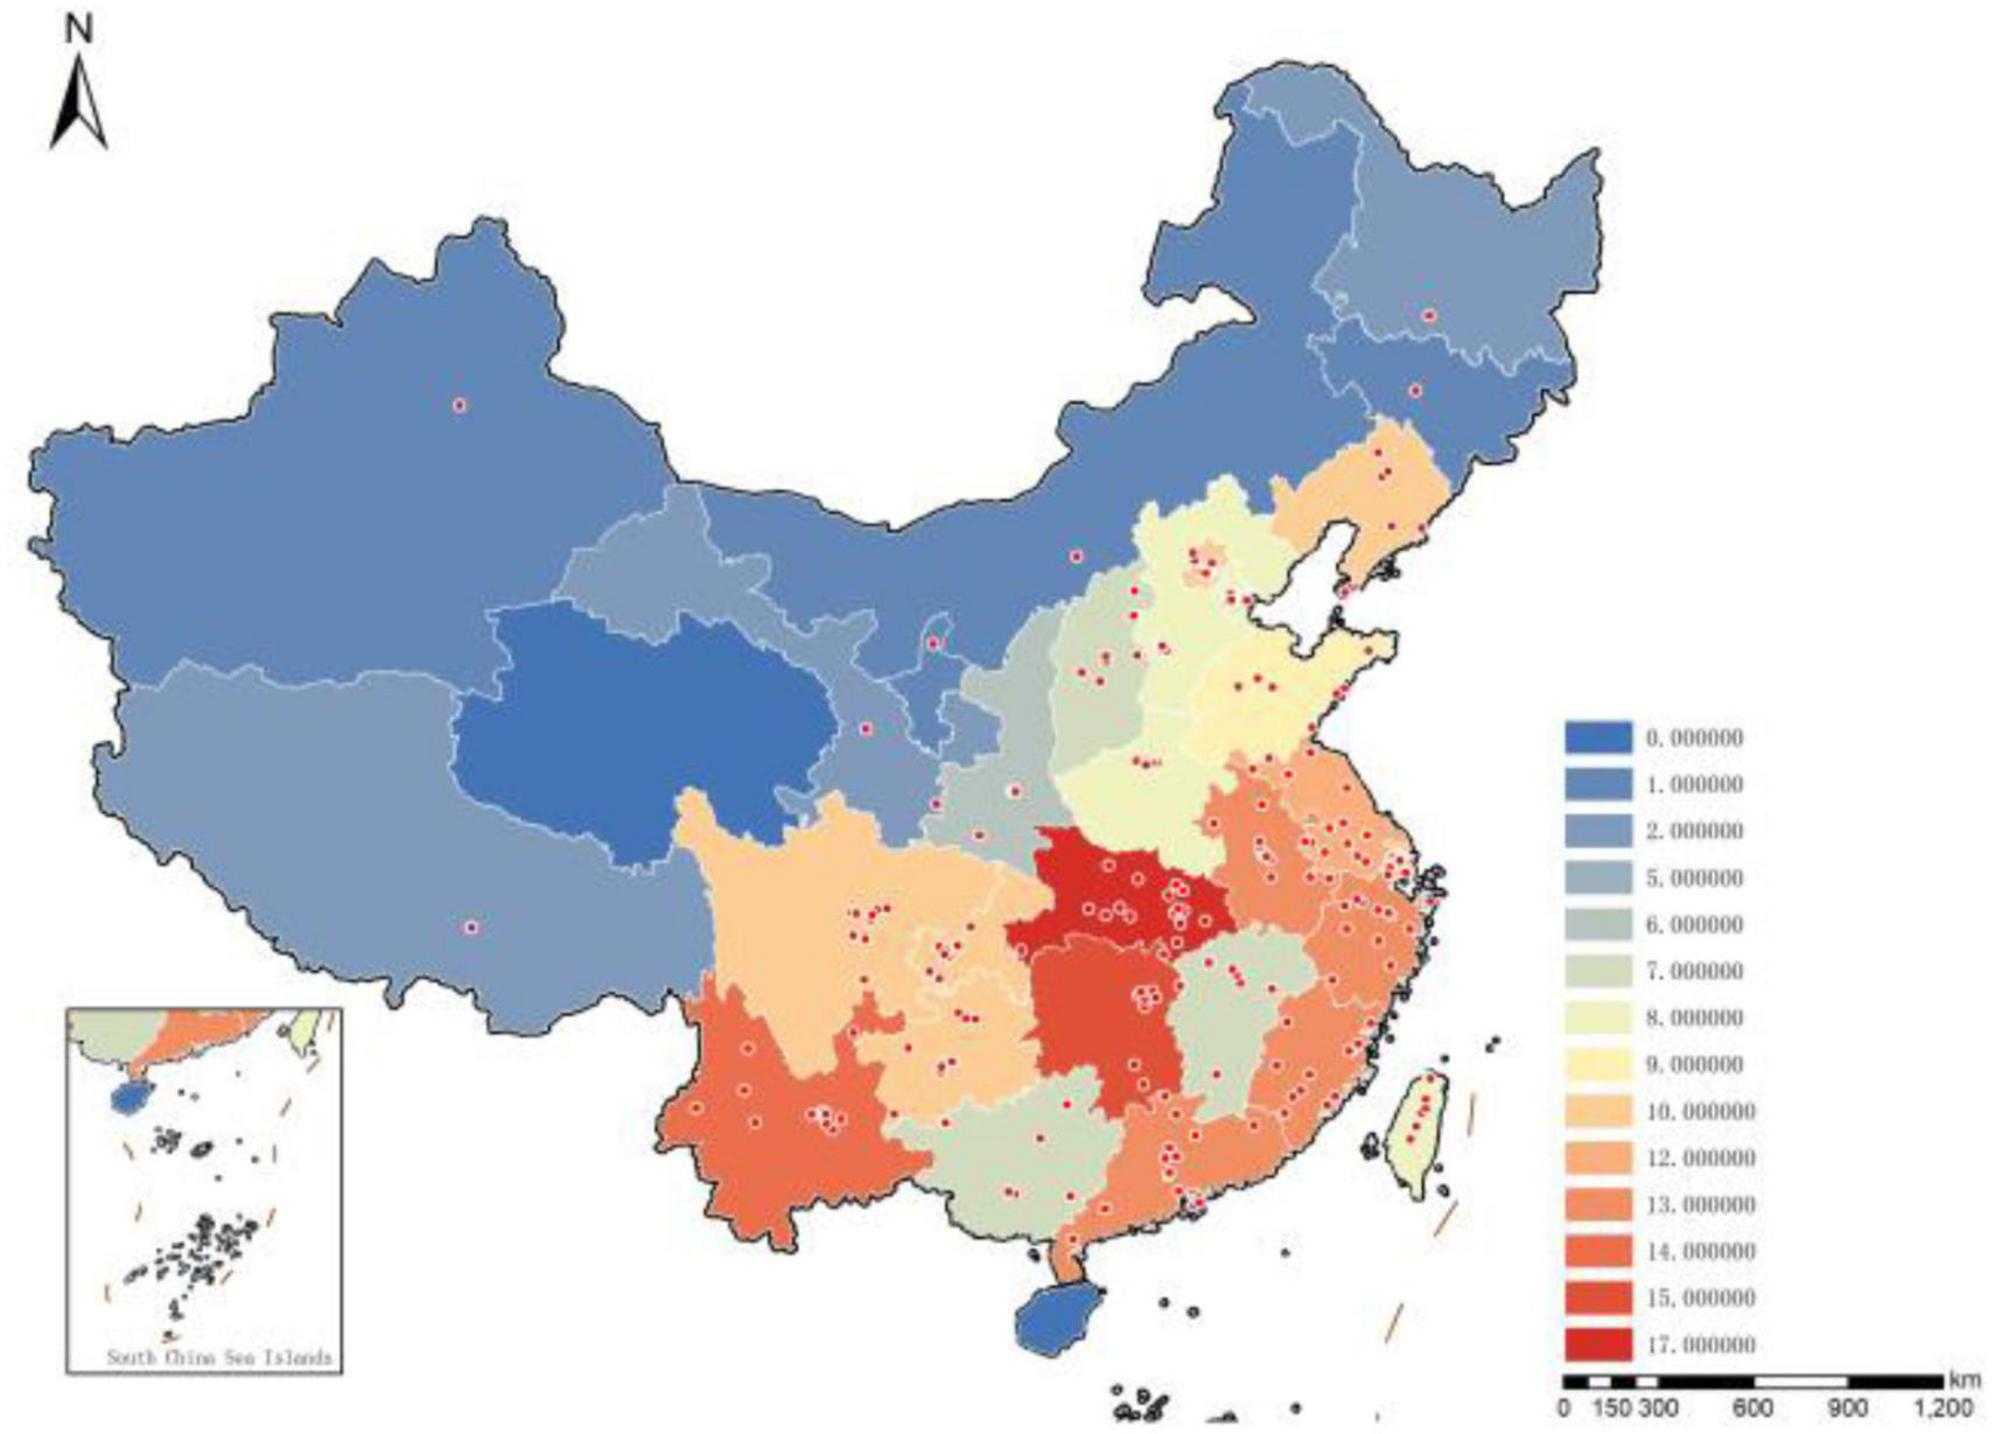
Figure 3. Distribution map of cherry blossom scenic spots in different provincial-level administrative regions.
From the perspective of China’s provinces, municipalities, and autonomous regions, all areas except Qinghai Province and Hainan Province have cherry blossom scenic spots. There are 13 provinces, municipalities, and autonomous regions with 10 or more cherry blossom scenic spots, with Hubei Province having the highest number at 17. Eighteen provinces, municipalities, and autonomous regions have fewer than 10 cherry blossom scenic spots.
3.2.1 Terrain and location analysis of different types of cherry blossom scenic spots
Based on the location and configuration of cherry blossom scenic spots, these sites in China can be categorized into five types: park landscape type, campus landscape type, agroforestry combination type, temple landscape type, and road landscape type. The park landscape type comprises a total of 194 spots, accounting for 76.1% of the total; the agroforestry combination type includes 28 spots, representing 10.9%; the campus landscape type has 16 spots, constituting 6.3%; the road landscape type consists of 13 spots, accounting for 5.1%; and the temple landscape type has 4 spots, accounting for 1.6% (Figure 4). The park landscape type is the most numerous and has the widest coverage, while the temple landscape type is the least numerous and has the narrowest coverage.

Figure 4. Proportion of different types of cherry blossom scenic spots.
The relationship between different types of cherry blossom scenic spots and terrain as well as location is illustrated in Figure 5. Figure 5a shows the relationship between the terrain where cherry blossom scenic spots are distributed and their locations, while Figure 5b reflects the relationship between different types of cherry blossom scenic spots, their locations, and terrain. In terms of the relationship between terrain and location, the distribution of terrain types from most to least is as follows: plains and mountains. The distribution of locations from most to least is: urban areas, suburban areas, and towns. The proportion of plains across different locations, from largest to smallest, is: urban areas, suburban areas, and towns; for mountains, the proportion across different locations is: suburban areas, towns, and urban areas. Regarding the relationship between different types of cherry blossom scenic spots, the proportions for park landscape type across different locations, from largest to smallest, are: urban areas, suburban areas, and towns, while the proportions across different terrain types are: plains and mountains. The agroforestry combination type has proportions across different locations from largest to smallest as follows: towns and suburban areas, and across different terrain types: mountains and plains. The campus landscape type has proportions across different locations from largest to smallest, as urban areas and suburban areas, with proportions across different terrain types as plains and mountains. The road landscape type has proportions across different locations from largest to smallest as urban areas, suburban areas, and towns, and across different terrain types as plains and mountains. The temple landscape type has equal proportions in urban, suburban, and town areas, with proportions across different terrain types from largest to smallest as: plains and mountains.
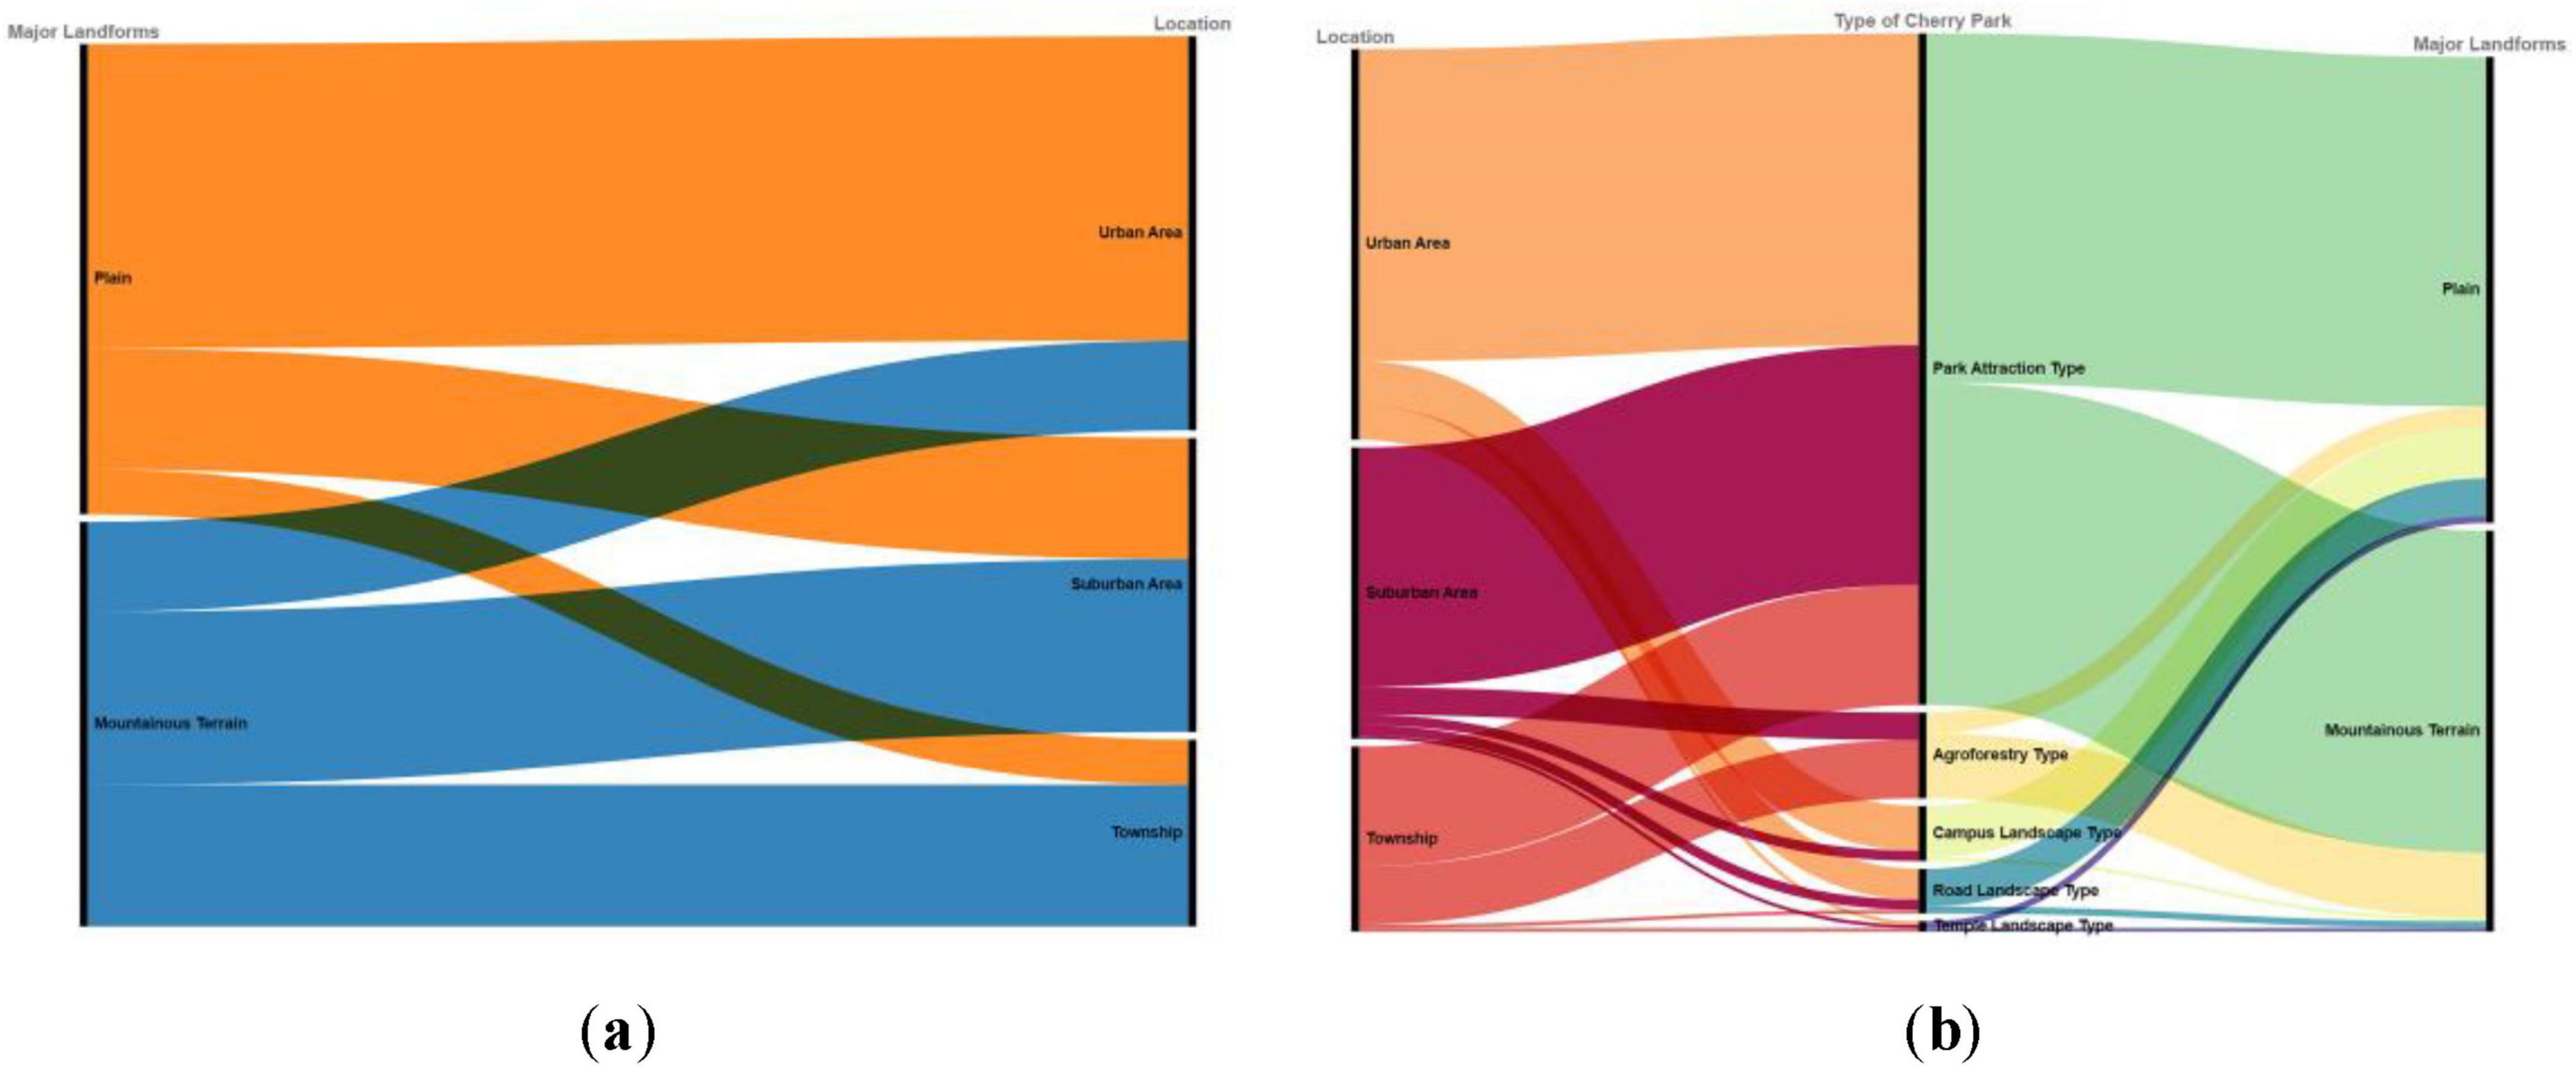
Figure 5. (a) Relationship between terrain types and locations of cherry blossom scenic spots. (b) Relationship among types of cherry blossom scenic spots, terrain, and location.
3.2.2 Spatial distribution characteristics of different cherry blossom species resources
Based on the classification methodology established in An Illustrated Monograph of Cherry Cultivars in China (Wang, 2014), the primary cultivated species (including varieties) and their flowering periods in cherry blossom scenic spots across different regions were systematically compiled (Table 2). The findings reveal notable differences in both dominant cherry blossom species and flowering periods across regions. In terms of species diversity, the North China, East China, and Central China regions exhibit a relatively greater richness compared to other areas (Figure 6a). Among these species, the Prunus × yedoensis has the broadest distribution, while the P. campanulata is more commonly found in the lower-latitude southern regions. It is evident that cherry blossom cultivation and management in China are highly region-specific rather than following a uniform nationwide model. Regarding flowering periods, the blooming occurs from January to May, with the peak in March and April. The flowering period is influenced by latitude, with higher latitudes generally experiencing later overall blooming times (Figure 6b).
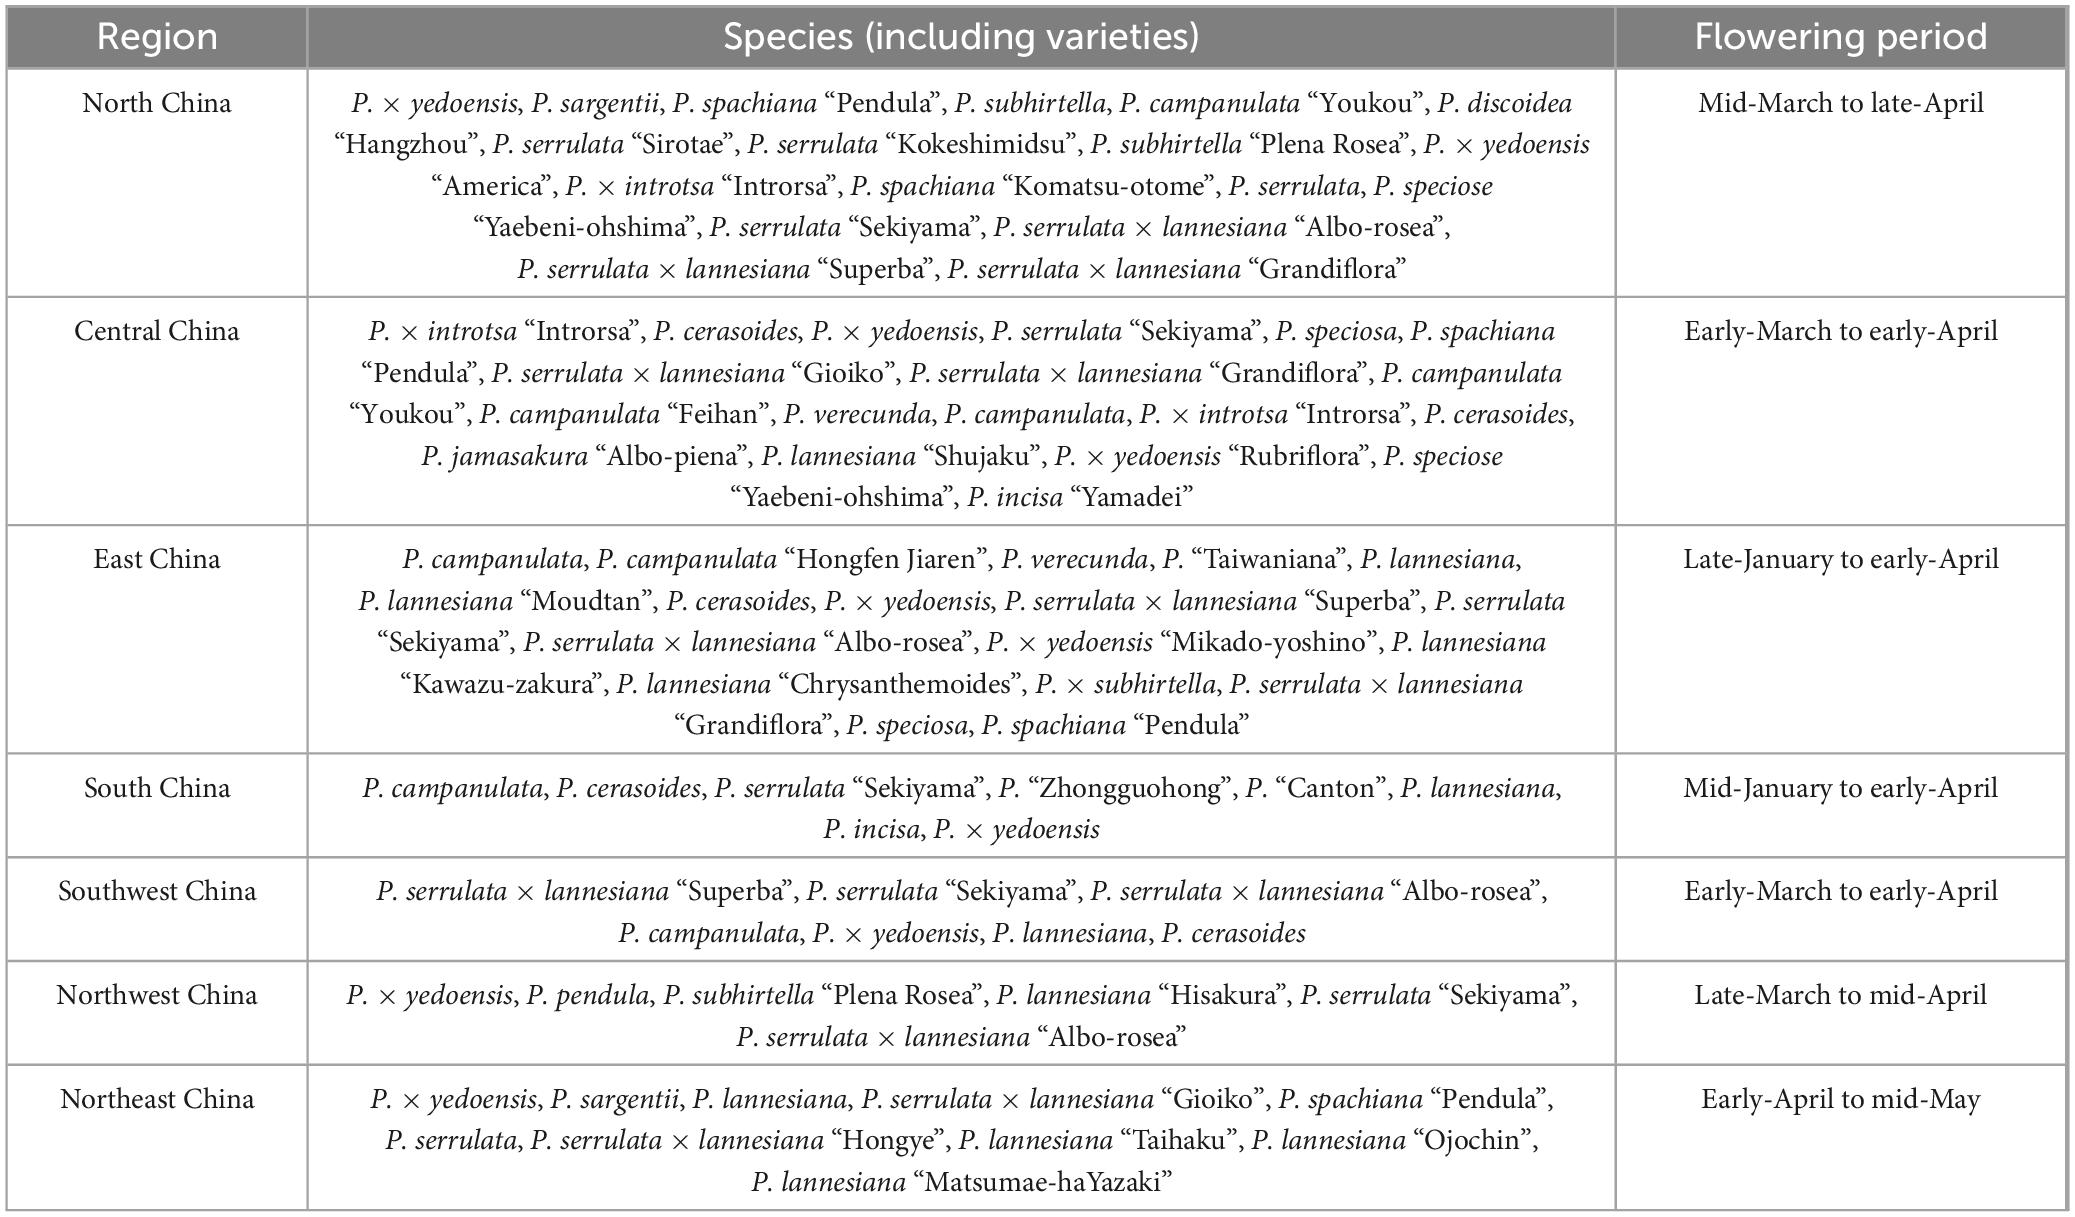
Table 2. Main cherry species and flowering periods of cherry blossom scenic spots in various regions of China.
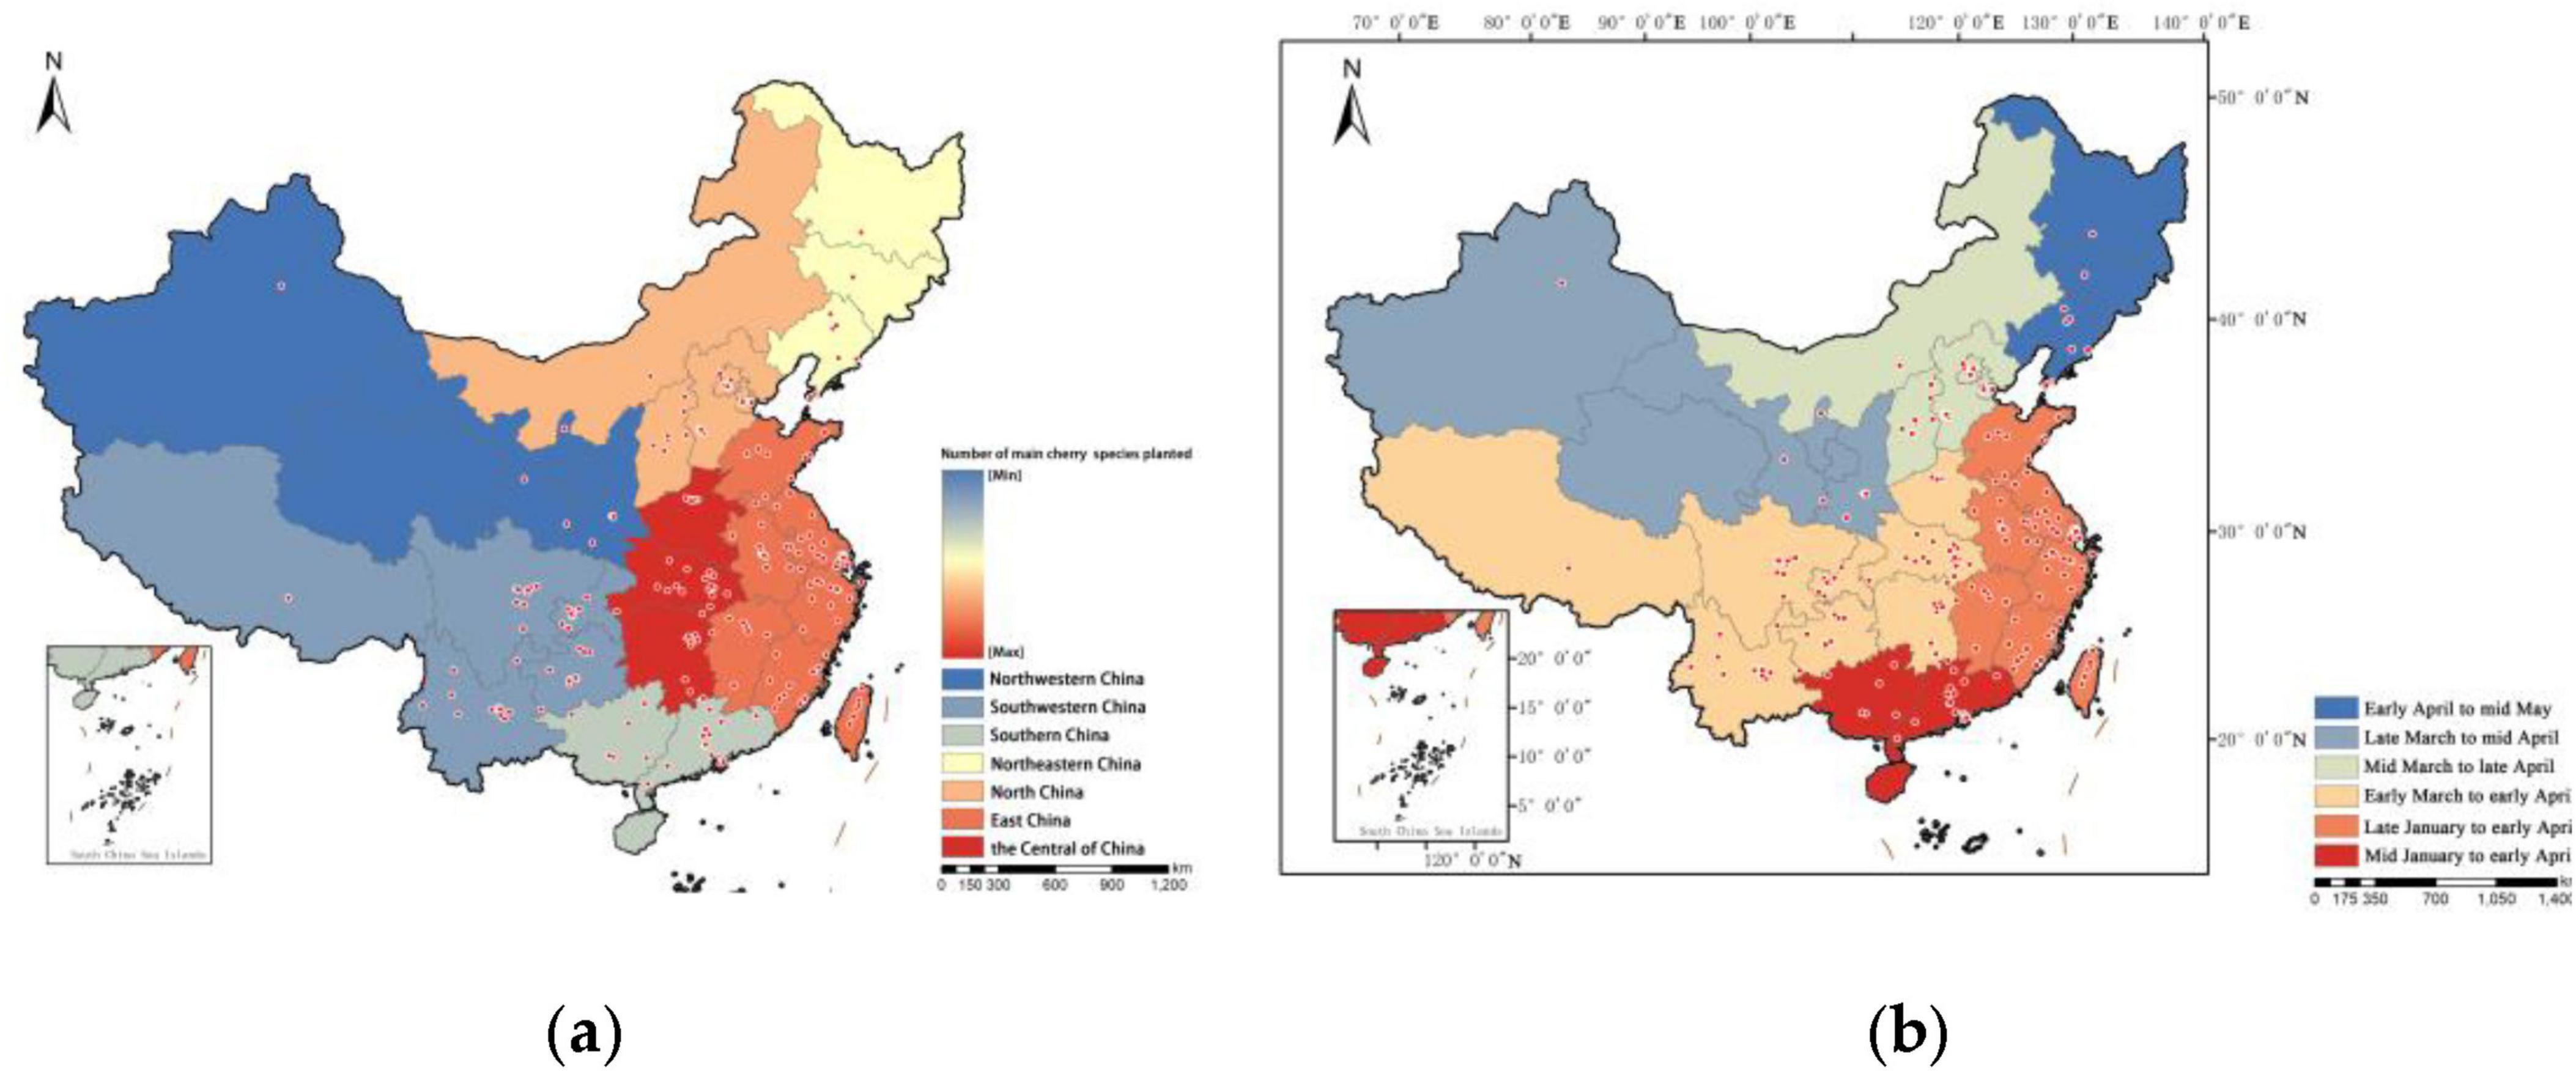
Figure 6. Spatial distribution characteristics of different cherry species resources. (a) Regional differences in cherry blossom species diversity. (b) Influence of latitude on cherry blossom flowering periods.
Furthermore, the distribution and growth characteristics of cherry biomes are significantly affected by climate extremes (Primack et al., 2009), including temperature fluctuations, unseasonal frost, heatwaves, droughts, and heavy rainfall. Late spring frosts in temperate regions can damage flower buds, leading to a reduced flowering rates and affecting pollination success. High temperatures during the pre-flowering phase may accelerate blooming, disrupting traditional flowering synchronization and shortening the ornamental period. Prolonged drought conditions can lead to water stress, reducing tree vigor and potentially influencing petal retention and overall bloom intensity. Conversely, excessive rainfall during peak flowering periods can cause petal shedding and increase the susceptibility to fungal infections, affecting both the aesthetic value and the long-term health of the trees. These climate extremes directly impact the ecological adaptability of cherry trees and determine their suitability for different cultivation regions.
In comparison to Japanese cherry varieties, Chinese cherry species exhibit certain ecological and phenological differences. While Prunus × yedoensis is widely cultivated in both China and Japan due to its strong ornamental appeal, the climatic conditions of different regions influence its adaptability. Japanese cherry varieties, particularly those native to temperate coastal climates, often thrive in stable temperature conditions with moderate precipitation (Tsutsumida and Funada, 2023). In contrast, Chinese cherry species, especially those cultivated in continental and subtropical regions, demonstrate greater adaptability to varying temperature extremes and seasonal precipitation fluctuations. Additionally, some Chinese varieties, such as P. campanulata, bloom earlier in warmer climates, while certain northern species have evolved mechanisms to resist late frosts. These differences highlight the need for region-specific cultivation strategies to optimize flowering performance and resilience under changing climatic conditions.
3.3 Migration direction and pattern evolution
Using the average tool in ArcGIS 10.8, the spatial distribution mean center of cherry blossom scenic spots in China at different time slices was calculated, and the movement trajectory of the mean center was plotted (Figure 7). From the founding of the People’s Republic of China to the end of the 1970s, the distribution mean center exhibited a clear trend of moving from northeast to southwest. From the early 1980s to the end of the twentieth century, the distribution mean center displayed a distinct trend of moving from southeast to northwest, with a movement distance similar to the previous period. From the beginning of the twenty-first century to the present, the distribution mean center showed a noticeable short-distance movement from northeast to southwest. Overall, the distribution mean center of cherry blossom scenic spots in China shows a broad trend of shifting from east to west, consistently located between 113.9°E to 116.7°E and 31.1°N to 31.8°N, which corresponds to the densely distributed area.
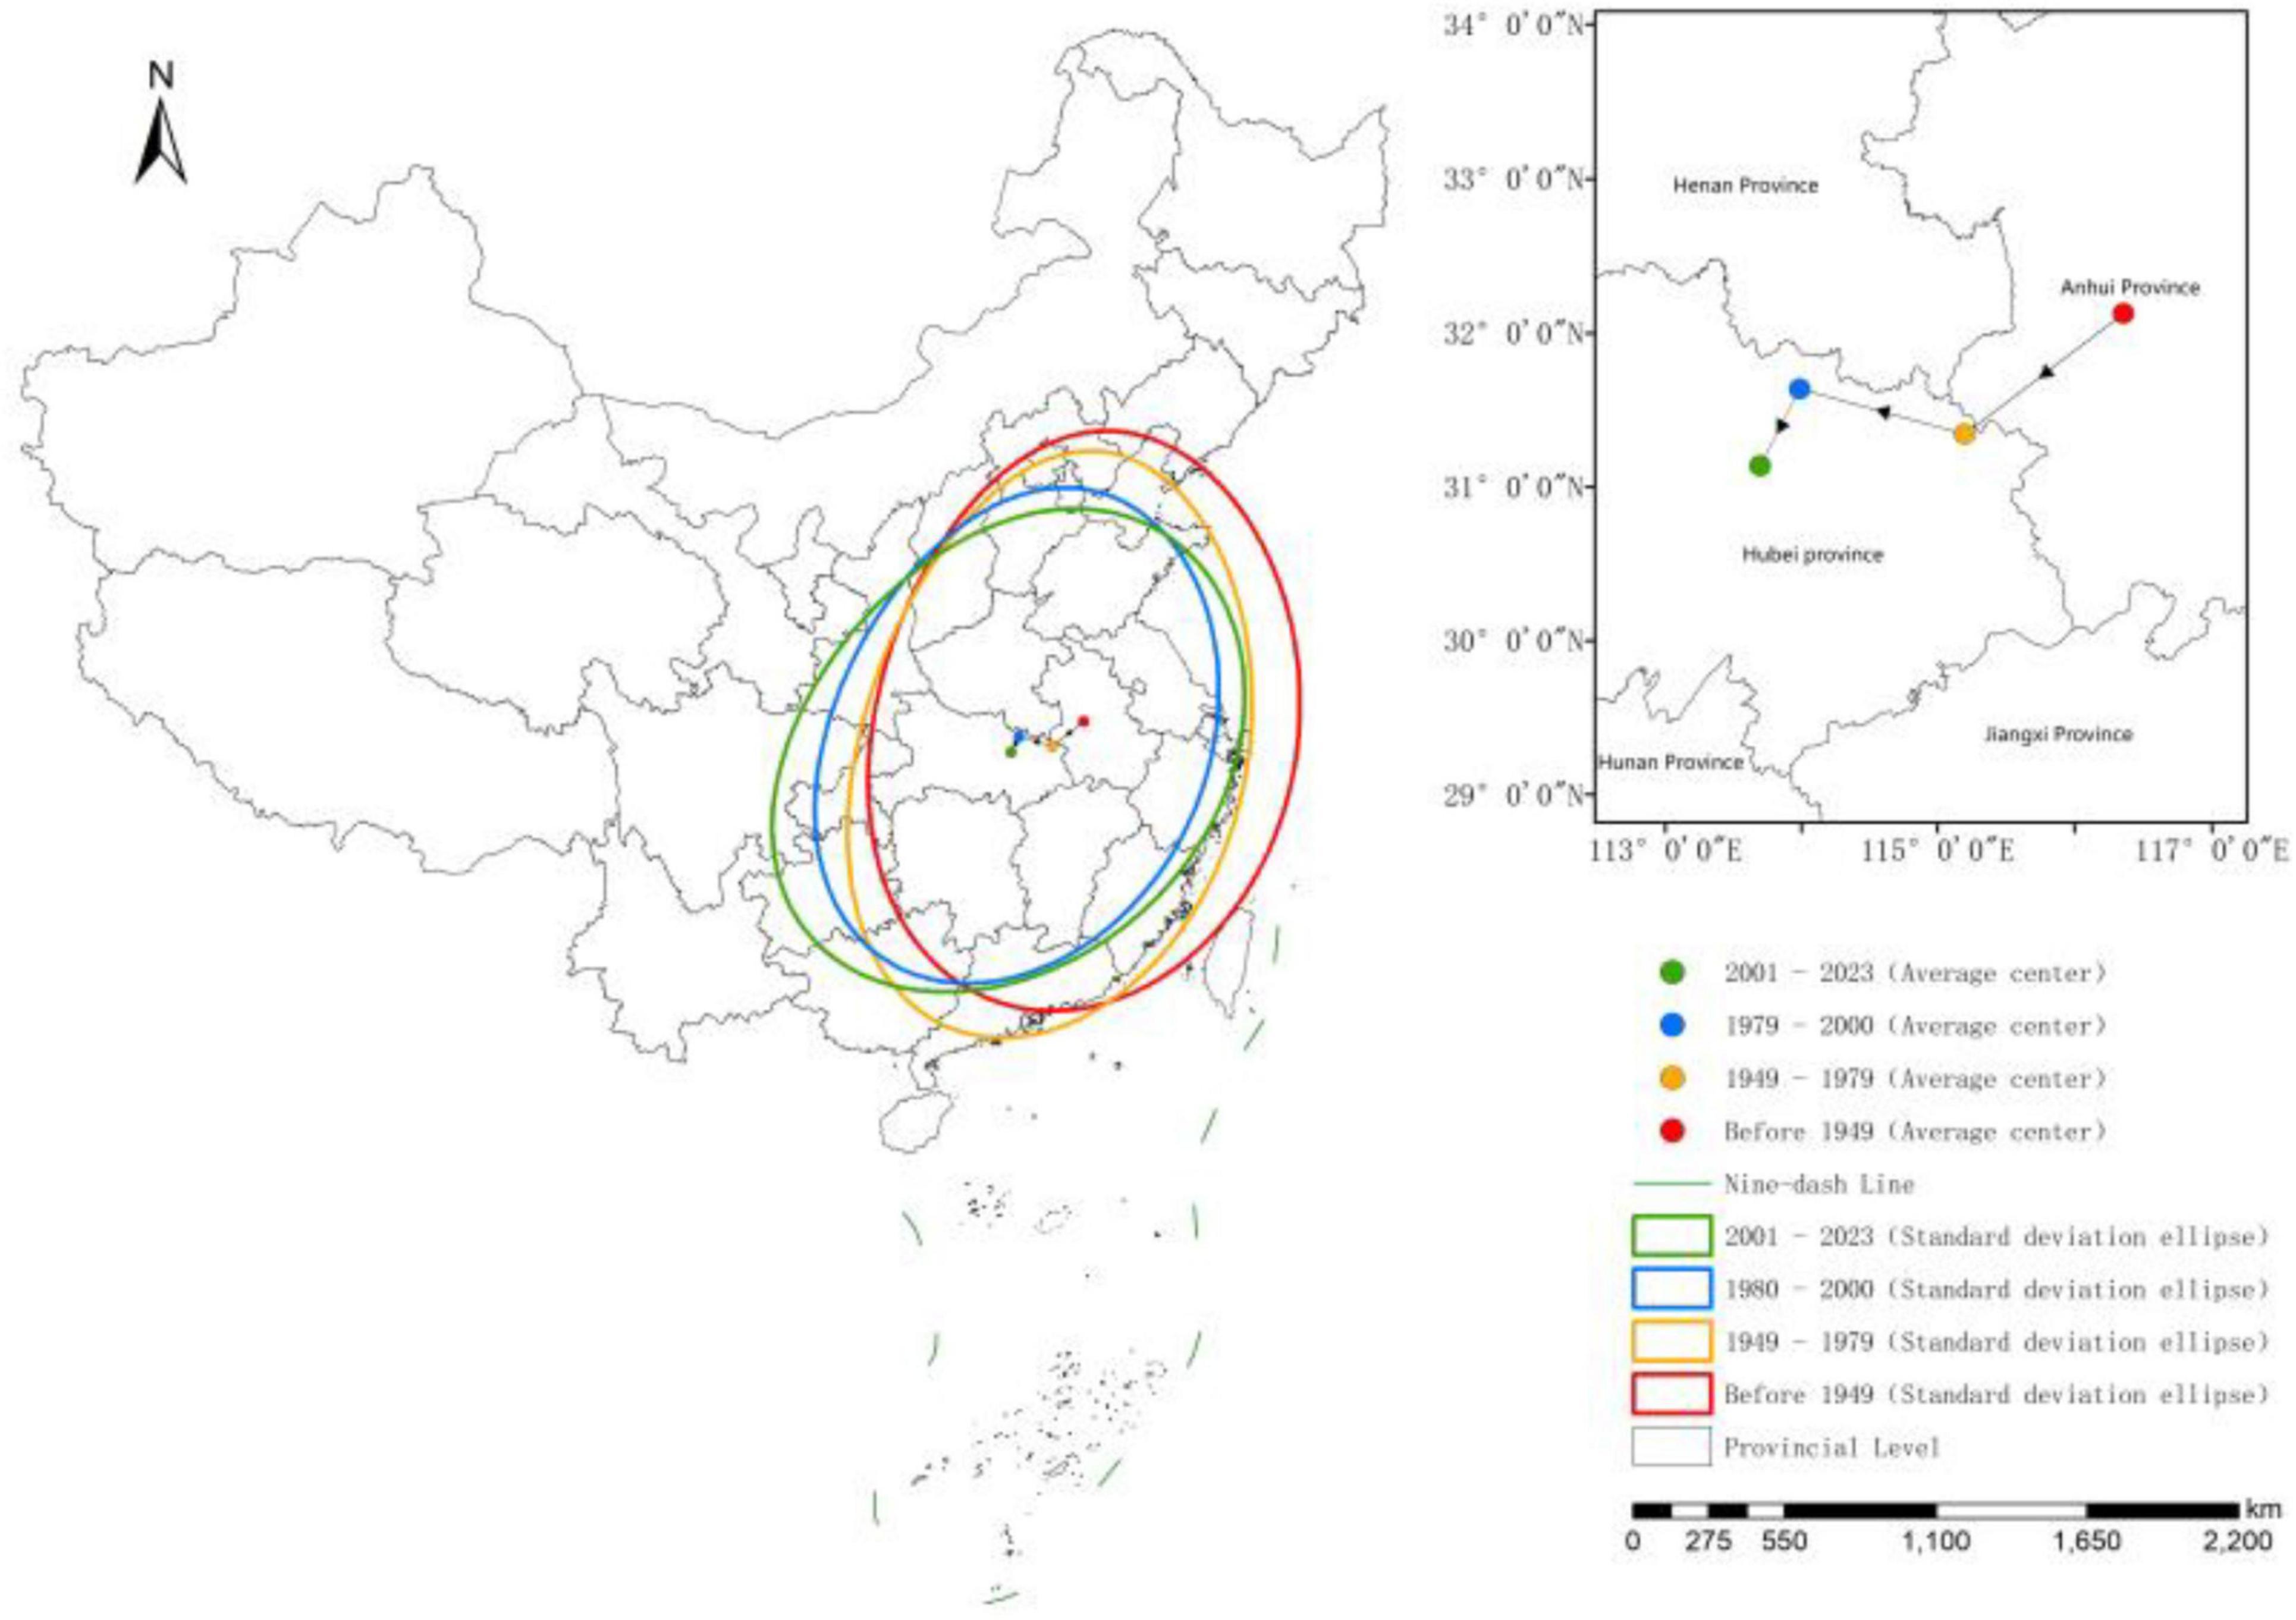
Figure 7. The shifting trajectory of the mean center and the standard deviational ellipse of cherry blossom scenic spots in China during different periods.
Using the directional distribution tool provided by ArcGIS 10.8, the standard deviational ellipses for different temporal cross-sections were plotted (Figure 7). The figure indicates that the standard deviational ellipses for the two periods defined from the pre-establishment era to the late 1970s exhibit minor fluctuations, maintaining a stable distribution oriented in the northeast-southwest direction. After the early 1980s, the standard deviational ellipses gradually rotated and expanded in a clockwise direction based on their original positions, with the ellipse center and axes lengths tending to stabilize. This suggests that the distribution pattern of cherry blossom scenic spots in China began to take shape from the early 1980s to the end of the twentieth century. From the early twenty first century to the present, the trend of clockwise rotation and expansion of the standard deviational ellipse has become more pronounced, indicating a further expansion of the distribution range of cherry blossom scenic spots in China.
3.4 Analysis of the influencing factors of cherry blossom scenic spots distribution characteristics
3.4.1 Selection of influencing factors
Based on the research findings of relevant scholars (Li et al., 2020; Wang and Li, 2022; Liu et al., 2023; Xinjian et al., 2023; Wang and Shi, 2022; Zhu et al., 2022) and the spatial matching characteristics of cherry blossom scenic spots in China, this study comprehensively considers data accessibility, relevance, and scientific validity. The kernel density stratification of cherry blossom scenic spots is used as the dependent variable, while three dimensions of influencing factors—natural geographic conditions, population conditions, and economic levels—are selected as independent variables to establish an indicator system (Table 3). The spatial distribution of cherry blossom scenic spots in China represents the significant combined effects of natural geographic conditions, population conditions, and economic levels.
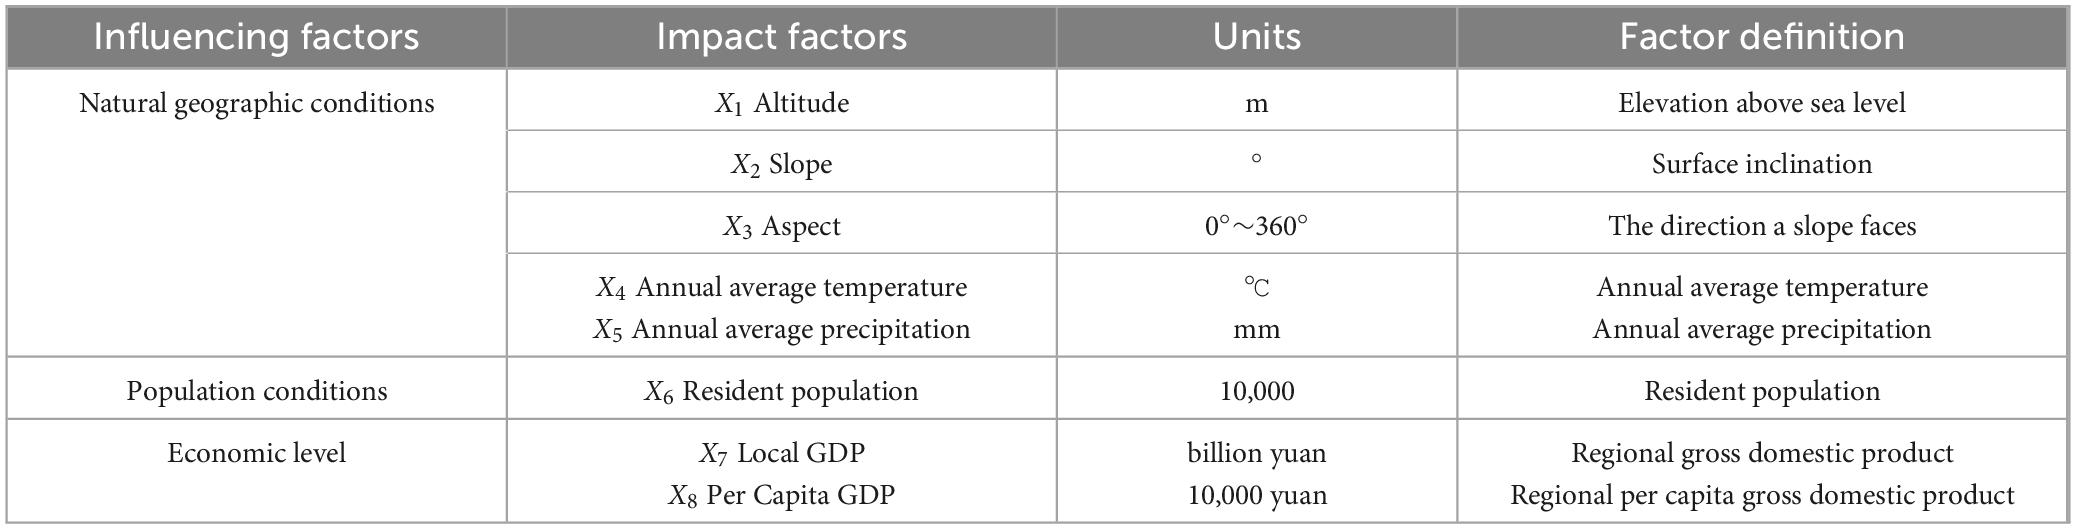
Table 3. Cherry blossom scenic spots spatial distribution influencing factors.
3.4.2 Single factor analysis
The influencing factors were imported into the geographic detector model to obtain the impact values of each influencing factor on the spatial distribution of cherry blossom scenic spots in China. The results indicated that the influencing factors affecting the spatial distribution pattern of cherry blossom scenic spots in China ranked as follows: X8 > X7 > X4 > X5 > X6 > X3 > X2 > X1, with the exception of X1, X2, and X3, all of which passed the 1% significance test (Table 4). Overall, the economic level factor plays a dominant role in the spatial distribution pattern of cherry blossom scenic spots in China. Among natural geographic conditions, temperature and precipitation have significant effects, while the impact of population conditions is relatively weaker compared to the other two categories of factors.
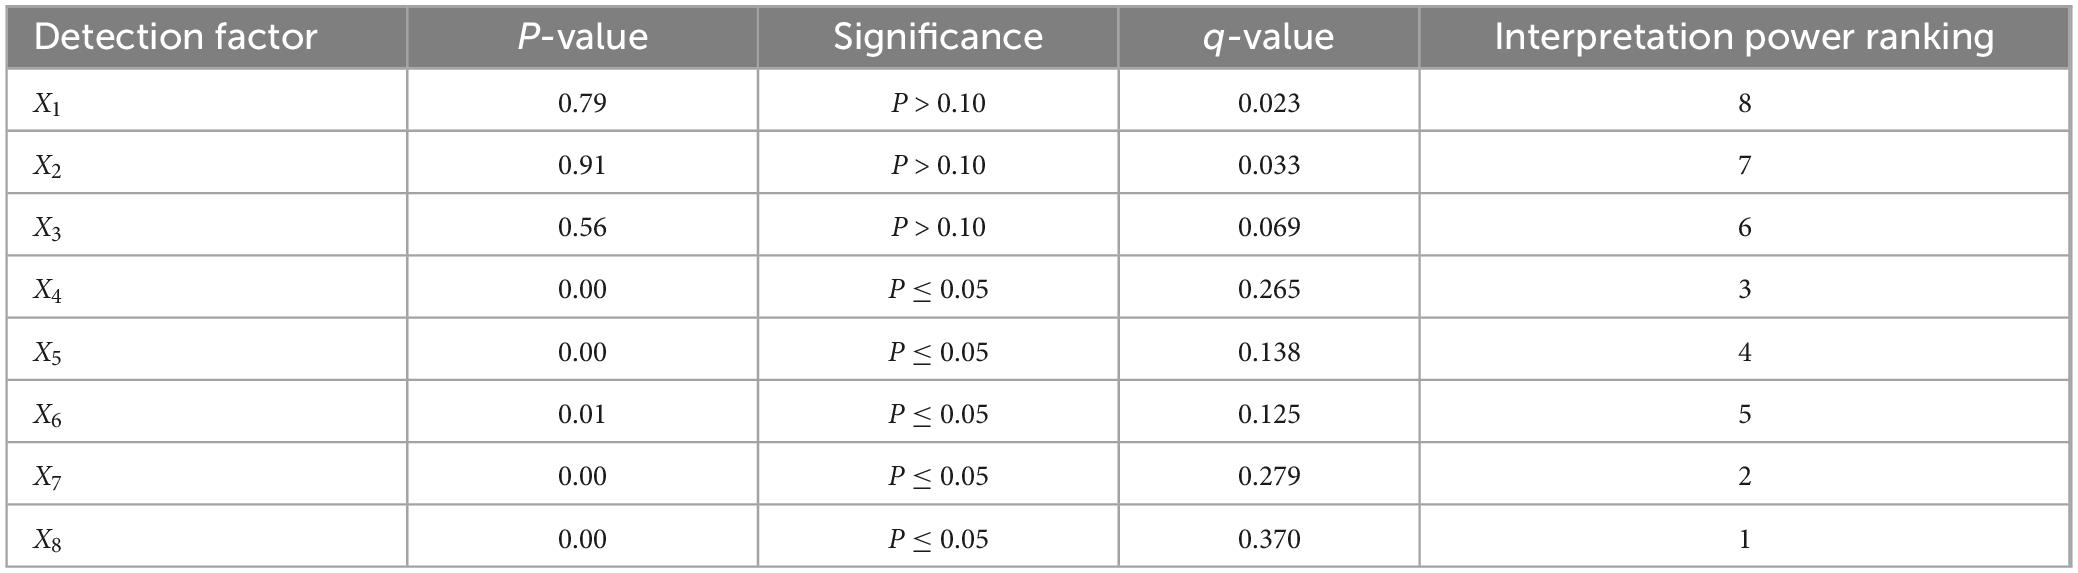
Table 4. Influencing factor detection results.
3.4.2.1 Natural geographic conditions
Natural geographic conditions are fundamental factors influencing the distribution of cherry blossom scenic spots (Guoqing et al., 2023; Tian et al., 2023).
By integrating Digital Elevation Model (DEM) data analysis, it was found that the elevation range of cherry blossom scenic spots in China spans from −3 to 3,655 m (Figure 8), with an average elevation of 438 m. Among these, 151 sites are located within the low-altitude range of −3 to 231 m, accounting for approximately 60% of the total. This distribution indicates that cherry blossom scenic spots in China are primarily concentrated in low to mid-altitude plains and hilly areas.
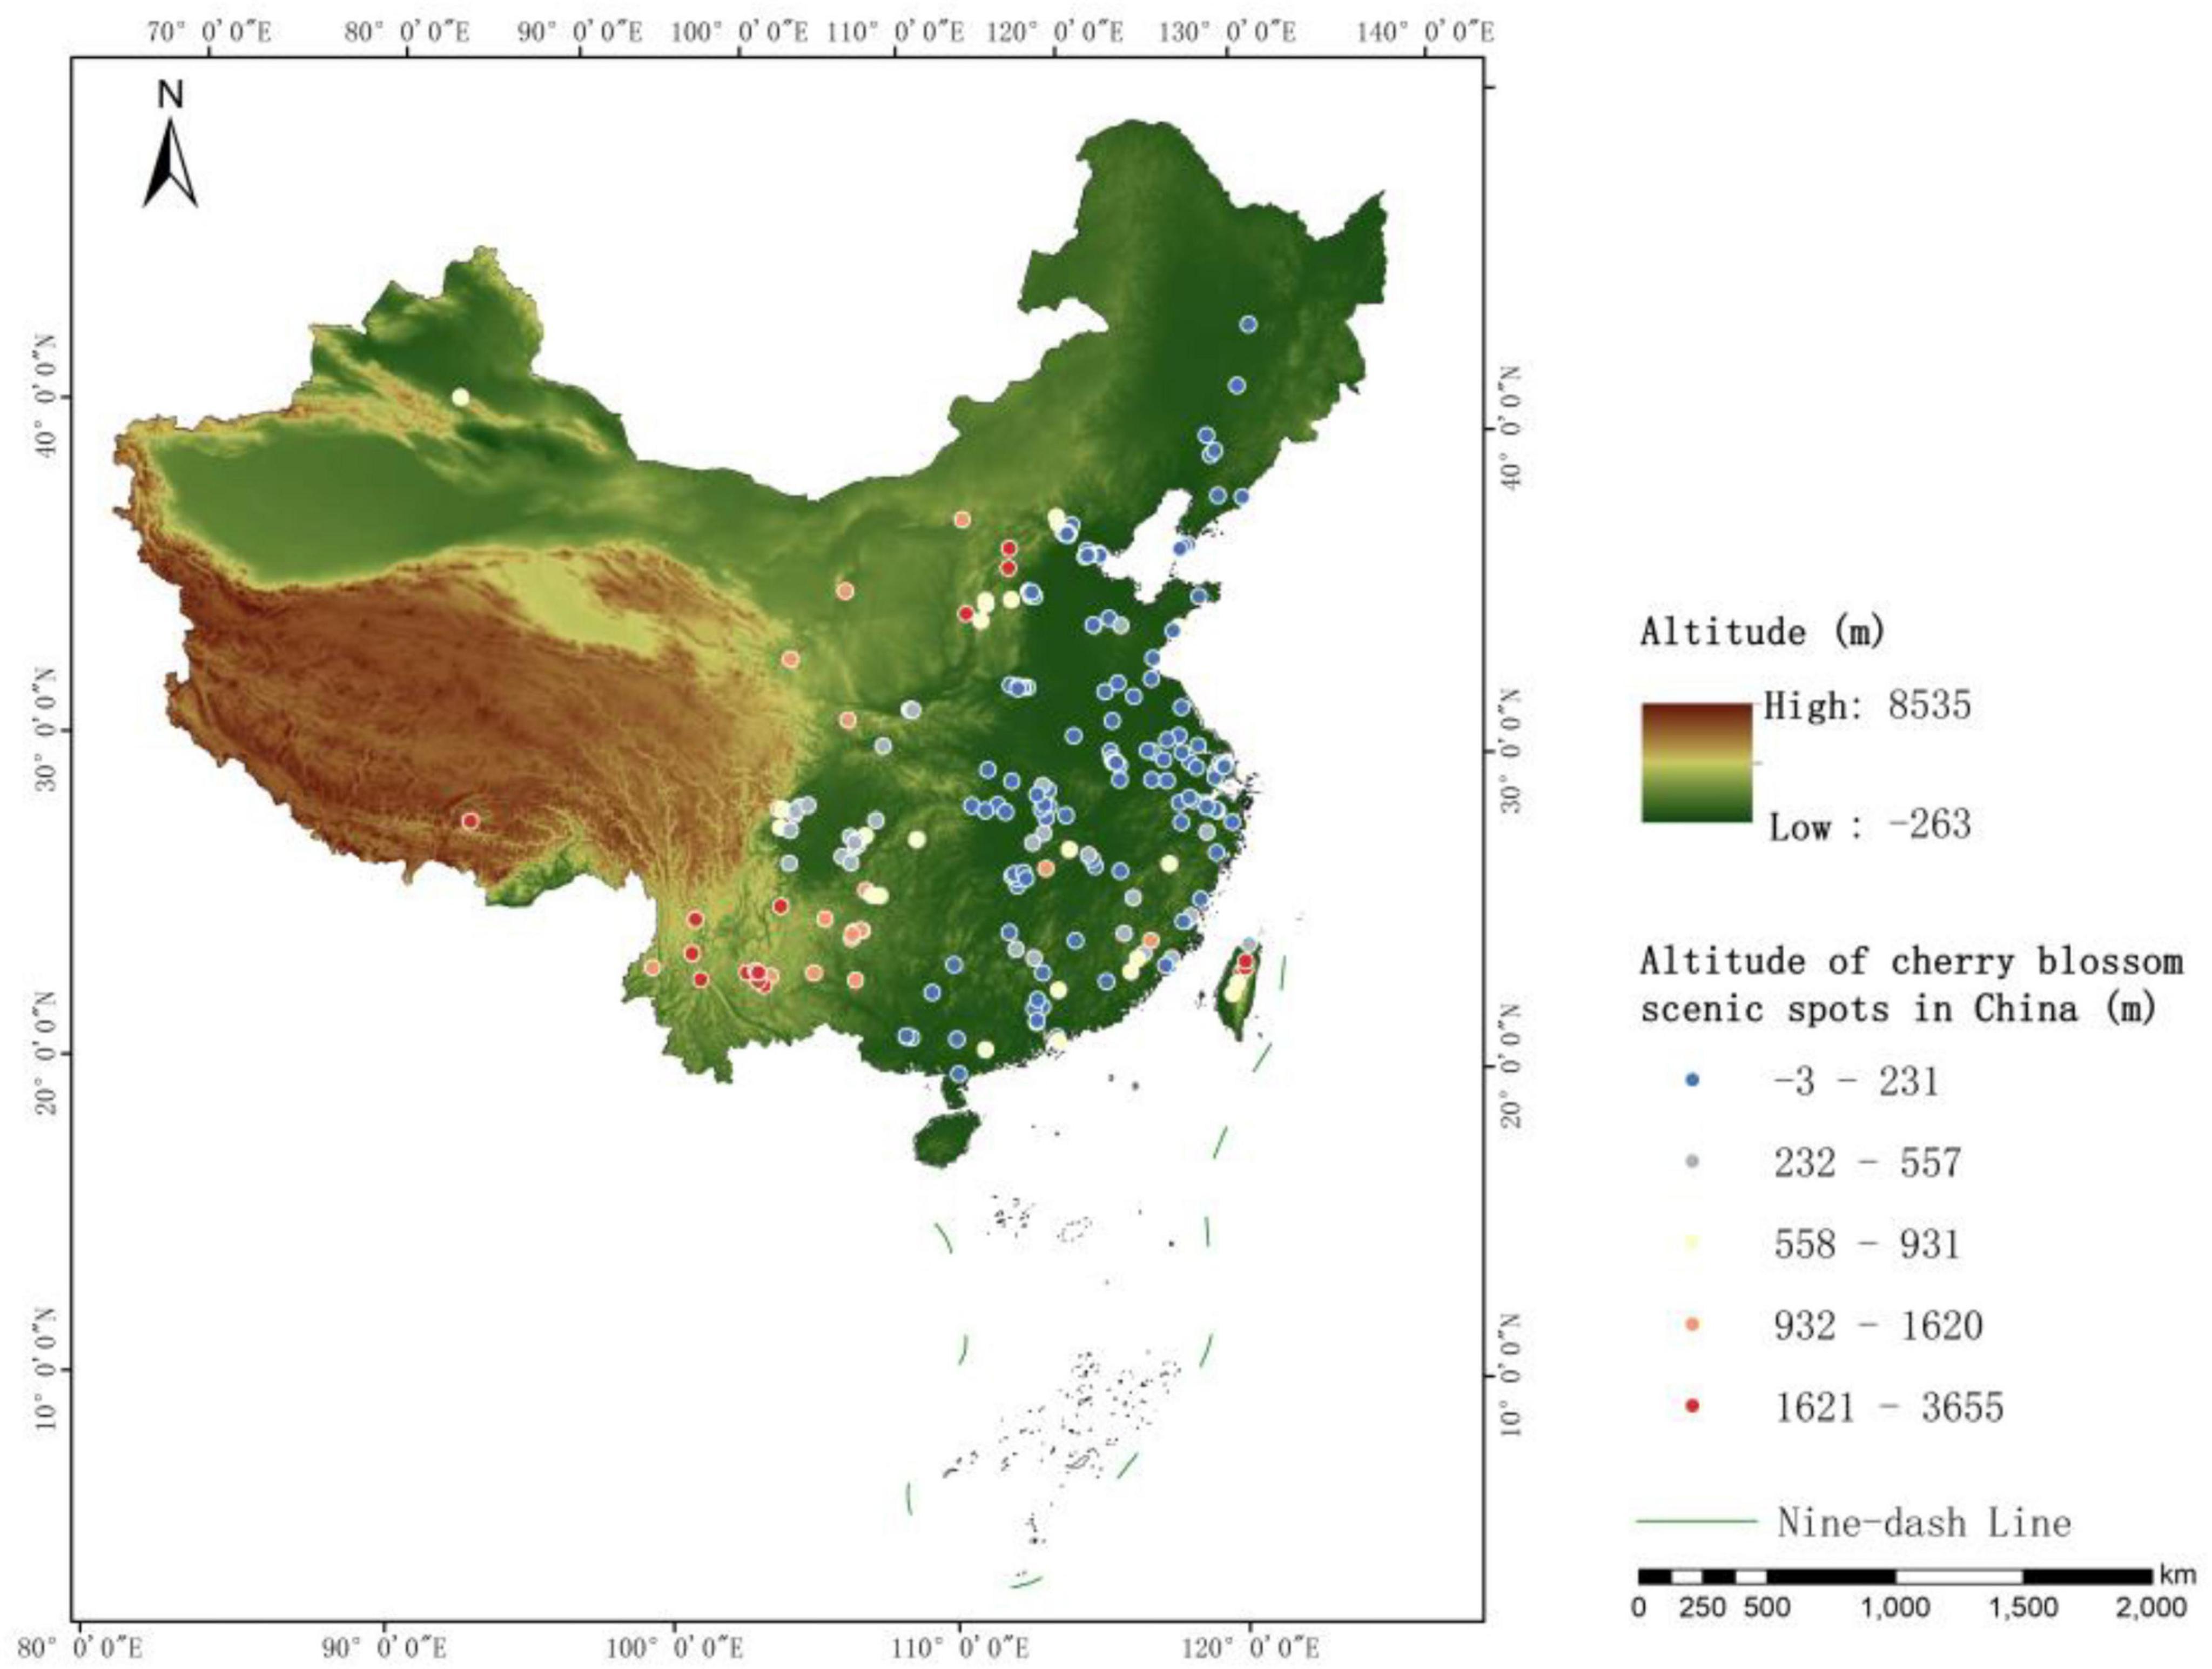
Figure 8. Bar chart of the distribution of cherry blossom scenic spot quantities under different climate conditions.
According to the classification of slope gradients established by the International Geographical Union Commission on Geomorphological Survey and Mapping, slopes are categorized into seven types based on their angles: flat, gently sloping, moderately sloping, sloping, steep, very steep, and vertical cliffs (Li et al., 2017). The slope range of cherry blossom scenic spots in China varies from 0° to 33.59° (Figure 9a), with 169 sites distributed within the 0°∼ 3° range, accounting for approximately 67% of the total. This suggests that cherry blossom scenic spots in China are predominantly located in flat and gently sloping areas.
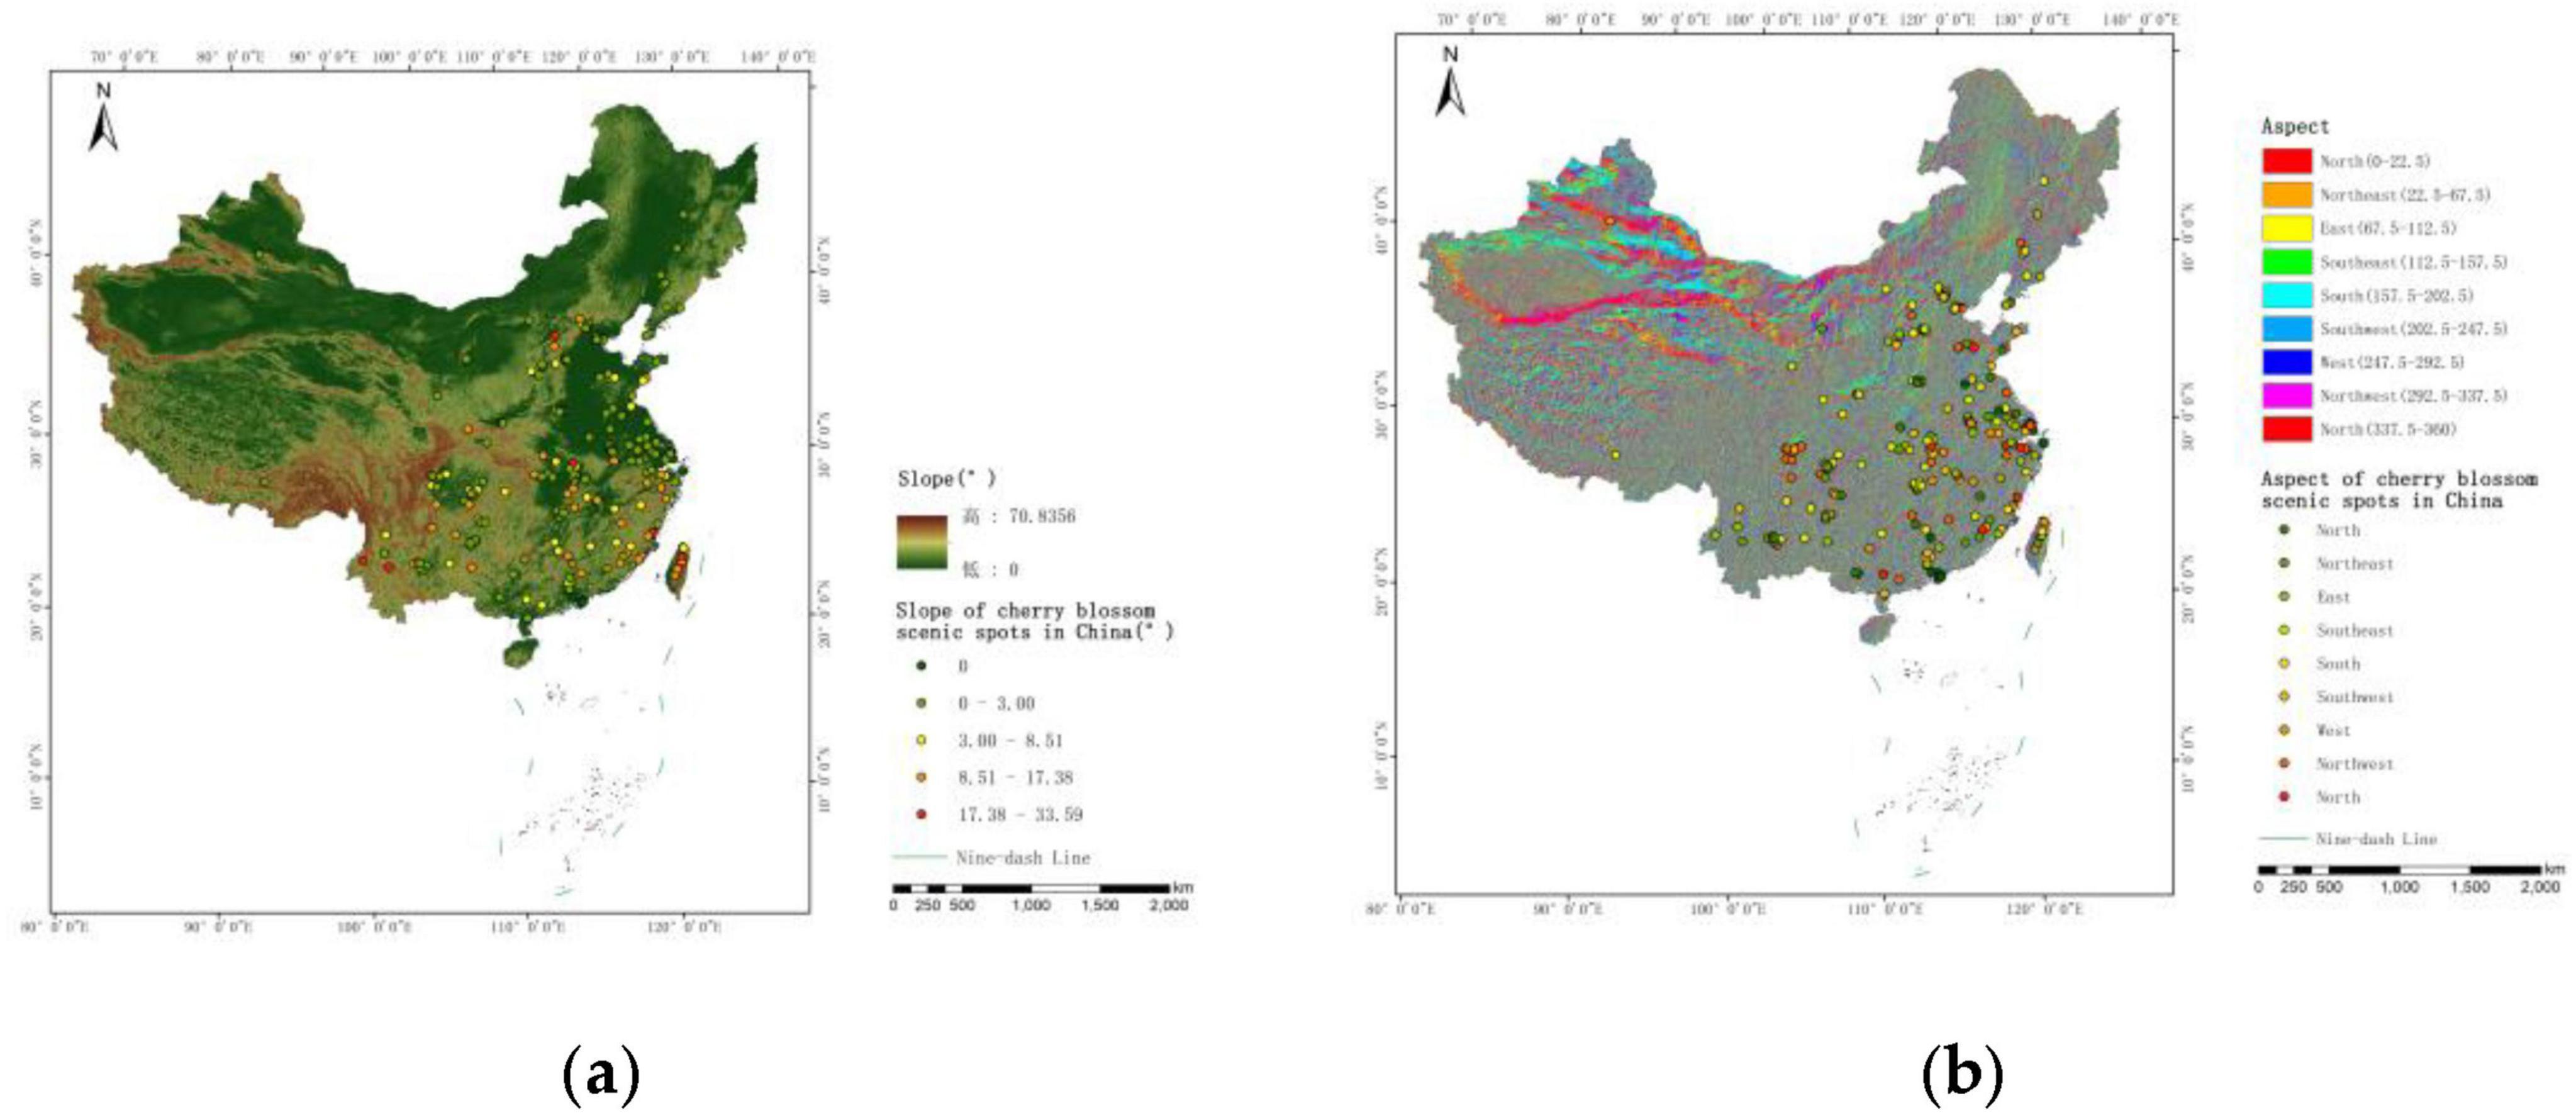
Figure 9. Bar chart of the distribution of cherry blossom scenic spot quantities under different climate conditions. (a) Slope range of cherry blossom scenic spots in China. (b) Distribution of cherry blossom scenic spots across different slope aspects.
Slope aspect influences solar radiation duration and angle, thereby affecting temperature and precipitation. It is also a crucial factor influencing plant growth and human settlement environments (Liu et al., 2022). As shown in Figure 9b, the distribution of cherry blossom scenic spots across different slope aspects is relatively balanced. However, considering terrain trends, the highest number of sites are found on south-facing (37 sites), southeast-facing (33 sites), and southwest-facing slopes (32 sites), whereas north-facing slopes have the fewest sites. The relatively even distribution of sites suggests that cherry blossom scenic spots in the study area exhibit broad spatial adaptability to diverse environmental conditions. Among these, south-facing slopes provide more favorable conditions for cherry blossom growth due to higher solar radiation, optimal temperature and humidity, and wind sheltering effects, making them the predominant aspect for cherry blossom scenic spot distribution in China.
Through statistical analysis, it has been determined that cherry blossom scenic spots in China are distributed across 29 different climate types. According to climate type (Figure 10), the top three climate types for the distribution of cherry blossom scenic spots in China are: subtropical monsoon climate (97 spots), subtropical monsoon humid climate (34 spots), and temperate monsoon climate (25 spots). The number of cherry blossom scenic spots located in subtropical monsoon climates accounts for approximately 38.3% of the total, representing the largest proportion. The annual average temperature and precipitation in these areas closely match the growth requirements of cherry blossoms, indicating that the subtropical monsoon climate is conducive to cherry blossom growth and beneficial for the establishment of cherry blossom scenic spots.
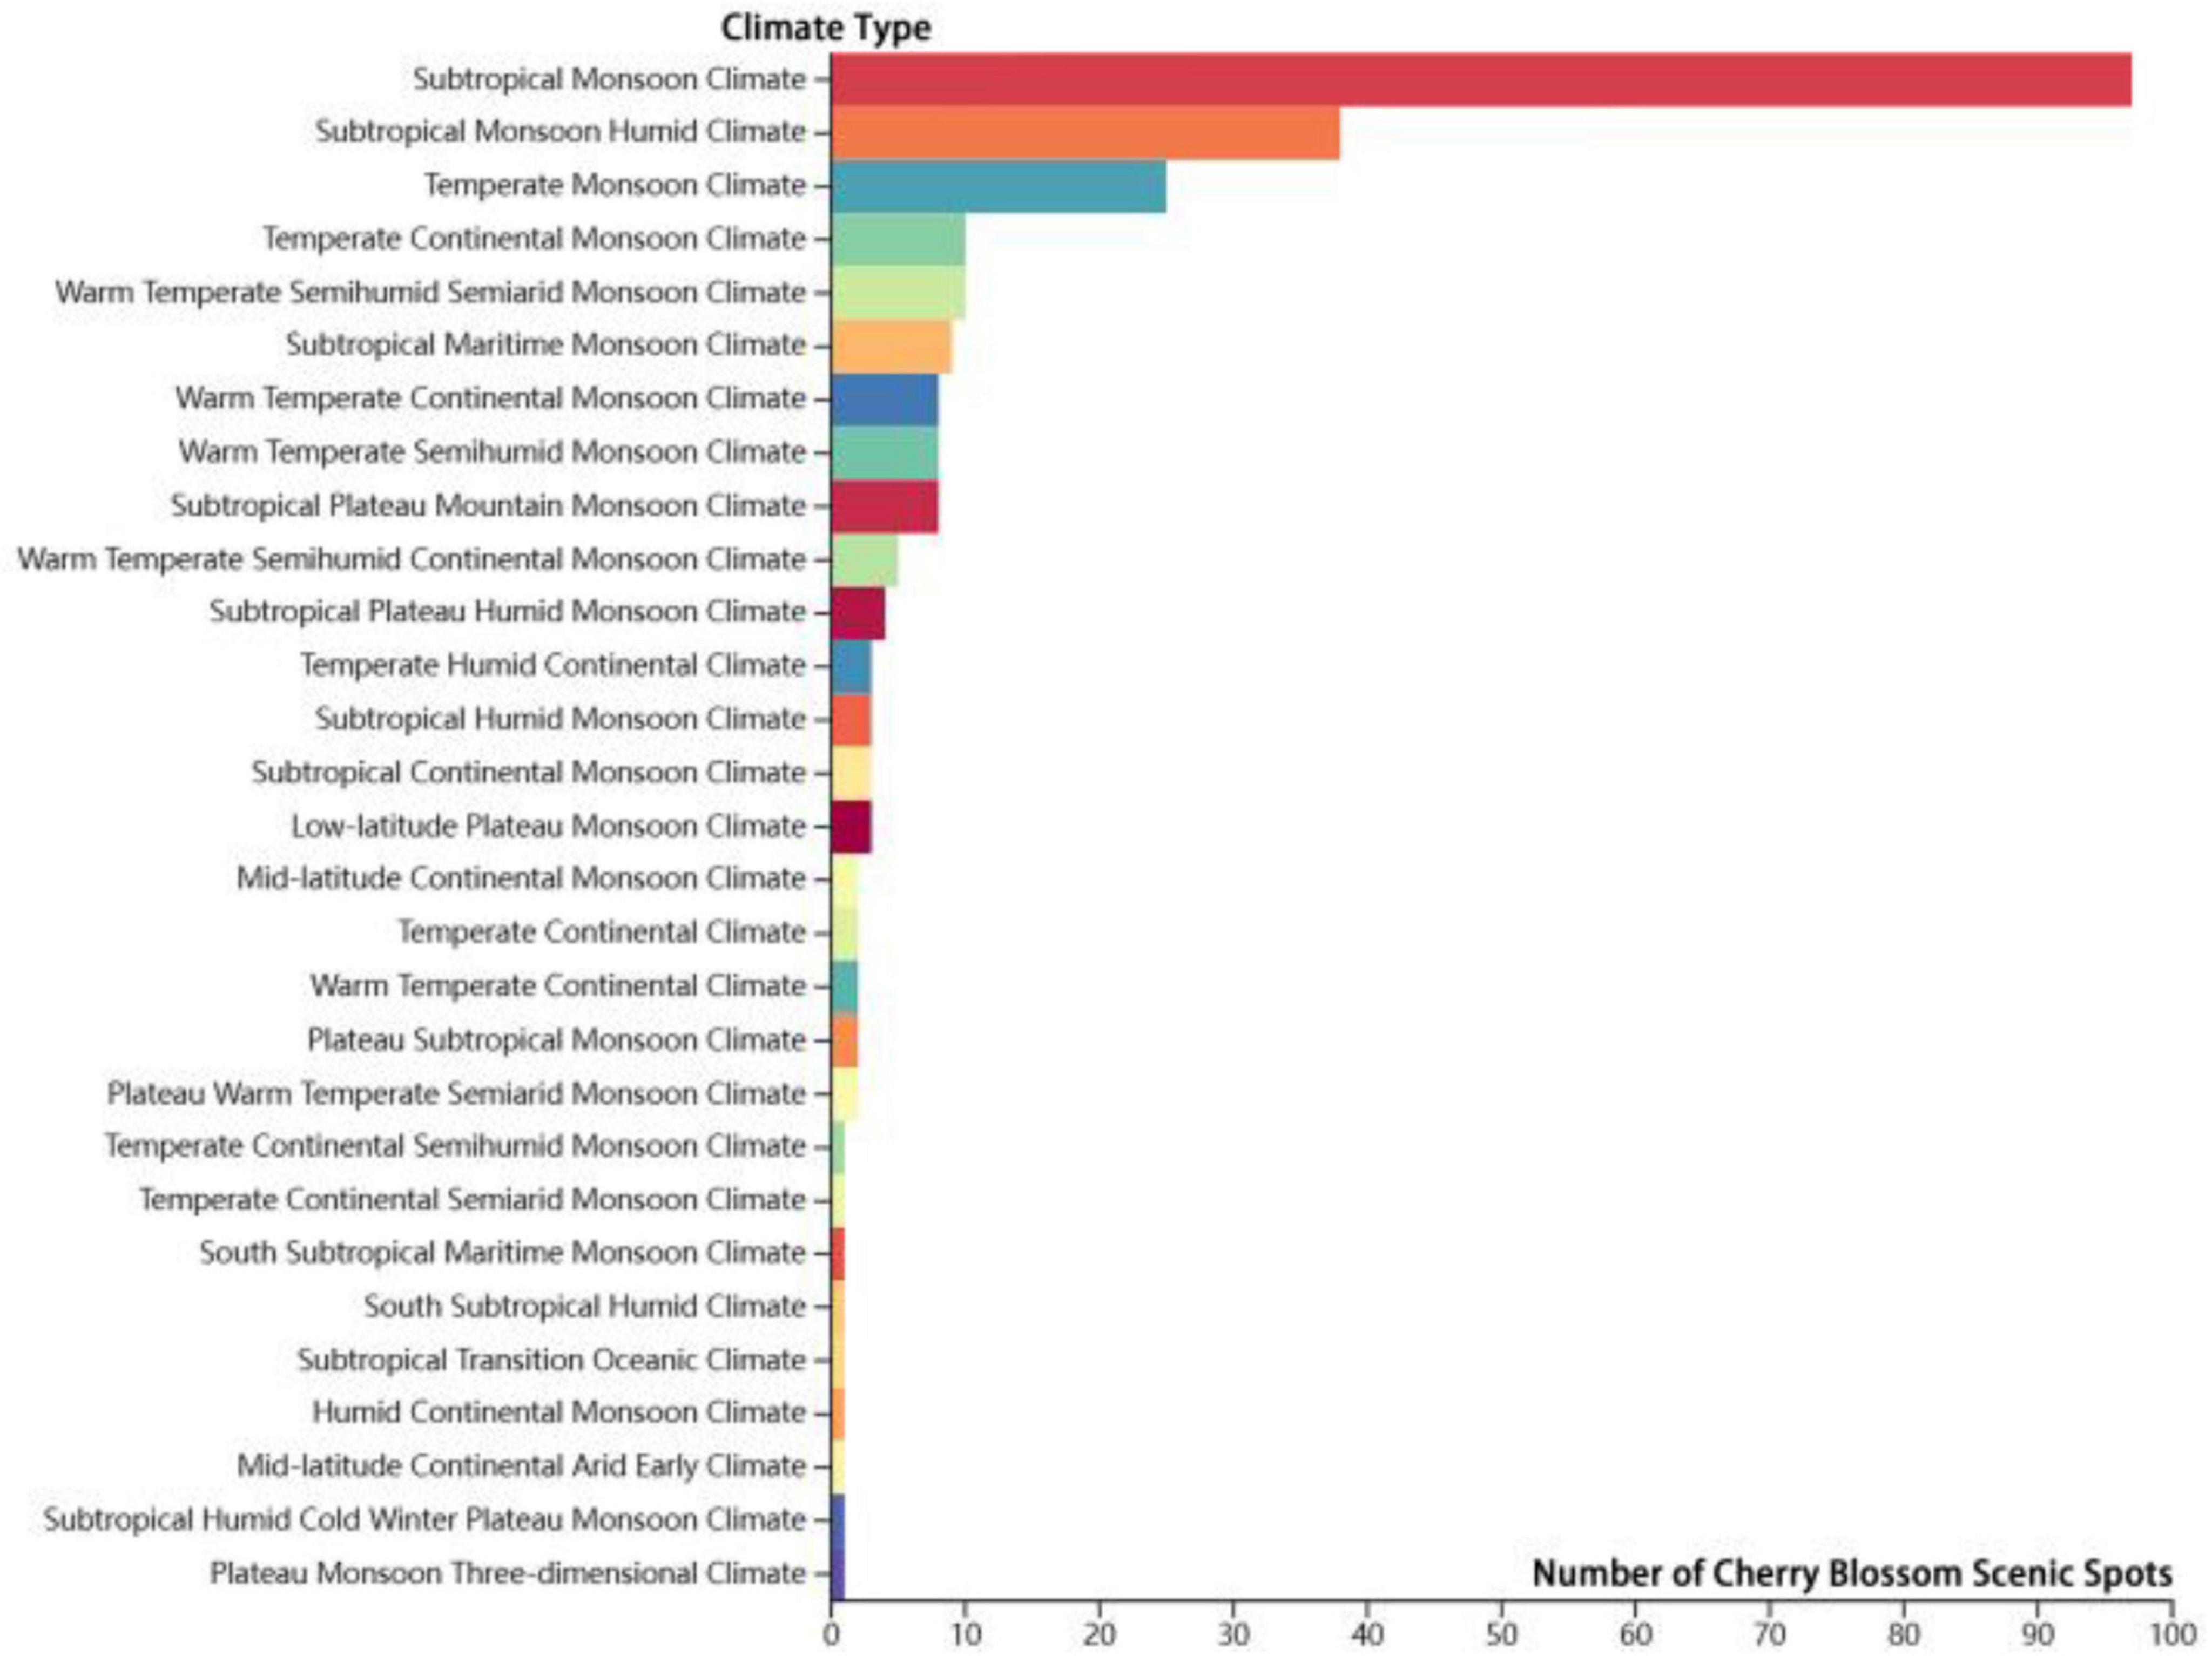
Figure 10. Bar chart of the distribution of cherry blossom scenic spot quantities under different climate conditions.
Temperature and precipitation are strong influencing factors for the spatial distribution of cherry blossom scenic spots in China, with q-values of 0.265 and 0.138, respectively. Regarding the annual average temperature (Figure 11a), the distribution of cherry blossom scenic spots falls between 3.8 and 25.8°C. The top three climate types—subtropical monsoon climate, subtropical monsoon humid climate, and temperate monsoon climate—exhibit annual average temperatures of 18–20, 14–16, and 12–14°C, respectively, indicating that cherry blossom scenic spots are predominantly found in areas where the annual average temperature ranges from 12 to 20°C.
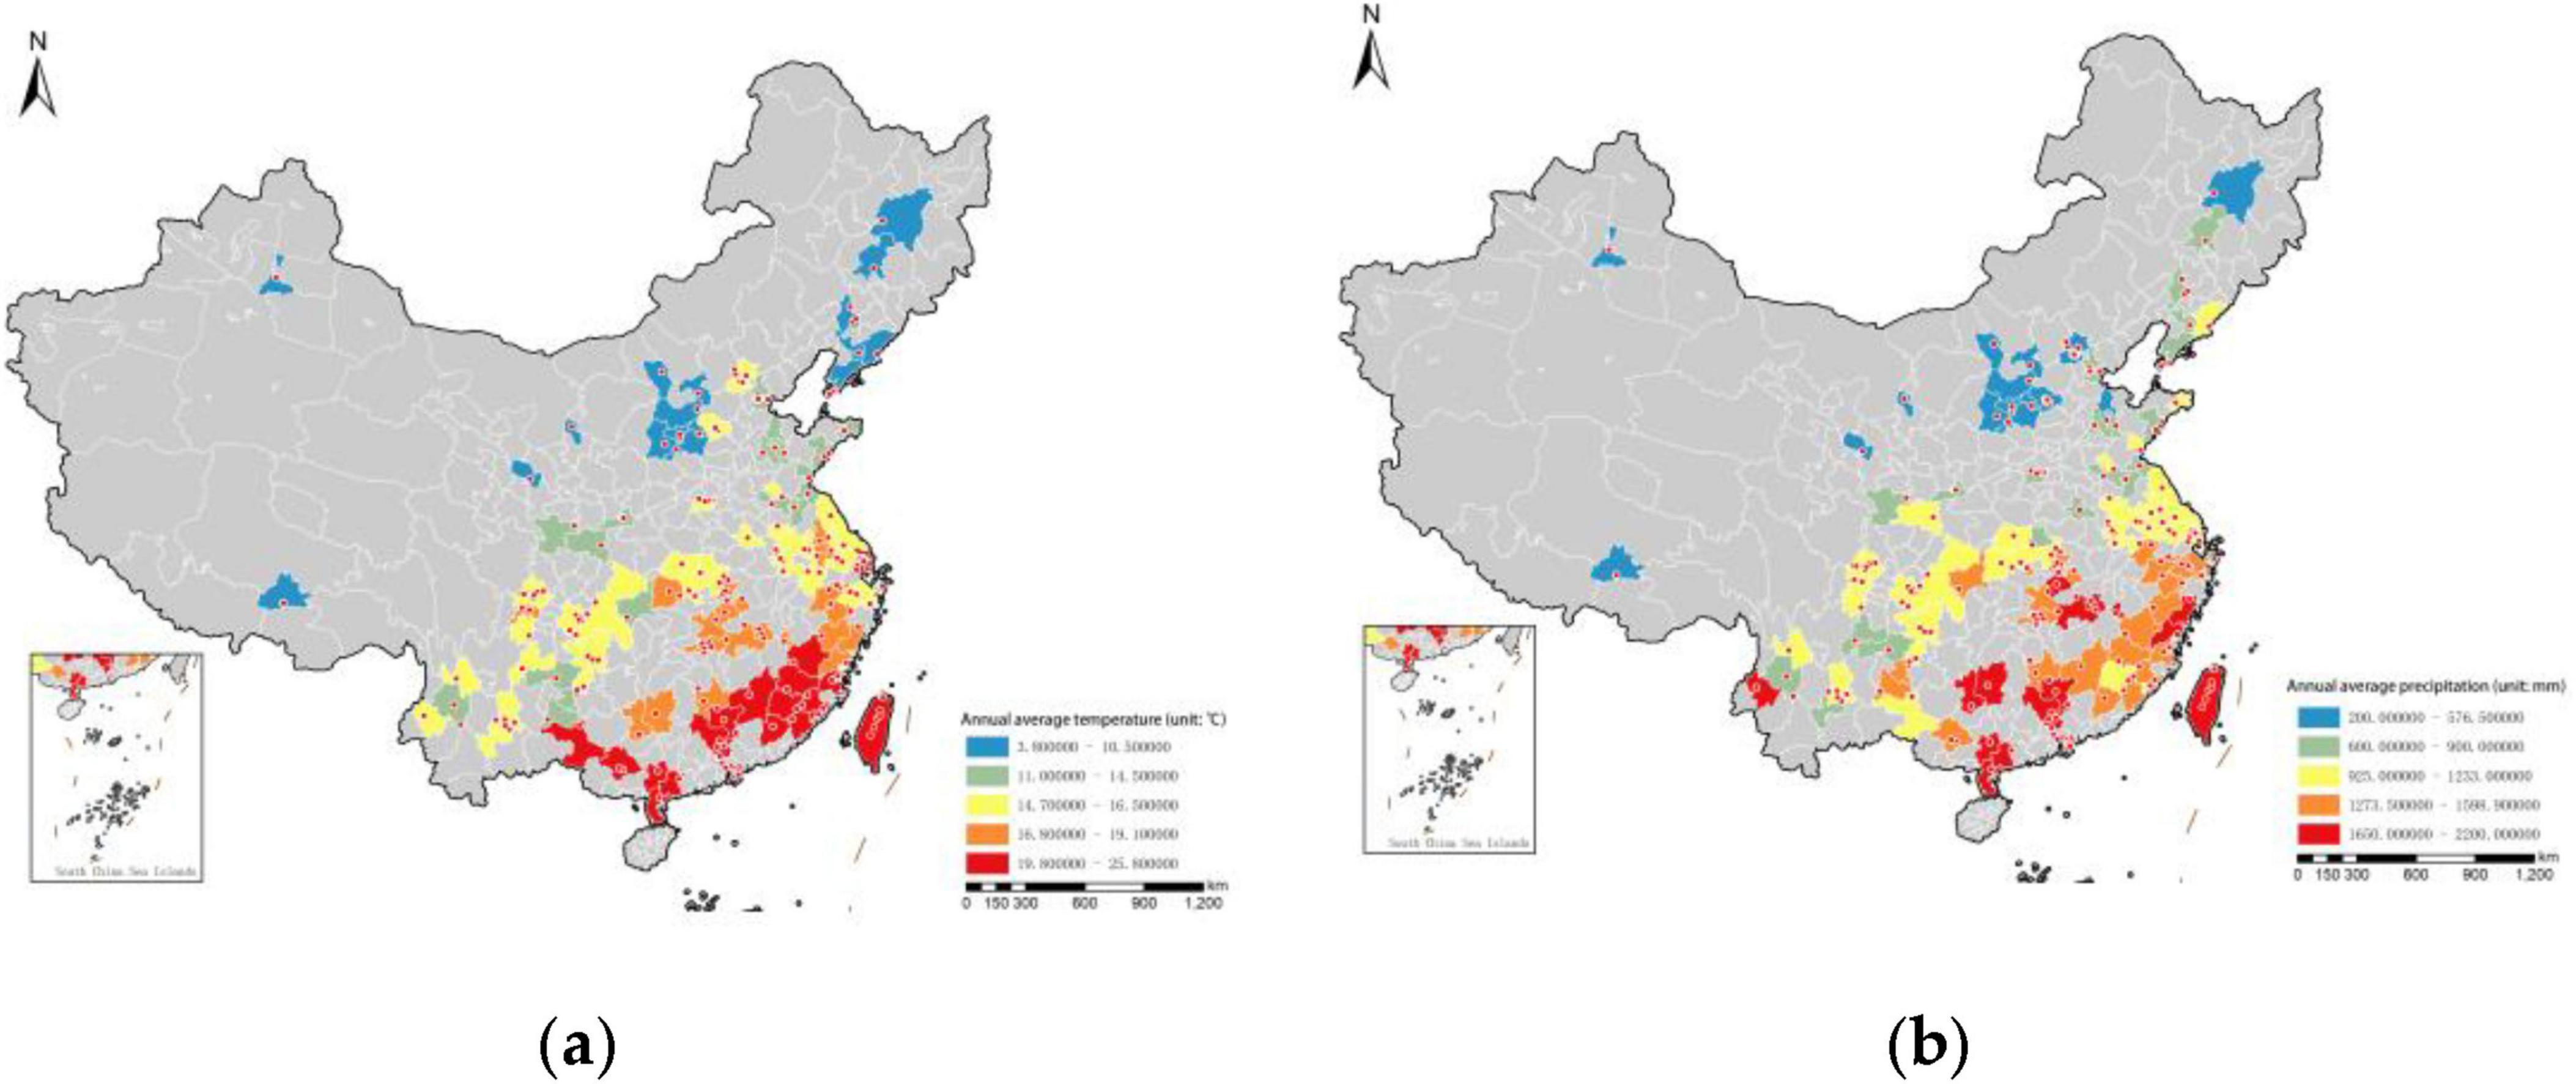
Figure 11. Distribution map of cherry blossom scenic spot quantities under different climatic conditions. (a) Distribution of cherry blossom scenic spots by annual average temperature. (b) Distribution of cherry blossom scenic spots by annual average precipitation.
In terms of annual average precipitation (Figure 11b), the annual average precipitation for the distribution of cherry blossom scenic spots ranges from 200 to 2,200 mm. The top three climate types—subtropical monsoon climate, subtropical monsoon humid climate, and temperate monsoon climate—show annual average precipitation levels of 1,400–1,500 mm, 1,300–1,400 mm, and 600–800 mm, respectively, suggesting that cherry blossom scenic spots are mostly located in areas where the annual average precipitation falls between 600 and 1,500 mm.
These areas provide ample moisture support for the growth of cherry blossoms, and the climatic characteristics of these regions create ideal conditions for their flourishing growth.
3.4.2.2 Population conditions
Regions with larger populations indicate higher intensities of human activity, which in turn contribute to elevated levels of productivity and urbanization, as well as a substantial urban domestic demand and consumer market. Population conditions significantly influence the scale of market demand for cherry blossom scenic spots (Li et al., 2020; Guo et al., 2021), making it a critical factor affecting their distribution, with a q-value of 0.125.
By overlaying the distribution of cherry blossom scenic spots with resident population density, it was found that 61.3% of these sites are located in densely and highly populated areas (Figure 12a). A comparative analysis of the populations in cities hosting cherry blossom scenic spots across various provincial-level administrative regions (Figure 12b) reveals that Chongqing ranks the highest, while Lhasa in the Tibet Autonomous Region ranks the lowest.
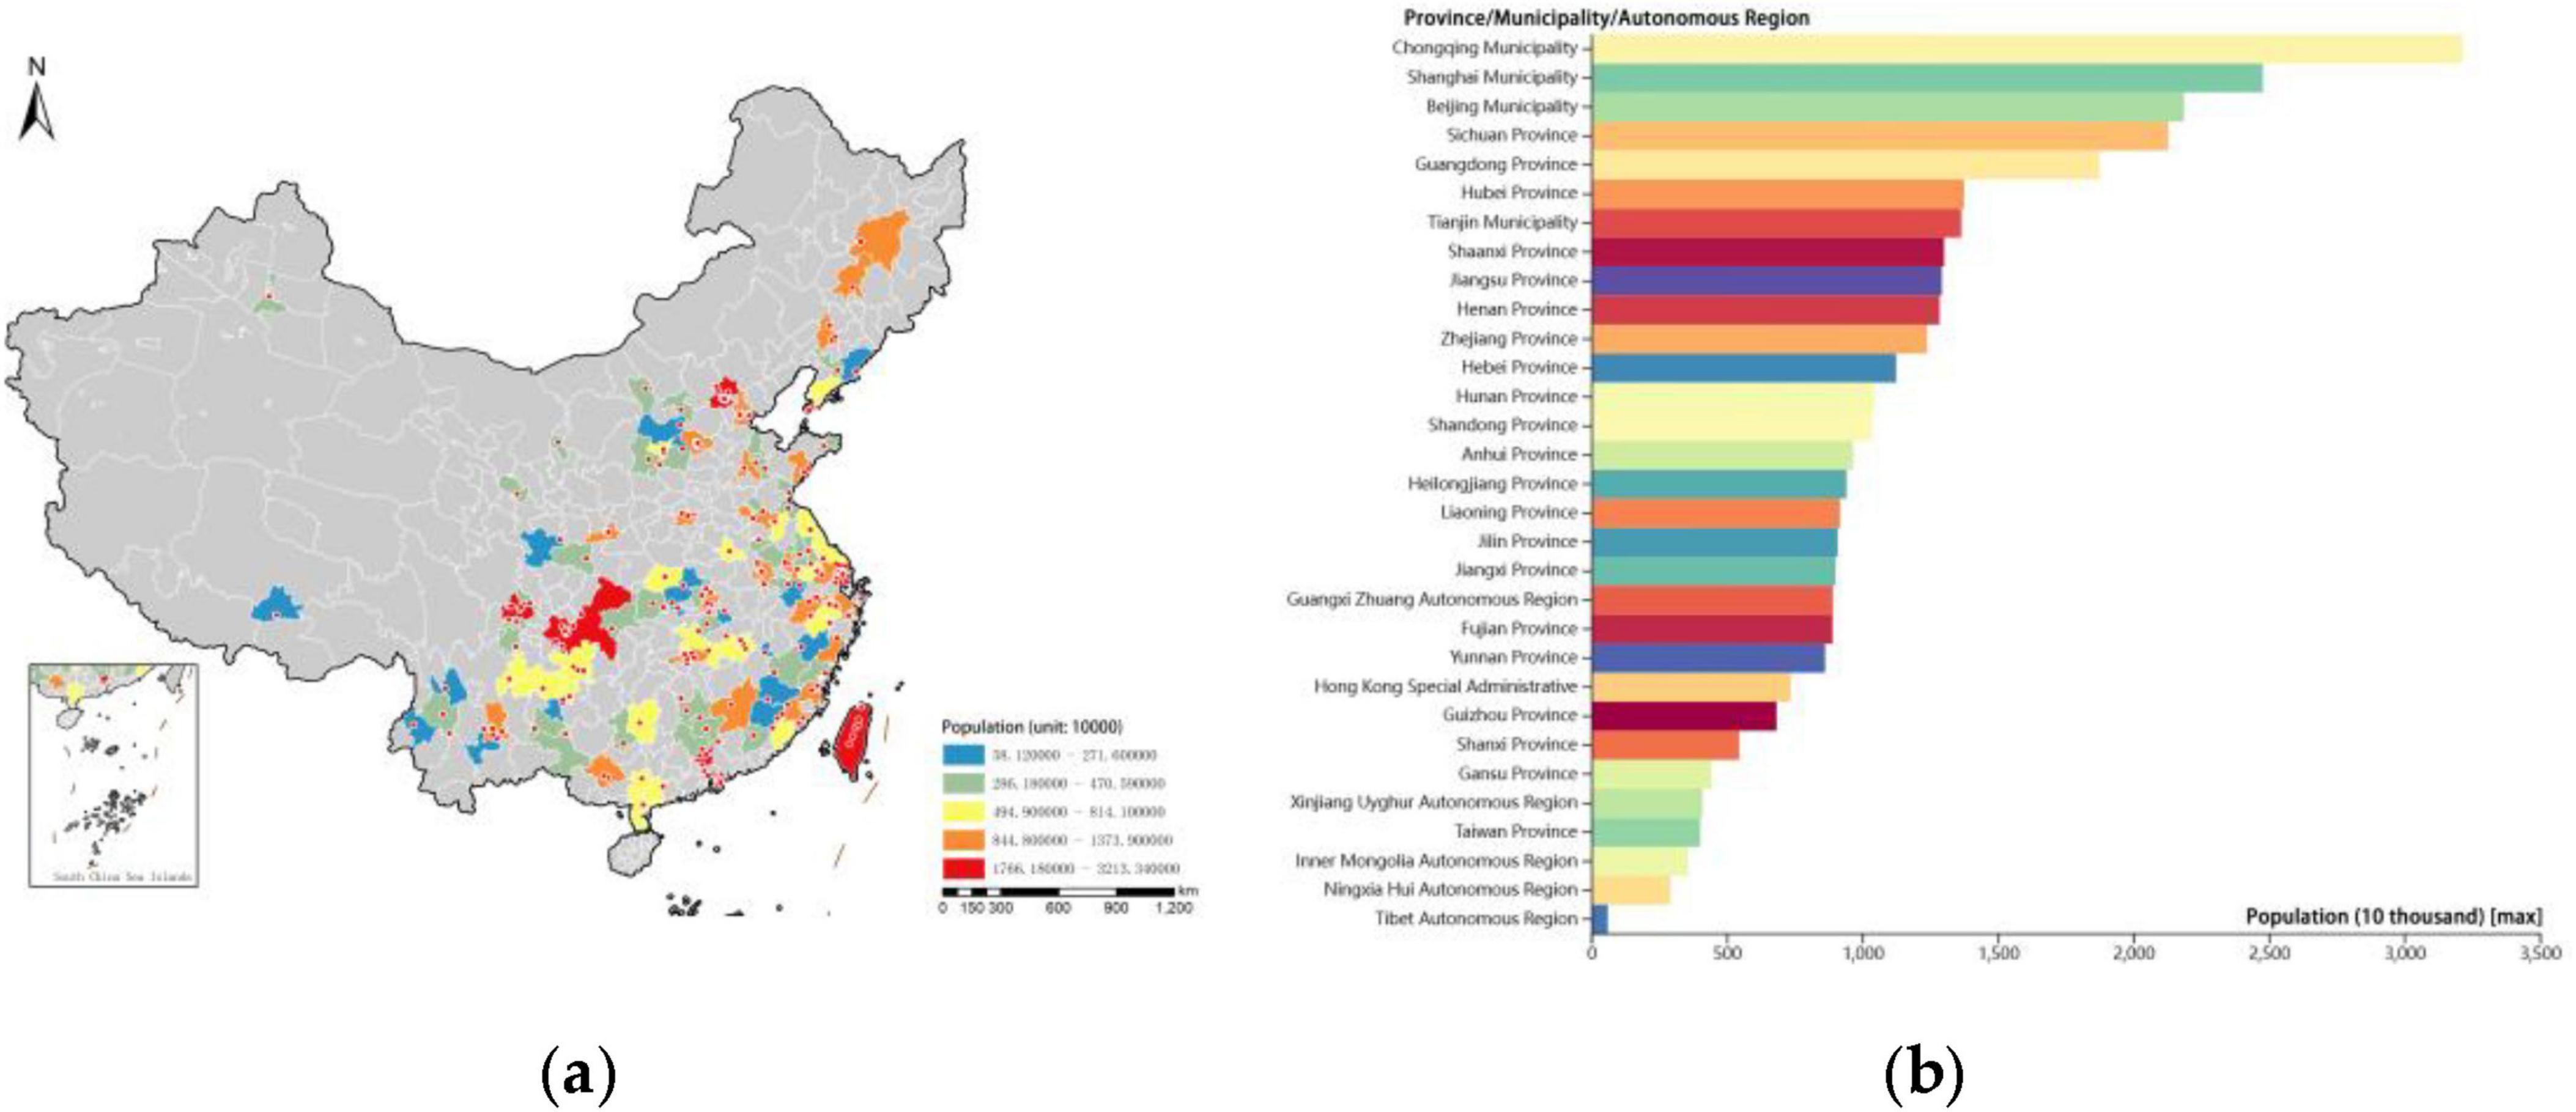
Figure 12. Comparative analysis of population sizes in cities with cherry blossom scenic spots. (a) Distribution of cherry blossom scenic spots by population density. (b) Comparison of resident populations in cities with cherry blossom scenic spots.
In densely populated cities, cherry blossom scenic spots serve not only as scenic resources but also fulfill the public’s demand for green spaces and cultural activities. For instance, cherry blossom scenic spots in cities such as Beijing and Wuhan are significant leisure destinations for residents and attract substantial numbers of non-local tourists, thereby generating a dual agglomeration effect of human traffic and economic benefits. Moreover, the development of cherry blossom scenic spots often relies on infrastructure investment and management capabilities provided by local governments, conditions that are more prominently realized in densely populated urban areas.
3.4.2.3 Economic levels
Economic level reflects both the standard of living and the affluence of a region. In economically developed areas, the higher living standards drive greater demand, stimulating the growth of the tertiary sector and providing the material foundation for the development of cherry blossom scenic spots (Sun et al., 2023; Liu et al., 2023; Xinjian et al., 2023; Wang and Shi, 2022).
Regional Gross Domestic Product (GDP) and per capita GDP are the primary influencing factors in the spatial distribution of cherry blossom scenic spots in China, with q-values of 0.279 and 0.370, respectively. Overlaying regional GDP and per capita GDP with the distribution of cherry blossom scenic spots reveals that these spots are largely concentrated in high-GDP regions (Figure 13a), with 70.3% located in areas with high per capita GDP (above 100,000 RMB per person) (Figure 13b), indicating a significant positive correlation between the number of cherry blossom scenic spots and economic level. Among the regions, Shanghai ranks highest in regional GDP, while Chongzhou in Sichuan Province ranks lowest. In terms of per capita GDP, the Hong Kong Special Administrative Region ranks highest, and Longnan in Gansu Province ranks lowest.
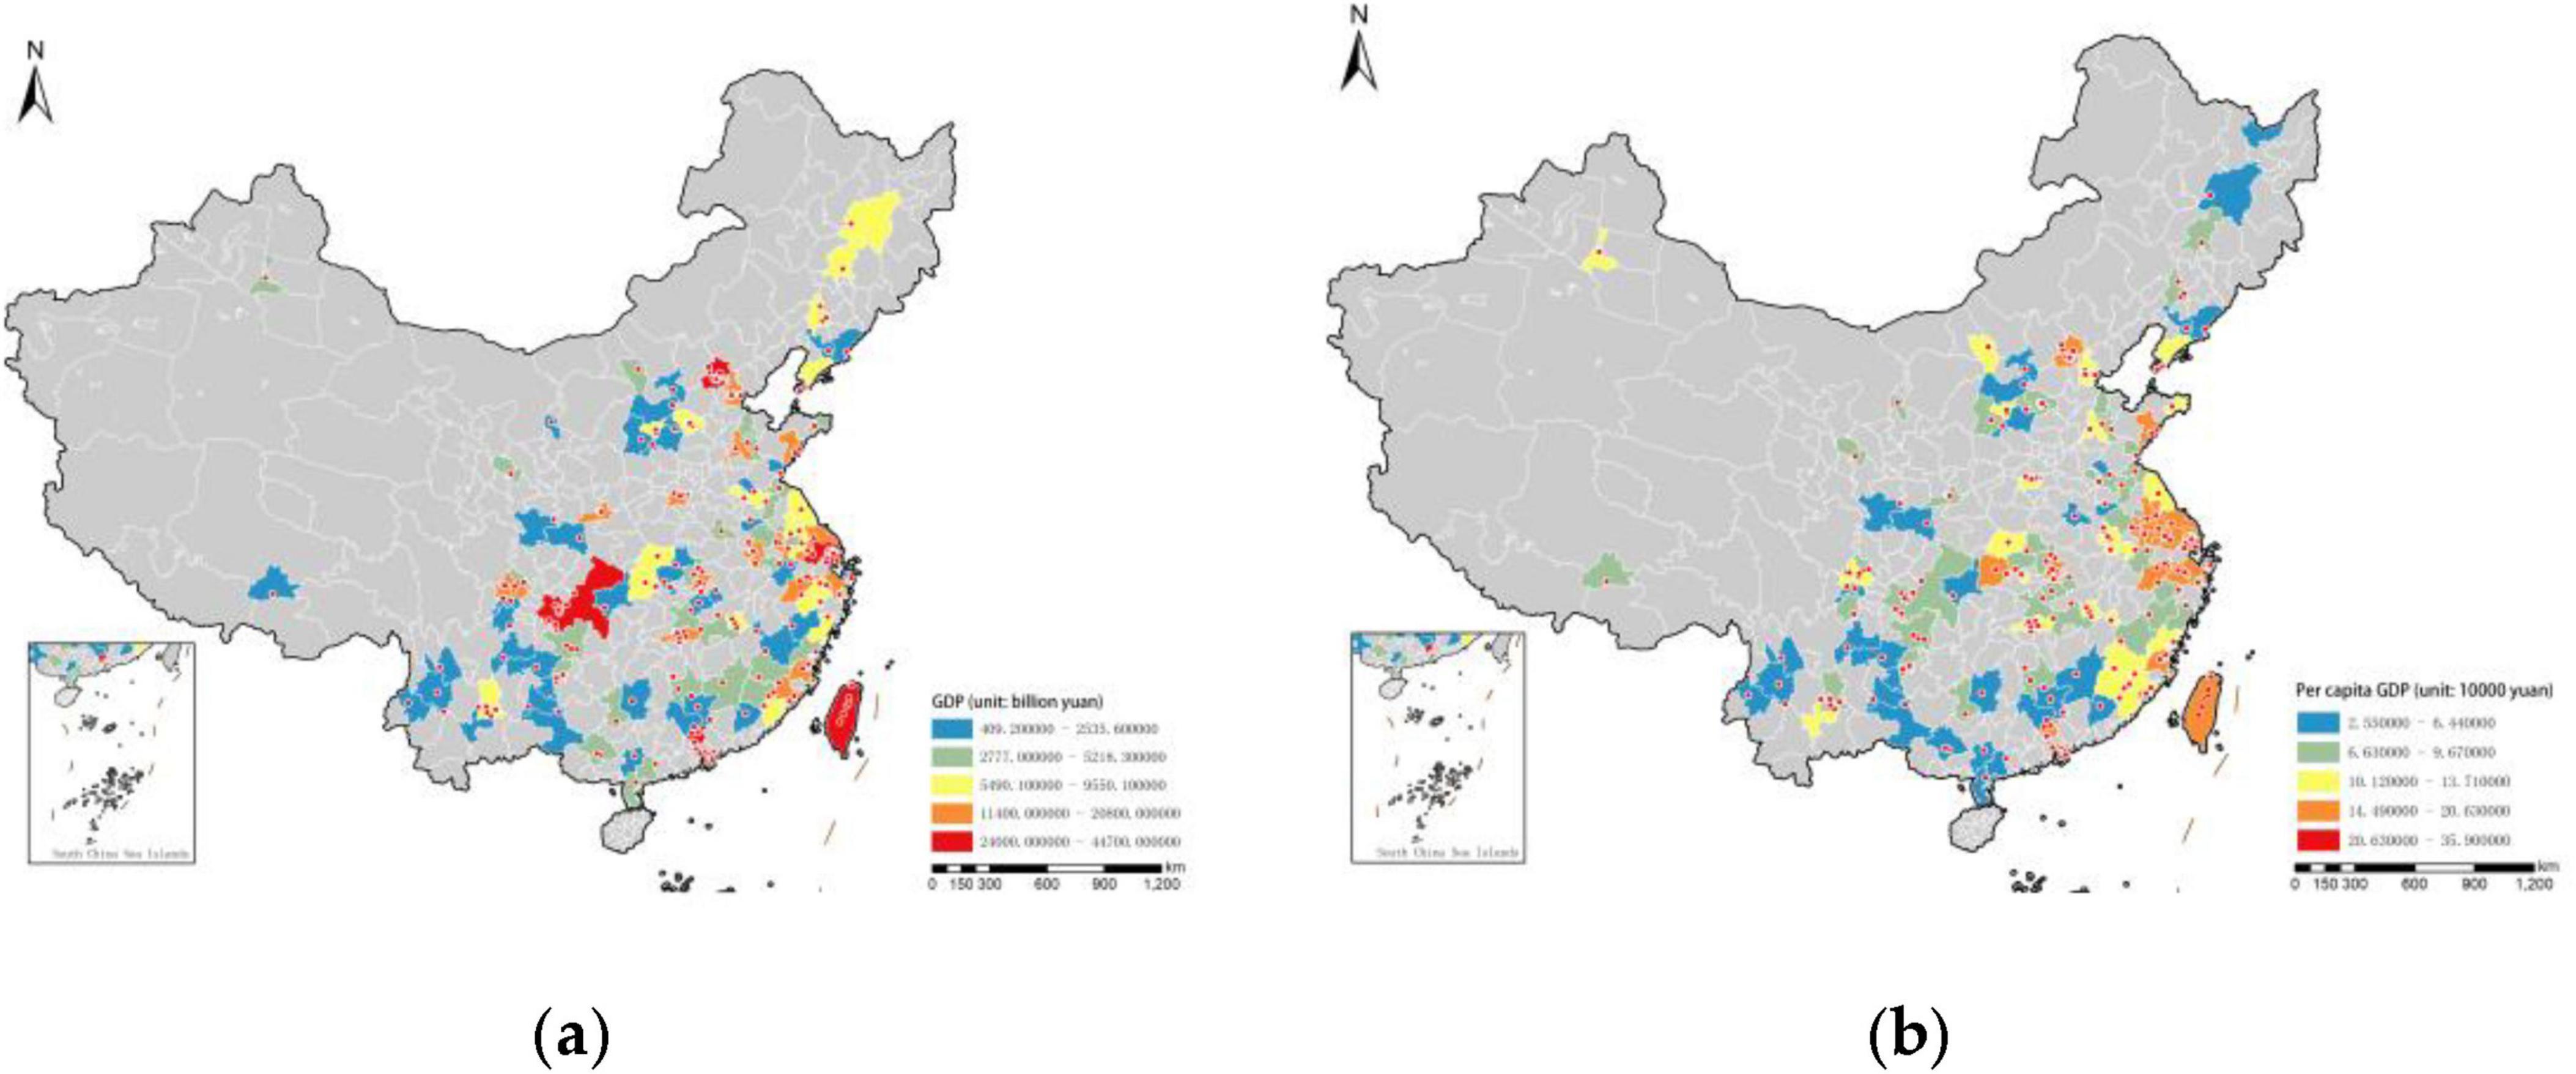
Figure 13. Comparative analysis of economic levels in cities with cherry blossom scenic spots. (a) Distribution of cherry blossom scenic spots by regional GDP. (b) Distribution of cherry blossom scenic spots by per capita GDP.
Economically developed regions not only possess sufficient financial resources for the development and maintenance of scenic spots but also have the potential to stimulate further local economic growth through the tourism industry. As a tourism resource with both ecological and cultural value, cherry blossom scenic spots can effectively promote the growth of the tertiary sector, enhance the economic level of the area, and elevate the cultural image of the city.
3.4.3 Results of interactive probing
The results of the interactive probing analysis (Figure 14) reveal that the explanatory power of each influencing factor is significantly enhanced after interaction, exhibiting varying degrees of two-factor enhancement or nonlinear amplification. This underscores the notion that the spatial distribution of cherry blossom scenic spots in China is shaped by the combined effects of multiple factors. The interaction between per capita GDP (X8) and other factors demonstrates the highest explanatory power, exceeding 37%, followed by the interaction between regional GDP (X7) and other factors, with explanatory power exceeding 27%. These findings indicate that economic factors play a dominant role in shaping the spatial distribution of cherry blossom scenic spots.
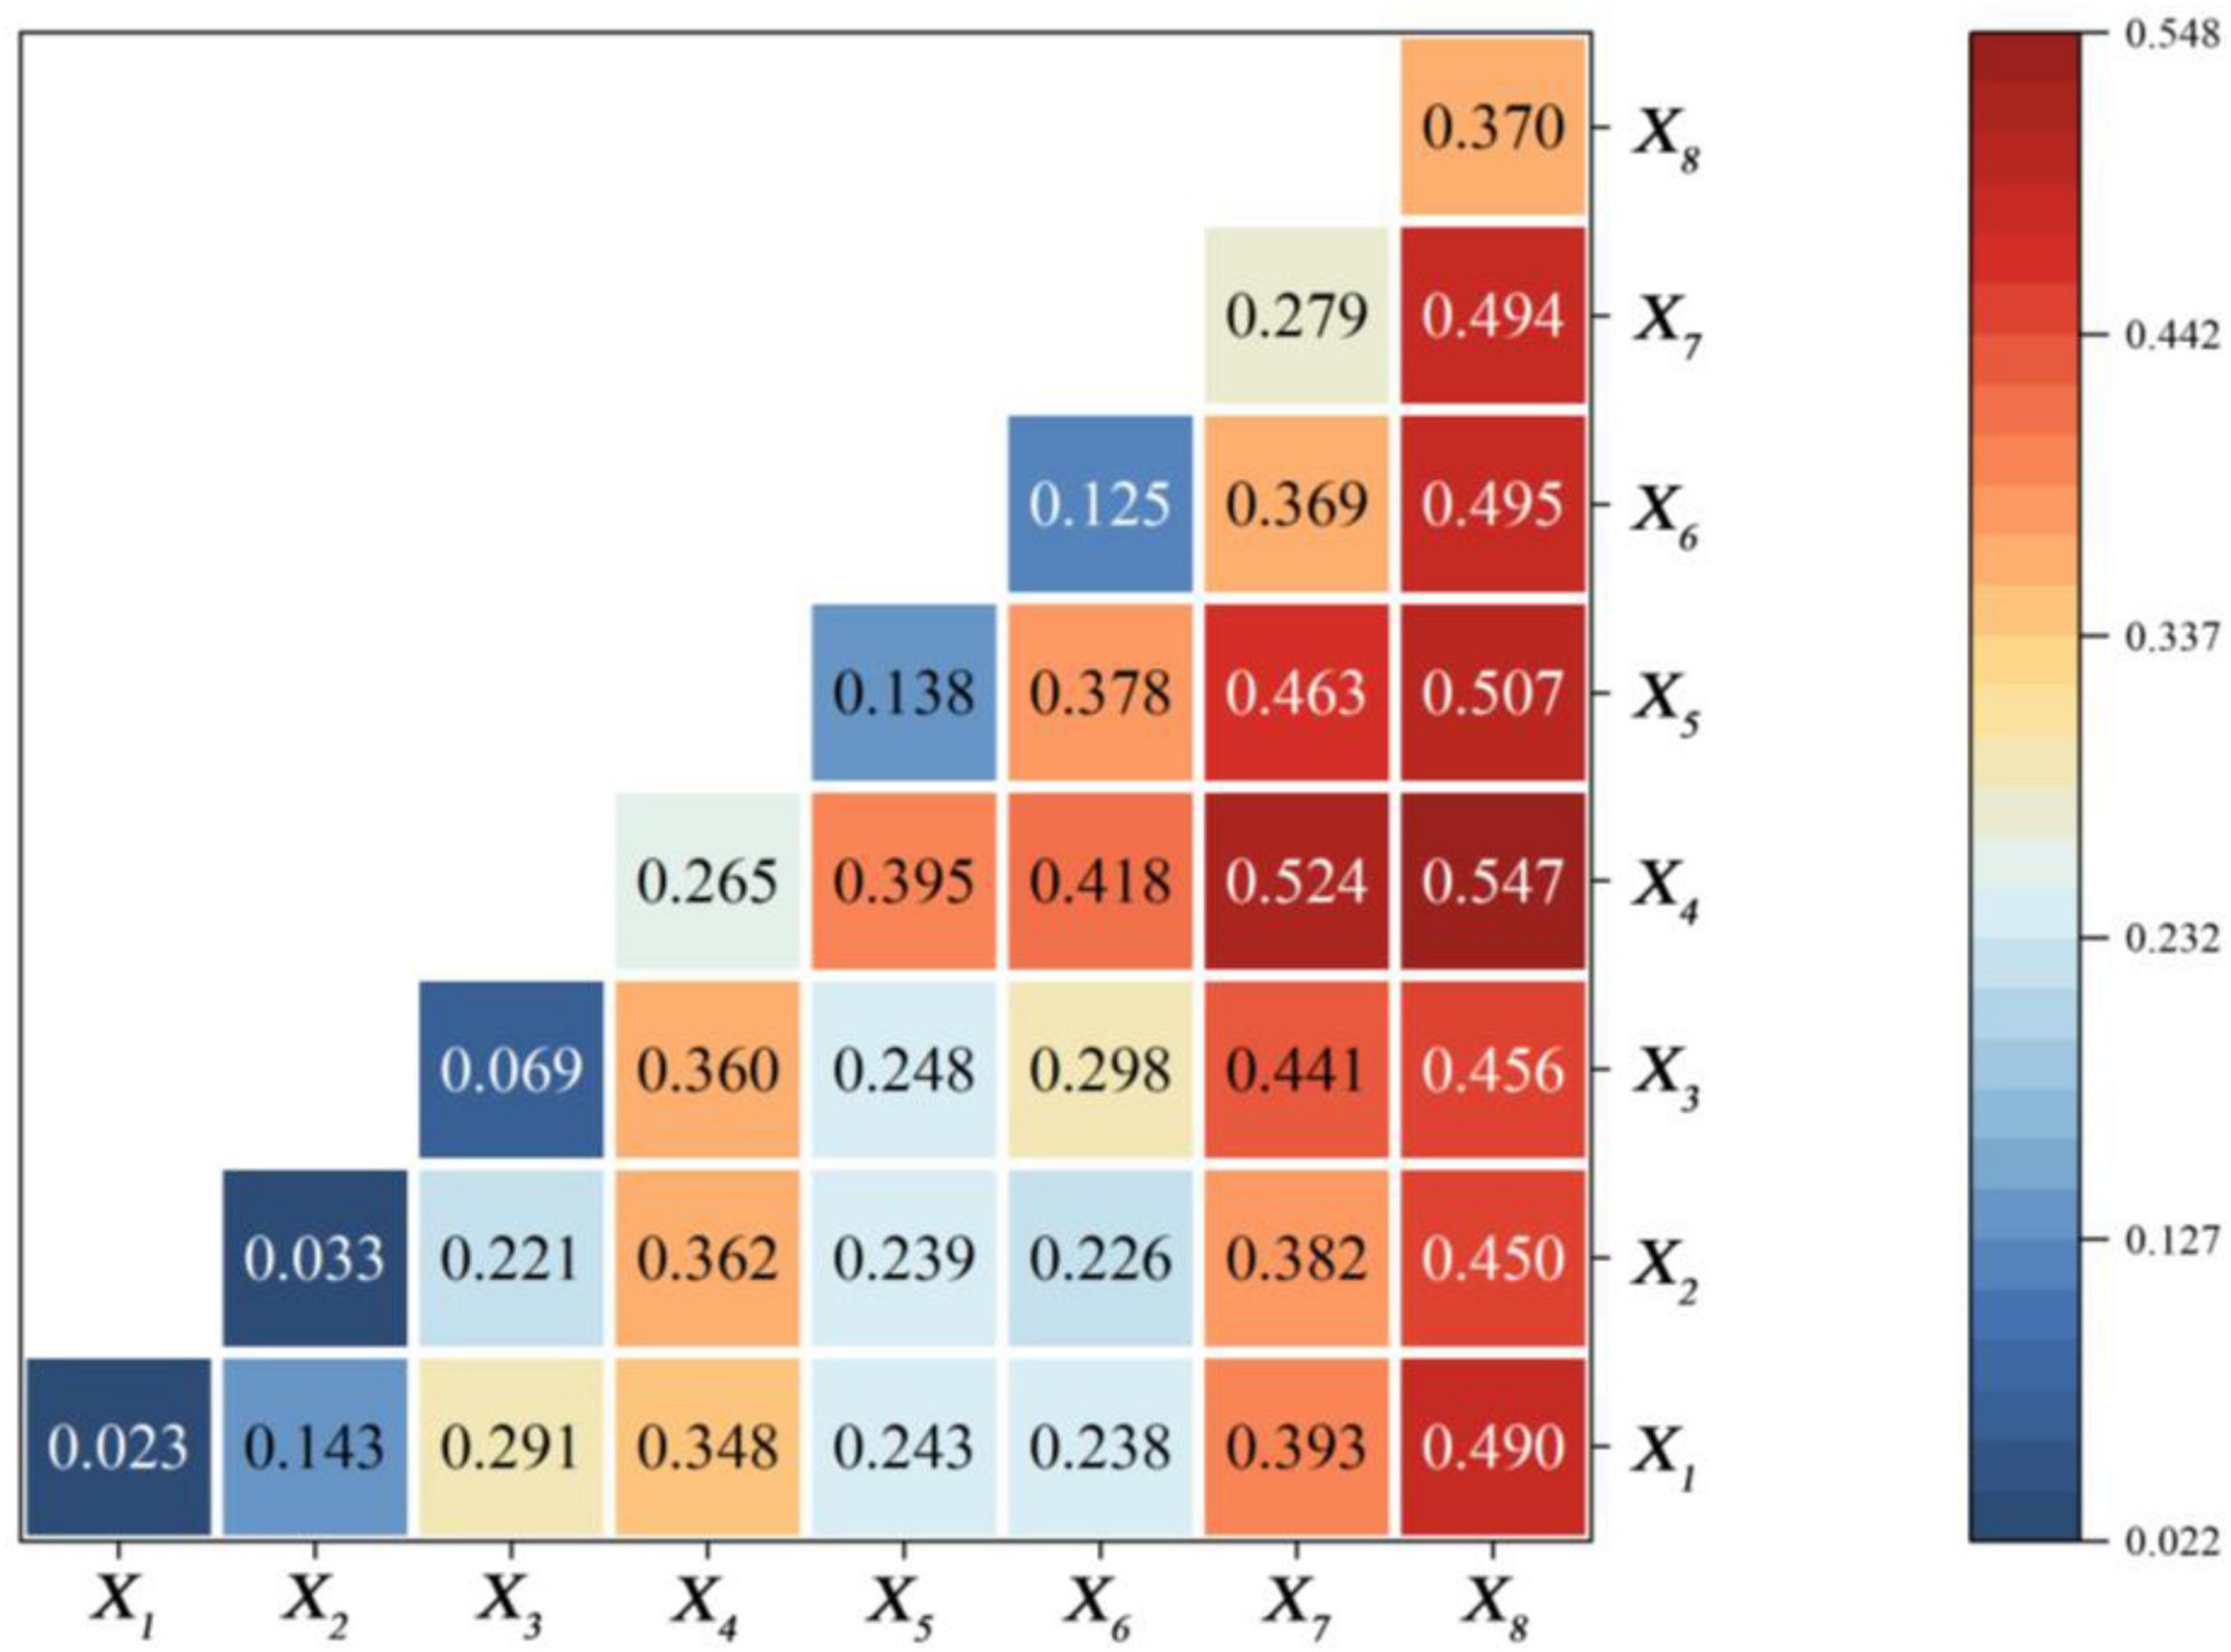
Figure 14. Results of interactive probing of influencing factors.
Among these interactions, the combination of per capita GDP (X8) and annual average temperature (X4) exhibits an explanatory power of 0.547, significantly surpassing their individual influences. This highlights the critical role of natural geographic conditions, particularly climate, in influencing the spatial distribution of cherry blossom scenic spots when combined with economic development. Additionally, while the resident population (X6) alone exhibits a relatively weak explanatory power (0.125), its interactions with per capita GDP (X8), annual average temperature (X4), annual average precipitation (X5), and regional GDP (X7) show significant enhancements, reaching 0.495, 0.418, 0.379, and 0.369, respectively. This suggests that the spatial distribution of cherry blossom scenic spots is determined not solely by any single factor but rather by the synergistic effects of economic conditions, natural environmental factors, and market demand.
In contrast, topographic factors such as altitude (X1), slope (X2), and aspect (X3) exhibit relatively lower explanatory power. Altitude (X1) alone has a very weak influence (0.023), but its interaction with other factors (e.g., per capita GDP and precipitation) reaches 0.490 and 0.393, respectively, indicating that terrain constraints may indirectly affect site selection when coupled with economic and climatic factors. Slope (X2) and aspect (X3) also demonstrate limited individual effects (0.033 and 0.069, respectively), but their interactions with climatic factors such as annual average temperature (X4) and precipitation (X5) show moderate enhancements. This suggests that while topography itself does not directly determine the distribution of cherry blossom scenic spots, it interacts with climatic and economic conditions to influence site suitability.
The interplay between natural geographic conditions, economic levels, and demographic factors jointly shapes the spatial distribution of cherry blossom scenic spots, contributing to their distinct geographical patterns in China. These factors not only influence the current distribution but also have profound implications for future development strategies. Therefore, optimizing the spatial development of cherry blossom scenic spots should consider these key influencing factors to achieve an integrated approach that balances ecological sustainability, economic prosperity, and social wellbeing.
3.4.4 Factors influencing sentiment tendency judgment
This study utilized the sentiment analysis feature in Baidu’s Natural Language Processing API to conduct sentiment detection on 43,151 textual evaluations, obtaining positive indices, negative indices, and confidence levels for each evaluation. The reflecting of the positive indices and negative indices equals 1, while the confidence level indicates the reliability of the sentiment judgment. Based on a manual data sampling check, the study defined sentiment evaluation intervals: when 0 ≤ E_(i)<0.5, it is classified as negative sentiment; when 0.5 ≤ E_(i) ≤ 0.8, it is classified as neutral sentiment; and when 0.8<E_(i) ≤ 1, it is classified as positive sentiment.
From an overall perspective, the average sentiment index for the study area was 0.84, with a standard deviation of 0.32, indicating that visitors generally held a positive perception of the top 10 cherry blossom scenic spots across various regions of China. Regarding the distribution of sentiment polarities, 35,886 evaluations were positive, comprising 83.16%; 6,075 evaluations were neutral, accounting for 14.08%; and 1,190 evaluations were negative, constituting 2.76% (Figure 15).

Figure 15. Comparison of sentiment tendencies for cherry blossom scenic spots in different regions.
From the spatial distribution of sentiment tendencies reflected in the figure, the predominantly positive sentiments are found at the following cherry blossom scenic spots: Yuantouzhu (Wuxi), Jiming Temple (Nanjing), and Yongfu Cherry Park (Zhangping) in East China; Wuhan University Cherry Park and East Lake Cherry Park (Wuhan) in Central China; the Yuyuantan Cherry Park (Beijing) in North China; Tianshi Cherry Park (Guangzhou) in South China; and Qinglong Temple (Xi’an) in Northwest China. In Northeast China, the Longwangtang Cherry Park (Dalian) shows an equal distribution of positive and neutral evaluations, while the Pingba Cherry Park (Guiyang) in Southwest China is primarily characterized by moderate evaluations.
4 Discussion
4.1 Spatiotemporal distribution characteristics of cherry blossom scenic spots
The study identifies three stages of the development of cherry blossom scenic spots and their corresponding spatial distribution characteristics, thereby enhancing the existing research on cherry blossom landscape tourism in China. This research builds on previous scholars’ focus on the development of tourist attractions and spatial agglomeration patterns (Xinge et al., 2016), proposing the origins and evolution of cherry blossom scenic spots, which include four stages: before 1949, 1949-1979, 1980-2000, and 2001-2023. In the first stage, the establishment of cherry blossom scenic spots began in the 1930s, influenced by wars, diplomacy, and cultural exchanges before the founding of the People’s Republic of China. The gentry class and Japanese individuals started planting cherry blossoms in certain regions of China, resulting in a scattered distribution of scenic spots. The second stage saw the establishment of diplomatic relations between China and Japan, with cherry blossoms becoming a symbol of cultural exchange and laying the groundwork for the expansion of cherry blossom scenic spots. The third stage, from the early 1980s to the end of the century, marked the first rapid growth period for these scenic spots, driven by reforms and improvements in people’s living standards. During this time, notable cherry blossom sites such as Nanjing’s Jiming Temple and Beijing’s Yuyuantan were established, reflecting the continuity of Sino-Japanese friendship and the impetus of socio-economic development. In the twenty-first century, the distribution of cherry blossom scenic spots entered the fourth stage. With rapid economic growth and ongoing improvements in urban and rural infrastructure, influenced by economic development, policy guidance, and the concept of ecological sustainability, the construction of cherry blossom scenic spots entered a second rapid growth period. Their distribution became more widespread, with a concentration in North China, East China, and Central China, gradually expanding westward. Existing data indicate that this stage features the richest variety of cherry species in North, East, and Central China, with P. × yedoensis being the most widely planted, while P. campanulata is primarily found in southern regions (Peng et al., 2024). Summarizing the spatial distribution characteristics of these scenic spots aids in enhancing the understanding of the spatial dynamics of tourism resources in China, thus expanding the tourism spatial pattern (Jiang et al., 2024).
4.2 Factors influencing the distribution of cherry blossom scenic spots
An importance ranking of factors influencing the distribution of cherry blossom scenic spots has been conducted. The results from the geographic detector model indicate that the economic level is the dominant factor affecting the distribution of cherry blossom scenic spots in China, followed by natural geographical factors and local population size. Among these, the interaction of regional per capita GDP with other factors constitutes a significant combination influencing the distribution of cherry blossom scenic spots in China. Firstly, from a spatial distribution perspective, high-density areas of cherry blossom scenic spots are primarily concentrated in economically developed regions such as Beijing, Shanghai, and Wuhan. The strong economic development in central cities, combined with the collective appeal of multiple nearby scenic spots, tends to stimulate consumer demand more effectively than individual spots, thereby promoting the development of tourism in surrounding cities. This conclusion is supported by existing research (Lu et al., 2022; Yu et al., 2020; Xie et al., 2021), which suggests that economic benefits are a driving force behind the establishment of cherry blossom scenic spots in urban areas. Secondly, the population serves as the foundation for industrial development. Residents’ aspirations for a better life and improved living standards increase the likelihood of tourists flocking to scenic spots for vacations (Jiang et al., 2024). Some studies also propose that a balance between public demand and the supply of services at urban scenic spots is crucial for the sustainable development of these attractions (Zhang S. Y. et al., 2021). Economically developed regions have more funding and resources for the construction and maintenance of scenic spots, making them more attractive to tourists, thus forming a virtuous cycle between the economy and the tourism industry. The public evaluation rankings of cherry blossom scenic spots corroborate this conclusion. Finally, the impact of natural geographical conditions on cherry blossom resources cannot be overlooked. Cherry blossom scenic spots are predominantly located in temperate and subtropical climate zones. Regions with insufficient climatic resources must acknowledge their limitations when developing cherry blossom tourism and should tailor their strategies to local conditions, ensuring a reasonable allocation of natural landscape elements to achieve collaborative development among regions (Tian et al., 2023).
4.3 Factors and strategies influencing public evaluations of cherry blossom scenic spots
The analysis of public sentiment toward cherry blossom scenic spots reveals that locations such as Wuxi, Nanjing, Zhangping, Wuhan, and Beijing received high ratings. These spots are primarily distributed in the East China, Central China, and North China regions. A deeper examination shows that these cherry blossom sites feature diverse varieties, unique cherry blossom-related culture, and extended viewing periods. Additionally, the integration of well-known local parks, schools, agricultural sites, and temples creates personalized viewing experiences, enhancing emotional interactions between the sites and visitors, ultimately leading to improved evaluations. In contrast, cherry blossom spots in the Southwest and Northeast regions exhibit a higher proportion of neutral and moderate feedback. It has been observed that these areas are relatively far from urban centers and offer shorter viewing times. This indicates that when constructing cherry blossom sites, it is essential not only to leverage urban tourism characteristics but also to coordinate factors such as resource endowments, transportation configurations, and target markets to establish a tourism brand (Xu and Wang, 2022).
Moreover, evaluating the natural attractiveness of tourism destinations is a crucial step in optimizing tourism planning and enhancing visitor experiences. Research on the Lukovska Spa has highlighted the importance of systematically assessing environmental conditions, tourism resources, and accessibility to determine the potential of a destination (Valjarević et al., 2017). This perspective is highly relevant to cherry blossom tourism development, where the spatial distribution of sites, ecological sustainability, and infrastructure improvements directly affect tourist perceptions and engagement. Therefore, apart from integrating cultural elements and optimizing tourism products, it is necessary to conduct systematic evaluations of site attractiveness and accessibility to formulate sustainable tourism strategies. In the context of flow marketing, utilizing online promotion can help build brand reputation, attract tourists, and stimulate consumption (Zhang Y. X. et al., 2021).
4.4 Limitations
The article conducts a longitudinal study on the development of cherry blossom scenic spots in China and a horizontal comparative analysis of cases, drawing on historical data to identify influencing factors and improvement strategies. However, the study also has some limitations. Firstly, the geographical data analysis of cherry blossom scenic spots, such as species types and visitor numbers, is sourced from local governments or media reports, which cannot be verified. Secondly, due to the limited literature on the status of cherry blossom scenic spots in China before the establishment of the country, the study relies on data derived from reported content. Additionally, the study has not fully considered other factors that may influence the attractiveness of scenic spots, such as visitors’ education levels, accessibility, viewing time, and social platform promotion. Incorporating these factors in future research would contribute to a more comprehensive understanding of the mechanisms affecting cherry blossom tourism. This approach not only facilitates precise analysis through big data, enhancing data richness, but also contributes to more effective management strategies for scenic spots.
5 Conclusion
This paper analyzes the temporal evolution characteristics, overall spatial layout, influencing factors of distribution, and public sentiment tendencies regarding cherry blossom scenic spots in China from a spatiotemporal perspective. The conclusions are as follows:
(1) The construction of cherry blossom scenic spots in China originated in the 1930s. Before the founding of the People’s Republic of China, the distribution was scattered. After 1949, the sites gradually became concentrated, forming high-density clusters centered in Beijing, Shanghai, and Wuhan, as well as a secondary density zone centered in Guangdong. The distribution pattern exhibits both an extension along and diffusion across the northeast–southwest axis, with Hubei Province hosting the highest number of cherry blossom scenic spots. (2) The main categories of cherry blossom scenic spots include parks, university campuses, agroforestry integration zones, temples, and roadside landscapes, with parks being the most common. Additionally, different types of scenic spots exhibit distinct distribution patterns in terms of terrain and location. The proportion of spots in plains and urban areas is relatively high, while those in mountainous and rural areas are comparatively lower. This suggests that cherry blossoms primarily serve as urban tourism attractions and greening resources in China. (3) Cherry species in China exhibit significant regionality and climatic adaptability, with flowering periods ranging from January to May and peak blooming occurring between March and April. Prunus × yedoensis is widely cultivated in most regions, while Prunus campanulata is more suitable for the warmer southern regions. Therefore, regionalized cultivation strategies are essential for optimizing the management of cherry blossom scenic spots. (4) The trajectory of the mean center of cherry blossom scenic spot distribution has undergone notable shifts. From the founding of the People’s Republic of China to the late 1970s, the mean center gradually moved from the northeast to the southwest. From the early 1980s to the late 1980s, it shifted from the southeast to the northwest, forming an initial distribution pattern. Since the early twenty first century, the mean center has shown a continuous southwestward movement. (5) The main categories of cherry blossom scenic spots include parks, university campuses, agroforestry integration zones, temples, and roadside landscapes, with parks being the most common. Additionally, different types of scenic spots exhibit distinct distribution patterns in terms of terrain and location. The proportion of spots in plains and urban areas is relatively high, while those in mountainous and rural areas are comparatively lower. This suggests that cherry blossoms primarily serve as urban tourism attractions and greening resources in China. (6) Factor analysis based on the geographical detector model indicates that economic development is the dominant factor influencing the spatial distribution of cherry blossom scenic spots, with per capita GDP demonstrating strong explanatory power. Natural geographical conditions and population factors are secondary to economic levels. Additionally, climatic factors such as temperature and precipitation contribute to variations in cherry blossom species and flowering periods across different regions. (7) Sentiment analysis of Chinese tourism platforms shows that public reviews of cherry blossom scenic spots are predominantly positive, with the most favorable reviews concentrated in Central China, North China, and East China. Representative scenic spots include Yuantouzhu (Wuxi) in East China, Wuhan University Cherry Park (Wuhan) in Central China, and Yuyuantan park (Beijing) in North China. In Northeast China, Longwangtang (Dalian), and in Southwest China, Pingba Cherry Park (Guiyang), the reviews are mainly neutral.
Data availability statement
The raw data supporting the conclusions of this article will be made available by the authors, without undue reservation.
Ethics statement
Ethical review and approval was not required for the study on human participants in accordance with the local legislation and institutional requirements. The participants provided written informed consent to participate in this study.
Author contributions
HP: Conceptualization, Data curation, Formal analysis, Funding acquisition, Investigation, Methodology, Resources, Software, Supervision, Validation, Visualization, Writing – original draft, Writing – review & editing. PL: Conceptualization, Data curation, Formal analysis, Investigation, Methodology, Resources, Software, Supervision, Validation, Visualization, Writing – original draft, Writing – review & editing. XZ: Methodology, Software, Supervision, Writing – original draft, Writing – review & editing. YH: Conceptualization, Investigation, Software, Writing – original draft. RS: Investigation, Validation, Writing – original draft. CZ: Funding acquisition, Project administration, Resources, Supervision, Writing – review & editing.
Funding
The author(s) declare that no financial support was received for the research and/or publication of this article.
Conflict of interest
The authors declare that the research was conducted in the absence of any commercial or financial relationships that could be construed as a potential conflict of interest.
Generative AI statement
The authors declare that no Generative AI was used in the creation of this manuscript.
Publisher’s note
All claims expressed in this article are solely those of the authors and do not necessarily represent those of their affiliated organizations, or those of the publisher, the editors and the reviewers. Any product that may be evaluated in this article, or claim that may be made by its manufacturer, is not guaranteed or endorsed by the publisher.
Footnotes
References
Cao, Y. H., Yang, P. F., and Zhuang, K. Y. (2021). Applying machine learning in measuring the perception of historical space. Planners 37, 67–73.
Chen, X., Yao, L., Chen, J., Lan, S., and Peng, D. (2021). Temporal and spatial layout and evolution of cultural heritage of timber arch lounge bridges in Fujian and Zhejiang provinces, China. Landsc. Archit. 37, 139–144. doi: 10.3390/su16041581
Chen, Y. (2016). Similarities and differences in cherry blossom culture between China and Japan: An analysis based on texts. People’s Forum 20, 126–128.
Darbyshire, R., López, J. N., Song, X., Wenden, B., and Close, D. (2020). Modelling cherry full bloom using ‘space-for-time’ across climatically diverse growing environments. Agric. Forest Meteorol. 284:901. doi: 10.1016/j.agrformet.2020.107901
ElQadi, M. M., Dyer, A. G., Vlasveld, C., and Dorin, A. (2023). The spatiotemporal signature of cherry blossom flowering across Japan revealed via analysis of social network site images. Flora 304:152311. doi: 10.1016/j.flora.2023.152311
Guo, G., Sheng, K., and Pan, Y. (2021). Spatial differentiation characteristics and formation mechanism of RuraTourism destinations in china: Based on 1000 key rural tourism villages. Geogr. Geo-information Sci. 37, 99–105.
Guoqing, H. U. A. N. G., Sumei, Z. H. A. N. G., and Pengfei, S. H. I. (2023). Regional differences and influencing factors of the tourism economy in chengdu-chongqing economic circle under the goal of common prosperity. J. Southwest Univer. Nat. Sci. Ed. 45, 110–122. doi: 10.13718/j.cnki.xdzk.2023.12.012
Igarashi, M., Song, C., Ikei, H., and Miyazaki, Y. (2015). Effect of stimulation by foliage plant display images on prefrontal cortex activity: A comparison with stimulation using actual foliage plants. J. Neuroimaging 25, 127–130. doi: 10.1111/jon.12078
Janelle, D., and Goodchild, M. (1983). Diurnal patterns of social group distributions in a Canadian city. Econ. Geogr. 59, 403–425. doi: 10.2307/144166
Jiang, Y., Huang, W., Xiong, X., Shu, B., Yang, J., Li, M., et al. (2024). Investigating spatial patterns and determinants of tourist attractions utilizing POI data: A case study of Hubei Province. China. Heliyon 10:e32370. doi: 10.1016/j.heliyon.2024.e32370
Kaijun, C. A. O., and Jialiang, X. U. (2023). A study on the spatial and temporal evolution of the coupling and coordination between the sports industry and the tourism industry in China and its influencing factors. J. Southwest Univer. Nat. Sci. Ed. 45, 199–213. doi: 10.13718/j.cnki.xdzk.2023.03.017
Lefever, D. W. (1926). Measuring geographic concentration by means of the standard deviational ellipse. Am. J. Sociol. 32, 88–94. doi: 10.1086/214027
Li, J., Zhong, Y., Li, Y., Hu, W., Deng, J., Pierskalla, C., et al. (2022). Past experience, motivation, attitude, and satisfaction: A comparison between locals and tourists for Taihu Lake international cherry blossom festival. Forests 13:1608. doi: 10.3390/f13101608
Li, L., Hou, G. L., Xia, S. Y., and Huang, Z. F. (2020). Spatial distribution characteristics and influencing factors of leisure tourism resources in Chengdu. J. Natural Resour. 35, 683–697. doi: 10.31497/zrzyxb.20200314
Li, X. U., Jianghai, L. I., Chiheng, L. I. U., and Xin, C. U. I. (2017). Research on geomorphological morphology and regionalization of Hoh Xil based on digital elevation model (DEM). Acta Sci. Nat. Univer. Pek. 53, 833–842. doi: 10.13209/j.0479-8023.2017.041
Liu, H., Yuxin, F., and Minghui, Y. (2022). Spatial pattern and influencing factors of the Ancient Bohai city relics in Tang Dynasty in Northeast China. Sci. Geograph. Sin. 42, 1005–1014. doi: 10.13249/j.cnki.sgs.2022.06.006
Liu, H., Zhang, L., and Wang, W. (2023). Spatial structure and factors influencing county urbanization of inter-provincial border areas in China. Acta Geogr. Sin. 78, 1408–1426. doi: 10.11821/dlxb202306006
Liu, J., Liu, R., Ma, Q., and Diao, M. (2024). The spatiotemporal distribution characteristics and influencing factors of architectural heritage in the 20th Century in China. South Architecture 8, 88–97. doi: 10.3969/j.issn.1000-0232.2024.08.010
Lu, W. A. N. G., Linjie, Z. H. O. U., Chengcai, T. A. N. G., and Zhizhong, N. I. N. G. (2022). Spatial and temporal distribution characteristics of flower-viewing tourism and its influencing factors in China. J. Resour. Ecol. 13, 746–758. doi: 10.5814/j.issn.1674-764x.2022.04.019
Nagai, S., Saitoh, T. M., and Yoshitake, S. (2019). Cultural ecosystem services provided by flowering of cherry trees under climate change: A case study of the relationship between the periods of flowering and festivals. Int. J. Biometeorol. 63, 1051–1058. doi: 10.1007/s00484-019-01719-9
Peng, H., Li, P., and Zhu, R. (2024). Enhancing the sustainability of cherry blossom landscapes - A case study in Fujian Province, China. Front. Forests Glob. Change 7:1339603. doi: 10.3389/ffgc.2024.1339603
Primack, R. B., Higuchi, H., and Miller-Rushing, A. J. (2009). The impact of climate change on cherry trees and other species in Japan. Biol. Conserv. 142, 1943–1949. doi: 10.1016/j.biocon.2009.03.016
Silverman, B. W. (1986). Density Estimation for Statistics and Data Analysis. Monographs on Statistics and Applied Probability. London: Chapman and Hall.
Sun, J. X., Zhang, L. Y., and Luo, Y. L. (2023). Development of rural tourism resources in China under the goal of common prosperity: Current situation, problems and the development path. J. Natural Resour. 38, 318–334. doi: 10.31497/zrzyxb.20230204
Tang, G., and Yang, X. (2012). ArcGIS Geographic Information System Spatial Analysis Experiment Tutorial. Beijing: Science Press.
Tian, C. Y., Guan, X. T., and Tian, H. W. (2023). Spatial distribution characteristic and its influencing factors of key rural tourism villages in the Yellow River basin. Tour. Trib. 38, 32–44. doi: 10.19765/j.cnki.1002-5006.2023.08.008
Tsutsumida, N., and Funada, S. (2023). Mapping cherry blossom phenology using a semi-automatic observation system with street level photos. Ecol. Informatics 78:102314. doi: 10.1016/j.ecoinf.2023.102314
Valjarević, A., Vukoičić, D., and Valjarević, D. (2017). Evaluation of the tourist potential and natural attractivity of the Lukovska Spa. Tour. Manag. Perspect. 22, 7–16. doi: 10.1016/j.tmp.2016.12.004
Wang, S., Yu, Y., Chen, J., and Liu, J. (2023). Impact of climate change on cherry blossom viewing tourism: Analysis and simulation based on Weibo proxy data. Curr. Issues Tour. 26, 718–734. doi: 10.1080/13683500.2022.2049711
Wang, X., and Li, X. (2022). Characteristics and influencing factors of the key villages of rural tourism in China. Acta Geogr. Sin 77, 900–917. doi: 10.11821/dlxb202204009
Wang, X., Dian-Ting, W. U., and Xiao, M. (2006). Industrial development and moving of Chinese economic barycenter. Econ. Geogr. 26, 978–981. doi: 10.15957/j.cnki.jjdl.2006.06.020
Wang, Z., and Shi, W. (2022). Spatial distribution characteristics and influencing factors of China’s beautiful leisure villages. Sci. Geogr. Sin 42, 104–114. doi: 10.13249/j.cnki.sgs.2022.01.010
Xie, X., Zhang, L., Sun, H., Chen, F., and Zhou, C. (2021). Spatiotemporal difference characteristics and influencing factors of tourism urbanization in China’s major tourist cities. Int. J. Environ. Res. Public Health 18:10414. doi: 10.3390/ijerph181910414
Xinge, W., Jianchao, X. I., Dongyang, Y., and Tian, C. (2016). Spatial differentiation of rural touristization and its determinants in China: A geo-detector-based case study of Yesanpo scenic area. J. Resour. Ecol. 7, 464–471. doi: 10.5814/j.issn.1674-764x.2016.06.006
Xinjian, L. I., Tingting, Y. I. N., Shan, L. I., and Changyao, S. O. N. G. (2023). Spatial distribution and influencing mechanism of campsites in China. Econ. Geogr. 43, 205–218. doi: 10.15957/j.cnki.jjdl.2023.05.021
Xu, J., and Wang, P. (2022). Study on distribution characteristic of tourism attractions in international cultural tourism demonstration region in South Anhui in China. PLoS One 17:e0269948. doi: 10.1371/journal.pone.0269948
Yu, P., Zhang, J., Wang, Y., Wang, C., and Zhang, H. (2020). Can tourism development enhance livelihood capitals of rural households? Evidence from Huangshan National Park adjacent communities, China. Sci. Total Environ. 748:141099. doi: 10.1016/j.scitotenv.2020.141099
Zhang, C., and Yang, B. (1984). Fundamentals of Quantitative Geography. Beijing: Higher Education Press, 28–54.
Zhang, S. Y., Liu, J. M., Song, C., Chan, C. S., Pei, T., Yu, W. T., et al. (2021). Spatial-temporal distribution characteristics and evolution mechanism of urban parks in Beijing, China. Urban For. Urban Greening 64:127265. doi: 10.1016/j.ufug.2021.127265
Zhang, Y. X., Chen, J. W., Zhong, S., and Cao, S. T. (2021). A Study on narrative of cherry blossom landscape of Wuhan University based on the grounded theory. Geogr. Geograph. Information Sci. 37, 135–140. doi: 10.3969/j.issn.1672-0504.2021.06.019
Keywords: cherry blossom scenic spots, spatial-temporal distribution, spatial analysis, ArcGIS, geographical detector, sentiment perception measurement
Citation: Peng H, Li P, Zhang X, Han Y, Sun R and Zhang C (2025) Spatial-temporal distribution characteristics, species selection, and influencing factors of cherry blossom scenic spots in China. Front. For. Glob. Change 8:1553808. doi: 10.3389/ffgc.2025.1553808
Received: 16 January 2025; Accepted: 05 May 2025;
Published: 30 May 2025.
Edited by:
Matthew Sloggy, Pacific Southwest Research Station, Forest Service (USDA), United StatesReviewed by:
Aleksandar Valjarević, University of Belgrade, SerbiaHanxi Wang, Harbin Normal University, China
Copyright © 2025 Peng, Li, Zhang, Han, Sun and Zhang. This is an open-access article distributed under the terms of the Creative Commons Attribution License (CC BY). The use, distribution or reproduction in other forums is permitted, provided the original author(s) and the copyright owner(s) are credited and that the original publication in this journal is cited, in accordance with accepted academic practice. No use, distribution or reproduction is permitted which does not comply with these terms.
*Correspondence: Chunyan Zhang, emhhbmdjaHVueWFuQHRqdS5lZHUuY24=