Abstract
Inner Mongolia’s vegetation dynamics are critical for understanding regional ecological responses to climate change. This study investigates the spatiotemporal patterns of the Normalized Difference Vegetation Index (NDVI) during the growing season (1999–2019) and explores its relationship with climatic factors to predict future vegetation changes. Using MODIS monthly NDVI products and meteorological data, we analyzed NDVI trends across Inner Mongolia’s distinct vegetation zones. Statistical methods (e.g., trend analysis, correlation tests) were applied to assess spatial-temporal NDVI variations and climate linkages, with significance thresholds set at p < 0.05 and p < 0.01. NDVI exhibited a northeast-to-southwest decline, reflecting regional vegetation gradients. Growing-season NDVI increased significantly (p < 0.05), with summer NDVI rising markedly (p < 0.01; +0.0022/yr). Precipitation significantly increased over 21 years, while temperatures remained stable. NDVI-climate correlations were spatially heterogeneous, with precipitation as the dominant vegetation growth factor. The findings highlight precipitation’s pivotal role in shaping Inner Mongolia’s vegetation dynamics. The stable temperature but increasing precipitation suggests a shift toward wetter conditions, potentially enhancing grassland productivity. These insights enable predictive modeling of vegetation responses to future climate variability, supporting regional ecological management.
1 Introduction
Vegetation plays a pivotal role in linking climate, hydrology, soil material, and energy cycles (Xu et al., 2022; Zhang et al., 2022; Lin et al., 2020). In the context of both global and regional climate change, vegetation serves as a sensitive indicator, reflecting and characterizing ecosystems’ responses to climatic variations. This provides valuable information for ecological conservation and environmental management (Wang et al., 2020; Gao et al., 2019; Liu et al., 2015; Hou et al., 2015; Li et al., 2015; Novillo et al., 2019). Among climatic factors, temperature and precipitation are the most influential drivers of vegetation growth, development, and reproduction, as they alter the environmental conditions to which vegetation is exposed, thereby shaping its phenology (Sun and Qin, 2016; Ning et al., 2015). Meanwhile, the irregularity of human activities introduces uncertainty into vegetation growth and development (Bao et al., 2014). Understanding vegetation dynamics has become a focal area in global change research, contributing to a deeper understanding of the interplay between vegetation cover, climate change, and human activities (Chuai et al., 2013; Forkel et al., 2013).
The Normalized Difference Vegetation Index (NDVI) is an effective tool for quantifying vegetation growth and revealing spatial patterns of vegetation (Song, 2023). Advances in remote sensing technologies and statistical modeling have continuously refined the methodologies for investigating the relationship between vegetation, climate change, and human activities. Numerous studies utilizing the NDVI and statistical models have yielded significant conclusions across various fields. For instance, Dagnachew et al. (2020) investigated the interannual and seasonal spatiotemporal variations of NDVI and their responses to climatic factors in the Gojeb River Basin from 1982 to 2015. The Sen’s slope trend analysis revealed a significant decrease in annual NDVI, particularly in the southeastern and western parts of the catchment, while a notable increase was observed in the northern and some other sections of the catchment. Spatially, a positive correlation between annual NDVI and rainfall was found across almost all parts of the catchment during the study period. Bagherzadeh et al. (2020) analyzed the correlation between NDVI and temperature and precipitation at the interannual scale in northeastern Iran from 1987 to 2016. The results indicated that the NDVI of all vegetation types in northeastern Iran was closely related to fluctuations in annual precipitation, with the NDVI of vegetation in fertile regions being most significantly influenced by precipitation (Bagherzadeh et al., 2020). Chen et al. (2020) quantified NDVI trends in the Han River Basin (2001–2018), identifying an overall annual increase of 0.0046, though urban areas experienced significant declines (Chen et al., 2020). Meera Gandhi (2019) utilized NDVI thresholds to classify vegetation types and forecast natural hazards (Gandhi et al., 2015). Baniya et al. (2018) analyzed NDVI trends in Nepal (1982–2015), reporting a positive correlation with temperature but a negative correlation with precipitation (Baniya et al., 2018). Zhao et al. (2018) examined vegetation responses to extreme climate events on the Loess Plateau (1982–2013), revealing a significant increase in vegetation cover (0.025/10a) and correlations with temperature extremes (Zhao et al., 2018). Similarly, Zhang et al. (2022) investigated NDVI variations in the Qinling region (1982–2015), identifying precipitation, soil type, and elevation as primary influencing factors, while human activity had a limited effect (Zhang et al., 2022). Guo et al. (2020) assessed NDVI variability across Inner Mongolia (1982–2015), highlighting spatial heterogeneity, time-lag effects, and the dominant role of temperature and precipitation (Guo et al., 2020). Recent studies further underscore regional complexities. Xue et al. (2023) identified significant NDVI increases across most vegetation types in Guizhou Province (2000–2021), with spatial variations linked to topography and urbanization (Xue et al., 2023). Han et al. (2022) examined NDVI responses to climate factors in Anhui Province, revealing spatial heterogeneity, a stronger influence of precipitation than temperature, and an overall upward NDVI trend over 19 years. Despite these advancements, several challenges remain in understanding vegetation dynamics. The complex interplay of climate change, human activities, and topographic factors introduces uncertainties in NDVI-based analyses. Additionally, spatial and temporal inconsistencies in remote sensing data, methodological differences, and varying ecological conditions complicate cross-regional comparisons. Addressing these challenges requires integrating multi-source datasets, refining modeling approaches, and improving long-term observational consistency. Therefore, future vegetation dynamics are expected to exhibit a relatively stochastic pattern, with temperature likely exerting a greater influence on NDVI than precipitation (Han et al., 2022).
As one of the region’s most sensitive to global climate change, Inner Mongolia features a fragile ecological environment and serves as a critical ecological barrier in northern China (Wei et al., 2022; Li et al., 2022). Its vegetation is distributed along a gradient of temperature and precipitation, transitioning from forests in the northeast to grasslands and deserts in the southwest (Zhao et al., 2023; Guo et al., 2021). Accounting for about one-quarter of China’s grassland area, Inner Mongolia’s grassland resources are abundant yet increasingly threatened by land reclamation, overgrazing, and other human activities, leading to shrinking grasslands and declining vegetation cover (Liu M. et al., 2019).
Given these challenges, an in-depth investigation of NDVI patterns and their responses to climatic factors is crucial for understanding terrestrial ecosystem dynamics and promoting sustainable development in Inner Mongolia. This study examines NDVI patterns and their responses to climatic factors at both interannual and intra-annual scales, specifically focusing on different seasons within the growing period—spring (April–May), summer (June–August), and autumn (September–October)—to provide a more nuanced understanding of vegetation-climate interactions in Inner Mongolia. The primary objectives of this study are: (a) to investigate the seasonal trends and spatial distribution of NDVI in Inner Mongolia from 1999 to 2019; (b) to examine the spatial characteristics of climatic factors (temperature and precipitation) in Inner Mongolia from 1999 to 2019; (c) to analyze the response relationships between NDVI and climatic factors (temperature and precipitation) in Inner Mongolia from 1999 to 2019, and to identify the primary driving factors influencing NDVI variations in the region.
2 Materials and methods
2.1 Study area
The Inner Mongolia Autonomous Region (IMAR) is situated along the northern border of China (37°24′–53°02′N, 97°12′–126°04′E), extending in a strip from northeast to southwest. Covering a land area of 1.183 million km2, Inner Mongolia contains China’s largest natural grassland, which accounts for approximately 58% of the region’s total area (Na et al., 2018; Kang et al., 2021; Luo et al., 2022). The region lies at a high altitude, with an average elevation exceeding 1,000 m. The terrain gradually slopes downward from west to east and from south to north.
Located deep within the Eurasian continent and far from the ocean, Inner Mongolia experiences a temperate continental monsoon climate. The average annual temperature ranges from −5°C to 10°C, increasing from northeast to southwest (Sun and Qin, 2016). Precipitation is low, with significant spatial variation: average annual rainfall ranges from 35 to 530 mm, decreasing from northeast to southwest, while potential evapotranspiration is high, ranging from 1,200 to 3,200 mm annually and increasing from east to west.
Based on variations in precipitation, temperature, and geographic location, the region’s vegetation types transition from bright coniferous forests and summer green broadleaf forests in the northeast to grasslands and sparsely vegetated desert areas in the southwest (Kui et al., 2023) (Figure 1).
Figure 1
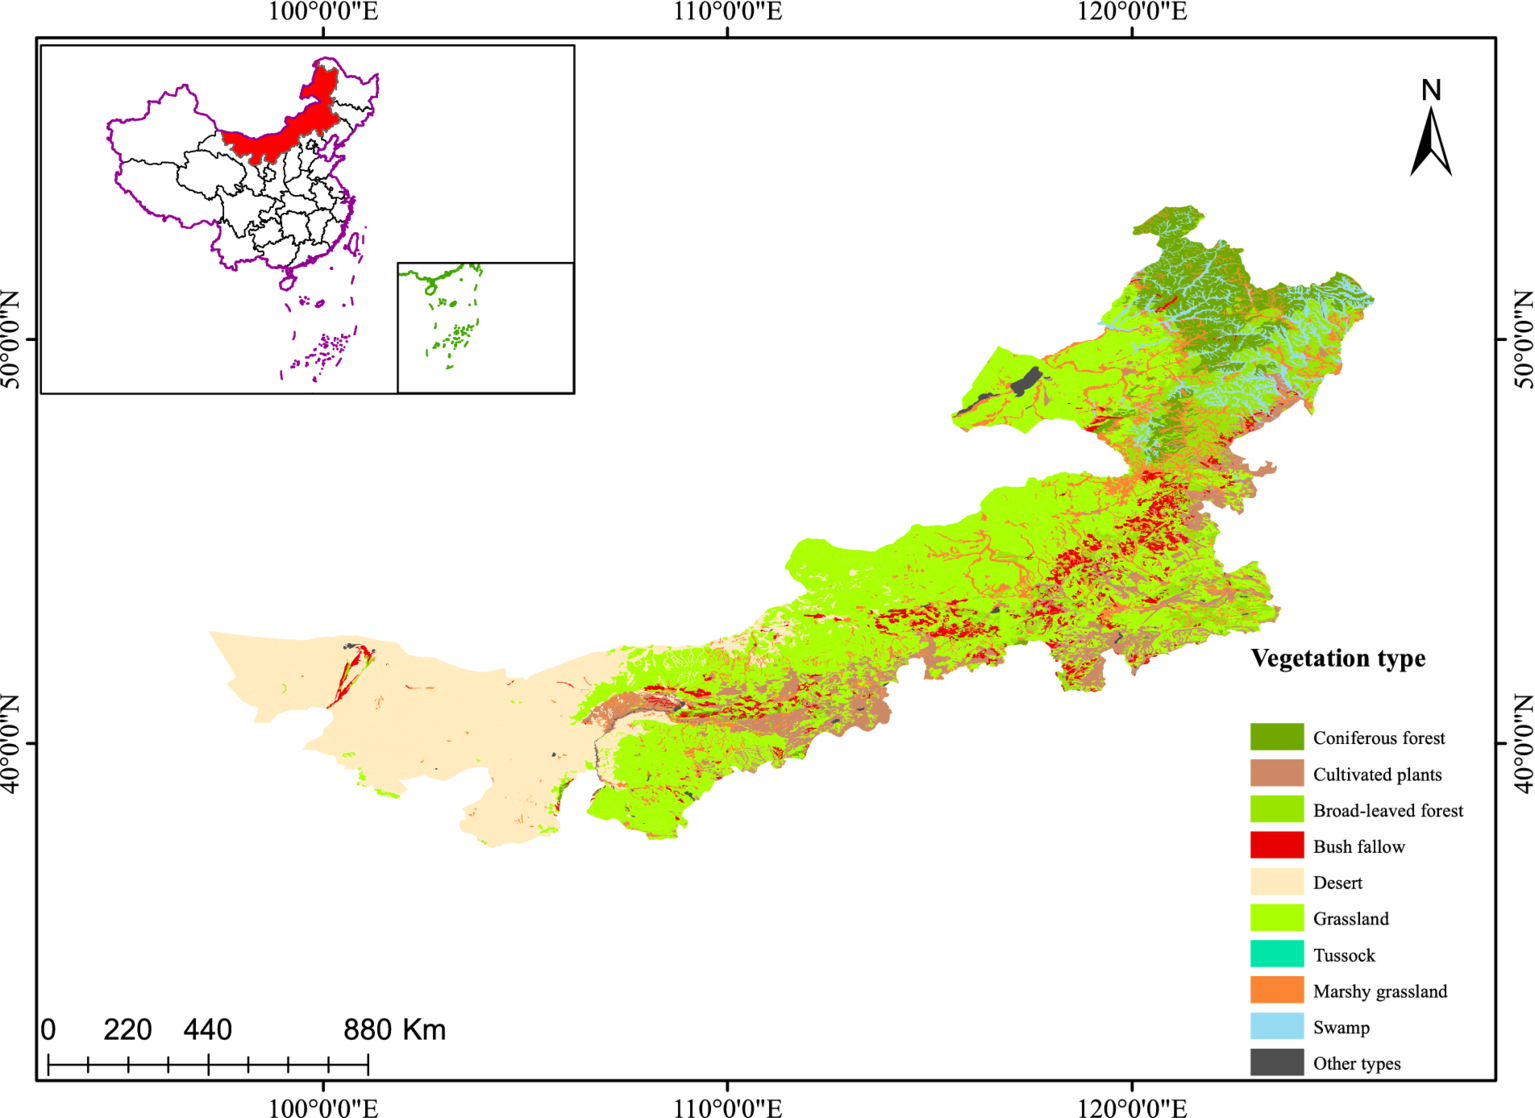
Vegetation distribution map of Inner Mongolia.
2.2 Data sources
This study utilized monthly synthetic NDVI products obtained from the Chinese Academy of Sciences’ Center for Resource and Environmental Science and Data.1 The dataset spans from January 1999 to December 2019, with a temporal resolution of 1 month and a spatial resolution of 1 km. Using the mean synthesis method, monthly and annual NDVI datasets were generated through vector boundary cropping within the study area using ArcGIS 10.4, effectively capturing inter-annual vegetation changes and growth patterns.
Meteorological datasets, including monthly air temperature, precipitation, and evapotranspiration across China from January 1999 to December 2019, were sourced from the National Earth System Science Data Center.2 These datasets were derived from the CRU’s global 0.5° climate data and WorldClim’s high-resolution climate data, with regional downscaling for China performed using the Delta spatial downscaling method. The reliability of these datasets was ensured through validation against observations from 496 independent meteorological stations.
To align the meteorological data with the NDVI dataset, vector boundary cropping was applied to the meteorological raster data using ArcGIS. Masks with the same pixel size and projection as the NDVI data were then extracted, ensuring consistency across datasets.
2.3 Calculation of NDVI trends
To analyze long-term trends in the dataset, a one-way linear regression analysis was conducted for each pixel. The processing of seasonal NDVI data was conducted based on the phenological characteristics of vegetation in Inner Mongolia, with the data segmented into three distinct seasons: spring (April–May), summer (June–August), and autumn (September–October). The average NDVI for each season was calculated by deriving the mean value from the NDVI data of the corresponding months, thereby obtaining the average NDVI values for spring, summer, and autumn, respectively.
This approach enabled the calculation of trends in NDVI, annual precipitation, annual mean temperature, and annual aridity across Inner Mongolia from 1999 to 2019. The trend calculation was performed used the following formula (Equation 1) (Stow et al., 2003):
where i represents the sequential year number, ranging from 1 to 21, while NDVIi denotes the mean NDVI value for the ith year. The parameter n corresponds to the total number of years in the study, spanning from 1999 to 2019 (21 years). The term slope indicates the rate of change for a single pixel element and is classified into three categories based on the results: an ascending trend (slope > 0), a descending trend (slope < 0), and a stable trend (slope = 0).
The statistical significance of the NDVI time-series trends was evaluated using Pearson’s correlation test. The trend results were further analyzed at the 95% confidence level (p < 0.05) to determine their significance.
2.4 Calculation of correlation between NDVI and climate factors
A spatial correlation analysis between NDVI and meteorological factors during the vegetation growing season was conducted on a pixel-by-pixel basis. This analysis aimed to determine the existence and strength of the relationship between climatic factors and NDVI during the growing season. The calculation was performed using the following formula (Herrmann et al., 2005):
Rxy (Equation 2) represents the correlation; coefficient between variable x and variable y. The terms xi and yi denote the values of these variables in the ith year, while and represent their respective average values. The parameter n corresponds to the total number of years in the analysis, spanning 21 years (1999–2019).
2.5 Aridity index calculation
The Aridity Index (AI) is a crucial metric for assessing the wetness or dryness of a region’s climate and has been extensively applied in climate, hydrology, and vegetation studies. Various methods exist for calculating the Aridity Index, with one of the most commonly used approaches being the ratio of annual potential evapotranspiration to annual precipitation (Zomer et al., 2022; Li et al., 2019). The formula is as follows:
AI (Equation 3) is the Aridity Index, ∑ET₀ the annual potential evapotranspiration (mm), and ∑P the annual precipitation (mm). In China, regions with an Aridity Index (AI) < 1.0 are classified as humid areas, while AI values between 1.0 and 1.5 correspond to semi-humid areas. Similarly, AI values between 1.5 and 4.0 define semi-arid areas, and AI > 4.0 signifies arid region.
3 Results
3.1 Spatial variability of NDVI during the three seasons
The seasonal distribution of vegetation NDVI is illustrated in Figure 2, while Table 1 presents the proportion of different NDVI values across the entire study area for each season. Among the seasons, summer exhibited the highest NDVI values during the growing season. This is attributed to the relatively lower temperatures in spring and fall, while summer’s higher precipitation and favorable temperatures provided optimal conditions for vegetation growth.
Figure 2
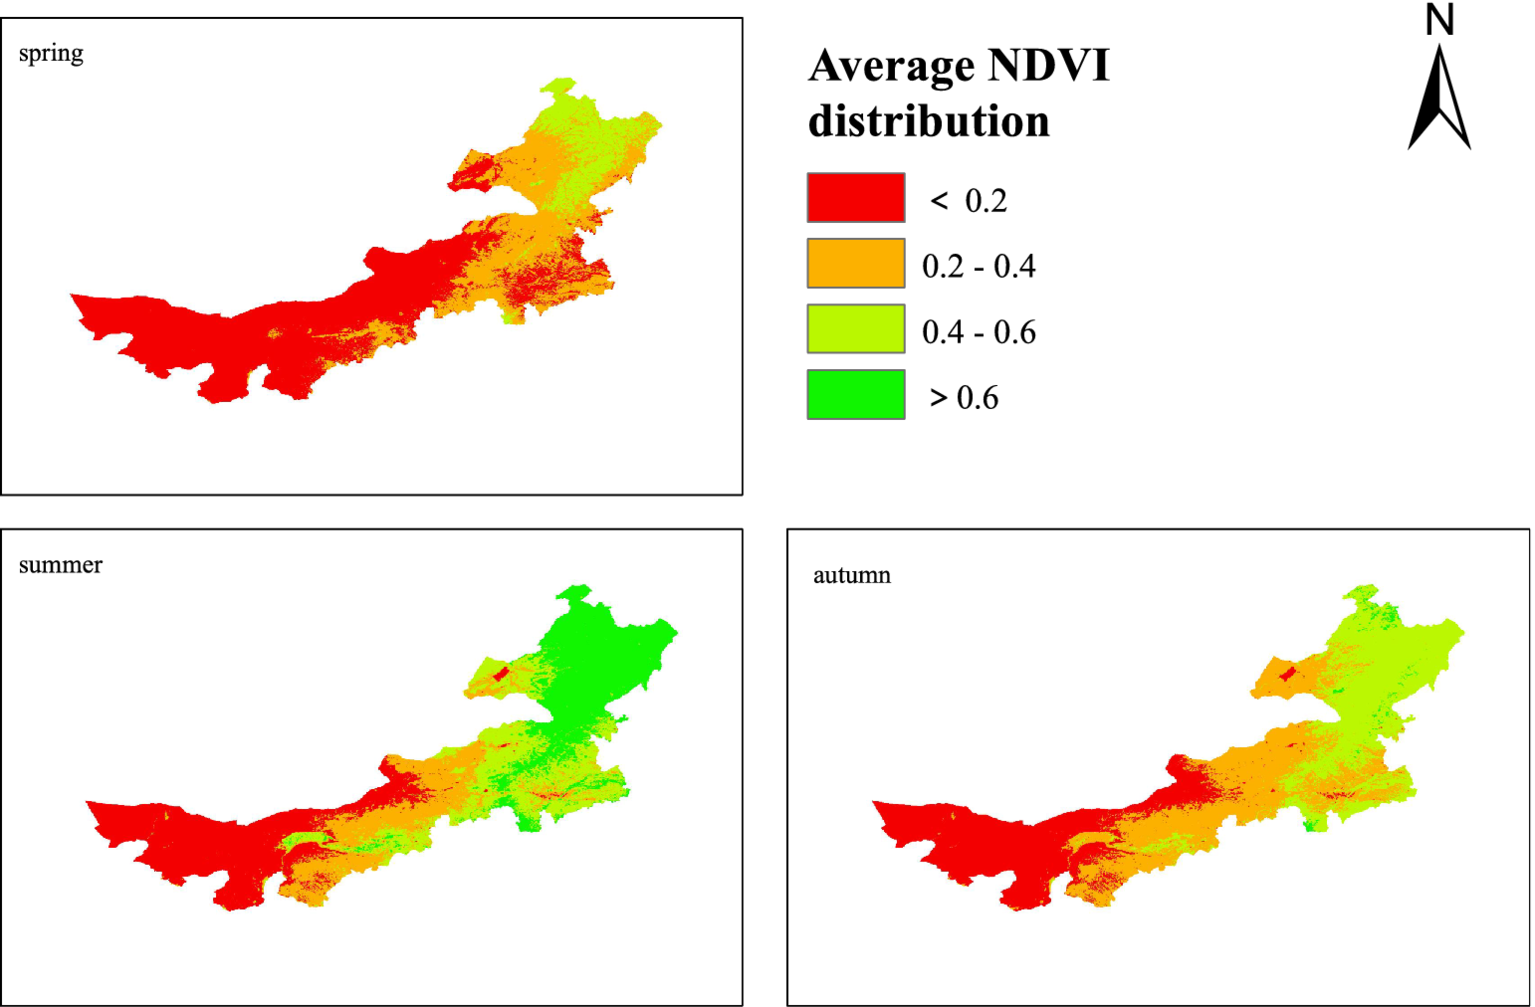
Spatial distribution of mean NDVI during spring, summer, and fall in Inner Mongolia.
Table 1
| NDVI | Image ratio (spring) | Image ratio (summer) | Image ratio (autumn) |
|---|---|---|---|
| <0.2 | 58.7% | 30.8% | 32.8% |
| 0.2–0.4 | 30.5% | 20.7% | 35.9% |
| 0.4–0.6 | 10.8% | 22.5% | 30.3% |
| >0.6 | 0.00% | 26.0% | 0.92% |
Proportion of image elements with NDVI values for in Inner Mongolia.
Overall, the NDVI values in Inner Mongolia displayed significant regional variation, generally decreasing from northeast to southwest. Summer consistently showed higher NDVI values compared to spring and fall. In spring, areas with NDVI <0.2 accounted for the largest proportion of the total area (58.7%) and were predominantly distributed in the western Xilingol League, Chifeng City, Tongliao City, and the Hulun Lake region of Hulunbeier City. The remaining areas exhibited NDVI values >0.2, with NDVI exceeding 0.4 in parts of northeastern and central Hulunbeier City. The spatial distribution of NDVI in summer closely resembled the annual average NDVI pattern, with vegetation NDVI values increasing across all regions. Areas with NDVI >0.6 expanded significantly, covering 26% of the total area. However, with the onset of fall, most vegetation reached the end of its growing season (EOS), resulting in a marked decline in NDVI values. The proportion of areas with NDVI >0.6 sharply decreased from 26.0% in summer to just 0.92% in fall.
3.2 Interannual variability of NDVI
The trends in average NDVI changes during each season from 1999 to 2019 in Inner Mongolia are depicted in Figure 3. The seasonal NDVI trends exhibited overall consistency in their temporal patterns. A sharp decline in NDVI values was observed during the 1999–2001 period, which could be attributed to severe drought events, frequent sandstorms, and excessive grazing activities. In contrast, a significant NDVI recovery occurred between 2009 and 2011, primarily driven by the implementation of ecological restoration policies (including the Returning Farmland to Forest Program and grazing prohibition measures) coupled with increased precipitation levels during this phase.
Figure 3
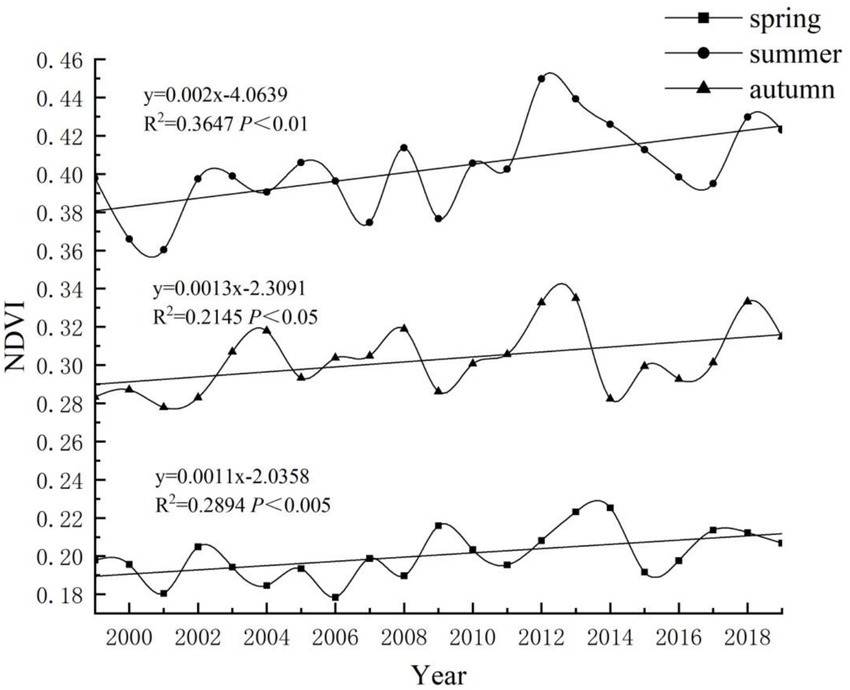
Interannual trends in seasonal average NDVI in Inner Mongolia (1999–2019).
Over the 21-year period, the NDVI values for each season in Inner Mongolia fluctuated consistently and showed an overall increasing trend. The average annual NDVI increases for spring, summer, and fall were calculated to be 0.0011, 0.0022, and 0.0013, respectively. All seasons demonstrated a statistically significant upward trend in NDVI (p < 0.05), with summer showing a highly significant increase (p < 0.01). The highest NDVI values across all seasons were recorded in 2013, while the lowest values occurred in 2001.
3.3 Spatial trends of NDVI by season
The trends in average NDVI in Inner Mongolia for each season, along with their significance, are shown in Figure 4. Overall, the grasslands and forests in Inner Mongolia displayed a significant increasing trend in NDVI. Conversely, desert ecosystems, characterized by harsh environmental conditions and periodic droughts, exhibited a significant decreasing trend in NDVI. Furthermore, the NDVI trends across different bioclimatic zones in Inner Mongolia considerably, largely due to disparities in climatic factors, precipitation patterns, temperature regimes, and land use types. In arid regions, NDVI trends tend to remain stable or decline, as insufficient precipitation leads to low soil moisture, severely restricting vegetation growth. In semi-arid regions, NDVI values are generally higher than those in arid zones, reflecting less constrained vegetation growth. These areas are particularly sensitive to increases in precipitation and temperature variations, often resulting in an upward NDVI trend with higher rainfall. In humid regions, NDVI values are consistently elevated due to abundant precipitation and warmer temperatures, which create optimal conditions for vegetation growth. Additionally, the higher soil moisture content in these regions enhances water and nutrient availability, further supporting robust vegetation development.
Figure 4
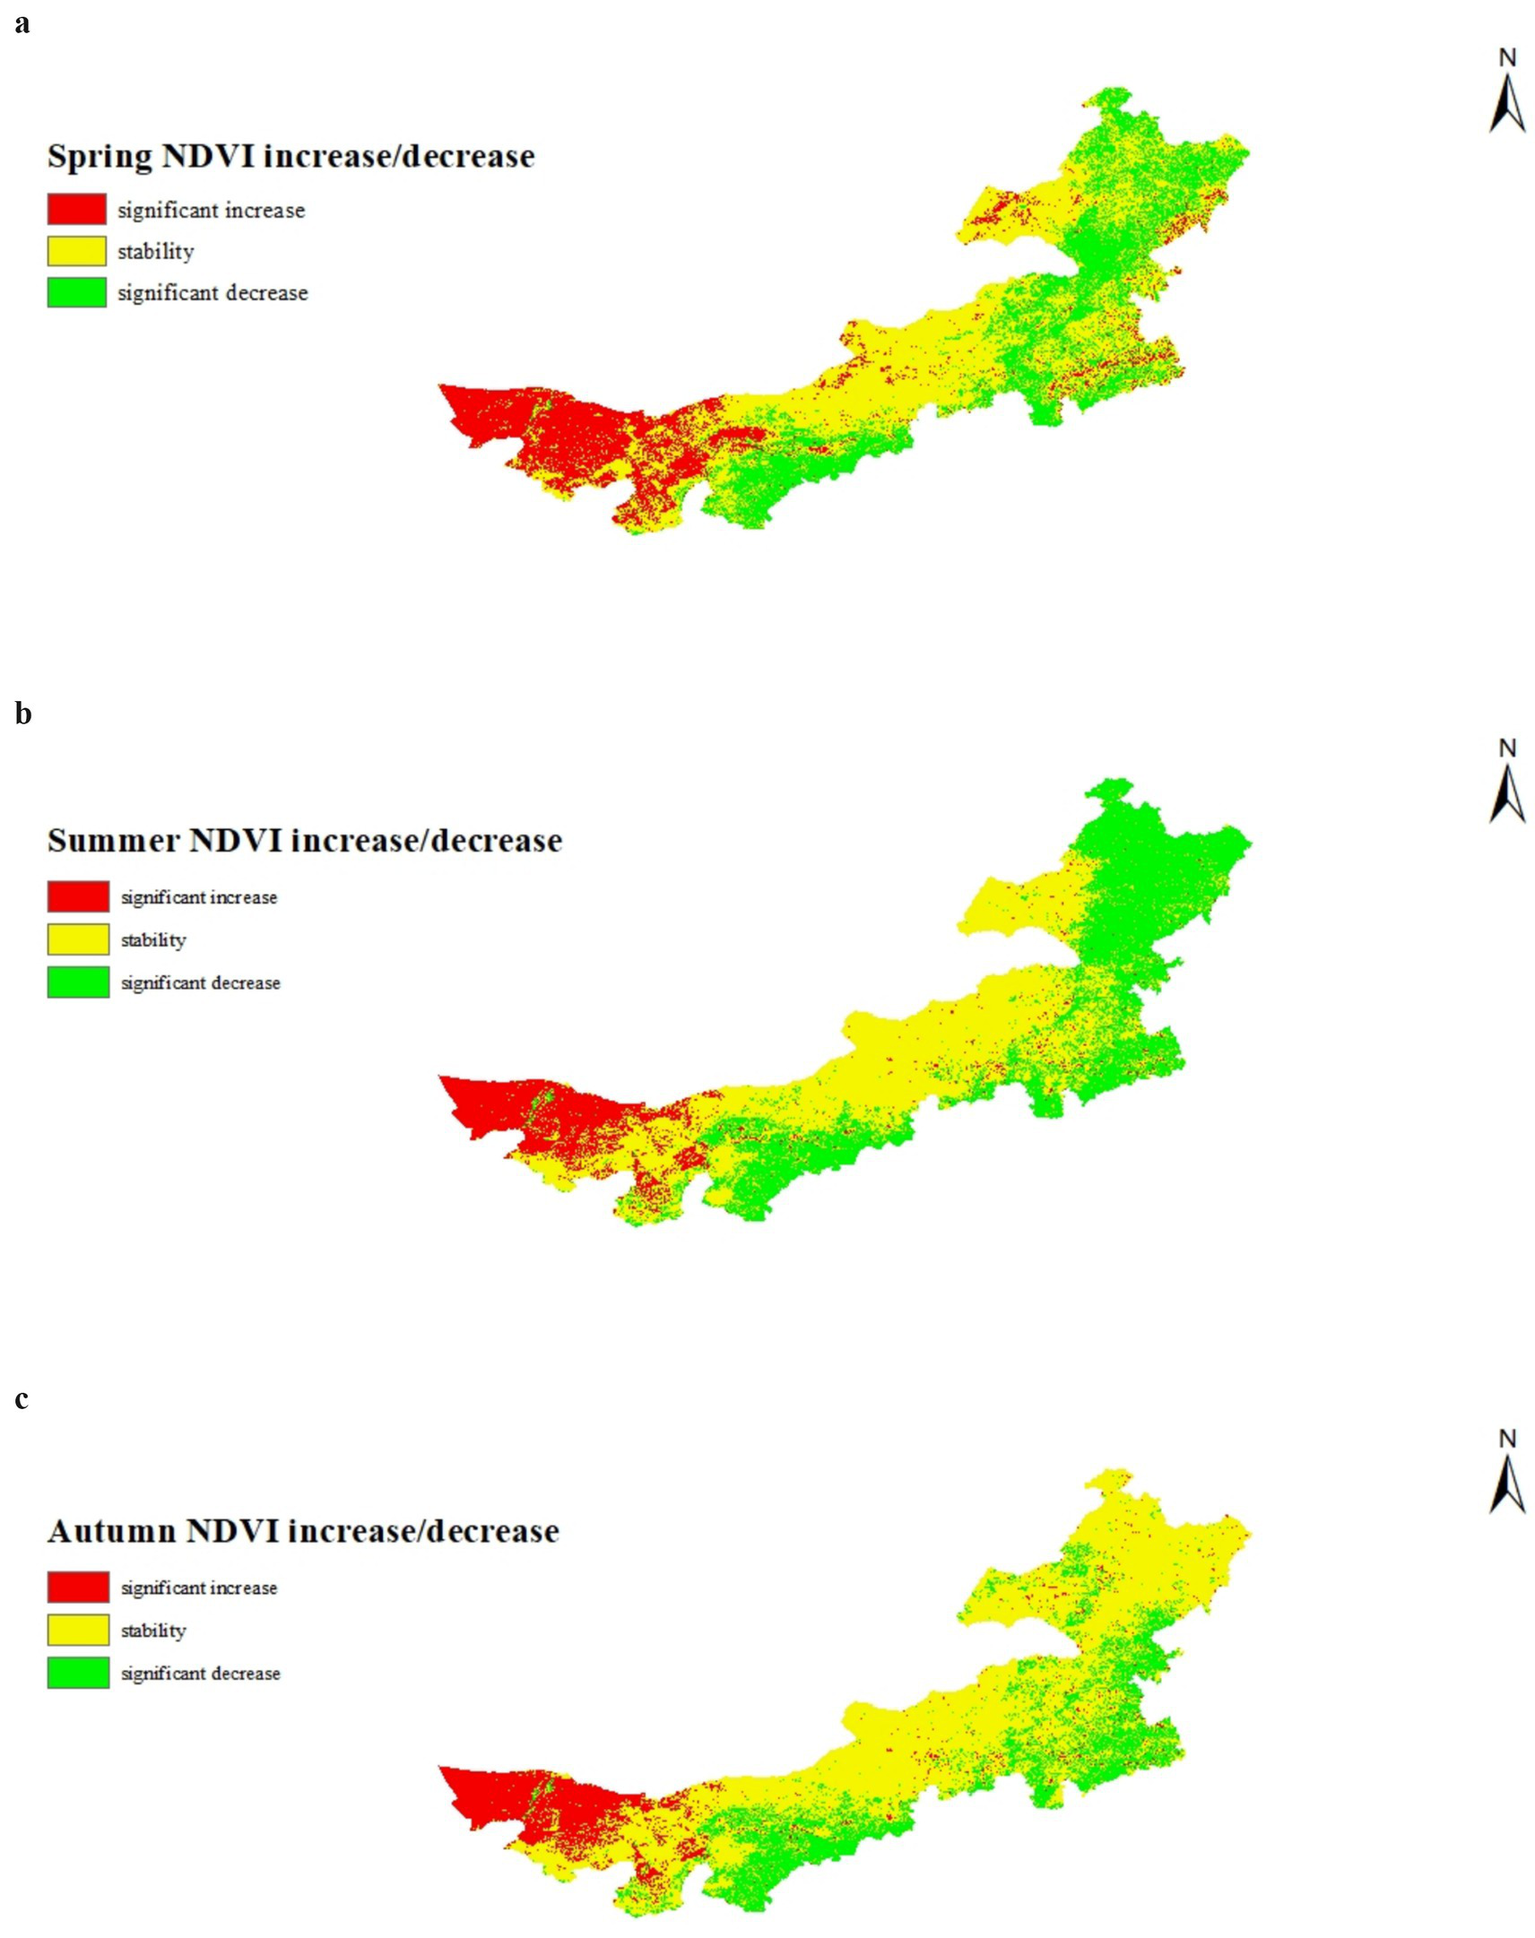
Trends and significance of interannual average NDVI changes in vegetation during spring (a), summer (b), and autumn (c) in Inner Mongolia.
The seasonal NDVI change trends were substantial. In spring, the proportion of areas with increasing NDVI was approximately 55.44%, with about 27.24% being significantly increasing areas. These were mainly distributed in northeastern Inner Mongolia, as well as in Ordos, Hohhot, and surrounding regions. Conversely, areas with decreasing NDVI accounted for 44.56%, with 20.66% being significantly decreasing. These were predominantly located in the southeastern part of Hulunbeier City, central Tongliao City, southwestern Xilin Gol League, and the Alxa League area. In summer, areas with increasing NDVI covered approximately 66.37%, of which 35.41% showed significant increases. The distribution was largely consistent with that of spring. Areas with decreasing NDVI made up 33.63%, with 13.41% being significantly decreasing. These regions were primarily located in Xilin Gol League and Alxa League. In autumn, the proportion of areas with increasing NDVI was about 61.65%, with 21.37% being significantly increasing areas, mainly distributed in eastern Inner Mongolia, Ordos, and Hohhot. Areas with decreasing NDVI comprised 38.35%, with 13.05% being significantly decreasing. These regions were concentrated in the north-central part of Hulunbeier, central Xilin Gol League, northern Bayannur, and Alxa League.
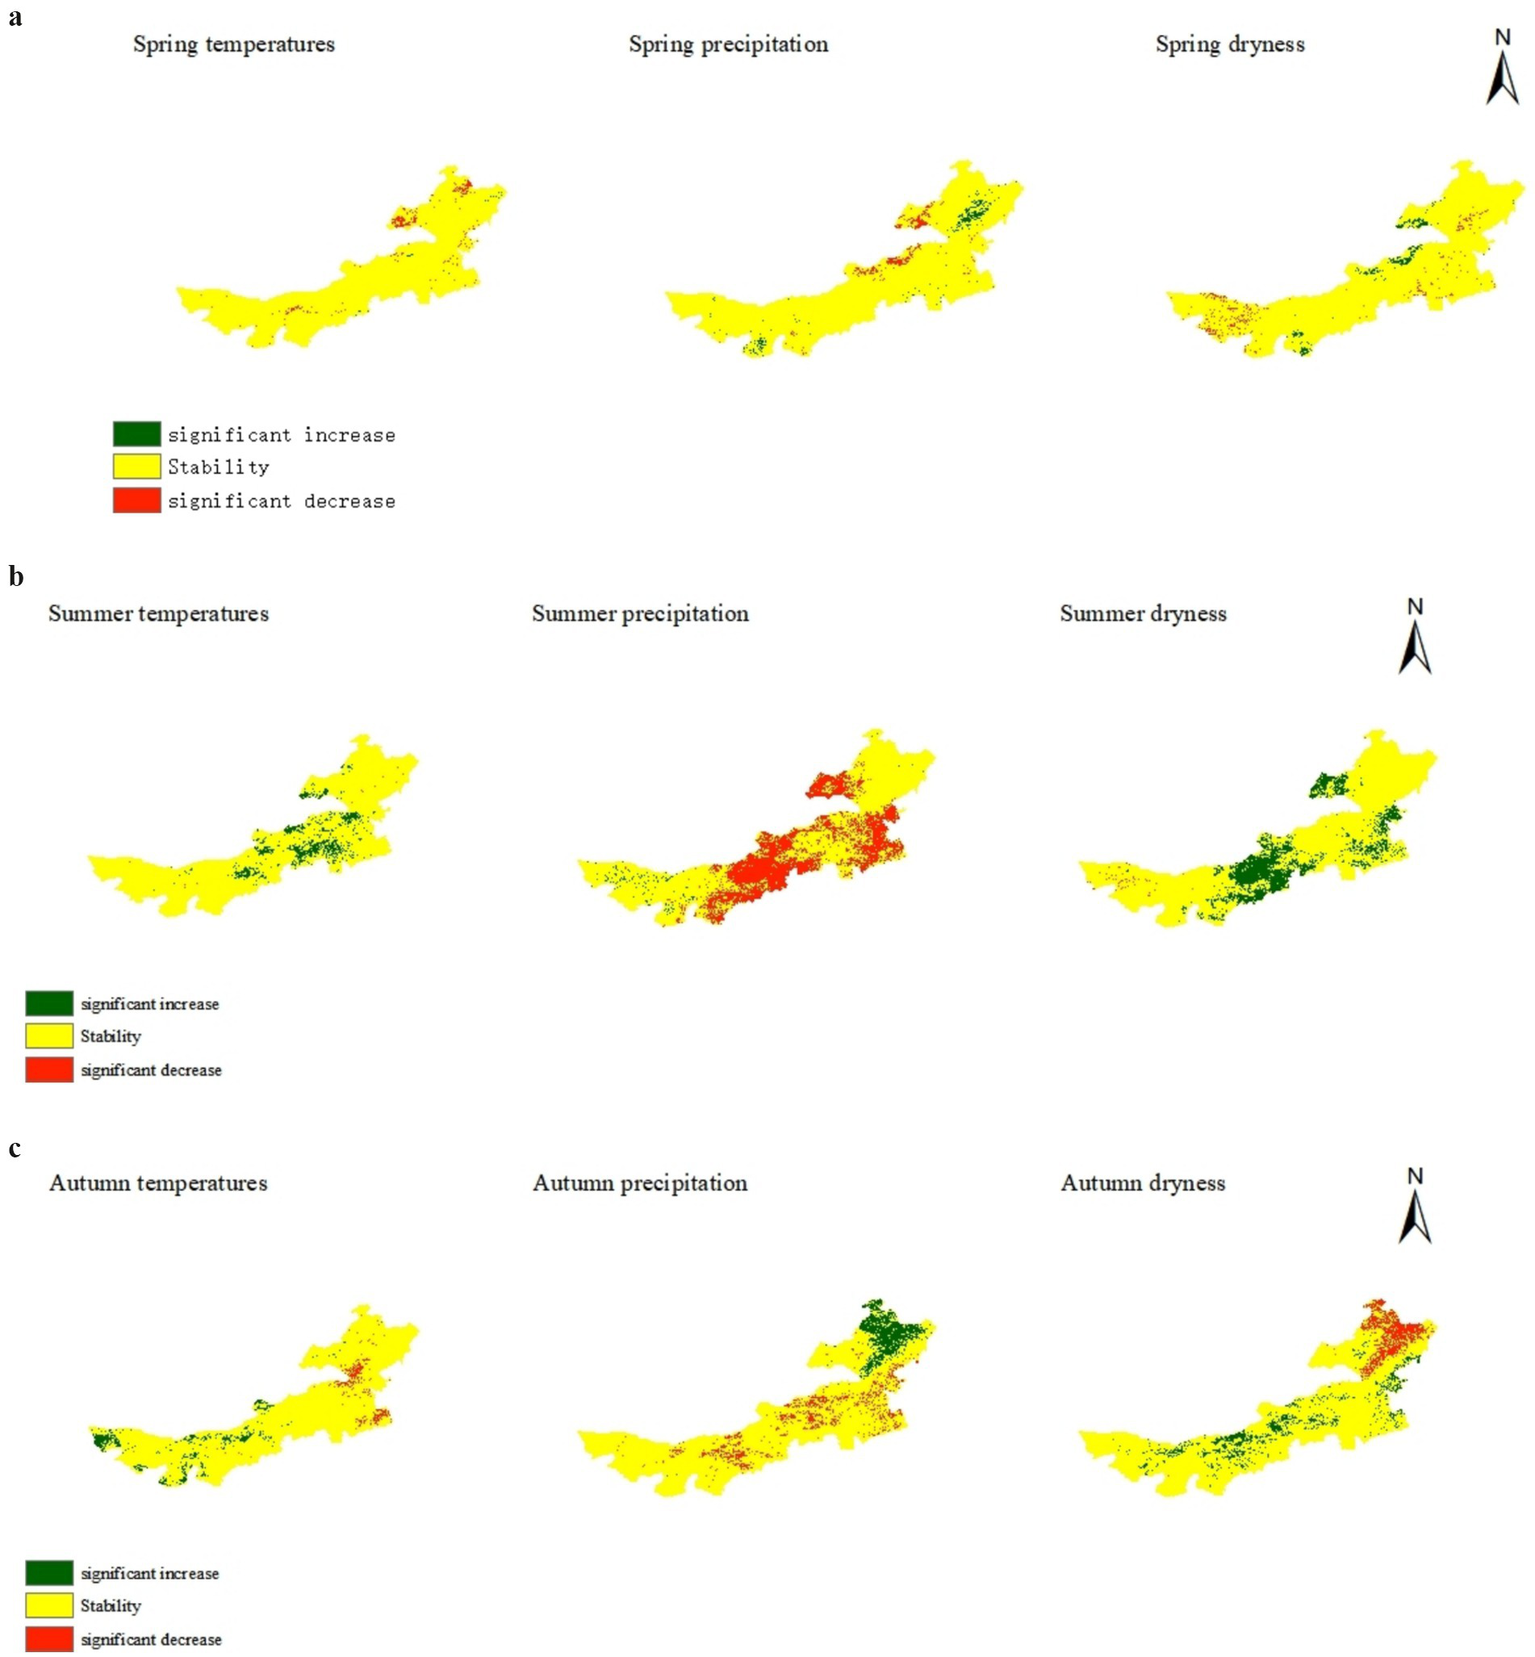
3.4 Spatial patterns of seasonal climatic factors during the growing season
The spatial distribution of average temperature, average precipitation, and average aridity for each season in Inner Mongolia is illustrated in Figure 5. Overall, temperature showed an increasing trend from northeast to southwest, whereas precipitation exhibited the opposite trend. Regarding dryness, the western region of Alxa League experiences a significantly higher aridity index compared to other regions, due to high temperatures, elevated evapotranspiration, and low precipitation. In summer, precipitation is considerably higher than in spring and autumn, coupled with more favorable temperatures. Consequently, the trend of vegetation NDVI increase is most pronounced during this season.
Figure 5
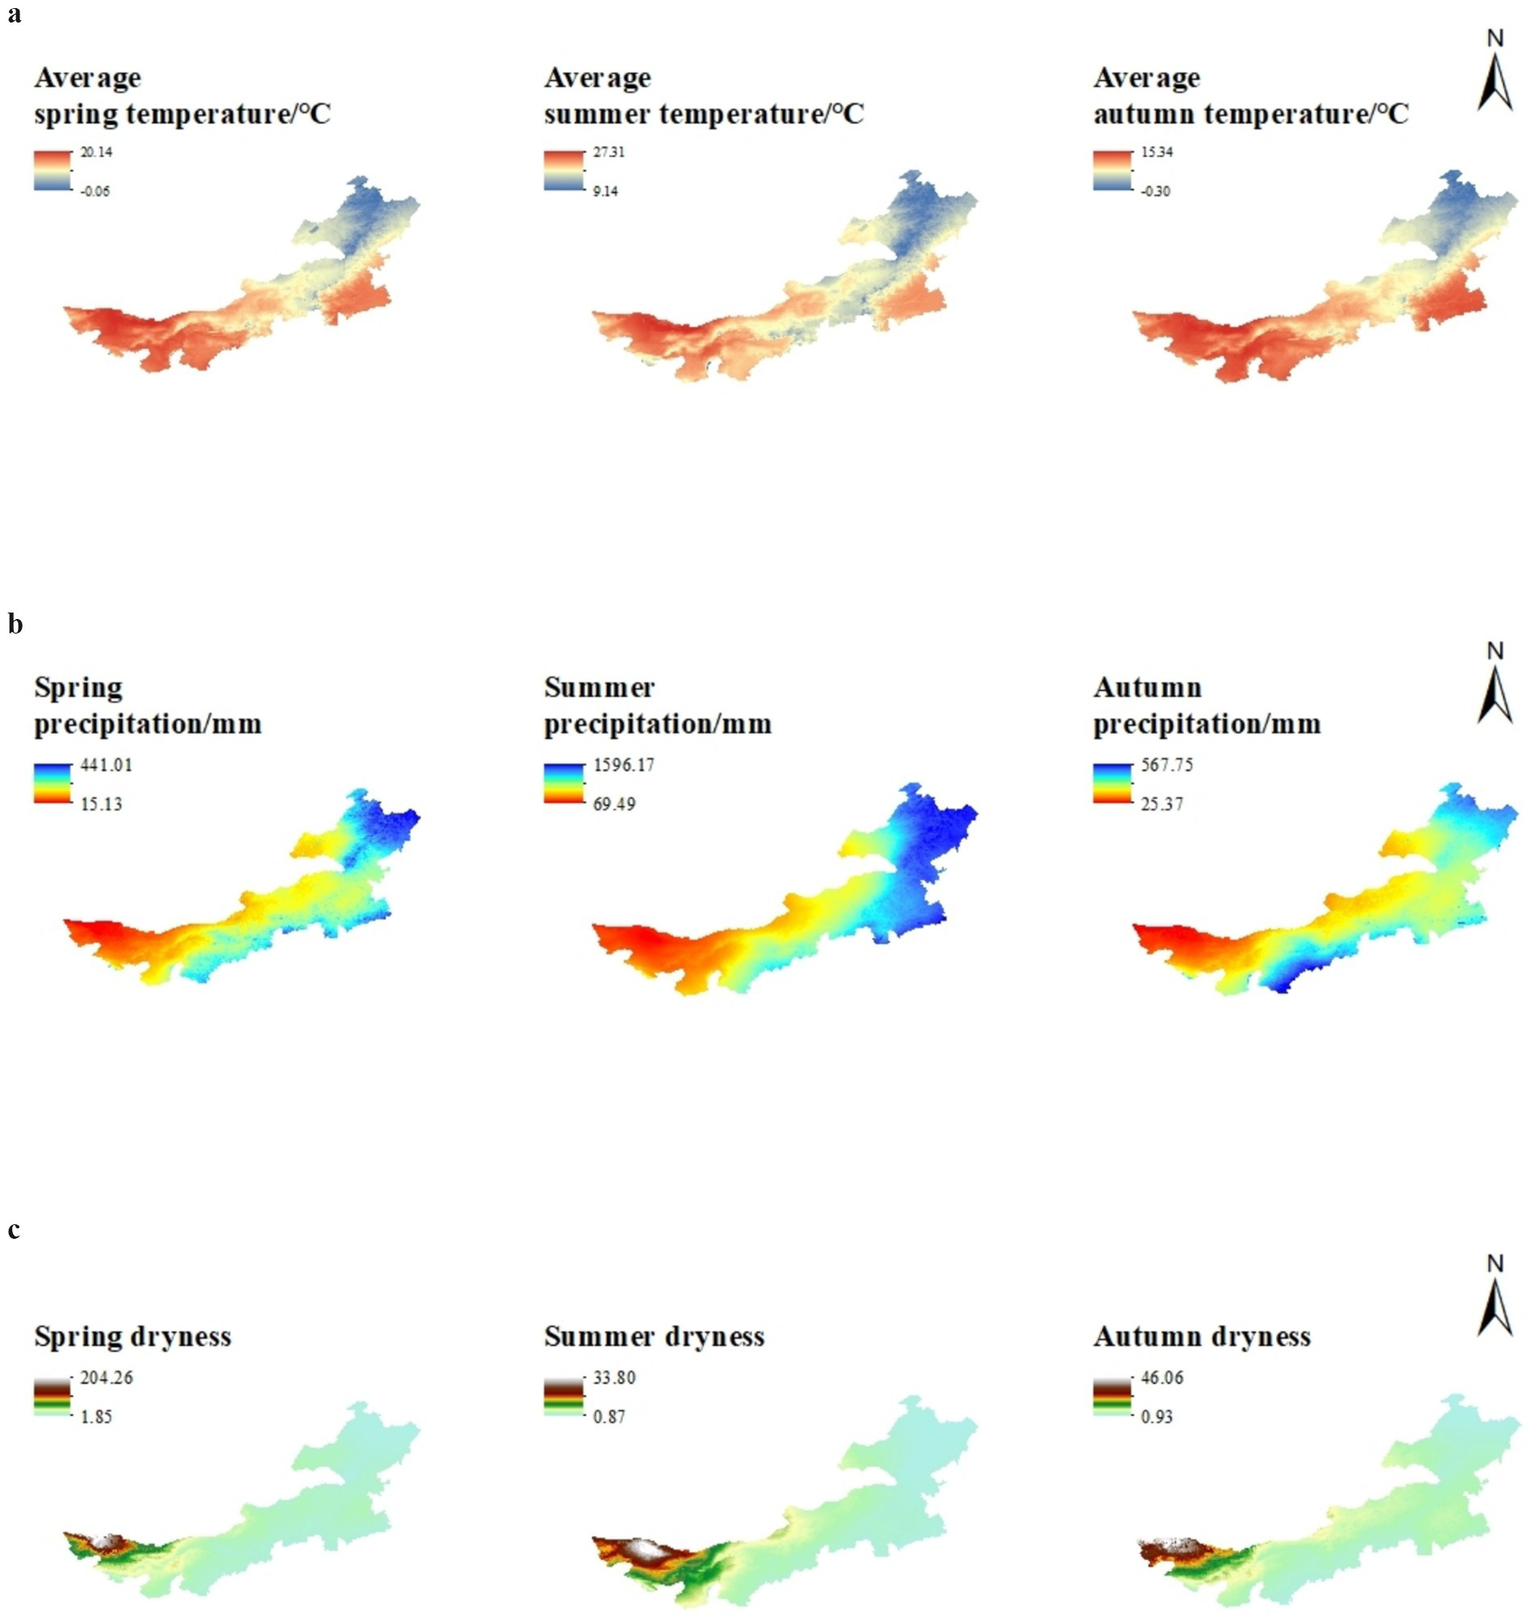
Spatial distribution of temperature (a), precipitation (b), and aridity (c) across seasons in Inner Mongolia.
3.5 NDVI response to climatic factors
The average NDVI for each season was correlated with climatic factors on a metric-by-metric basis, with results presented in Figure 6 and Tables 2–5. The analysis revealed that, overall, only a few areas exhibited statistically significant results (p < 0.05). In summer, NDVI exhibited a positive correlation with precipitation and a negative correlation with both precipitation and temperature. Approximately 32.5% of regions reached statistical significance (p < 0.05), primarily located in western Hulunbeier, southeastern Xing’an League, Tongliao, western Xilin Gol League, Ulanqab, Baotou, and the western parts of Hohhot and Ordos.
Figure 6
Significance distribution of mean NDVI versus climatic factors in spring (a), summer (b), and fall (c) in Inner Mongolia.
Table 2
| Correlation significance | Temperature (pixel scale) | ||
|---|---|---|---|
| Spring | Summer | Autumn | |
| Significantly increase | 0.22% | 8.77% | 5.35% |
| Stability | 97.2% | 91.0% | 91.5% |
| Significantly decrease | 2.57% | 0.18% | 3.07% |
Significance statistics of NDVI and temperature correlation in spring, summer and fall in Inner Mongolia.
Table 3
| Correlation significance | Precipitation (pixel scale) | ||
|---|---|---|---|
| Spring | Summer | Autumn | |
| Significantly increase | 2.37% | 1.08% | 8.41% |
| Stability | 95.1% | 66.4% | 88.2% |
| Significantly decrease | 2.51% | 32.5% | 8.40% |
Significance statistics of NDVI and precipitation correlation in spring, summer and fall in Inner Mongolia.
Table 4
| Correlation significance | Aridity (pixel scale) | ||
|---|---|---|---|
| Spring | Summer | Autumn | |
| Significantly increase | 2.33% | 18.7% | 8.79% |
| Stability | 95.0% | 80.9% | 84.0% |
| Significantly decrease | 2.66% | 0.40% | 7.14% |
Significance statistics of the correlation between NDVI and dryness in spring, summer and fall in Inner Mongolia.
Table 5
| Various seasons | Correlation coefficient | ||
|---|---|---|---|
| Temperature | Precipitation | Aridity | |
| Spring | 0.0366 | −0.0245 | 0.0414 |
| Summer | −0.1271 | 0.2119 | −0.1697 |
| Autumn | −0.0493 | 0.1070 | −0.1322 |
Correlation coefficients between spring, summer, and fall mean NDVI and climatic factors in Inner Mongolia.
Autumn results were similar to those of summer, with NDVI showing a positive correlation with precipitation and a negative correlation with temperature and dryness. Overall, the correlation between mean NDVI and precipitation in Inner Mongolia was higher than that with other climatic factors. NDVI was positively correlated with precipitation in 63.7% of the study area, with 14.5% of the area exhibited a positive correlation (p < 0.05). In contrast, the correlation between NDVI and temperature was weaker, with only 43.8% of the area showing a positive correlation, and just 1.94% of the total area reaching statistical significance (p < 0.05).
As shown in Figure 6, the spatial variability of NDVI responses to precipitation, temperature, and dryness is evident. In northeastern Inner Mongolia, the area with a positive correlation between NDVI and temperature is significantly larger than in other regions, while the area positively correlated with precipitation is smaller. This may be due to the high latitude and cooler temperatures in northeastern Inner Mongolia, where low temperatures impede vegetation growth. As a result, vegetation in this area has a greater dependency on temperature compared to other regions, though precipitation also exerts influence.
In central Inner Mongolia, which consists mainly of grassland, NDVI shows the highest proportion of positive correlation with precipitation and the lowest with temperature. In most regions, NDVI and precipitation demonstrated a significant positive correlation in summer, indicating that precipitation is the primary factor influencing NDVI changes in these areas. Conversely, the western part of Inner Mongolia, characterized by desert regions with persistent dryness and minimal rainfall, also relies on precipitation as a critical factor for vegetation growth. However, its influence is less pronounced compared to other regions.
The positive correlation observed between NDVI and temperature in spring may be attributed to rising temperatures that lead to snowmelt, providing water for vegetation and thereby promoting growth. This highlights the nuanced interplay between climatic factors and vegetation dynamics in Inner Mongolia.
4 Discussion
The Inner Mongolia Autonomous Region, located in the northern border zone of China, is sensitive to climate change. Vegetation in this region is significantly affected by climate variations, exhibiting considerable differences in distribution patterns (Meng et al., 2023; Su et al., 2023; Lu et al., 2019; Wu et al., 2015). Kang et al. (2022) reported that NDVI in Inner Mongolia showed a decreasing trend from 1982 to 2001, followed by an increasing trend after 2001, identifying 2001 as a turning point. This year represented the lowest NDVI value, aligning with the trends observed in this study across in Inner Mongolia. Similarly, Gong’s research highlighted that precipitation exerts the strongest and most significant limitation on vegetation growth in Inner Mongolia, while elevated temperatures accelerate water evaporation and resulting in reduced soil moisture essential for vegetation. These findings are consistent with this study, which emphasizes the key role of precipitation in shaping NDVI dynamics in Inner Mongolia. However, Gong’s study diverges from this paper concerning the correlation between spring precipitation and NDVI. This discrepancy is likely due to differences in the definition of spring: this paper considers April–May, while Gong’s study defined spring as March–April (Gong et al., 2020).
Yang et al. (2019) demonstrated that temperature and precipitation are the main drivers of NDVI in spring, while precipitation dominates in summer and the overall growing season, consistent with this study’s conclusions. However, Yang observed a smaller area of positive correlation between NDVI and precipitation in autumn compared to other seasons, contrasting with the findings of this study. This difference likely arises from variations in spatial scales: Yang’s analysis focused on four grassland types in Inner Mongolia, whereas this study examined the entire region, highlighting the impact of scale on results (Yang et al., 2019). Precipitation is a key driving factor influencing NDVI variations; however, its effect is modulated by soil moisture retention capacity, land use changes, and other climatic factors, such as temperature and wind speed. The degree of influence varies across different regions. In areas with sufficient moisture, NDVI variations are more strongly influenced by temperature and human activities. In arid regions, precipitation is the primary limiting factor for NDVI growth, although the actual impact of precipitation is determined by soil moisture retention capacity. Land use changes, such as grassland restoration and grazing intensity, may either mitigate or amplify the effect of precipitation on NDVI. Future research should further investigate the mechanisms by which precipitation drives NDVI variations in the Inner Mongolia region.
Inner Mongolia hosts the world’s third-largest grassland and serves as China’s most critical timber and livestock region (Liu X. et al., 2019; Pei et al., 2019). Situated within China’s arid and semi-arid zones, its fragile ecosystem is increasingly threatened by desertification, underscoring the need for ecological restoration (Feng et al., 2022; Liu et al., 2018; Wei et al., 2022). The region’s unique geographic location results in low precipitation, frequent droughts, and windy winters and springs, coupled with more intense climate change compared to other parts of China. Changes in vegetation cover effectively reflect climatic changes (Chang et al., 2023; Guo et al., 2014). To better protect and improve Inner Mongolia’s ecological environment, continued research on NDVI dynamics is essential. Beyond climatic factors, human activities also play a crucial role. The interactions between climatic influences and human activities should be considered collectively, emphasizing their synergistic effects.
5 Conclusion
This study analyzed the spatiotemporal patterns of NDVI and their influencing factors in Inner Mongolia from 1999 to 2019, using vegetation NDVI and meteorological data. The main findings are as follows:
-
Temporal trends: over the 21-year study period, both the annual NDVI and the mean NDVI during all growing seasons exhibited a significant increasing trend, primarily driven by enhanced ecological management measures and favorable climatic conditions. The most pronounced increase occurred in summer, largely due to rising temperatures, accumulated heat, and increased precipitation. The highest NDVI value was recorded in 2013, while the lowest occurred in 2001. The average annual growth rate was 0.0026 (p < 0.05).
-
Spatial distribution: the spatial variability of climatic factors across Inner Mongolia has led to distinct regional differences in vegetation NDVI. As a result, NDVI exhibits a decreasing trend from northeast to southwest. Approximately 36% of the region has an NDVI >0.6, with the majority of these high-NDVI areas concentrated in northeastern Inner Mongolia.
-
Climatic influences: in spring, temperature had a stronger correlation with NDVI than precipitation and drought conditions. In contrast, during summer and autumn, precipitation had a more significant impact on NDVI. Notably, during summer, 32.52% of the study area showed a significant positive correlation between precipitation and NDVI. Overall, precipitation emerged as the dominant climatic factor influencing vegetation NDVI in Inner Mongolia, while the role of temperature was relatively less pronounced.
This study provides a qualitative analysis of the relationship between NDVI and climate factors across different seasons in Inner Mongolia. Additionally, vegetation change is a complex process, and the influence of human activities cannot be overlooked. Future research should further investigate and discuss the factors influencing NDVI variations in Inner Mongolia.
Statements
Data availability statement
The original contributions presented in the study are included in the article/supplementary material, further inquiries can be directed to the corresponding author.
Author contributions
JG: Conceptualization, Funding acquisition, Writing – original draft. WL: Data curation, Formal analysis, Investigation, Writing – review & editing. HQ: Resources, Writing – review & editing. YX: Project administration, Writing – review & editing. JW: Project administration, Writing – review & editing. Narisu: Project administration, Writing – review & editing.
Funding
The author(s) declare that financial support was received for the research and/or publication of this article. This work was financially supported by the National Natural Science Foundation of China (32160262) and the Fundamental Research Funds for the Inner Mongolia Normal University (2022JBTD010).
Acknowledgments
We would like to thank the Resource and Environment Science and Data Center and Chinese Meteorological Administration Data Center.
Conflict of interest
The authors declare that the research was conducted in the absence of any commercial or financial relationships that could be construed as a potential conflict of interest.
Generative AI statement
The authors declare that no Gen AI was used in the creation of this manuscript.
Publisher’s note
All claims expressed in this article are solely those of the authors and do not necessarily represent those of their affiliated organizations, or those of the publisher, the editors and the reviewers. Any product that may be evaluated in this article, or claim that may be made by its manufacturer, is not guaranteed or endorsed by the publisher.
References
1
Bagherzadeh A. Hoseini A. V. Totmaj L. H. (2020). Environment the effects of climate change on normalized difference vegetation index (Ndvi) in the northeast of Iran. Modeling Earth Syst Environ6:671. doi: 10.1007/s40808-020-00724-x
2
Baniya B. Tang Q. Huang Z. Sun S. Techato K. A. (2018). Spatial and temporal variation of Ndvi in response to climate change and the implication for carbon dynamics in Nepal. Forests9:329. doi: 10.3390/f9060329
3
Bao G. Qin Z. Bao Y. Zhou Y. Li W. Sanjjav A. (2014). Ndvi-based long-term vegetation dynamics and its response to climatic change in the Mongolian plateau. Remote Sens.6, 8337–8358. doi: 10.3390/rs6098337
4
Chang Y. R. Zhang C. Wei J. C. Li X. J. Ga B. R. (2023). Impacts of climate change and human activities on the net primary productivity of vegetation in Inner Mongolia. Acta Agrestia Sinica31, 3444–3452. doi: 10.11733/j.issn.1007-0435.2023.11.023
5
Chen T. Zou L. Hong S. (2020). Quantifying the influences of natural factors and human activities on Ndvi changes in the Hanjiang River basin, China. Remote Sens.12:3780. doi: 10.3390/rs12223780
6
Chuai X. W. Huang X. J. Wang W. J. Bao G. (2013). Ndvi, temperature and precipitation changes and their relationships with different vegetation types during 1998–2007 in Inner Mongolia, China. Int. J. Climatol.33, 1696–1706. doi: 10.1002/joc.3543
7
Dagnachew M. Kebede A. Moges A. Abebe A. J. A. I. M. (2020). Effects of climate variability on normalized difference vegetation index (NDVI) in the Gojeb River catchment, Omo-Gibe Basin, Ethiopia. Adv. Meteorol.2020:8263246. doi: 10.1155/2020/8263246
8
Feng S. Liu X. Zhao W. Yao Y. Zhou A. Liu X. et al . (2022). Key areas of ecological restoration in Inner Mongolia based on ecosystem vulnerability and ecosystem service. Remote Sens.14:2729. doi: 10.3390/rs14122729
9
Forkel M. Carvalhais N. Verbesselt J. Mahecha M. D. Neigh C. S. Reichstein M. (2013). Trend change detection in Ndvi time series: effects of inter-annual variability and methodology. Remote Sens.5, 2113–2144. doi: 10.3390/rs5052113
10
Gandhi G. M. Parthiban S. Thummalu N. Christy A. (2015). Ndvi: vegetation change detection using remote sensing and Gis – a case study of Vellore District. Procedia Comput Sci57, 1199–1210. doi: 10.1016/j.procs.2015.07.415
11
Gao J. Jiao K. Wu S. (2019). Investigating the spatially heterogeneous relationships between climate factors and Ndvi in China during 1982 to 2013. J. Geogr. Sci.29, 1597–1609. doi: 10.1007/s11442-019-1682-2
12
Gong Z. Kawamura K. Ishikawa N. Goto M. Tuya W. Alateng D. et al . (2020). Vegetation dynamics and phenological shifts in long-term Ndvi time series in Inner Mongolia, China. Japan Agric. Res. Q.54, 101–112. doi: 10.6090/jarq.54.101
13
Guo L. Wu S. Zhao D. Yin Y. Leng G. Zhang Q. (2014). Ndvi-based vegetation change in Inner Mongolia from 1982 to 2006 and its relationship to climate at the biome scale. Adv. Meteorol.2014, 1–12. doi: 10.1155/2014/692068
14
Guo C. Y. Zhao D. S. Zheng D. Zhu Y. (2021). Effects of grazing on the grassland vegetation community characteristics in Inner Mongolia. J. Res. Ecol.12, 319–331. doi: 10.5814/j.issn.1674-764x.2021.03.002
15
Guo L. Zuo L. Gao J. Jiang Y. Zhang Y. Ma S. et al . (2020). Revealing the fingerprint of climate change in interannual Ndvi variability among biomes in Inner Mongolia, China. Remote Sens.12:1332. doi: 10.3390/rs12081332
16
Han W. Chen D. Li H. Chang Z. Chen J. Ye L. et al . (2022). Spatiotemporal variation of Ndvi in Anhui Province from 2001 to 2019 and its response to climatic factors. Forests13:1643. doi: 10.3390/f13101643
17
Herrmann S. M. Anyamba A. Tucker C. J. (2005). Recent trends in vegetation dynamics in the African Sahel and their relationship to climate. Glob. Environ. Chang.15, 394–404. doi: 10.1016/j.gloenvcha.2005.08.004
18
Hou W. Gao J. Wu S. Dai E. (2015). Interannual variations in growing-season Ndvi and its correlation with climate variables in the southwestern karst region of China. Remote Sens.7, 11105–11124. doi: 10.3390/rs70911105
19
Kang Y. Guo E. Wang Y. Bao Y. Mandula N. (2021). Monitoring vegetation change and its potential drivers in Inner Mongolia from 2000 to 2019. Remote Sens.13:3357. doi: 10.3390/rs13173357
20
Kang Y. Guo E. Wang Y. Bao Y. Zhao S. (2022). Spatiotemporal variation in compound dry and hot events and its effects on Ndvi in Inner Mongolia, China. Remote Sens.14:3977. doi: 10.3390/rs14163977
21
Kui G. Shi C. Yang J. Li R. Wei G. Liu J. (2023). Spatial-temporal variations of vegetation coverage and its driving force in Inner Mongolia grassland, China. Yingyong Shengtai Xuebao34:2713. doi: 10.13287/j.1001-9332.202310.005
22
Li S. Li X. Gong J. Dang D. Dou H. Lyu X. (2022). Quantitative analysis of natural and anthropogenic factors influencing vegetation Ndvi changes in temperate drylands from a spatial stratified heterogeneity perspective: a case study of Inner Mongolia grasslands, China. Remote Sens.14:3320. doi: 10.3390/rs14143320
23
Li S. Yang S. Liu X. Liu Y. Shi M. (2015). Ndvi-based analysis on the influence of climate change and human activities on vegetation restoration in the Shaanxi-Gansu-Ningxia region, Central China. Remote Sens.7, 11163–11182. doi: 10.3390/rs70911163
24
Li Y. Yu W. Wang K. Ma X. (2019). Comparison of the aridity index and its drivers in eight climatic regions in China in recent years and in future projections. Int. J. Climatol.39, 5256–5272. doi: 10.1002/joc.6137
25
Lin X. Niu J. Berndtsson R. Yu X. Zhang L. Chen X. (2020). Ndvi dynamics and its response to climate change and reforestation in northern China. Remote Sens.12:4138. doi: 10.3390/rs12244138
26
Liu M. Dries L. Heijman W. Huang J. Zhu X. Hu Y. et al . (2018). The impact of ecological construction programs on grassland conservation in Inner Mongolia, China. Land Degrad. Dev.29, 326–336. doi: 10.1002/ldr.2692
27
Liu M. Dries L. Huang J. Min S. Tang J. (2019). The impacts of the eco-environmental policy on grassland degradation and livestock production in Inner Mongolia, China: an empirical analysis based on the simultaneous equation model. Land Use Policy88:104167. doi: 10.1016/j.landusepol.2019.104167
28
Liu Y. Li Y. Li S. Motesharrei S. (2015). Spatial and temporal patterns of global Ndvi trends: correlations with climate and human factors. Remote Sens.7, 13233–13250. doi: 10.3390/rs71013233
29
Liu X. Tian Z. Zhang A. Zhao A. Liu H. (2019). Impacts of climate on spatiotemporal variations in vegetation Ndvi from 1982–2015 in Inner Mongolia, China. Sustain. For.11:768. doi: 10.3390/su11030768
30
Lu Q. Zhao D. Wu S. Dai E. Gao J. (2019). Using the Ndvi to analyze trends and stability of grassland vegetation cover in Inner Mongolia. Theor. Appl. Climatol.135, 1629–1640. doi: 10.1007/s00704-018-2614-2
31
Luo H. Bie X. Yi G. Zhou X. Zhang T. Li J. et al . (2022). Dominant impacting factors on water-use efficiency variation in Inner Mongolia from 2001 to 2018: vegetation or climate?Remote Sens.14:4541. doi: 10.3390/rs14184541
32
Meng N. Wang N. A. Cheng H. Liu X. Niu Z. (2023). Impacts of climate change and anthropogenic activities on the normalized difference vegetation index of desertified areas in northern China. J. Geogr. Sci.33, 483–507. doi: 10.1007/s11442-023-2093-y
33
Na L. Na R. Zhang J. Tong S. Shan Y. Ying H. et al . (2018). Vegetation dynamics and diverse responses to extreme climate events in different vegetation types of Inner Mongolia. Atmos.9:394. doi: 10.3390/atmos9100394
34
Ning T. Liu W. Lin W. Song X. (2015). Ndvi variation and its responses to climate change on the northern loess plateau of China from 1998 to 2012. Adv. Meteorol.2015, 1–10. doi: 10.1155/2015/725427
35
Novillo C. J. Arrogante-Funes P. Romero-Calcerrada R. J. I. I. (2019). Recent Ndvi trends in mainland Spain: land-cover and phytoclimatic-type implications. ISPRS Int. J. Geo-Inf.8:43. doi: 10.3390/ijgi8010043
36
Pei Z. Fang S. Yang W. Wang L. Wu M. Zhang Q. et al . (2019). The relationship between Ndvi and climate factors at different monthly time scales: a case study of grasslands in Inner Mongolia, China (1982–2015). Sustain. For.11:7243. doi: 10.3390/su11247243
37
Song S. (2023). Spatiotemporal variations of vegetation Ndvi and influencing factors in Heilongjiang Province. Res. Soil Water Conserv.30, 294–305.
38
Stow D. Daeschner S. Hope A. Douglas D. Petersen A. Myneni R. et al . (2003). Variability of the seasonally integrated normalized difference vegetation index across the north slope of Alaska in the 1990s. Int. J. Remote Sens.24, 1111–1117. doi: 10.1080/0143116021000020144
39
Su D. Zhang A. Tian Z. Liu X. Hou Y. (2023). Study on Ndvi periodic change characteristics of Inner Mongolia grassland based on variational mode decomposition algorithm. Atmosphere14:1039. doi: 10.3390/atmos14061039
40
Sun J. Qin X. (2016). Precipitation and temperature regulate the seasonal changes of Ndvi across the Tibetan plateau. Environ. Earth Sci.75, 1–9. doi: 10.1007/s12665-015-5177-x
41
Wang M. Fu J. E. Wu Z. Pang Z. (2020). Spatiotemporal variation of Ndvi in the vegetation growing season in the source region of the Yellow River, China. ISPRS Int. J. Geo Inf.9:282. doi: 10.3390/ijgi9040282
42
Wei Y. Zhu L. Chen Y. Cao X. Yu H. (2022). Spatiotemporal variations in drought and vegetation response in Inner Mongolia from 1982 to 2019. Remote Sens.14:3803. doi: 10.3390/rs14153803
43
Wu J. Zhang Q. Li A. Liang C. (2015). Historical landscape dynamics of Inner Mongolia: patterns, drivers, and impacts. Landsc. Ecol.30, 1579–1598. doi: 10.1007/s10980-015-0209-1
44
Xu Y. Yang Y. Chen X. Liu Y. (2022). Bibliometric analysis of global Ndvi research trends from 1985 to 2021. Remote Sens.14:3967. doi: 10.3390/rs14163967
45
Xue X. Wang Z. Hou S. (2023). Ndvi-based vegetation dynamics and response to climate changes and human activities in Guizhou Province, China. Forests14:753. doi: 10.3390/f14040753
46
Yang J. Wan Z. Borjigin S. Zhang D. Yan Y. Chen Y. et al . (2019). Changing trends of Ndvi and their responses to climatic variation in different types of grassland in Inner Mongolia from 1982 to 2011. Sustain. For.11:3256. doi: 10.3390/su11123256
47
Zhang Y. He Y. Li Y. Jia L. (2022). Spatiotemporal variation and driving forces of Ndvi from 1982 to 2015 in the Qinba Mountains, China. Environ. Sci. Pollut. Res.29, 52277–52288. doi: 10.1007/s11356-022-19502-6
48
Zhao J. Guo E. Wang Y. F. Kang Y. Gu X. L. (2023). Ecological drought monitoring of Inner Mongolia vegetation growing season based on kernel temperature vegetation drought index (ktvdi). Chin. J. Appl. Ecol.34, 2929–2937. doi: 10.13287/j.1001-9332.202311.024
49
Zhao A. Zhang A. Liu X. Cao S. (2018). Spatiotemporal changes of normalized difference vegetation index (NDVI) and response to climate extremes and ecological restoration in the loess plateau, China. Theor. Appl. Climatol.132, 555–567. doi: 10.1007/s00704-017-2107-8
50
Zomer R. J. Xu J. Trabucco A. (2022). Version 3 of the global aridity index and potential evapotranspiration database. Sci. Data9:409. doi: 10.1038/s41597-022-01493-1
Summary
Keywords
Inner Mongolia, normalized difference vegetation index, growing season, precipitation, spatiotemporal change
Citation
Guo J, Liao W, Qimuge H, Xu Y, Wang J and Narisu (2025) Seasonal analysis of spatial and temporal variations in NDVI and its driving factors in Inner Mongolia during the vegetation growing season (1999–2019). Front. For. Glob. Change 8:1555385. doi: 10.3389/ffgc.2025.1555385
Received
04 January 2025
Accepted
20 March 2025
Published
04 April 2025
Volume
8 - 2025
Edited by
Erwin Dreyer, Institut National de recherche pour l’agriculture, l’alimentation et l’environnement (INRAE), France
Reviewed by
Muhammad Shahid, Brunel University London, United Kingdom
Subhanil Guha, National Institute of Technology Raipur, India
Vishakha Sood, Indian Institute of Technology Ropar, India
Updates
Copyright
© 2025 Guo, Liao, Qimuge, Xu, Wang and Narisu.
This is an open-access article distributed under the terms of the Creative Commons Attribution License (CC BY). The use, distribution or reproduction in other forums is permitted, provided the original author(s) and the copyright owner(s) are credited and that the original publication in this journal is cited, in accordance with accepted academic practice. No use, distribution or reproduction is permitted which does not comply with these terms.
*Correspondence: Jinting Guo, guojinting0517@163.com
Disclaimer
All claims expressed in this article are solely those of the authors and do not necessarily represent those of their affiliated organizations, or those of the publisher, the editors and the reviewers. Any product that may be evaluated in this article or claim that may be made by its manufacturer is not guaranteed or endorsed by the publisher.