Abstract
Introduction:
Terrestrial forest ecosystems in northern high-latitude regions are crucial to the global carbon cycle and climate system but vulnerable to climate change. Global warming has contributed to increased forest decay and mortality in this region. Despite decades of research on temporal variability, the long-term stability and regional representativeness of resilience components remain poorly understood, limiting our ability to predict future forest resilience. Hence, this study aimed to examine past extreme tree-growth reduction (EGR) events and the associated resilience components across northern high-latitude regions.
Methods:
This study estimated the past EGR events and associated resilience components using the tree-ring width index (RWI) data from 523 International Tree-Ring Data Bank (ITRDB) sites across the northern high-latitude regions and analyzed the spatial and temporal variations in resilience.
Results:
No significant regional differences were found in the frequency of EGR events over the past several hundred years; however, the resilience components exhibited large spatial variations with significant regional differences. The regional-averaged resilience (Rs) over the entire analysis period was lower in Canada than in Alaska, Eurasia, or Europe, suggesting a possible higher vulnerability to EGR events in Canada.
Discussion:
The high vulnerability in Canada was not attributed to the large reduction in growth during the EGR event but to the small amount of recovery (Rc) after the event. As almost no significant temporal changes were observed with respect to regional differences in the resilience components over the four analysis periods, that is, (i) pre-1700, (ii) 1701–1800, (iii) 1801–1900, and (iv) post-1900, the resilience components estimated in this study could be considered as representative values for each region, and the pattern of regional difference remained relatively consistent from the past to the present and likely into the future. These results are crucial to understand future tree and forest dynamics in the high latitudes of the Northern Hemisphere, particularly regarding risks associated with tree decline and mortality due to climate extremes and other disturbance factors.
1 Introduction
Forest ecosystems cover 31% of the global land area and provide essential socioeconomic services, including timber supply, carbon storage, and biodiversity maintenance (FAO and UNEP, 2020). Since the early 1970s, global forest ecosystems have experienced varying warming rates. In particular, warming rates across northern high-latitude regions have exceeded those observed elsewhere on Earth. This phenomenon, known as Arctic amplification (Serreze and Barry, 2011), exhibits a potentially significant impact on forest ecosystems (Tei et al., 2019a,b).
Global warming has driven the increase in forest decay and mortality (van Mantgem et al., 2009; Allen et al., 2015; Tei et al., 2019a), and this increase has a strong climate-feedback potential (Adams et al., 2010; Allen et al., 2010). Forest decay and mortality can alter ecosystem structure and function (Millar and Stephenson, 2015; Anderegg et al., 2016), resulting in ecotone shifts (Allen and Breshears, 1998), reduced carbon storage (Breshears and Allen, 2002; Kurz et al., 2008), and altered hydrology (Newman et al., 2006). While reports indicate forest decay and mortality caused by climate extremes, such as severe drought or heavy rainfall (Tei et al., 2019a,b), a more comprehensive understanding of forest decay and mortality, especially in response to disturbance events such as climate extremes, is necessary to accurately predict future forest distribution, productivity, and the associated carbon sequestration (McDowell et al., 2013; Allen et al., 2015). This is particularly important for ecosystems in northern high-latitude regions that are vulnerable to climate change (Bonan, 2008; Gauthier et al., 2015).
Most studies on tree responses to climate extremes have focused on severe drought events and showed that many tree species exhibit a certain degree of resilience even after reduced growth during severe drought events (Bottero et al., 2021; Fang and Zhang, 2019; Gazol et al., 2017). Resilience is the ability of trees/forests to recover pre-disturbance functions after a disturbance event (Gazol et al., 2017). The resilience of a tree species to climate extremes, such as severe drought, can affect its distribution, population dynamics, structure, and function in the areas it occupies (DeSoto et al., 2020). Furthermore, the resilience of dominant tree species can influence forest ecosystems and ecosystem services and determine tree mortality.
Quantitatively, resilience has been assessed using resistance (Rt), recovery (Rc), and resilience (Rs) (Lloret et al., 2011). These components have been widely used to evaluate forest stability and adaptation to climate change (Merlin et al., 2015) and have been particularly applied to gauge tree responses to severe drought events (Bose et al., 2020; Bottero et al., 2021).
Tree rings are valuable proxies for long-term tree-growth responses to climate change, at levels ranging from individual trees to communities, and have been used to study tree responses to climate extremes (Tei et al., 2019a; Cherubini et al., 2021; Zhang et al., 2023). Tree rings have been studied based on the resilience components Rt, Rc, and Rs to examine the vulnerability of trees to climate extremes observed in the high latitudes of the Northern Hemisphere (Bonan, 2008; Gauthier et al., 2015). Most of these studies adopted the approach of extracting specific extreme climate events from available meteorological data and evaluating tree responses to them (e.g., Fang and Zhang, 2019). Consequently, the analysis has been limited to approximately the past 120 years, for which meteorological data were available. Furthermore, climate extremes are rarely observed during this limited period, which makes it difficult to obtain sufficient examples for analysis. Hence, despite previous studies examining temporal variabilities over decades (e.g., Wang et al., 2023), long-term temporal variabilities have been studied less than the spatial distribution of resilience components.
However, key gaps remain in the current understanding of forest and tree resilience. It is still unclear whether these resilience components are stable over time and whether data from previous studies can provide representative estimates for different regions. In addition, the extent to which spatial variations and regional differences in these resilience components are universal from the past to present and the future is unclear. Addressing these gaps is important for estimating the future resilience of forests and trees in a given location and area.
To address these gaps in the research, this study aimed to estimate extreme tree-growth reduction (EGR) events over the past several centuries and examine the resilience components on those occasions over the Northern Hemisphere high latitudes from tree-ring width time-series data. Rather than identifying the climatic drivers of EGR events, this study aimed to extend the analysis period (including many sites from before 1700) to incorporate a large number of EGR events and assess resilience components representative of a site or region across temporal and environmental factors. Site-or regional-averaged resilience components were calculated by aggregating data from multiple EGR events and were expected to reflect a range of causal factors, including, in some cases, multiple types of climate extremes. This study particularly focused on the temporal stability of the resilience components for each region and the pattern of regional differences. However, because an analysis of the resilience component in EGR events attributable to unspecified factors described above may be less sensitive to detect regional differences in the resilience components, a complementary analysis was also conducted. This secondary analysis specifically examined resilience components during EGR events corresponding to specific climate extremes, that is, severe low-temperature and low-rainfall events.
2 Methods
2.1 Tree-ring data
Raw tree-ring width chronologies from 675 sites in the International Tree-Ring Data Bank (ITRDB; http://www.ncdc.noaa.gov/paleo/treering.html accessed during spring–winter 2020) located in the high latitudes of the Northern Hemisphere (above 50°N) were collected. The standard ring width index (RWI) chronology was generated for each site in R (R Core Team, 2017) using the “dplR” package. The growth patterns associated with tree age and natural disturbances in the raw time-series data, derived from a single dominant tree species at each site, were detrended using cubic smoothing splines, and the standardized ring widths among the samples were subsequently averaged. Spline fits of length 2/3rd of the series length were applied to the raw time-series data. Although standardization methods typically vary among chronologies and sites, this study applied spline fitting uniformly to ensure consistency, using a conservative approach that is relatively site-insensitive (Cook, 1985; Cook and Kairiukstis, 1990).
The quality of RWI was assessed using the expressed population signal (EPS). The EPS is a measure of how well a finite sample of tree-ring data represents an infinite population chronology, and an EPS value of 0.85 is considered the threshold of acceptable statistical quality for dendrochronological analysis (Wigley et al., 1984). EPS values for 523 of 675 sites were higher than 0.85 for a given period, indicating a high degree of common variability between individual trees. Therefore, for subsequent analysis, this study used the RWI for these 523 sites (Figure 1). The frequency distribution of correlation coefficients for RWIs within and across regions and the distribution for autocorrelations of RWIs per region were calculated to further demonstrate the quality of RWIs (Supplementary Figures S1–S3). These inter-regional RWI correlation coefficients were distributed around 0, whereas those within regions were shifted in the direction of positive, indicating a trend toward higher RWI correlations within regions. The RWI autocorrelations for each region were distributed roughly around 0.4 to 0.5.
Figure 1
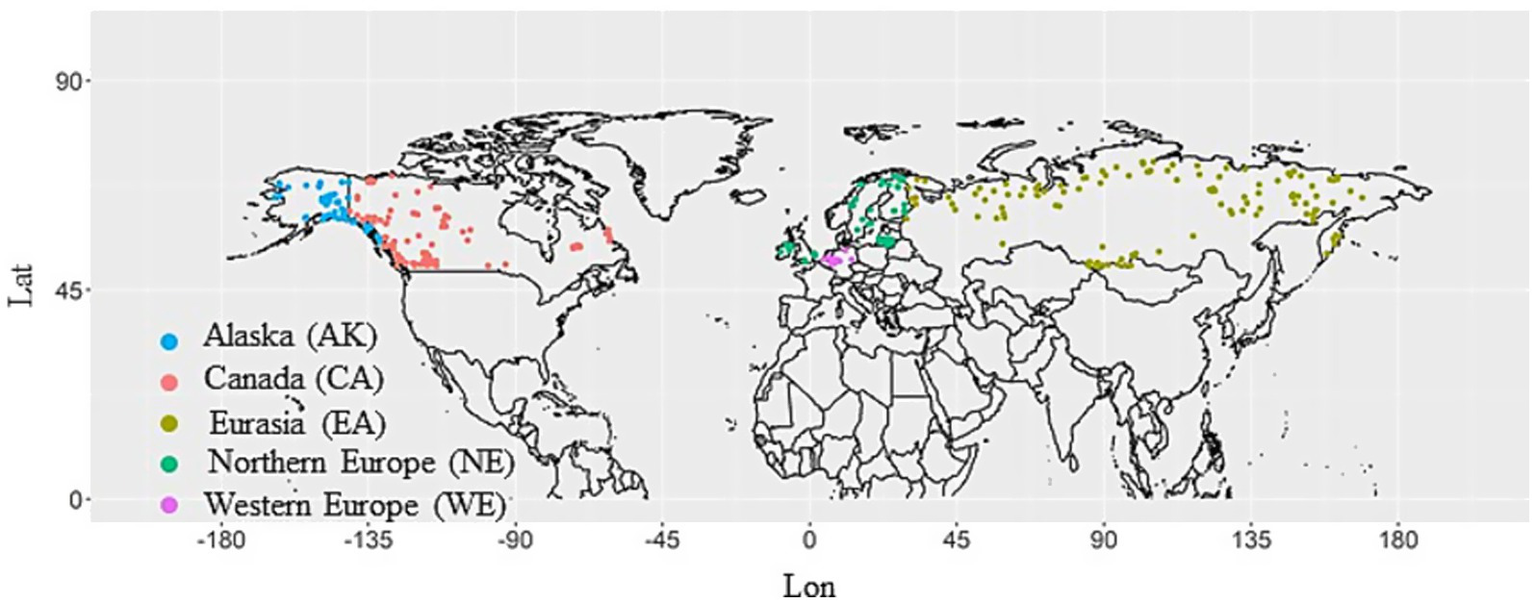
Regional classification as provided in the International Tree-Ring Data Bank (ITRDB) sites. We classified ITRDB sites into five regions, i.e., Canada (CA), Alaska (AK), Eurasia (EA), Northern Europe (NE), and Western Europe (WE). The regional classification follows the description in ITRDB.
2.2 EGR events
To detect EGR events at each ITRDB site, z-transformation (Jetschke et al., 2019) of the standardized RWI chronologies was performed in R (R Core Team, 2017) using the “pointRes 2.0” package. The Z-score is a numerical value representing the standard deviation of a data point from the mean and is used to identify anomalous data points. Typically, a data point was considered an outlier if its Z-score exceeded a predefined threshold. In this study, the absolute standard deviation threshold for an individual year to be considered as an EGR event was set to 1.28.
2.3 Resilience components
To assess tree vulnerability to EGR events, this study estimated four resilience components—Rt, Rc, Rs, and the recovery period (Rp) from standardized RWI chronologies (Figure 2). Rt represents the ability of an individual tree to withstand external stresses, such as severe low temperatures or drought; maintain physiological functions; and minimize growth loss. Rc and Rs are the abilities to recover from reduced growth owing to damage sustained during disturbances (Bose et al., 2020; Lloret et al., 2011). The Rt, Rc, and Rs indices were calculated as described by Lloret et al. (2011).
Figure 2
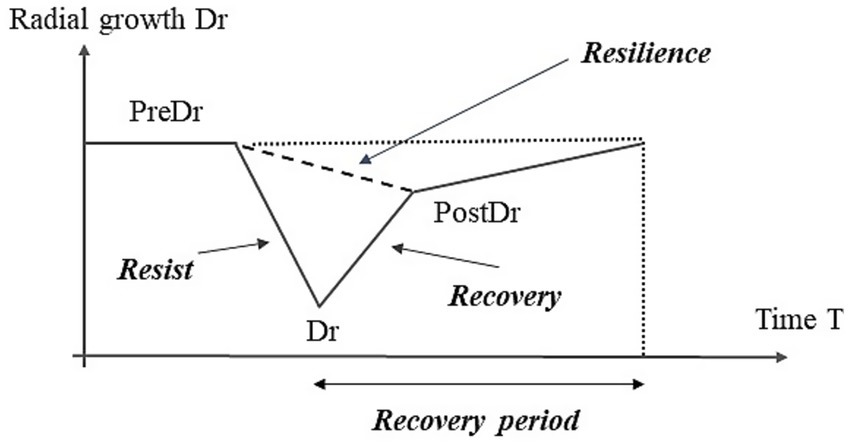
Diagrammatic representation of extreme tree-growth reduction (EGR) events and their resilience components calculated from standard ring width index (RWI) chronologies. “Dr” indicates the standardized RWI in an EGR event. “PreDr” and “PostDr” represent RWI over five years before and after the EGR event. Rt () represents the ability of an individual tree to withstand external stresses. Rc () and Rs are the ability to recover from reduced growth owing to damage sustained during disturbances. In addition, the recovery period (Rp) was determined as the number of years until growth completely returns to pre-EGR event levels.
Here, “Dr” indicates the standardized RWI in an EGR event. “PreDr” and “PostDr” represent the RWI over five years before and after the EGR event, respectively. In addition, Rp was defined as the number of years until growth completely returned to pre-EGR event levels (Figure 2). In this study, the resilience components were calculated from standard RWI chronologies for individual trees, and site averages were used.
2.4 Climate data
Gridded monthly near-surface average temperature and total precipitation datasets from the Climate Research Unit (CRU TS 4.05; 1901–2020; 0.5° × 0.5°; Harris et al., 2020) were used to derive monthly climate records from grids over the RWI sites.
2.5 Data analysis
To determine the spatio-temporal variability of resilience components and regional differences in the Northern Hemisphere at high latitudes, this study used the site-or regional-averaged resilience components over the analysis period (across multiple sites dating back to before 1700). Because some EGR events had extremely high or low resilience component values, the site-averaged values were calculated after removing the values belonging to the upper or lower 10%.
To determine temporal variations in the regional-averaged resilience components, resilience components were calculated and analyzed separately for each of the four time periods, namely, pre-1700, 1701–1800, 1801–1900, and post-1900. To focus on changes in the resilience components over time, including the effects of various factors, but not on changes in resilience components due to changes in specific climatic factors, the time period was set to every 100 years on a calendar basis.
This study also examined regional differences in resilience components during EGR events corresponding to specified extreme climate events, i.e., extreme low-temperature and low-rainfall events. Extreme low-temperature and low-rainfall events were defined as those that happened during years in which the mean annual temperature and accumulated precipitation at each grid over the RWI sites were at least 2σ lower than their 1901–2020 mean values. Because a time lag can be expected in tree responses to climate extreme events (Tei et al., 2019a,b), this study assumed that EGR events were caused by climate extreme events not only when EGR events were observed in the year of the climate extreme event but also in the following 2 years.
To detect regional differences among the resilience components, this study classified ITRDB sites into five regions: Canada (CA), Alaska (AK), Eurasia (EA), Northern Europe (NE), and Western Europe (WE). The sites were classified regionally based on their descriptions in the ITRDB, but Eastern Europe in the ITRDB classification was classified as Eurasia (EA) in this study (Figure 1). The number of sites included in each region and information on the tree genera targeted at each site are shown in Table 1.
Table 1
| Genera | AK | CA | EA | NE | WE |
|---|---|---|---|---|---|
| Abies | 27 | ||||
| Betula | 1 | 5 | |||
| Chamaecyparis | 5 | ||||
| Fagus | 13 | ||||
| Larix | 8 | 99 | 4 | 3 | |
| Picea | 68 | 85 | 29 | 7 | 6 |
| Pinus | 29 | 21 | 31 | ||
| Populus | 1 | ||||
| Pseudotsuga | 8 | 2 | |||
| Quercus | 1 | 21 | 15 | ||
| Tsuga | 20 | 12 | |||
| Total | 95 | 170 | 154 | 63 | 39 |
Number of sites in each region and information on tree genera targeted at each site.
For detecting significant regional differences, this study first examined whether significant differences in medians of resilience components between at least one regional group could be detected by the Kruskal-Wallis test, a nonparametric test. If a significant difference was detected, Dunn’s test (Dunn, 1961) was then applied, implemented using the “dunn.test” package in R (R Core Team, 2017), to identify regional groups showing significant differences. Although Dunn’s test is one of the least powerful multiple comparison methods, it was chosen for its highly conservative and widely applicable nature, making it particularly suitable for a large number of comparisons.
3 Results
3.1 Frequency of EGR events over past several centuries
The Kruskal-Wallis test demonstrated no significant (p-value < 0.05) regional differences for frequency of past (during the entire analysis period) EGR events among any regional group (Chi-squared statistic = 6.1623, number of groups = 4, p-value = 0.19), ranging from 0.093 to 0.098 events/year across all regions (Table 2). The total number of EGR events detected in each region was proportional to the number of sites included in the respective region, whereas the number of EGR events corresponding to extreme events was not (Table 3). The identified frequencies of EGR events corresponded to n used during the statistical detection of regional differences in resilience components (Figures 3–5).
Table 2
| Region | Number of events/year | |
|---|---|---|
| Mean | sd | |
| AK | 0.097 | 0.024 |
| CA | 0.095 | 0.016 |
| EA | 0.098 | 0.017 |
| NE | 0.093 | 0.021 |
| WE | 0.097 | 0.020 |
Frequency (times/year) of extreme tree-growth reduction (EGR) events during the entire analysis period.
Table 3
| Region | Typr of EGR event | Number of EGR event |
|---|---|---|
| AK | All EGR event | 1,537 |
| EGR event corresponding to extreme low temperature | 47 | |
| EGR event corresponding to extreme low precipitation | 25 | |
| CA | All EGR event | 3,255 |
| EGR event corresponding to extreme low temperature | 60 | |
| EGR event corresponding to extreme low precipitation | 79 | |
| EA | All EGR event | 3,148 |
| EGR event corresponding to extreme low temperature | 53 | |
| EGR event corresponding to extreme low precipitation | 59 | |
| NE | All EGR event | 705 |
| EGR event corresponding to extreme low temperature | 46 | |
| EGR event corresponding to extreme low precipitation | 49 | |
| WE | All EGR event | 313 |
| EGR event corresponding to extreme low temperature | 9 | |
| EGR event corresponding to extreme low precipitation | 72 |
Total number of EGR events detected in each region as well as the number of EGR events corresponding to extreme low-temperature and low-rainfall events.
Figure 3
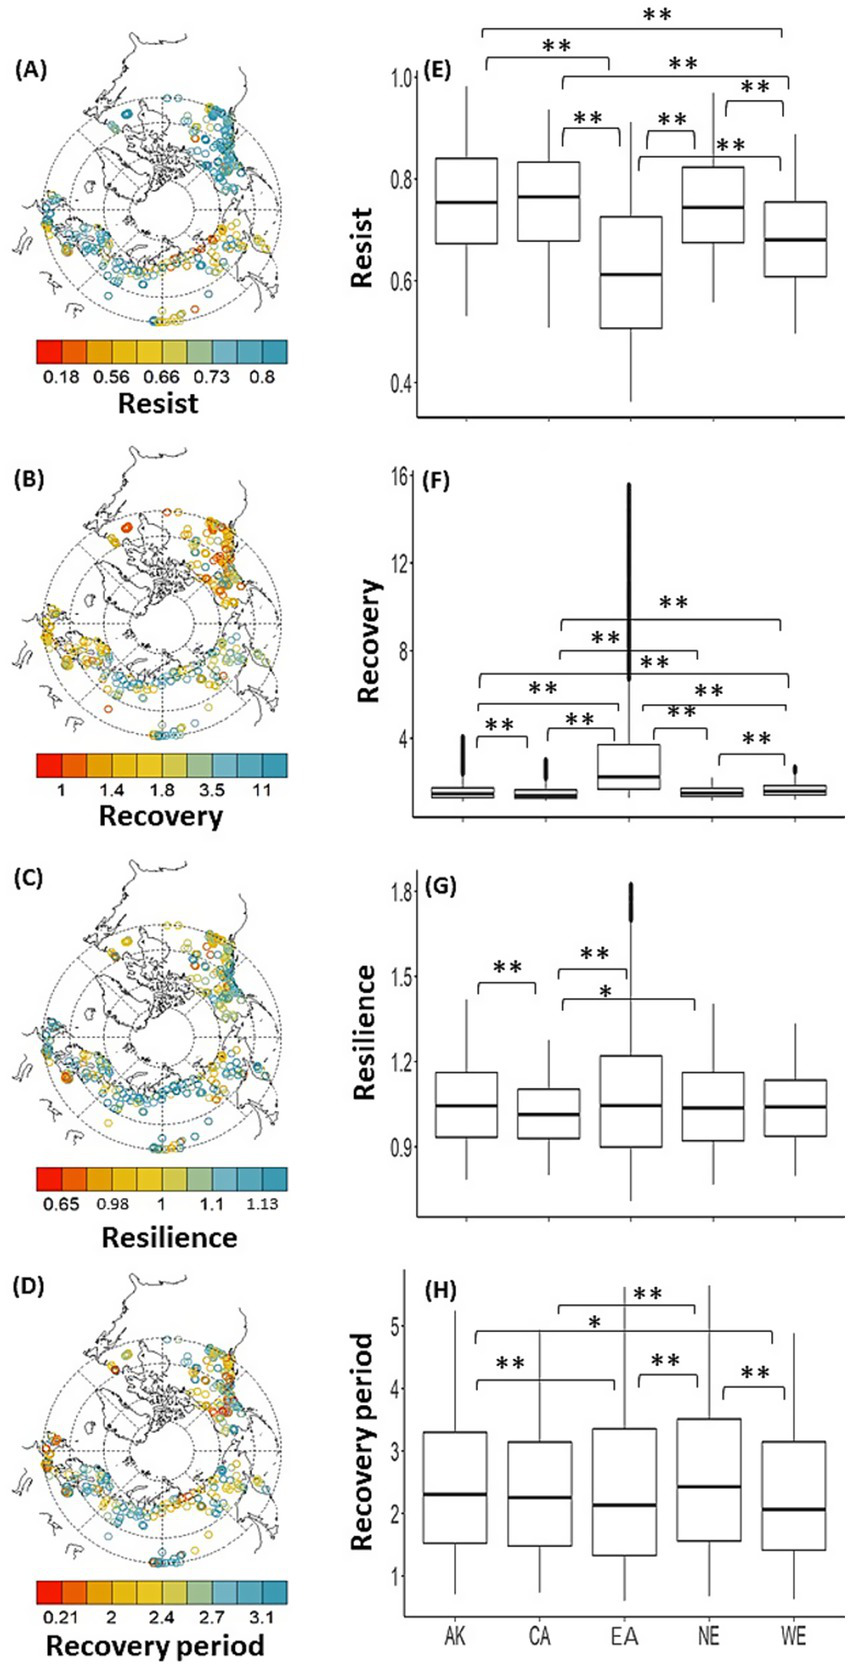
Spatial distribution of the site-averaged resilience components, Rt, Rc, Rs, and Rp, calculated using standard RWI chronology for all available time periods at each site (A–D). Boxplots for regional resilience components (E–H), i.e., Canada (CA), Alaska (AK), Eurasia (EA), Northern Europe (NE), and Western Europe (WE). Significant level of differences between regions are indicated using an asterisk; that is, * for p-value < 0.05 and ** for p-value < 0.01. The horizontal lines drawn in the boxes indicate the third quartile, second quartile, and first quartile (from the top), with outliers indicated by filled circles.
Figure 4
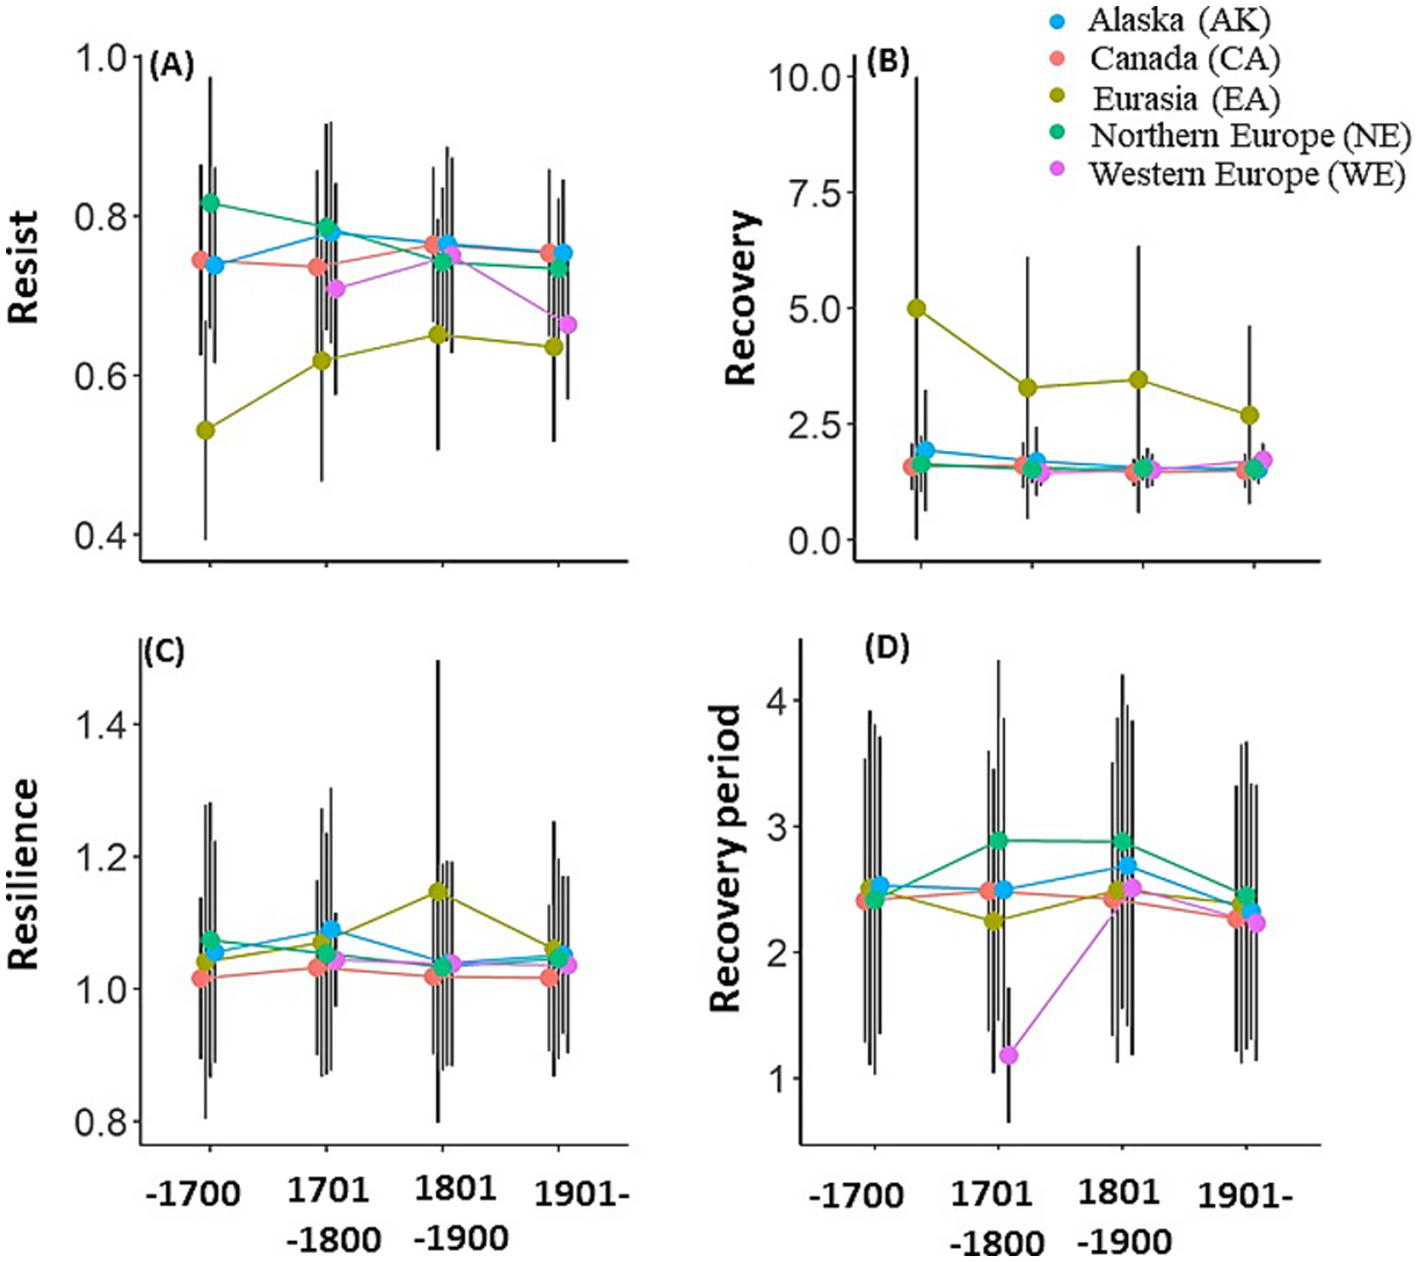
Temporal changes in regional, i.e., Canada (CA), Alaska (AK), Eurasia (EA), Northern Europe (NE), and Western Europe (WE), resilience components, namely, Rt, Rc, Rs, and Rp (A–D), over the four time periods: (i) pre-1700, (ii) 1701 -1800, (iii) 1801 -1900, and (iv) post-1900 periods. See Supplementary Tables S3–S13 for the significance of regional difference.
Figure 5
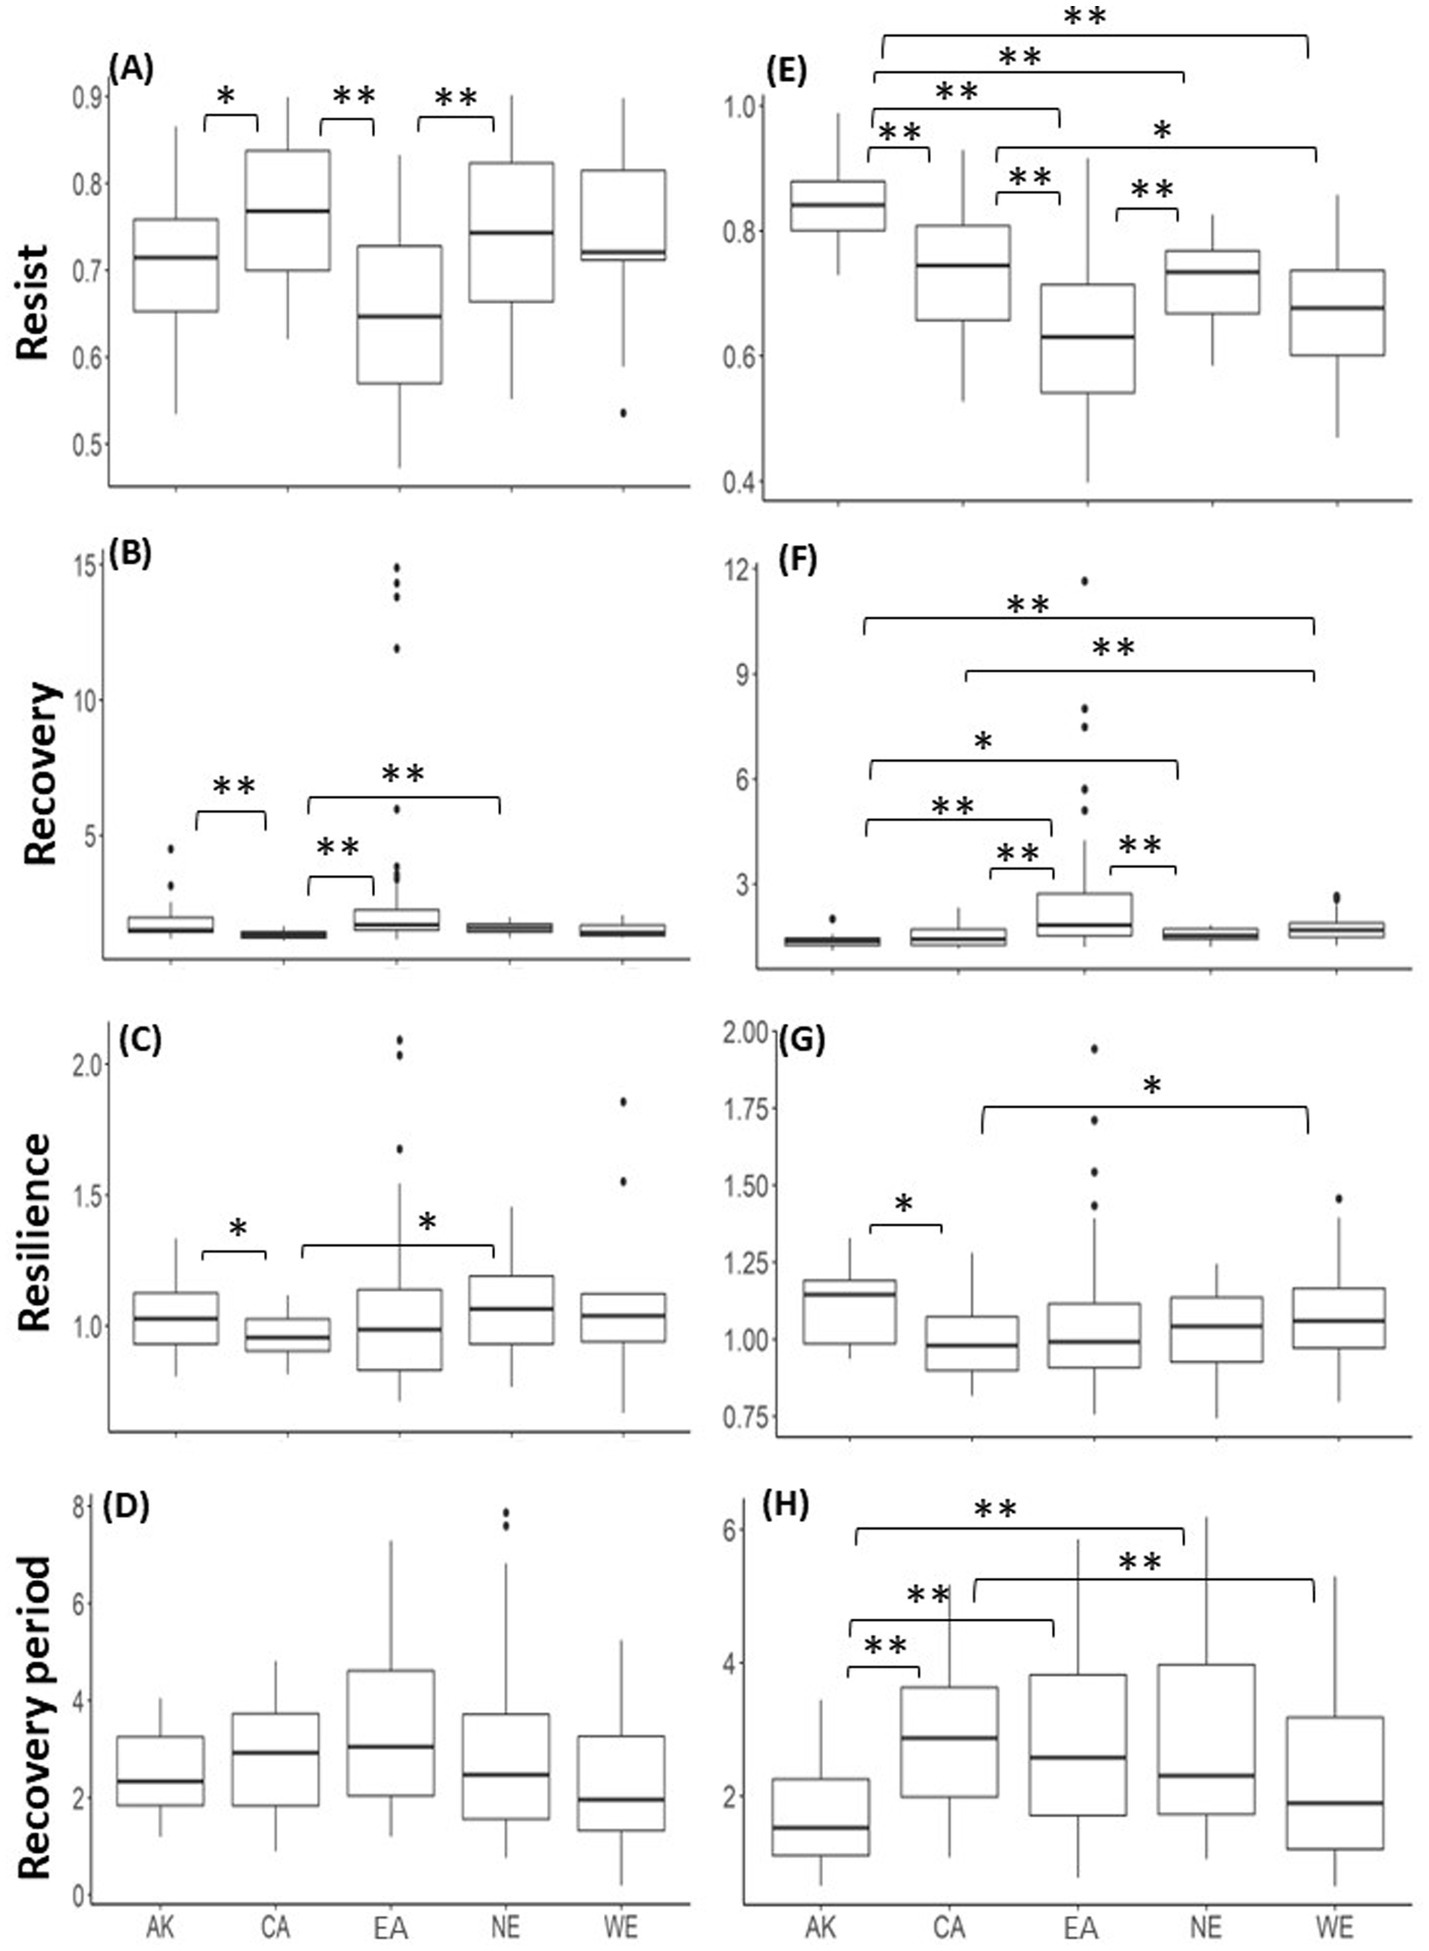
Boxplots for regional, i.e., Canada (CA), Alaska (AK), Eurasia (EA), Northern Europe (NE), and Western Europe (WE), resilience components, namely, Rt, Rc, Rs, and Rp, during EGR events corresponding to extreme low-temperature events (A–D). It should be noted that the Kruskal-Wallis test demonstrated a non-significant (p-value < 0.05) difference between any regional groups for Rp. Panels (E–H) are the same as A-D but for resilience components during EGR events corresponding to extreme low-rainfall events. Significant level of differences between regions are indicated using an asterisk; that is, * for p-value < 0.05 and ** for p-value < 0.01. The horizontal lines drawn in the boxes indicate the third quartile, second quartile, and first quartile (from the top) with outliers indicated by filled circles.
3.2 Spatial variations in resilience components at high-latitude regions in the northern hemisphere
Site-averaged resilience components, namely, Rt, Rc, Rs, and Rp, calculated using the standard RWI chronology for all available periods at each site exhibited a large spatial variability (Figures 3A–D). The Kruskal-Wallis test demonstrated a significant (p-value < 0.05) difference in medians of all regional resilience components between at least one regional group (Supplementary Table S1), and then Dunn’s test was applied, showing significant regional characteristics (Figure 3; Supplementary Table S2). The Rt values in AK and CA in North America were significantly higher than those in EA or WE. The Rt in EA and WE were significantly lower than that in NE. Rc in EA was significantly higher than those in any other region. In addition, Rc in WE was significantly higher than those in other regions except EA. In contrast to the pattern observed for Rt, Rs in CA was lower than those in EA or NE. Within North America, AK showed higher Rs values than CA. Shorter trends were observed for Rp values in EA and WE than in AK or NE. Similarly, longer trends were observed in NE than in CA.
3.3 Temporal variations in resilience components at high latitude regions in the northern hemisphere
Temporal changes in the regional-averaged resilience components over the four analysis periods: (i) pre-1700, (ii) 1701–1800, (iii) 1801–1900, and (iv) post-1900 showed significant regional characteristics (Figures 4A–D). The Kruskal-Wallis test demonstrated a significant (p-value < 0.05) difference in medians of all resilience components for most analysis periods and regions between at least one regional group (Supplementary Tables S3, S4), and then Dunn’s test identified regional groups showing significant differences (Supplementary Tables S5–S13). Throughout all analysis periods, except for the difference with WE in the 1701–1800 and/or post-1900 periods (when no significant differences were detected), EA exhibited significantly lower Rt and higher Rc than the other regions. For Rs, AK consistently showed significantly higher values than CA across all analysis periods, except for the 1801–1900 period. In addition, Rs in CA was significantly lower than that in EA during the 1801–1900 and post-1900 analysis periods. For Rp, some significant regional differences were detected during the 1701–1800 and 1801–1900 analysis periods. Importantly, regional differences remained relatively stable throughout the analysis period. Although some differences fluctuated between being significant and non-significant, no cases of positive significant differences reversing into negative significant differences, or vice versa, were detected, except in the case of Rt between CA and NE.
Significant temporal changes were frequently detected in the resilience components over the four analysis periods in EA. Only in the EA, significant (p < 0.05) differences between at least one analysis period group were detected in all resilience components (Supplementary Table S4). An increasing trend was identified for Rt (no significant difference detected between 1801–1900 and post-1900 periods), with a decreasing trend for Rc (no significant difference between 1701–1800 and 1801–1900 periods). Conversely, Rs in EA was significantly higher during the 1801–1900 period than during pre-1700 or post-1900 periods.
Few significant temporal changes in resilience components were detected outside EA. In CA, Rc during the 1701–1800 period was significantly higher than that during any other period. In NE, Rp during the 1801–1900 period was significantly longer than that during the pre-1700 or post-1900 periods. However, although significant temporal changes were detected across several regions and components, mainly in EA, the pattern of regional differences among each of the components did not appear to change significantly over time, indicating that regional values were relatively stable. In particular, no significant differences in Rs were detected between analysis period groups in regions outside of the EA.
3.4 Resilience components corresponding to climate extreme events
The ratio of EGR events detected simultaneously as an extreme low-temperature event was determined by site and summarized by region, with the ratio being highest in NE, lowest in CA and WE, and intermediate in AK and EA (Supplementary Figure S4A). Regional resilience components exhibited significant regional characteristics (Figures 5A–D). The Kruskal-Wallis test demonstrated a significant (p-value < 0.05) difference in medians of all resilience components other than Rp between at least one regional group (Supplementary Table S14), and then Dunn’s test identified regional groups showing significant differences (Supplementary Table S15). The Rt in EA was significantly lower than that in CA or NE. CA showed significantly higher Rt than AK. In contrast to the differences in Rt, Rc in CA was significantly lower than those in EA or AK. Rc in CA was also significantly lower than those in NE. For Rs, CA showed lower values than AK or NE. The tree genera with the highest ratio of observed EGR events corresponding to extreme low-temperature events (among those detected in at least 10 sites) were Picea, Abies, Pinus, Pinus, and no applicable tree genera, for AK, CA, EA, NA, and WE, respectively (Table 4).
Table 4
| Genera | AK | CA | EA | NE | WE |
|---|---|---|---|---|---|
| Abies | 17 (63.0) | ||||
| Betula | 1 (100) | 2 (40.0) | |||
| Chamaecyparis | 0 (0) | ||||
| Fagus | 2 (15.4) | ||||
| Larix | 0 (0) | 21 (21.2) | 1 (25.0) | 1 (33.3) | |
| Picea | 17 (25.0) | 13 (15.3) | 11 (37.9) | 6 (85.7) | 0 (0) |
| Pinus | 4 | 11 (52.4) | 20 (64.5) | ||
| Populus | 0 (0) | ||||
| Pseudotsuga | 1 (12.5) | 1 (50.0) | |||
| Quercus | 1 (100) | 5 (23.8) | 4 (26.7) | ||
| Tsuga | 15 (25.0) | 5 (41.7) | |||
| Total | 33 (34.7) | 41 (24.1) | 45 (29.2) | 32 (50.8) | 8 (20.5) |
Number of sites per tree genus where at least one EGR event corresponding to extreme low-temperature event was observed in each region.
The number in parentheses indicates the percentage of those sites relative to the total number of sites for the tree genus by region (see Table 1). Columns with 0 in the number of sites (site percentage) indicate tree genera by region for which EGR events have been observed but no EGR events corresponding to extreme low-temperature events have been detected. The bottom total column indicates the total number of sites with at least one EGR event corresponding to a low-temperature event by region and its percentage of the total number of sites (the number in parentheses).
The ratio of EGR events detected simultaneously as an extreme low-precipitation event was determined by site and summarized by region, with the ratio being highest in WE, lowest in AK, and intermediate between these values in CA, EA, and NE (Supplementary Figure S4B). Regional resilience components exhibited significant regional characteristics (Figures 5E–H). The Kruskal-Wallis test demonstrated a significant difference in medians of all resilience components between at least one regional group (Supplementary Table S14), and then Dunn’s test was applied, showing significant regional characteristics (Supplementary Table S16). Rt in AK was significantly higher than those in other regions. However, Rt was significantly lower in EA than in other regions except for WE. In contrast to the difference in Rt, Rc in EA was significantly higher than those in all regions except for WE. In addition, Rc in AK in North America was significantly lower than those in NE or WE in Europe. For Rs, CA showed lower values than AK or WE. Shorter trends were observed for Rp in AK than in other regions except WE. The tree genera with the highest ratio of observed EGR events corresponding to extreme low-precipitation events (among those detected in at least 10 sites) were Picea, Pinus, Larix, Pinus, and Fagus, for AK, CA, EA, NA, and WE, respectively (Table 5).
Table 5
| Genera | AK | CA | EA | NE | WE |
|---|---|---|---|---|---|
| Abies | 10 (37.0) | ||||
| Betula | 0 (0) | 1 (20.0) | |||
| Chamaecyparis | 0 (0) | ||||
| Fagus | 13 (100) | ||||
| Larix | 0 (0) | 30 (30.3) | 2 (50.0) | 3 (100) | |
| Picea | 14 (20.6) | 18 (21.2) | 9 (31.0) | 3 (42.9) | 6 (100) |
| Pinus | 15 (51.7) | 9 (42.9) | 15 (48.4) | ||
| Populus | 0 (0) | ||||
| Pseudotsuga | 4 (50.0) | 2 (100) | |||
| Quercus | 1 (100) | 11 (52.4) | 13 (86.7) | ||
| Tsuga | 6 (30.0) | 3 (25.0) | |||
| Total | 20 (21.1) | 51 (30.0) | 49(31.8) | 31(49.2) | 37(94.9) |
Number of sites per tree genus where at least one EGR event corresponding to extreme low-rainfall event was observed in each region.
The number in parentheses indicates the percentage of those sites relative to the total number of sites for the tree genus by region (see Table 1). Columns with 0 in the number of sites (site percentage) indicate tree genera by region for which EGR events have been observed but no EGR events corresponding to extreme low-rainfall events have been detected. The bottom total column indicates the total number of sites with at least one EGR event corresponding to a low-rainfall event by region and its percentage of the total number of sites (the number in parentheses).
4 Discussion
4.1 Spatio-temporal variations in resilience components on EGR events across the high latitude regions of the northern hemisphere
In the Northern Hemisphere high latitudes, no significant regional differences were found in the observed frequency of EGR events. However, large spatial variations with significant regional differences in the resilience components were evident. The regional-averaged Rt over the entire analysis period was highest in North America and lowest in Eurasia. At the time of large reductions in tree radial growth, that is, EGR events, the reductions were more intense in the Eurasian region than in North America. However, a lower Rt does not necessarily lead to a lower Rs, which is potentially associated with future tree decline and mortality risks (DeSoto et al., 2020). This could be partly attributed to the fact that, despite low Rt, Rc was greater in the Eurasian region than in the North American regions. Consequently, lower Rs tended to be observed in CA in North America, where Rt was significantly higher than those in EA, suggesting a potential higher vulnerability to EGR events.
In a previous study, a smaller Rs was strongly related to the risk of future tree decline and mortality, although the discussion was at an individual tree basis at the same site and a different spatial scale from that of this study (DeSoto et al., 2020). Our findings may be important for discussing future tree/forest dynamics in the high-latitude regions of the Northern Hemisphere, particularly future risks related to tree decline and mortality caused by climate extremes and other disturbance factors. However, in AK, EA, and NE, although Rp was not shorter than that in CA, Rs was higher than in CA. Thus, despite the immediate recovery of tree radial growth to some extent after an EGR event in AK, EA, and NE, a reasonable amount of time may still be required for them to return to pre-EGR event growth levels.
Significant temporal changes were detected in the regional resilience components over the four analysis periods in the EA. In Eastern Siberia, located in the EA region, tree decline and mortality events due to heavy rainfall occurred in the taiga forest (Tei et al., 2019a) and taiga–tundra boundary areas (Tei et al., 2019b). Large temporal changes in the resilience components in the EA region may reflect large temporal variability in the magnitude and frequency of climate extremes, such as severe drought and heavy rainfall. In contrast, although significant temporal changes were detected in the regional resilience components in some areas, the pattern of regional differences appeared to be relatively independent of the period of analysis. This suggests that the observed regional differences in resilience components are relatively universal from past to present and even into the future and may be used for future forecasting. Considering those results, differences in the magnitude and frequency of climate extremes and other disturbance events by region may not be large enough to alter the pattern of regional differences in resilience components.
Because resilience components in EGR events attributable to unspecified factors may be less sensitive to detecting regional differences in resilience components, this study was conducted simultaneously using resilience components in EGR events corresponding to severe low-temperature and low-rainfall events. The results were approximately consistent with the results of the analysis using all EGR events. The regional-averaged Rt during EGR events corresponding to both extreme low-temperature and low-rainfall events tended to be higher in North America and lower in Eurasia and Europe. However, Rc tended to be lower in North America and higher in Eurasia and Europe, resulting in lower Rs in CA. This result strongly supports the estimated high vulnerability of CA to EGR events in the analysis using resilience components for EGR events in the past during the entire analysis period. Furthermore, regional differences in resilience components appeared to be more pronounced during EGR events corresponding to extreme low-rainfall events than during EGR events corresponding to extreme low-temperature events. In this regard, it seems reasonable that many previous studies (e.g., Bose et al., 2020; Bottero et al., 2021) targeted vulnerability factors to severe drought events.
4.2 Extreme climate events and resilience components
A synthetic analysis using the RWI on the ITRDB demonstrated the widespread negative sensitivity of tree radial growth to warming over high latitudes in the Northern Hemisphere, particularly in continental dry climate regions (Tei et al., 2017). During global warming, temperature-induced drought limits tree growth (Barber et al., 2000; Silva et al., 2009; Dulamsuren et al., 2010; Tei et al., 2014) and increases mortality (van Mantgem et al., 2009), owing to the limited availability of soil moisture.
RWI has often been used to study tree responses to climate extremes (Cherubini et al., 2021; Zhang et al., 2023) and particularly to assess responses to severe drought events (Bose et al., 2020; Bottero et al., 2021). For example, Marques et al. (2018) investigated Alnus and Fraxinus tree growth responses to climate change in the Mediterranean region and found similar tree growth responses to drought in both species; however, responses to extreme drought events were species-specific. In addition, Fang and Zhang (2019) showed that juniper trees in the Tibetan Plateau were highly resilient to extreme droughts and that spatio-temporal Rt and Rc were related to moisture availability and diurnal temperature range, respectively. In a broader study, DeSoto et al. (2020) reported that the resilience of a tree species to climate extremes, such as severe drought, can affect its distribution, population dynamics, and the structure and function of the areas it occupies. The resilience of dominant tree species can affect forest ecosystems and their services and determine the probability of tree mortality. The RWI has also been used to assess tree resilience in waterlogged environments (Fan et al., 2018; Tei et al., 2019a). Tei et al. (2019a) demonstrated that a waterlogged environment could be a factor of tree mortality, even for larch in eastern Siberian taiga forests, which are located in a continental arid climatic zone and frequently exposed to severe drought. They also demonstrated that larch resilience was related to moisture availability, similar to the responses of Rt and Rc to extreme droughts reported by Fang and Zhang (2019).
Dead trees exhibit severe stress signals, such as those indicating carbon starvation, hydraulic failure, and the interdependency between them (McDowell et al., 2011), not only in the year of death but also in the years before death (McDowell et al., 2010; Levanic et al., 2011; Cailleret et al., 2017). This suggests that tree mortality pathways may be significantly influenced by the history of environmental conditions that occurred before tree mortality and that the process of tree mortality is complex, even when tree mortality occurs synchronously in specific years of extreme environmental conditions. In addition, the long-term averaged tree-growth response to environmental conditions also exhibited a one-year lag (Tei et al., 2017; Tei and Sugimoto, 2018), which could be considered a beneficial adaptation of forest ecosystems to severely water-stressed environments (Chapin et al., 1990; McDowell et al., 2008; Genet et al., 2010; Wiley and Helliker, 2012).
Given the observed time lag in tree responses to environmental changes, including responses to climate extremes, accurately identifying the climatic/environmental factors that contribute to tree-growth reduction, decay, and mortality may be challenging. Therefore, this study did not focus on identifying the climatic drivers of EGR events; instead, this study extended the analysis period to include a large number of EGR events and assessed the resilience components that are representative of a site or region. The site-or regional-averaged resilience components were calculated to include multiple EGR events. These resilience components are expected to include EGR events owing to a variety of factors. Nevertheless, this study focused on extreme low-temperature and low-rainfall events as the primary causes of EGR events; the ratio of sites where EGR events were detected in response to climate extreme events was higher in cases corresponding to extreme low-rainfall events in CA, EA, NE, and WE and was particularly pronounced in WE. In contrast, a higher percentage of EGR events were detected in AK in response to extreme low-temperature events.
Despite the identification of such regional differences, the frequency of EGR events in which these extreme low-temperature and low-rainfall events were the primary cause was not as high as expected. Therefore, a large portion of EGR events is likely attributable to climate extreme events other than extreme low-temperature and low-rainfall events or to internal or external factors affecting tree physiology and dynamics other than climatic factors or to a combination of these factors; the regional differences in resilience components identified in this study may be attributed to more complex factors. That is, they may reflect not only climate variability and the magnitude and frequency of climate extremes but also the history of other natural and anthropogenically influenced environmental conditions experienced by trees in the region. In addition, differences in the dominant tree species in each region may also influence the differences in resilience component dynamics during EGR events. DeSoto et al. (2020) showed that conifers and gymnosperms have different recovery strategies during EGR events resulting from severe drought.
From a future perspective, the identification of exact drivers of EGR events, which are presumably complex processes, is vital. However, this identification requires precise consideration of the time lag of tree responses to climate change (Tei et al., 2017, 2019a; Tei and Sugimoto, 2018), which in this study was assumed to be up to 2 years. The time lag need not be on an annual scale but could be on a seasonal scale. Moreover, in addition to climatic factors, site-specific environmental factors that could impact the tree responses should be considered. In addition to analyses based on tree rings, that is, dendroecology, promoting cross-disciplinary research by combining other protocols, such as in-situ plant physiological observations, process research using ecosystem models, and long-term forest dynamics monitoring over wide areas using remote sensing techniques, is necessary. Such approaches would facilitate a comprehensive understanding of forest decay and mortality related to EGR events and allow for accurate prediction of future forest distribution, productivity, and associated carbon sequestration.
5 Conclusion
This study estimated past EGR events and resilience components associated with these occasions using the RWI chronology from 523 ITRDB sites over northern high-latitude regions and investigated their spatio-temporal variabilities. Significant regional differences were not identified in the frequency of EGR events, whereas large spatial variations with significant regional differences were observed among the resilience components during EGR events. The regional Rt over the entire analysis period was higher in North America and lower in Eurasia and Europe. However, a lower Rt does not necessarily lead to a lower Rs. Rather, regional resilience was lower in Canada, suggesting a possible higher vulnerability to EGR events. The high vulnerability in Canada was not because of the large reduction in growth during the EGR event. It was instead attributed to the low extent of recovery after the event.
Significant temporal changes were detected in regional-averaged resilience components over the four analysis periods in Eurasia. However, minimal alterations were detected in other regions, which may reflect large temporal changes in the magnitude and frequency of climate extremes in Eurasia, such as severe drought and heavy rainfall events. Although significant temporal changes in the regional-averaged resilience component were detected in some areas, the associated patterns of regional differences appeared to be relatively independent of the period of analysis. Thus, the pattern of regional differences was relatively universal from the past to the present and even into the future and may be used for future forecasting. The results of this study are thus important for discussing future tree/forest dynamics in the high latitudes of the Northern Hemisphere, particularly future risks related to tree decline and mortality caused by climate extremes and other disturbance factors.
Statements
Data availability statement
Publicly available datasets were analyzed in this study. This data can be found at: the datasets [Raw tree-ring width chronologies] for this study can be found in the [International Tree-Ring Data Bank (ITRDB)] [http://www.ncdc.noaa.gov/paleo/treering.html].
Author contributions
ST: Conceptualization, Data curation, Formal analysis, Funding acquisition, Methodology, Visualization, Writing – original draft.
Funding
The author(s) declare that financial support was received for the research and/or publication of this article. This study was partly supported by KAKENHI (grant nos. 20K19950 and 23K11397).
Acknowledgments
I gratefully acknowledge the work of past and present members of my laboratory.
Conflict of interest
The author declares that the research was conducted in the absence of any commercial or financial relationships that could be construed as a potential conflict of interest.
Generative AI statement
The author(s) declare that no Gen AI was used in the creation of this manuscript.
Publisher’s note
All claims expressed in this article are solely those of the authors and do not necessarily represent those of their affiliated organizations, or those of the publisher, the editors and the reviewers. Any product that may be evaluated in this article, or claim that may be made by its manufacturer, is not guaranteed or endorsed by the publisher.
Supplementary material
The Supplementary material for this article can be found online at: https://www.frontiersin.org/articles/10.3389/ffgc.2025.1574845/full#supplementary-material
References
1
Adams H. D. Macalady A. K. Breshears D. D. Allen C. D. Stephenson N. L. Saleska S. L. et al . (2010). Climate-induced tree mortality: earth system consequences. EOS Trans. Am. Geophys. Union91, 153–154. doi: 10.1029/2010EO170003
2
Allen C. D. Breshears D. D. (1998). Drought-induced shift of a forest-woodland ecotone: rapid landscape response to climate variation. P. Natl. Acad. Sci. USA95, 14839–14842. doi: 10.1073/pnas.95.25.14839
3
Allen C. D. Breshears D. D. McDowell N. G. (2015). On underestimation of global vulnerability to tree mortality and forest die-off from hotter drought in the Anthropocene. Ecosphere6:129. doi: 10.1890/ES15-00203.1
4
Allen C. D. Macalady A. K. Chenchouni H. (2010). A global overview of drought and heat-induced tree mortality reveals emerging climate change risks for forests. For. Ecol. Manag.259, 660–684. doi: 10.1016/j.foreco.2009.09.001
5
Anderegg W. R. L. Klein T. Bartlett M. Sack L. Pellegrini A. F. A. Choat B. et al . (2016). Meta-analysis reveals that hydraulic traits explain cross-species patterns of drought-induced tree mortality across the globe. P. Natl. Acad. Sci. USA113, 5024–5029. doi: 10.1073/pnas.1525678113
6
Barber V. A. Juday G. P. Finney B. P. (2000). Reduced growth of Alaskan white spruce in the twentieth century from temperature-induced drought stress. Nature405, 668–673. doi: 10.1038/35015049
7
Bonan G. B. (2008). Forests and climate change: forcings, feedbacks, and the climate benefits of forests. Science320, 1444–1449. doi: 10.1126/science.1155121
8
Bose A. K. Gessler A. Bolte A. Bottero A. Buras A. Cailleret M. et al . (2020). Growth and resilience responses of scots pine to extreme droughts across Europe depend on predrought growth conditions. Glob. Change Biol.26, 4521–4537. doi: 10.1111/gcb.15153
9
Bottero A. Forrester D. I. Cailleret M. Kohnle U. Gessler A. Michel D. et al . (2021). Growth resistance and resilience of mixed silver fir and Norway spruce forests in Central Europe: contrasting responses to mild and severe droughts. Glob. Change Biol.27, 4403–4419. doi: 10.1111/gcb.15737
10
Breshears D. D. Allen C. D. (2002). The importance of rapid, disturbance-induced losses in carbon management and sequestration. Glob. Ecol. Biogeogr.11, 1–15. doi: 10.1046/j.1466-822X.2002.00274.x
11
Cailleret M. Jansen S. Robert E. M. Desoto L. Aakala T. Antos J. A. et al . (2017). A synthesis of radial growth patterns preceding tree mortality. Glob. Change Biol.23, 1675–1690. doi: 10.1111/gcb.13535
12
Chapin F. Schultz E. Mooney H. (1990). The ecology and economics of storage in plants. Annu. Rev. Ecol. Syst.21, 423–447.
13
Cherubini P. Battipaglia G. Innes J. L. (2021). Tree vitality and forest health: can tree ring stable isotopes be used as indicators?Curr. For. Rep.7, 69–80. doi: 10.1007/s40725-021-00137-8
14
Cook E. R. (1985). A time series analysis approach to tree-ring standardization. PhD Dissertation. Tucson: The University of Arizona Press.
15
Cook E. R. Kairiukstis A. (1990). Methods of dendrochronology: Applications in the environmental sciences. Dordrecht: Kluwer Academic Press.
16
DeSoto L. Cailleret M. Sterck F. Jansen S. Kramer K. Robert E. M. R. et al . (2020). Low growth resilience to drought is related to future mortality risk in trees. Nat. Commun.11:545. doi: 10.1038/s41467-020-14300-5
17
Dulamsuren C. Hauck M. Khishigjargal M. Leuschner H. H. Leuschner C. (2010). Diverging climate trends in Mongolian taiga forests influence growth and regeneration of Larix sibirica. Oecologia163, 1091–1102. doi: 10.1007/s00442-010-1689-y
18
Dunn O. J. (1961). Multiple comparisons among means. J. Am. Stat. Assoc.56, 52–64. doi: 10.1080/01621459.1961.10482090
19
Fang O. Zhang Q. (2019). Tree resilience to drought increases in the Tibetan plateau. Glob. Change Biol.25, 245–253. doi: 10.1111/gcb.14470
20
Fan R. Morozumi T. Maximov T. C. Sugimoto A. (2018). Effect of floods on the δ13C values in plant leaves: a study of willows in northeastern Siberia. PeerJ6:e5374. doi: 10.7717/peerj.5374
21
FAO and UNEP (2020). The State of the World’s Forests 2020. Rome: Forests, biodiversity and people. doi: 10.4060/ca8642en
22
Gauthier S. Bernier P. Kuuluvainen T. Shvidenko A. Z. Schepaschenko D. G. (2015). Boreal forest health and global change. Science349, 819–822. doi: 10.1126/science.aaa9092
23
Gazol A. Camarero J. J. Anderegg W. R. L. Vicente-Serrano S. M. (2017). Impacts of droughts on the growth resilience of northern hemisphere forests. Glob. Ecol. Biogeogr.26, 166–176. doi: 10.1111/geb.12526
24
Genet H. Bre’da N. Dufreˆne E. (2010). Age-related variation in carbon allocation at tree and stand scales in beech (Fagus sylvatica L.) and sessile oak (Quercus petraea (Matt.) Liebl.) using a chronosequence approach. Tree Physiol.30, 177–192. doi: 10.1093/treephys/tpp105
25
Harris I. Osborn T. J. Jones P. Lister D. (2020). Version 4 of the CRU TS monthly high-resolution gridded multivariate climate dataset. Sci Data7:109. doi: 10.1038/s41597-020-0453-3
26
Jetschke G. van der Maaten E. van der Maaten-Theunissen M. (2019). Towards the extremes: a critical analysis of pointer year detection methods. Dendrochronologia53, 55–62. doi: 10.1016/j.dendro.2018.11.004
27
Kurz W. A. Dymond C. C. Stinson G. (2008). Mountain pine beetle and forest carbon feedback to climate change. Nature452, 987–990. doi: 10.1038/nature06777
28
Levanic T. Cater M. McDowell N. G. (2011). Associations between growth, wood anatomy, carbon isotope discrimination and mortality in a Quercusrobur forest. Tree Physiol.31, 298–308, doi: 10.1093/treephys/tpq111
29
Lloret F. Keeling E. G. Sala A. (2011). Components of tree resilience: effects of successive low-growth episodes in old ponderosa pine forests. Oikos120, 1909–1920. doi: 10.1111/j.1600-0706.2011.19372.X
30
Marques I. G. Campelo F. Rivaes R. Albuquerque A. Ferreira M. T. Rodríguez-González P. M. (2018). Tree rings reveal long-term changes in growth resilience in southern European riparian forests. Dendrochronologia52, 167–176. doi: 10.1016/j.dendro.2018.10.009
31
McDowell N. G. Allen C. G. Marshall L. (2010). Growth, carbon isotope discrimination, and mortality across a ponderosa pine elevation transect. Glob. Change Biol.16, 399–415. doi: 10.1111/j.1365-2486.2009.01994.x
32
McDowell N. G. Beerling D. J. Breshears D. D. Fisher R. A. Raffa K. F. Stitt M. (2011). The interdependence of mechanisms underlying climate-driven vegetation mortality. Trends Ecol. Evol.26, 523–532. doi: 10.1016/j.tree.2011.06.003
33
McDowell N. G. Fisher R. A. Xu C. Domec J. C. Holtta T. Mackay D. S. et al . (2013). Evaluating theories of drought-induced vegetation mortality using a multimodel-experiment framework. New Phytol.200, 304–321. doi: 10.1111/nph.12465
34
McDowell N. G. Pockman W. T. Allen C. D. Breshears D. D. Cobb N. Kolb T. et al . (2008). Mechanisms of plant survival and mortality during drought: why do some plants survive while others succumb to drought?New Phytol.178, 719–739. doi: 10.1111/j.1469-8137.2008.02436.x
35
Merlin M. Perot T. Perret S. Korboulewsky N. Vallet P. (2015). Effects of stand composition and tree size on resistance and resilience to drought in sessile oak and scots pine. For. Ecol. Manag.339, 22–33. doi: 10.1016/j.foreco.2014.11.032
36
Millar C. I. Stephenson N. L. (2015). Temperate forest health in an era of emerging megadisturbance. Science349, 823–826. doi: 10.1126/science.aaa9933
37
Newman B. D. Wilcox B. P. Archer S. R. Breshears D. D. Dahm C. N. Duffy C. J. et al . (2006). Ecohydrology of water-limited environments: A scientific vision. Water Resour. Res.42:W06302, doi: 10.1029/2005WR004141
38
R Core Team . (2017). R: a language and environment for statistical computing. R Foundation for Statistical Computing, Vienna, Austria. Available online at: https://www.R-project.org/
39
Serreze M. C. Barry R. G. (2011). Processes and impacts of Arctic amplification: a research synthesis. Glob. Planet. Change77, 85–96. doi: 10.1016/j.gloplacha.2011.03.004
40
Silva L. C. R. Anand M. Oliveira J. M. Pillar V. D. (2009). Past century changes in Araucaria angustifolia (Bertol.) Kuntze water use efficiency and growth in forest and grassland ecosystems of southern Brazil: implications for forest expansion. Glob. Change Biol.15, 2387–2396. doi: 10.1111/j.1365-2486.2009.01859.x
41
Tei S. Morozumi T. Nagai S. Takano S. Sugimoto A. Shingubara R. et al . (2019b). An extreme flood caused by a heavy snowfall over the Indigirka River basin in northeastern Siberia. Hydrol. Process.34, 522–537. doi: 10.1002/hyp.13601
42
Tei S. Sugimoto A. (2018). Time lag and negative responses of forest greenness and tree growth to warming over circumboreal forests. Glob. Change Biol.24, 4225–4237. doi: 10.1111/gcb.14135
43
Tei S. Sugimoto A. Yonenobu H. Kotani A. Maximov T. C. (2019a). Effects of extreme drought and wet events for tree mortality: insights from tree-ring width and carbon isotope ratio in a Siberian larch forest. Ecohydrology12:e2143. doi: 10.1002/eco.2143
44
Tei S. Sugimoto A. Yonenobu H. Matsuura Y. Osawa A. Sato H. et al . (2017). Tree-ring analysis and modeling approaches yield contrary response of circumboreal forest productivity to climate change. Glob. Change Biol.23, 5179–5188. doi: 10.1111/gcb.13780
45
Tei S. Sugimoto A. Yonenobu H. Ohta T. Maximov T. C. (2014). Growth and physiological responses of larch trees to climate changes deduced from tree ring widths and d13C at two forest sites in eastern Siberia. Polar Sci.8, 183–195, doi: 10.1016/j.polar.2013.12.002
46
van Mantgem P. J. Stephenson N. L. Byrne J. C. Daniels L. D. Franklin J. F. Fule P. Z. et al . (2009). Widespread increase of tree mortality rates in the western United States. Science323, 521–524. doi: 10.1126/science.1165000
47
Wang X. Xu T. Xu C. Liu H. Chen Z. Li Z. et al . (2023). Enhanced growth resistance but no decline in growth resilience under long-term extreme droughts. Glob. Change Biol.30:e17038. doi: 10.1111/gcb.17038
48
Wigley T. M. L. Briffa K. R. Jones P. D. (1984). On the average value of correlated time-series, with applications in dendroclimatology and hydrometeorology. J. Clim. Appl. Meteorol.23, 201–213. doi: 10.1175/1520-0450(1984)023<023<0201:OTAVOC>2.0.CO;2
49
Wiley E. Helliker B. (2012). A re-evaluation of carbon storage in trees lends greater support for carbon limitation to growth. New Phytol.195, 285–289. doi: 10.1111/j.1469-8137.2012.04180.x
50
Zhang R. Hu Z. Cherubini P. Cooper D. J. Zhu L. Lei P. (2023). Tree-ring data reveal trees are suffering from severe drought stress in the humid subtropical forest. For. Ecol. Manag.546:121330. doi: 10.1016/j.foreco.2023.121330
Summary
Keywords
terrestrial forest, ecosystem, spatio-temporal variations, forest dynamics, high latitude region
Citation
Tei S (2025) Spatio-temporal variations in past extreme tree-growth reduction events and their resilience components over northern high-latitude regions. Front. For. Glob. Change 8:1574845. doi: 10.3389/ffgc.2025.1574845
Received
19 February 2025
Accepted
14 July 2025
Published
12 August 2025
Volume
8 - 2025
Edited by
Aziz Ebrahimi, Purdue University, United States
Reviewed by
Angela Klock, Forest Service, United States Department of Agriculture, United States
Armando Gomez-Guerrero, Colegio de Postgraduados (COLPOS), Mexico
Updates
Copyright
© 2025 Tei.
This is an open-access article distributed under the terms of the Creative Commons Attribution License (CC BY). The use, distribution or reproduction in other forums is permitted, provided the original author(s) and the copyright owner(s) are credited and that the original publication in this journal is cited, in accordance with accepted academic practice. No use, distribution or reproduction is permitted which does not comply with these terms.
*Correspondence: Shunsuke Tei, tei_shunsuke900@ffpri.go.jp
Disclaimer
All claims expressed in this article are solely those of the authors and do not necessarily represent those of their affiliated organizations, or those of the publisher, the editors and the reviewers. Any product that may be evaluated in this article or claim that may be made by its manufacturer is not guaranteed or endorsed by the publisher.