Abstract
Centrolobium ochroxylum Rose ex Rudd, known as Amarillo Guayaquil (AG), is a tropical tree species found in secondary vegetation or the wild in the western lowland region of Ecuador (WLRE). AG has heavy (0.78 g/cm3) and durable wood, with whitish sapwood and orange-yellow heartwood, making it ideal for carpentry and construction. The International Union for Conservation of Nature in 2021 classified AG as a threatened and critically endangered tree species. However, information on the forest's growth and yield is limited. The primary objective of this study was to evaluate the first provisional models of growth, yield, site index (SI), volume, and diameter at breast height (DBH) - total height (H) relationships developed for AG planted in live fences in WLRE. A total of 415 sample plots, each measuring one ha in area, were surveyed. AG trees were arranged in live fences, and UTM coordinates and planting dates were recorded. H and DBH were measured in 160 trees per plot in 2004, 2009, 2012, 2016, and 2018. To model volume, diameters were measured at different heights on randomly selected trees in 195 study sites. Cross-validation revealed that the CR-GADA model, with its three parameters, achieved a better balance between fitness and generalisability than the CR-H model. The Spurr function was found to be the best model for determining the total volume. The linear model was selected to describe the H-DBH relationship in the study region because of its stability and statistical significance. However, the model of Larson showed better overall indicators of fit. Variation of the H-DBH relationship was observed according to the SI. The maximum MAI was 14.8 m3 ha−1 yr−1 at age 26 years on the best sites, whereas, on less favorable sites, the maximum MAI was 4.4 m3 ha−1 yr−1 at age 30 years. These models are preliminary and require validation with independent samples. Future studies should include data from mature plots and conduct economic analyses on silvopastoral systems, as well as study the carbon sequestration of AG to encourage reforestation.
1 Introduction
The silvipasture system (SPS) is among the most promising options for mitigating climate change through carbon sequestration. However, the carbon sequestered in agroforestry and SPS depends on several factors, including tree type, tree density, system age, soil type, and climate (Sharma et al., 2023). The Food and Agriculture Organization classifies agroforestry, including SPS, as a climate-smart agricultural practice that diversifies the economy, protects against erosion, and acts as a carbon sink (Valenzuela Que et al., 2022). The implementation of feed production systems with live fences, which integrate trees, grass, and livestock, improves productivity by providing shade, reducing livestock heat stress, and conserving soil moisture. These systems also contribute to carbon sequestration, making them a key strategy in addressing climate change and rural poverty (Shibu and Udawatta, 2021). In addition, agroforestry and SPS can reduce the carbon footprint of livestock production by capturing carbon dioxide through trees and improving the thermal comfort of livestock, thereby optimizing feed conversion and reducing methane emission per unit of meat or milk (Brook et al., 2022; Valenzuela Que et al., 2022). In this context, policymakers, farmers and the scientific community must recognize agroforestry as a strategic link between environmental conservation and agricultural productivity, considering that its adoption is not only determined by political or economic factors but also by socio-cultural realities and dynamics (Mlambo et al., 2025). The focus of scientific research on SPS in Ecuador is limited to 17 articles published in the last three decades (1992–2022), according to data from the Scopus database (Torres et al., 2023). Moreover, among these studies, only one is specifically dedicated to the study of the growth, yield, and production of the forest component within an SPS, as reported by Cañadas-López et al. (2018). Forest modeling addresses the natural dynamics, growth, production, yield, biologically optimal rotation age (BORA), mortality, and changes in tree-species composition and structure across different ecological conditions and through time (Bailey and Clutter, 1974; Vanclay, 1994; Cañadas-López et al., 2023a). This knowledge of biological and ecological factors supports effective forest management, including silviculture (Shenkin et al., 2020). Determining the BORA of native species is essential, as species-specific growth models can then maximize yields and guide decisions on reforestation, timber production, carbon sequestration, and forest–ecosystem restoration projects (Krainovic et al., 2023).
Forest site quality refers to the inherent capacity of a specific location to produce forest vegetation, influenced by primary site factors (van Laar and Akça, 1997). A key indicator for assessing this quality is the site index (SI), which enables the estimation of a forest stand's potential growth and productivity. SI is commonly defined as the dominant height, i.e., the height of the tallest trees at a specific age. However, variability in environmental factors, site quality and forest stand productivity led to variations in the growth of the dominant height of the same tree species in different regions, which can affect the results of the SI estimation (Duan et al., 2022). According to Assmann's (1970) concepts, the dominant height is the mean value of the thickest 100 stems per hectare (H100). Basic tree growth models generate sigmoidal growth functions with a single asymptote, which is useful but limited in terms of forest variability. The Richards (1959) basic growth model is often superior due to its flexibility and fit, allowing for better adaptation to diverse conditions and a more realistic representation of forest growth (Wykoff, 1990; Zeide, 1993; von Gadow et al., 2001).
The generalized algebraic difference approach (GADA) is noted for its ability to generate families of dynamic polymorphic site curves with multiple asymptotes; this approach enables (and requires) more than one parameter to be site-specific and inclusion of at least three growth parameters (Protazio et al., 2022). The flexibility of the Chapman-Richard (CR-GADA) method enables the development of better-fitting growth models for the diverse environmental and growth conditions of tree species in different forest regions (Cieszewski and Bailey, 2000; Cieszewski, 2001, 2002, 2003). However, Protazio et al. (2022) pointed out that novel hybrid growth models with only one growth parameter yield similar accuracy as GADA models if the growth parameters are strongly correlated. The Chapman-Richards-Hybrid (CR-H) growth model benefits from this simplification, maintaining predictive quality and always providing a closed solution. Protazio et al. (2022) suggested that this hypothesis should be tested with other species and growth models in future studies.
Of the tree species in tropical lowland forests, 30% are threatened (vulnerable, endangered, and critically endangered) and are included on the IUCN Red List (International Union for Conservation of Nature, 2022). The threatened and critically endangered Centrolobium o. Rose ex Rudd, also known locally as Amarillo Guayaquil (AG) or Amarillo Lagarto (International Union for Conservation of Nature, 2021), is a native species in the western lowlands region of Ecuador (WLRE) that is seldom used in SPS. Its leafy foliage plays a crucial role in preserving insects and soil microorganisms while providing an optimal environment for a diverse range of beneficial fungi and bacteria. Additionally, its seeds serve as a vital food source for wildlife (Gamboa-Trujillo, 2019). AG is characterized by a durable and long-lasting wood, with a light-colored sapwood and a heartwood that has a distinctive yellow-orange color. These qualities make it an excellent choice for carpentry and structural building applications (Cañadas, 1983). Information on AG growth and production in Ecuador remains limited, with much of the current knowledge derived from congresses, bachelor's and master's theses (Cañadas-López et al., 2013; Moreira and Hidalgo, 2018; Ayala Cifuentes, 2023).
In the case of AG, data on growth, SI, volume, and height (H)–diameter at breast height (DBH) relationships—factors crucial for forest management (Hossfeld, 1805; Trorey, 1932)—have not yet been explored in SPS. The main aim was, therefore, to evaluate provisional models of growth, yield, SI, volume and the H-DBH relationship fitted for AG planted in live fences in the WLRE. We expect CR-GADA to be a better growth model than CR-H if the more (three) growth parameters used are only slightly correlated with each other, which should lead to better precision of the model. We, therefore, also assume that volume and H-DBH models perform better when more parameters are used. The Ecuadorian forestry sector necessitates methodological adaptations to produce reliable estimates of timber resources nationwide. However, the number of volumetric studies related to trees in the biome remains restricted, especially in terms of obtaining form factors and ratios. These models could cover the basic forest data and thus contribute to more sustainable management of this threatened tree species, with potential benefits for its long-term conservation.
2 Materials and methods
2.1 Study area
A total of 415 research plots were established in 25 cantons (municipalities) across the provinces of Esmeraldas, Manabí, Los Ríos, Guayas, Santa Elena, El Oro, and Loja in the WLRE, encompassing a wide range of climate gradient conditions (Figure 1).
Figure 1
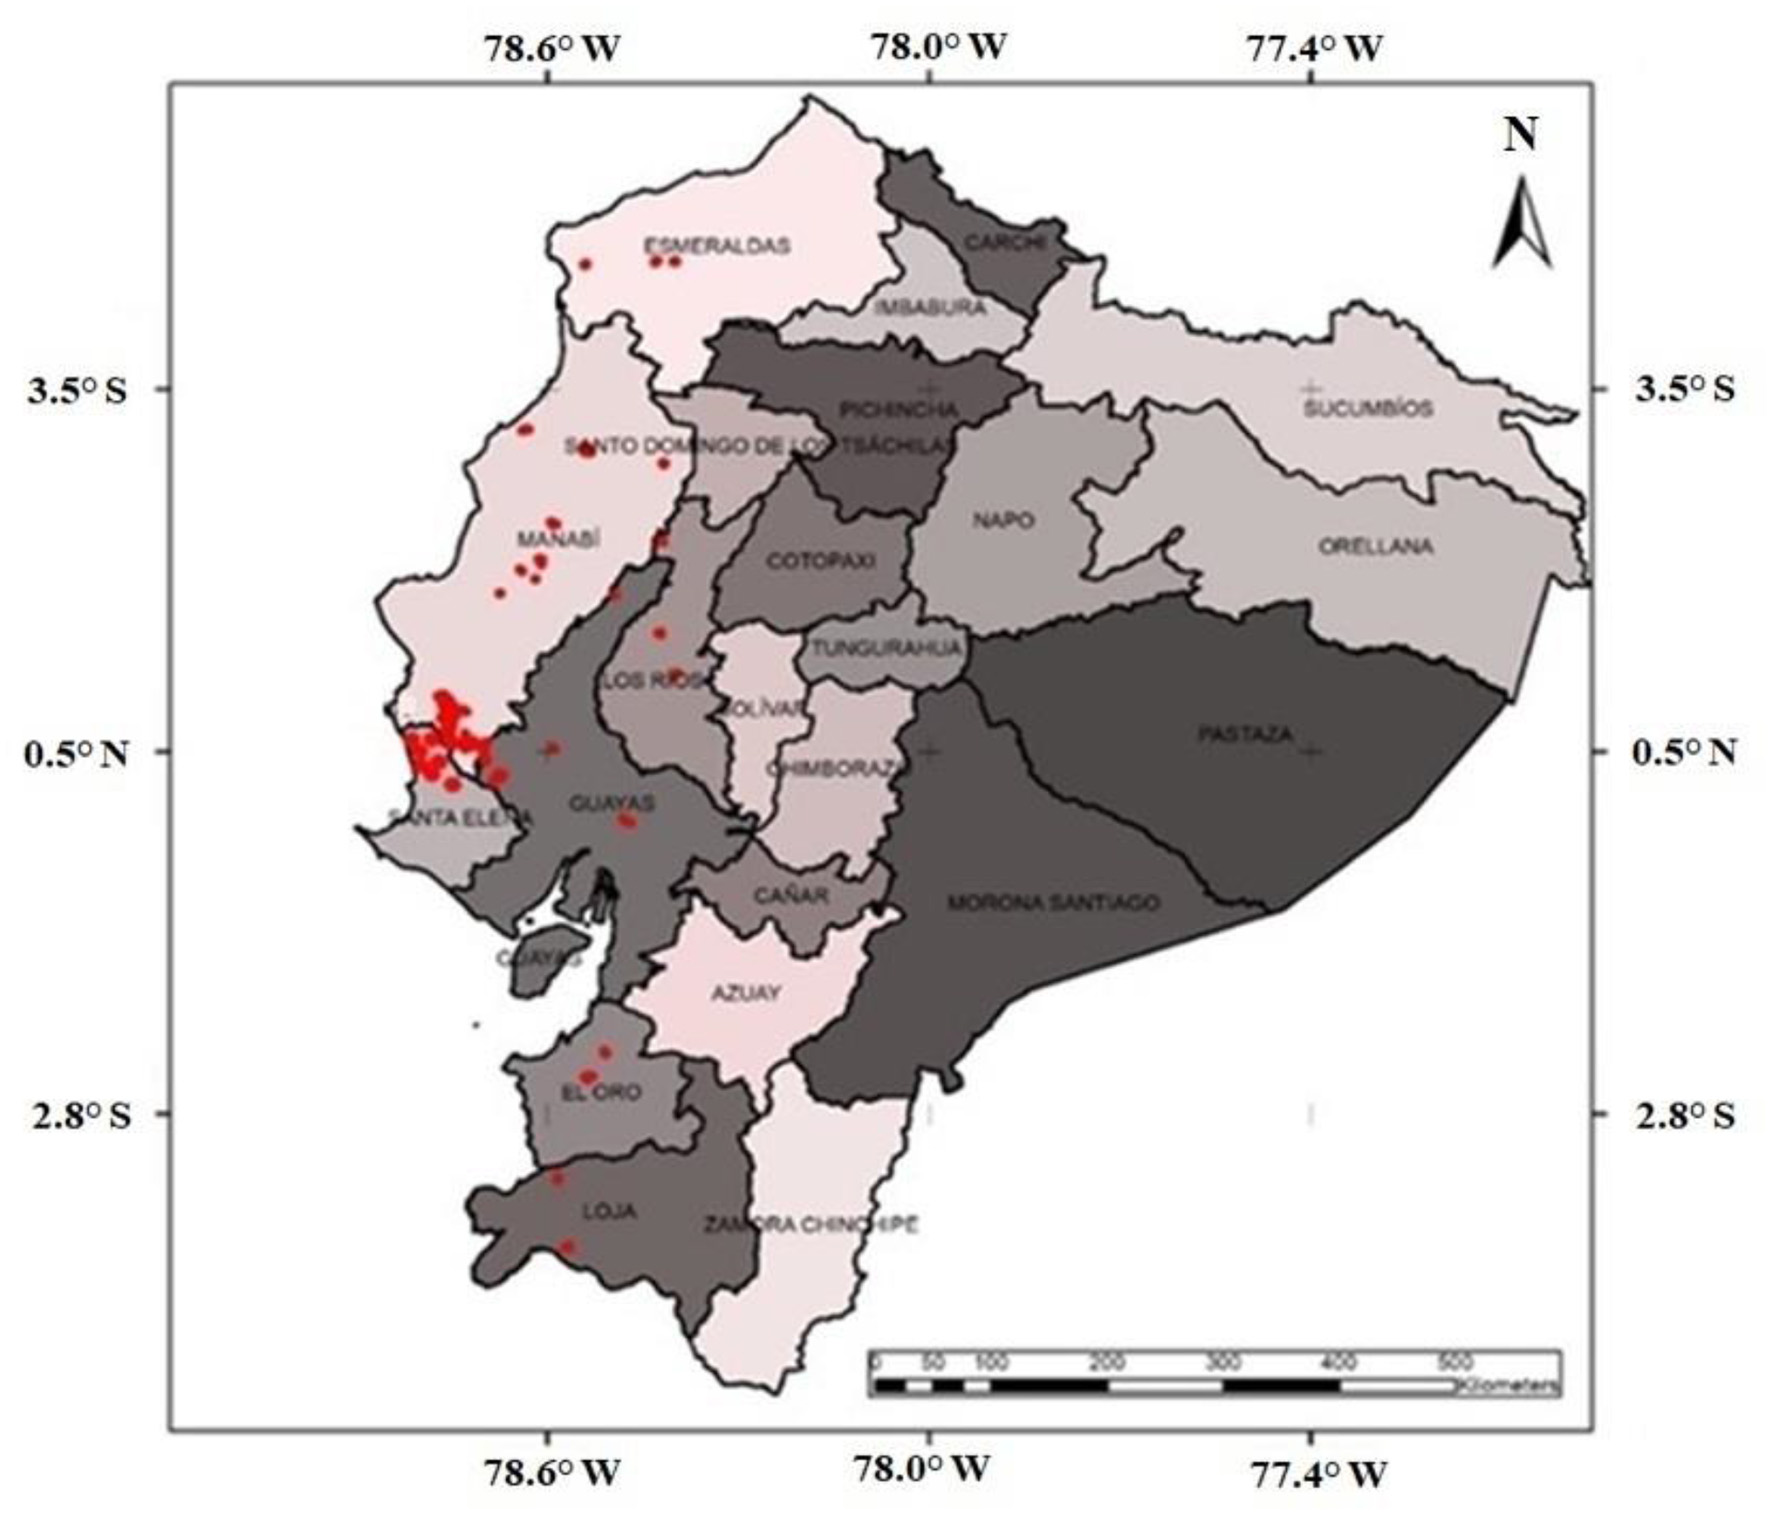
Geographical distribution of silvopastoral system research plots in the western lowland region of Ecuador.
The monthly precipitation distribution by province in the main SPS sites of the study region is unimodal. When plotted against the monthly evapotranspiration calculated using the Thornthwaite formula (Cañadas, 1966, 1982, 1983; Rade-Loor et al., 2017, 2025), a gradient of average annual precipitation intensity and the range of water deficit by month can be observed (Figure 2).
Figure 2
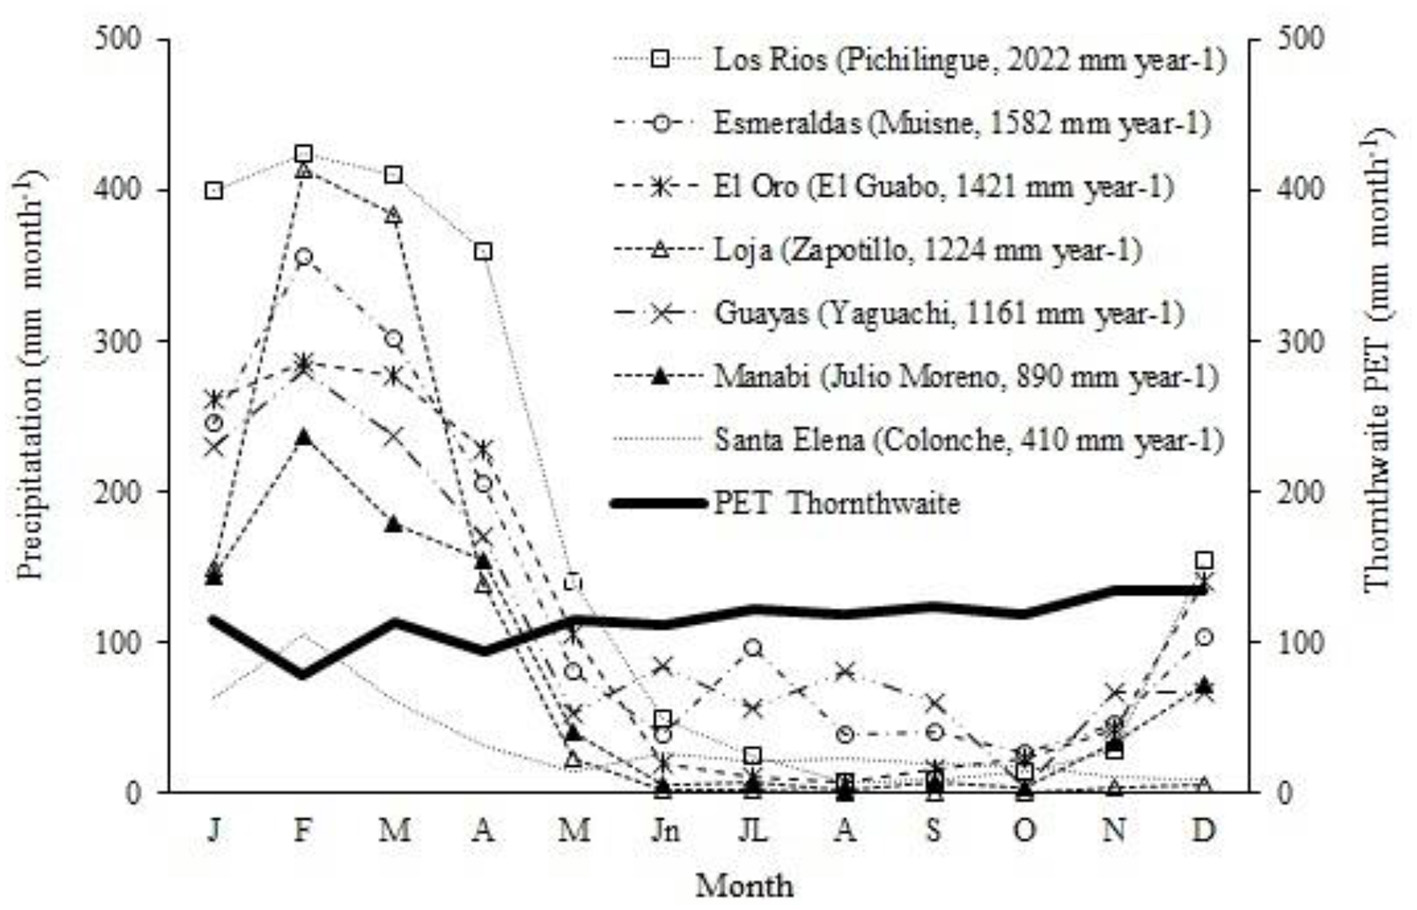
Distribution of monthly average precipitation (dotted line) and evapotranspiration potential calculated with Thornthwaite's formula (solid line). Water deficit (shaded area) in planting sites of the main silvopastoral systems across seven provinces in the western lowlands region of Ecuador.
A summary of the agroecological conditions in the study region is presented in Table 1A, and the characterization of tree components for growth models and for determining the AG volume is provided in Table 1B.
Table 1A
| Province | Mean annual precipitation (mm year−1) | Mean annual temperature (°C) | Soil classification (USA soil taxonomy) | Number of sample plots |
|---|---|---|---|---|
| Esmeraldas (Muisne) | 830 | 25.6 | Entisols | 4 |
| Manabí | 798 | 24.6 | Inceptisols | 228 |
| Santa Elena | 750 | 24.1 | Molisols | 152 |
| Guayas | 1,198 | 25.7 | Vertisols | 20 |
| Los Ríos | 2,000 | 25.2 | Inceptisols | 5 |
| El Oro | 1,788 | 22.9 | Inceptisols | 4 |
| Loja | 1,453 | 15.0 | Ultisols | 2 |
Summary of climatic and edaphic variables and number of plots per province in the western lowland of Ecuador.
Table 1B
| Descriptive statistics | Tree characterization in SPS | Sample trees selected for volume | |||||
|---|---|---|---|---|---|---|---|
| Age (years) | DBH 160 (cm) | H 160 (m) | DBH 100 (cm) | H 100 (m) | DBH (cm) | H (m) | |
| Mean | 13.18 | 17.74 | 17.70 | 18.13 | 18.09 | 14.03 | 16.97 |
| Maximum | 30.00 | 35.09 | 34.55 | 35.87 | 35.58 | 31.53 | 30.23 |
| Minimum | 1 | 0.29 | 0.10 | 0.30 | 0.96 | 5.30 | 4.98 |
| Standard deviation | 6.85 | 8.27 | 8.56 | 8.45 | 8.57 | 4.83 | 4.11 |
Descriptive statistics of the forest component of the investigated silvopastoral systems, including age and diameter at breast height and height of the 160 trees (DBH160, H160) and 100 trees (DBH100, H100), in the western lowland region of Ecuador.
2.1.1 Research plots
As part of the reforestation project Chongón Colonche, managed by the Ecuadorian Ministry of Environment, Fundación Natura (a Local NGO), and the German Kreditanstalt für Wiederaufbau (KfW) since 1999, a total of 2,231 hectares with 45 different tree species have been planted in the provinces of Manabí, Santa Elena, and Guayas. Eleven different reforestation systems were promoted. The systems with the fewest trees were the preferred ones. The spacing of the trees and the distribution in the reforestation area were pre-established by the project, and the incentive payments were prorated over 3 years to ensure that the plantations were established and payments were made per hectare (Cañadas-López and Roca, 2011). One of the species planted was AG, arranged in live fences forming SPS. Additional plots were established in Esmeraldas, El Oro, Guayas, Los Ríos, and Loja through research projects conducted by the National Institute of Agricultural Research (INIAP), the Technical University of the North (UTN), SEK International University (UISEK), and the Eloy Alfaro Laica University of Manabí (ULEAM).
The SPSs consist of 200 trees, spaced 2 meters apart and delimiting a rectangular agricultural area of one hectare (Cañadas-López and Roca, 2011), referred to here as research plots. In total, 415 plots were measured in 2004, 2009, 2012, 2016, and 2018, located in different soil water availability zones (Figure 1 and Table 1A) and with a constant planting density. Instead of the conventional H100 (Assmann, 1970), the most vigorous and dominant trees, measured at 160 trees per hectare, were selected according to the Chongón-Colonche Reforestation Project, as described by Antón-Fernández et al. (2011), in water-stressed areas. On average, this corresponds to approximately 90% of the remaining trees in the plot. The reason was that the growth of a stand consisting of more than just dominant trees was better estimated using more than 100 trees per hectare. Furthermore, there is no statistical difference in the mean heights between the 100 and 160 thickest trees per ha in this study (18.03 vs. 17.64 m, p > 0.05). The H was measured with the “HAGA” hypsometer, a 1:15 scale graduated ruler, and a diametric tape (1.30 m above the ground) was used to determine the DBH. The mean values of total H and DBH were assessed to calculate the corresponding functions. Through incentives paid for the reforestation project Chongón Colonche, prorated over 3 years, and a final payment per tree established, a 90% survival rate was achieved in SPS (Cañadas-López and Roca, 2011). In terms of mortality, 3% was recorded during the study. Since the adjusted models are provisional and based on surviving trees at the time of measurement, mortality was not explicitly included in the MAI and PAI projections.
2.2 Methods
2.2.1 Determination of the AG growth and site index models
The CR-GADA model was first used to determine the growth of H and DBH of AG to construct a polymorphic model with multiple asymptotes based on the Chapman-Richards model (Equation 1).
More than one parameter must be a function of site productivity. To generate Equation 1 with the GADA formulation, either the asymptote a1 or the shape parameter a3 is dependent on on-site quality (X), and the relationship can be expressed as follows:
In this study, a1 was modeled as a direct function of site quality (a1 = X) rather than using the commonly used exponential form (). All estimated values of a1 were positive and biologically significant in our dataset. However, we recognize that the use of eX, by definition, guarantees the positivity of the parameter and potentially provides greater robustness for wider applications. We therefore recommend that this formulation be considered in future studies. Thus, for two pairs of dominant height and diameter-age values, Equation 1 is rewritten as follows:
where H0 is the height at initial age t0, and H1 is the height and diameter at age t1. Transforming to the natural logarithm (ln) of both sides of the first of the above equations is obtained:
For Equation 3, the solution of X involves finding the roots of a quadratic equation, selecting the most appropriate root expression, and then substituting it into the second expression of the pair of Equation 4. This yields a second-degree polynomial as a function of X whose value can be solved. The solution for X in Equation 4, with values of initial conditions t0 and H0, is expressed as follows:
Consequently, by selecting the solution for X0 and substituting it into Equation 4, we obtain the dynamic equation in GADA that gives polymorphic curves with multiple asymptotes:
where X0 is given by Equation 5. Fitting this equation to real dominant height-age and diameter-age data allows for more detailed estimation of the global parameters b1, b2, and b3, as described in Cieszewski and Bailey (2000), Cieszewski (2001), Cieszewski (2002), and Cieszewski (2003). The Chapman-Richards hybrid growth function (CR-H), proposed by Protazio et al. (2022) and based on the algebraic differential method (ADA), was applied. This approach attempts to simplify the model through parameter substitution (Bailey and Clutter, 1974). CR-H can be defined as a hybrid function, as it initially applies a variable substitution of the type θ2=a/θ1 and then assumes that the parameter a is site-specific (ADA methodology). The base model of CR in its ADA form, according to the family of polymorphic curves, is expressed for θ2, as follows:
where H2 is the height of state 2, H1 is the height (m) in measurement state 1, t1 and t2 are the tree ages (years) corresponding to states 1 and 2; and θ1 y θ2 are model parameters. This expression can be rewritten in exponential form as follows:
The CR-H growth function proposed by Protazio et al. (2022) was then used to determine the growth of AG H and DBH. The number of parameters was then reduced by substituting θ2 in the function θ2 = f(θ1). As a result, the age-specific Chapman-Richards function is reformulated as follows:
where θ1 symbolizes the maximum upper H and DBH achieved by an individual. This reformulation limits the model to a single parameter θ1, under the condition that the function θ2 = f(θ1) exists and can be defined. Thus, assuming an inverse relationship between the parameters θ1 and θ2, it can be expressed as follows:
It was thus possible to reformulate Equation 9 as follows:
where a is a scaling factor. Using the algebraic difference approach and considering that parameter a = X0 in Equation 11 has a site-specific relationship, and assuming the initial conditions DBH(t0) = DBH0, the following is true:
Replacing this result in Equation 11 finally yields the following equation:
Thus, Equation 13 depends only on the parameter θ1 under the initial condition t0 and H0 and DBH0 and H and DBH represent the height (m), and DBH denotes the DBH (cm).
The non-linear regression method was implemented using the nlsLM function, along with the optimx optimization package, to facilitate the search for a local optimum (Nash and Varadhan, 2011) in R (version 4.3.1) (R Core Team, 2023).
The guide curve method was used to generate SI functions that describe the average pattern of the complete series of H and DBH with age without differentiating between zones in the study area. Polymorphic curves were developed from this curve, and the H and DBH reached at 10 years of age were established as reference values for AG in WLRE (Cañadas, 1983; Shater et al., 2011).
The model fitting analysis for the CR-GADA (Equation 6) and CR-H (Equation 13) was based on R2Adj calculation of the BIAS and the root mean square error (RMSE) of the models and their graphical comparison across age classes and the Akaike's Information Criterion (AIC) (Snipes and Taylor, 2014). Using the createFolds function in R (R Core Team, 2020, 2023), the models were evaluated through 10-fold cross-validation, where 90% of the dataset was used as the training set and the remaining 10% as the test set (Hastie et al., 2009). A likelihood ratio test (Cavanaugh and Neath, 2019) was performed in R, and the corresponding p-value was obtained (R Core Team, 2023) to determine whether the differences in AIC values between CR-GADA and CR-H were statistically significant.
2.2.2 Volume estimation for AG
A total of 160 dominant trees were randomly selected in each of the 195 research plots for AG volume modeling. The average DBH was 14.03 cm (range 5.00–30.23 cm), and the average H was 16.97 m (range 4.98–31.50 m) for the sampled (felled) trees. Diameter tapes were used to measure the diameter (di) over the bark at different heights: 0.30 m, 2.30 m, and thereafter every 2.00 m along the stem to the tip. The total volume (V, m3) was established by measuring the diameter at each end section (d1 and di+1) and the length of the sections (l) of the felled tree, using the following equation by Wehenkel et al. (2012):
A total of eight volume models were tested to establish the best regression model for V in relation to DBH and H. The models are summarized in Table 2. The values of parameters a, b, c, and d were estimated using the generalized method of moments (GMM) in SAS/ETS®, which estimates exact parameters under heteroscedasticity conditions (SAS Institute Inc, 2008).
Table 2
| Model reference or name | Model | Expression | Equations |
|---|---|---|---|
| Schumacher and Hall (1933) | Schumacher-Hall (allometric) | V = a * DBHb * Hc | (18) |
| Spurr (1952) | Spurr | V = a * DBH2 * H | (19) |
| Spurr (1952) | Spurr potential | V = a * (DBH * H)b | (20) |
| Spurr (1952) | Spurr with the independent term | V = a + b * DBH2 * H | (21) |
| Alt et al. (2022) | Incomplete generalized combined Variable | V = a+b * H+c * DBH2 * H | (22) |
| Avery and Burkhart (2015) | Australian formula | V = a+b * DBH2+c * H+d * DBH2 * H | (23) |
| Honer (1965) | Honer | V = DBH2/(a+b/H) | (24) |
| Newnham (1992) | Newnham | V = a+b * DBHc * Hd | (25) |
Centrolobium ochroxylum tested volume models adjusted to the diameter at breast height (DBH, cm) and total tree height (H, m) in the western lowland region of Ecuador.
The accuracy of the volume model fits was estimated using root mean square error (RMSE), standard error (SE), and adjusted determination coefficient (R2Adj). The model that yielded the lowest AIC values was established as the most adequate for estimating the total volume of the AG (Snipes and Taylor, 2014).
2.2.3 Valuation of AG production
For the calculation of volume per hectare (Vha), a constant density of 200 trees per hectare (N) was assumed, unadjusted for mortality, to estimate a potential yield based on this standard density. The average volume per tree (Vi) was modeled as a function of age and SI. Vha was calculated as follows:
The mean annual increment (MAI) was calculated by dividing the total volume per hectare (Vha), estimated for the rotation age (t), by the rotation age. In other words, the MAI represents the average volume produced per hectare each year during the rotation period.
The periodic annual increment (PAI) was calculated as the difference between the volume per hectare at the end and the beginning of a growing season (Vha2 - Vha1), divided by the length of the growing season (ti+1 - ti), as shown in Equation 17. Here, Vha1 and Vha2 represent the volume per hectare at times ti and ti+1, respectively.
The AG BORA is defined as the age at which the PAI is equal to the MAI and at which the MAI reaches its maximum value.
2.2.4 AGH-DBH relationship for each site index
A total of 10 models, which have been tested under tropical dry forest conditions (Camargo García and Kleinn, 2010), were applied to describe the AG H-DBH relationship and determine the goodness of fit (RMSE, R2Adj, AIC) (Table 3), using average H-DBH values from the 415 research plots. To analyse how their relationship varies with site conditions, the trajectories of the GADA height and DBH models were log-transformed by SI.
Table 3
| Model reference or name | Equations | Eq. |
|---|---|---|
| Linear | H = a+b * DBH | (26) |
| Potential: Prodan et al. (1997) | H = 1.3+a * DBHb | (27) |
| Bates and Watts (1980) | (28) | |
| Broadbent and Poon (2015) | (29) | |
| Gentile et al. (2023) | H = 1.3+10a * DBHb | (30) |
| Buford (1986) | (31) | |
| Larson (1986) | H = 1.3+expa * DBHb | (32) |
| Prodan et al. (1997) | (33) | |
| Pearl and Reed (1920) | H = 1.3+a * (1−exp(−b * DBH))c | (34) |
Models used to determinate the relationship of H with DBH for AG, the western lowland's region of Ecuador.
3 Results
3.1 AG site index
No statistically significant correlations were found between the parameters of the CR-GADA model fitted to the DBH-age relationship. The H-age showed moderate Spearman coefficients (rs between 0.343 and 0.629; p < 0.01), with a strong correlation between b2H and b3H.
Cross-validation shows that the parameters estimated from the H-age and DBH-age relationships were highly significant in both models evaluated (Table 4). The CR-GADA model demonstrated a higher predictive ability, with an R2Adj of 0.969 for the training set and 0.964 for the test set, indicating very good generalisability. In comparison, the CR-H model achieved an R2Adj of 0.887 for the training set and 0.878 for the test set, indicating an acceptable fit, albeit lower than that of the CR-GADA. These results support the higher reliability and generalisability of the CR-GADA model for representing H and DBH growth as a function of age in SPS.
Table 4
| Estimation | Model | RMSE | AIC | b1 | b2 | b3 | |
|---|---|---|---|---|---|---|---|
| Height-age | CR GADA CV | 1.49685 | 0.96423 | 30,471.49 | 0.10759 | −18.08721 | 69.95920 |
| CR-H CV | 2.98800 | 0.87758 | 42,027.14 | 47.31380 | - | - | |
| CR GADA (complete) | 1.49702 | 0.96945 | 30,471.49 | 0.10758 | −18.08721 | 69.95920 | |
| CR-H CV (complete) | 2.98920 | 0.87824 | 42,027.14 | 47.31225 | - | - | |
| DBH-age | CR GADA CV | 1.08290 | 0.98273 | 25,079.91 | 0.095204 | −17.61956 | 68.01157 |
| CR-H CV | 2.30537 | 0.92193 | 37,703.95 | 45.42955 | - | - | |
| CR GADA (complete) | 1.08430 | 0.98285 | 25,079.91 | 0.09520 | −17.61956 | 68.01157 | |
| CR-H CV (complete) | 2.30800 | 0.92234 | 37,703.95 | 45.42865 | - | - |
Statistical summary of H-age and DBH-age models of AG in the WLR, Ecuador, complete = without 10-fold cross-validation.
The CR-H model showed a recurring negative bias for trees between 0 and 10 years, both for H and DBH, while it showed a tendency to overestimate at tree ages from 10 to 24 years. Whereas the CR-GADA bias structure was distributed around the zero line (Figures 3A, B). The RMSE trajectory of the CR-GADA model for the H-age and DBH-age showed lower values by age class (Figures 3C, D). The AIC value of CR-GADA for H-age and DBH-age was significantly smaller than that of the CR-H method.
Figure 3
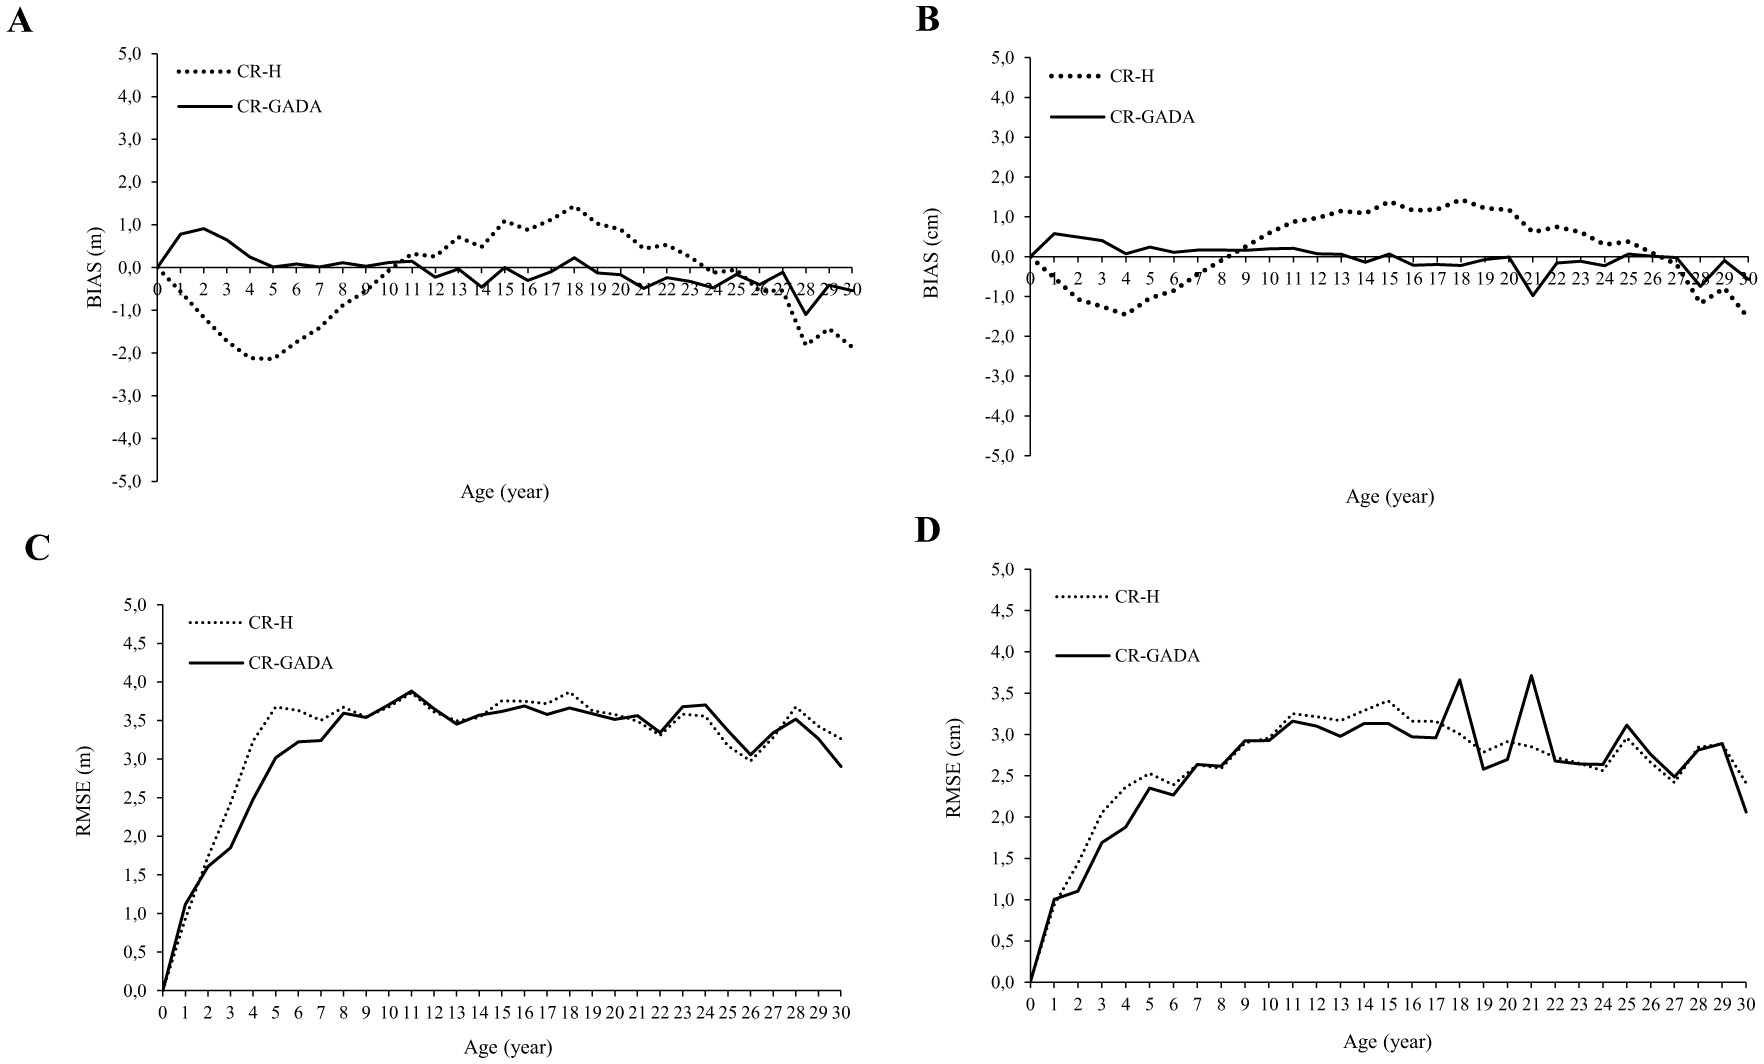
Bias (A, B) and root mean square error (RMSE; C, D) by age class for H(A, C) and DBH(B, D) estimated with the CR-H and GADA formulation respectively for Centrolobium ochroxylum tree in the western lowland's region of Ecuador.
The H-age GADA model is comprised of Equations 35, 36:
where H1 = predicted height (m) at age t1 (years), H0, t0 = initial height and age.
Equations 37, 38 present the DBH-age GADA model:
where DBH1 = predicted diameter (cm) at age t1 (years), DBH0, and. t0 = initial diameter and age.
The similarity between the CR-GADA model parameters for H and DBH suggests that, under live-fence conditions, the maximum increase in height is reached slightly earlier than that of diameter for AG. Using the CR-GADA model, site index (SI) curves were generated for heights of 8.00, 11.00, 14.00, 17.00 and 20.00 m at the reference age of 10 years (Figure 4A), and DBH curves for values of 9.00, 12.00, 15.00, 18.00, and 21.00 cm (Figure 4B). The research plots were classified into five site quality zones (I–V) based on the SI range. This graphic enables verification that the fitted curves follow the trend of the data throughout the age range.
Figure 4
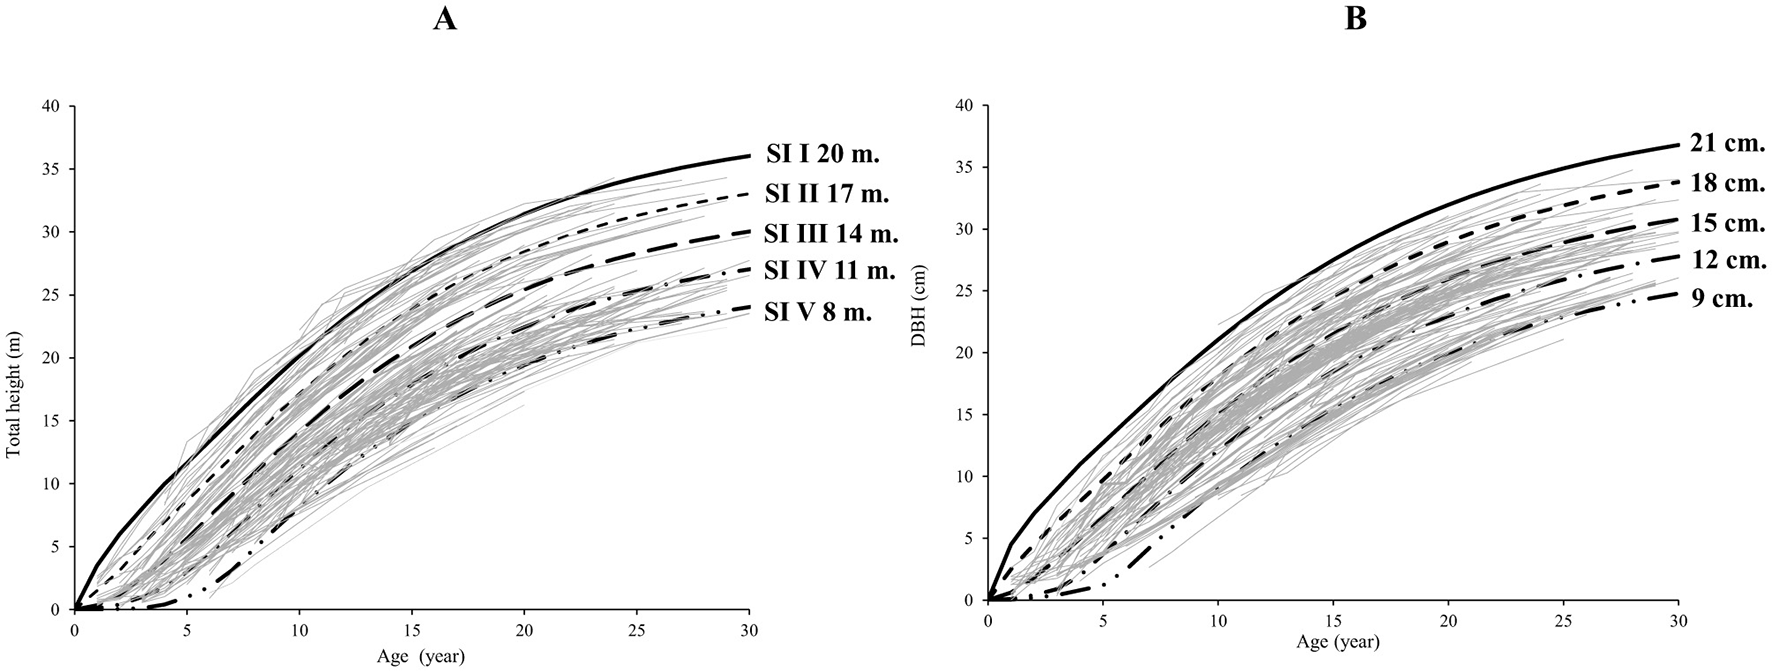
Site index curves for Centrolobium ochroxylum trees in silvopastoral systems in the western lowland region of Ecuador (A: total height, B: diameter at breast height), determined using the CR-GADA model at a reference age of 10 years.
3.2 AG stem volume model
The fitting values for the volume estimation for AG are presented in Table 5 and are arranged in ascending order according to the AIC criterion. Thus, the best model was the Spurr function (Equation 19). The resulting model for the AG was as follows:
The histogram of the residuals from the Spurr model (Equation 19) showed a distribution approximately centered on zero, with 58.5% of the residuals lying within ±0.05. The mean was−0.00053, very close to zero, and the skewness of 0.33 indicates acceptable symmetry (Figure 5). Although extreme values were observed, with 25.6% of residuals exceeding ±0.1, the maxima and minima remained within moderate ranges (0.289 to −0.319). The coefficient of variation was 147.7%. No marked heteroscedasticity patterns were evident, suggesting apparent homoscedasticity.
Table 5
| Model | RMSE | R2Adj | Parameter | Estimator | SE | AIC |
|---|---|---|---|---|---|---|
| Spurr (Equation 19) | 0.187 | 0.97 | a | 0.000045 | 0.00001 | 126.34 |
| Australian formula (Equation 23) | 0.051 | 0.93 | a | −0.17367 | 0.02103 | 168.92 |
| b | −0.00068 | 0.00005 | ||||
| c | 0.02863 | 0.00196 | ||||
| d | 0.00004 | 0.000001 | ||||
| Spurr potential (Equation 20) | 0.342 | 0.85 | a | 0.00007 | 0.00002 | 170.75 |
| b | 1.44231 | 0.04669 | ||||
| Incomplete generalized combined variable (Equation 22) | 0.094 | 0.88 | a | −0.30835 | 0.02474 | 170.84 |
| b | 0.03523 | 0.00257 | ||||
| c | 0.00001 | 0.0000001 | ||||
| Honer (Equation 24) | 0.413 | 0.79 | a | −343.79 | 96.10 | 172.91 |
| b | 29876.05 | 2289.55 | ||||
| Spurr with independent Term (Equation 21) | 0.186 | 0.77 | a | 0.00795 | 0.01245 | 173.72 |
| b | 0.00004 | 0.0000001 | ||||
| Schumacher-Hall (allometric) (Equation 18) | 0.045 | 0.94 | a | 0.000361 | 0.00006 | 359.48 |
| b | −0.085180 | 0.09391 | ||||
| c | 2.48693 | 0.08032 | ||||
| Newnham (Equation 25) | 0.043 | 0.48 | a | −0.05803 | 0.01448 | 789.00 |
| b | 0.00107 | 0.00031 | ||||
| C | −0.08713 | 0.07183 | ||||
| d | 2.17740 | 0.09475 |
Estimated parameters and fit statistics for eight volume models for AG tree in the western lowland region of Ecuador.
MSE, mean squared error; , adjusted determination coefficient; SE, standard error; AIC, Akaike information criterion.
Figure 5
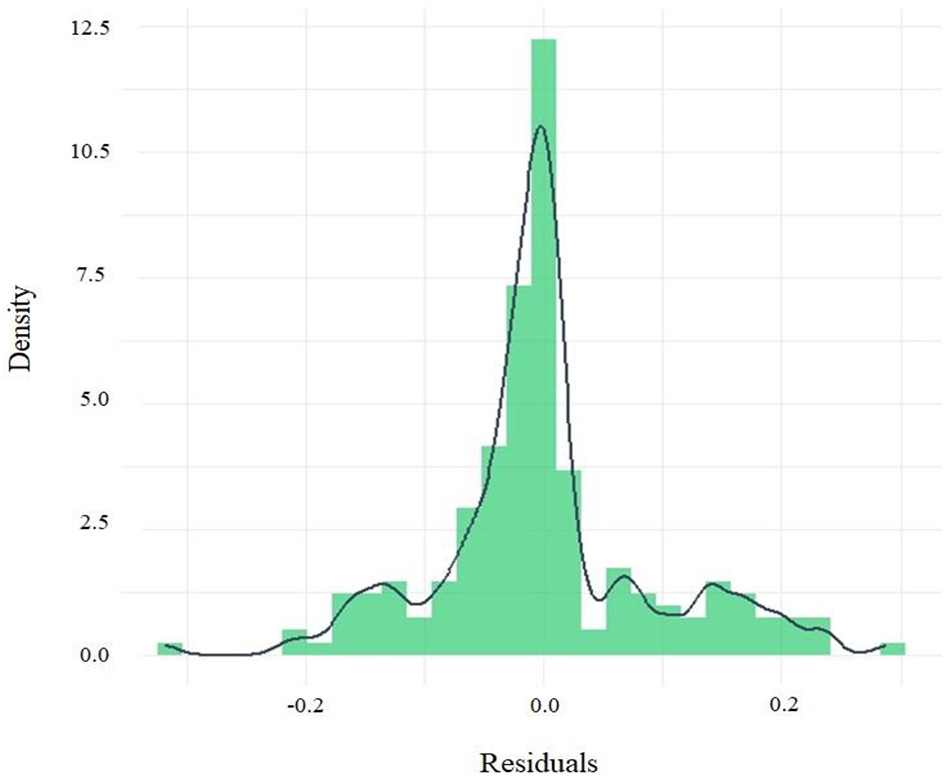
Histogram of the residuals of the Spurr model fitted by GMM for the estimation of the AG volume in the western lowland region of Ecuador.
3.3 AG mean annual increment
The MAI varied over time across the different growth site conditions, obtained in relation to the total volume of trees in the study area (Figure 6), considering a density of 200 trees per hectare within the SPS and using the Spurr volume model (Equation 39). The distributions of MAI and PAI over time are shown in Figure 6. The maximum MAI was 14.8 m3 ha−1 year−1, reached at age 26 in the best sites (using a density of 200 trees ha−1; H-ageEquation 35; DBH-ageEquation 37; and Volume Equation 39), coinciding with the BORA for AG, and a yield of 386.3 m3 ha−1 was recorded. In the less favorable sites, the maximum MAI was 4.4 m3 ha−1 year−1 at 30 years, indicating a yield of 135.9 m3 ha−1. The BORA ranged from 30 years in the worst sites to 26 years in the best sites.
Figure 6
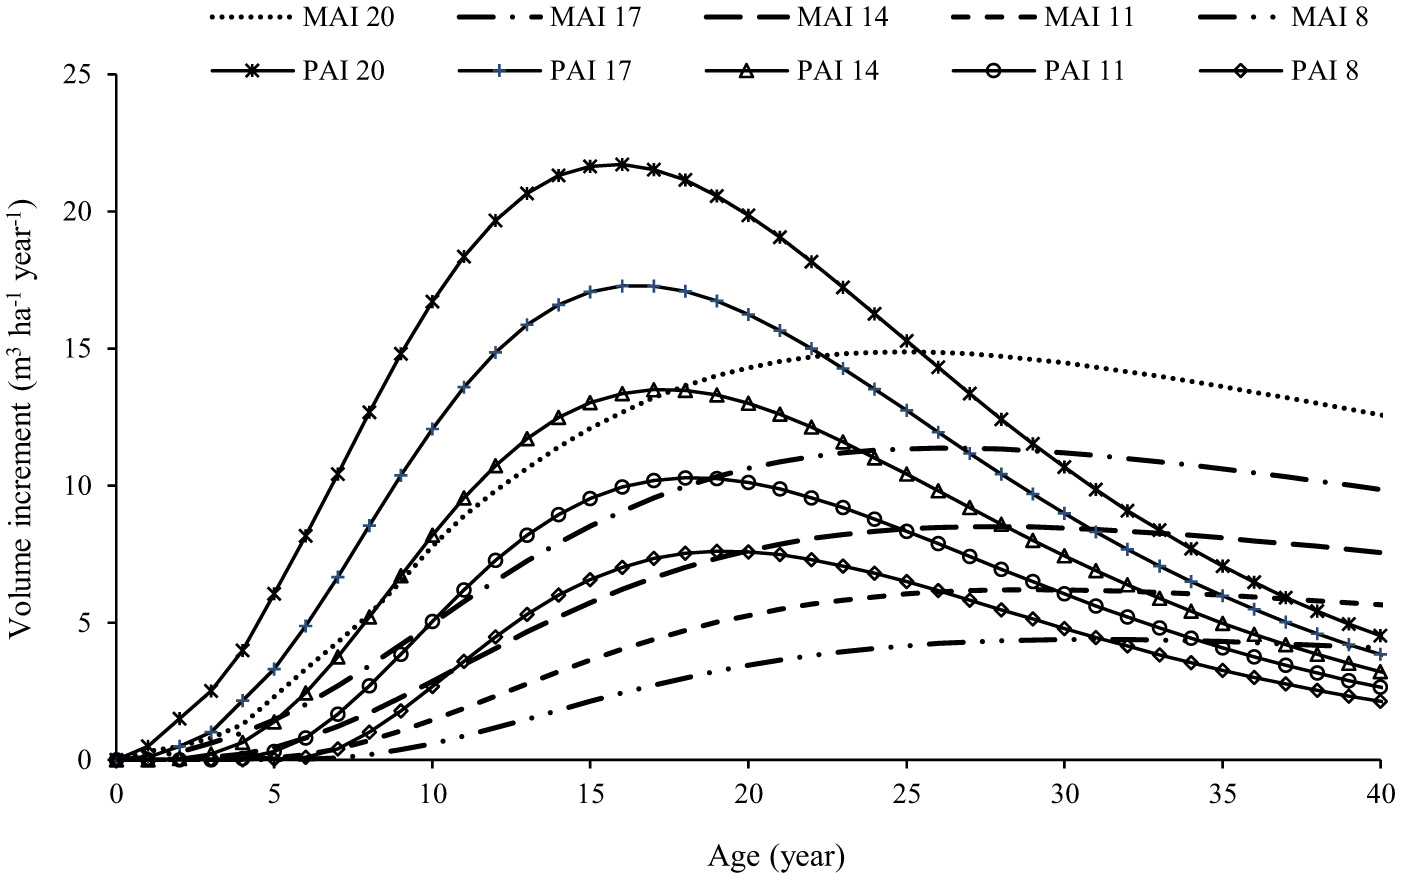
Relationship between MAI (dashed line) and PAI curves (solid lines) For various SI classes of boundary planted AG tree in WLRE, Ecuador, determined using the CR-GADA model; the coincidence of these two parameters can be considered the optimum biological rotation with a density of 200 Centrolobium ochroxylum trees ha−1 in the western lowland's region of Ecuador.
3.4 AG H-DBH models
Although the linear model had the lowest AIC (170), best RMSE (1.84 m), and high adjusted R2 (0.98). In contrast, the model of Larson (1986) had the second lowest AIC (173), a comparable fit (RMSE = 1.84 m, R2Adj = 0.97), and also parameters significantly different from zero; these two models were therefore selected to describe the H-DBH relationship (Table 6).
Table 6
| Model | RMSE | Parameter | Estimator | SE | AIC | |
|---|---|---|---|---|---|---|
| Linear | 1.84 | 0.98 | a | −0.9339 | 0.0956 | 170.24 |
| b | 1.0104 | 0.0048 | ||||
| Richards (1959) | 1.84 | 0.97 | a | −3.2339 | 0.0956 | 172.92 |
| b | 1.0104 | 0.0048 | ||||
| Gentile et al. (2023) | 1.86 | 0.97 | a | −0.2838 | 0.0116 | 172.93 |
| b | 1.1773 | 0.0084 | ||||
| Larson (1986) | 1.86 | 0.97 | a | −0.6536 | 0.0267 | 172.94 |
| b | 1.1773 | 0.0008 | ||||
| Potential (Buford (1986)) | 1.86 | 0.97 | a | 0.5201 | 0.0139 | 172.95 |
| b | 1.1774 | 0.0084 | ||||
| Prodan et al. (1997) | 1.84 | 0.97 | a | 21240.90 | 503331.10 | 174.92 |
| b | −21243.10 | 503331.10 | ||||
| c | 0.0040 | 0.00001 | ||||
| Prodan et al. (1997) | 1.83 | 0.97 | a | 81.1482 | 8.5075 | 174.93 |
| b | 0.0223 | 0.0029 | ||||
| c | 1.4786 | 0.0465 | ||||
| Pearl and Reed (1920) | 3.83 | 0.89 | a | 0.6020 | 0.0029 | 177.60 |
| b | 16.4677 | 0.00001 | ||||
| Broadbent and Poon (2015) | 1.84 | 0.97 | a | 0.8894 | 0.0077 | 188.99 |
| b | −1.0034 | 0.00001 |
Goodness of fit statistics of models predicting diameter at breast height-top height relationship for AG trees in the western lowland's region of Ecuador.
RMSE, root mean squared error; , adjusted determination coefficient; SE, standard error; AIC, Akaike information criterion.
Logarithmic transformation of DBH and H yielded a slope of 1.01 for the linear model (log10) for all study plots. When this linear relationship was broken down by SI at the regional level, a slope of 1.11 was obtained for the most favorable growth conditions and a slope of 0.74 for the least favorable conditions (Figure 7).
Figure 7
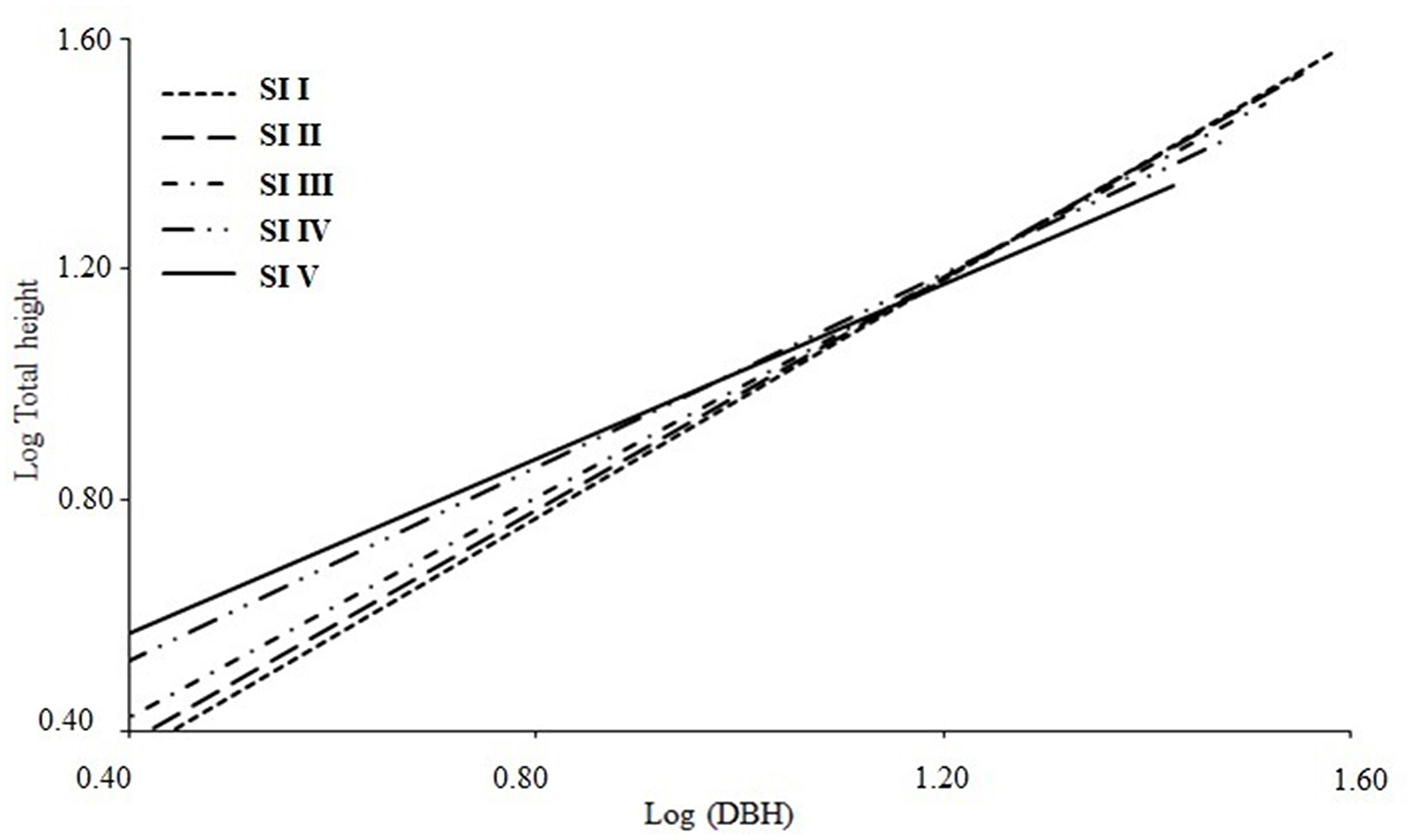
Centrolobium ochroxylum spatial variation of Log10H and Log10DBH allometry as a function of site index (SI), showing the linear equation for the western lowland region of Ecuador, DBH, diameter at breast height.
4 Discussion
In the present study, a mortality rate of 13% was recorded, which is considered low in the context of establishing SPS. Love et al. (2009) also reported a mortality rate of 13% and increased height growth in live fence systems with the legume Samanea saman (Jacq.) Merr., concluding that live fences provide a more favorable environment for the survival of various tree species (Lewis, 1980; Vandermeer, 1989; Duan et al., 2022; Calsavara, 2023). According to Brienen et al. (2020), this rate suggests that AG can be classified as a conservative species, characterized by increased longevity, low mortality, and moderate growth. Since the MAI and PAI models assume a constant density of 200 trees per hectare, the low mortality observed in the plots reduces the bias associated with this assumption in the projections.
4.1 AG growth and site index for height and diameter growth
As expected, the CR-GADA model had lower RMSE and AIC for both H and DBH growth compared to the CR-H model (Figure 3). This suggests that, in this study, the three growth model parameters were not sufficiently correlated, which limits the performance of CR-H. According to Protazio et al. (2022), the higher these correlations, the better the performance of the reduced model. As we did not account for errors due to temporal autocorrelation structures in this study, our models may contain underestimated standard errors and overly confident model selection criteria (Fleming et al., 2014).
According to CR-GADA, the best H growth (20 m) and DBH (21 cm) at age 10 years occurred in the Pichilingue site, which is characterized by a mean annual rainfall of 2,022 mm year−1 (Figure 2) with 6 months of water deficit and deep alluvial soils, silt loam texture, medium organic matter content, well-drained and rich natural soils (Cañadas-López et al., 2013). In intermediate site growth conditions for AG, H and DBH values of 14 and 15 cm, respectively, were recorded at age 10 years. The Yaguachi site is representative of these conditions (1,161 mm/year), exhibiting 8 months of water deficit. Under unsuitable AG site growth conditions, H and DBH values of 8 m and 9 cm, respectively, were registered at 10 years in the Chongón-Colonche site, with a mean annual precipitation of 410 mm year−1, exhibiting 11 months of water deficit (Figure 2). Maintaining the number of trees per hectare in the live fences of the studied SPS reveals that, under water stress, trees experience a reduction in growth despite their preferential access to light (Pretzsch et al., 2018). This pattern of height decline, related to water availability, suggests that height growth is especially affected on low-quality sites. These results are consistent with those of Pretzsch and Biber (2005), Carl et al. (2018), Cañadas-López et al. (2018), and Toraño Caicoya and Pretzsch (2021).
Similarly, if the number of AG trees per hectare is fixed in the live fences of the SPS studied (Figure 2), a decrease in DBH growth was also observed, reflecting site productivity (compare with Hatcher et al., 1993; Benjamin et al., 2000; Gea-Izquierdo et al., 2008; Cañadas-López et al., 2018). Thus, the relationship between DBH and age not only provides information on tree growth over time but can also reflect site conditions, including soil fertility and water availability (Gea-Izquierdo et al., 2008). This makes the use of DBH as an SI particularly valuable in the context of live fences, where these factors are crucial for the management and sustainable production of forest resources under tropical dry forests. Toraño Caicoya and Pretzsch (2021) warned that in water-restricted areas with low density, the maximum potential density may lead to an overestimation of the site index, which could give the impression that the site is more productive than it actually is. Thus, the establishment of trees in live fences (SPS) could be considered a more effective strategy to optimize tree growth related to water scarcity than planting in pure forests.
An equal DBH-age relationship has been presented in agroforestry and SPS by Gea-Izquierdo et al. (2008), Cañadas-López et al. (2018), and Cañadas-López et al. (2023a). However, a decrease in basal area with increasing annual precipitation and a longer dry season period has been reported by Ramírez and del Valle (2011), Pucha-Cofrep et al. (2015), and López et al. (2019). In an analysis of 60 tropical tree species involving the examination of tree rings, Brienen et al. (2016) concluded that the basal growth rate increases with the amount of precipitation. Mendivelso et al. (2014) found that in Bolivia, the growth of the genus Centrolobium is particularly sensitive to varying precipitation. On the other hand, Rodríguez et al. (2005) and Ramírez and del Valle (2011) reported a strong response in tree growth in relation to precipitation variation in dry sites in northern Colombia, Perú and southern Mexico, especially regarding the presence of the El Niño Southern Oscillation phenomenon. Temperature variations at the equator are characterized by lower inter-monthly variability. However, the climatic factors with the greatest influence on potential evapotranspiration are relative humidity and maximum temperature (Nouri et al., 2017).
The CR-GADA model parameters for H and DBH showed similarities in the growth behavior of AG in live fences. This synchrony in growth may be attributed to the live fence arrangement, which minimizes lateral competition, creates a more homogeneous environment, and favors a balanced development between height and diameter. Love et al. (2009) reported that live fences promoted higher seedling survival compared to open pastures, in addition to significantly higher height growth. According to Callaway (1995) and Love et al. (2009), plants in these environments may experience simultaneous facilitative and competitive interactions, which could also explain the observed coordinated development pattern. Comparing these results with those obtained by Cañadas-López et al. (2018) for teak in live fences on the lower coast of Ecuador, it is observed that, although there is generally synchronization, growth in DBH in teak persists longer than in height. This difference suggests that AG is a moderately growing species. The synchronization between the development of DBH and H occurs at earlier ages.
4.2 AG tree volume
According to the AIC criterion, the best model for describing AG tree volume was found to be proposed by Spurr (Equation 19), with consistent estimates of AG volume, as indicated by the lowest RMSE, AIC, and R2Adj values. Nascimento and Aragão (2021) found the Spurr model to be the most appropriate for describing tree volume in the Brazilian Caatinga. Similarly, Santos et al. (2019) also selected the Spurr equation for estimating the volume of the African mahogany stem due to its ability to accurately describe the volume of the stem. Moreira and Hidalgo (2018) employed the Schumacher-Hall (Equation 18), Spurr potential (Equation 20), and Spurr Intermediate Term (Equation 21) functions to describe the AG volume. They used R2Adj as a selection criterion, concluding that the Schumacher-Hall (Equation 18) function was the best.
Although Spurr's model is based on a simple logarithmic formulation with a single parameter, its GMM fit provided statistically adequate results. This approach has already been employed by Cañadas-López et al. (2018, 2019, 2023a,b) to model volume in various species within agro-silvopastoral systems due to its ability to handle heteroscedasticity in residuals. By not requiring assumptions of normality and homoscedasticity, the GMM allows for unbiased estimates and valid standard errors. This corrects for the heteroscedasticity observed in the initial ordinal least squares adjustment. Therefore, the GMM-fitted Spurr model is confirmed as a suitable tool to represent volume in the analyzed data (Wehenkel et al., 2012).
4.3 Production, yield, and BORA AG in WLRE
The results show that in the best sites, AG reached a maximum MAI of 14.8 m3 ha−1 year−1 at age 26 with a total production of 386.3 m3 ha−1. In less favorable sites, the minimum MAI was 4.4 m3 ha−1 year−1 at age 30, with a total production of 135.9 m3 ha−1 similar to live fences with teak (Tectona grandis L.), which achieved an MAI ranging from 3 m3 ha−1 year−1 at age 26 to 15 m3 ha−1 year−1 at age 15 (Cañadas-López et al., 2018). SPS, including eucalypts, are expected to reach a mean annual increment (MAI) of 29.6 m3 ha1 yr1 in 4 years in the state of Minas Gerais, with an average annual rainfall of 1,413 mm (Duan et al., 2022).
In SPS in WLRE, the BORA of AG ranged from 26 to 30 years. No information is available for specific comparisons. Growth and productivity levels of Indigenous tropical tree species in plantations are largely unknown (Piotto et al., 2003; Krainovic et al., 2023). Under natural forest conditions in Inpa, Bolivia, Centrolobium microchaete (Mart. ex Benth.) H.C. de Lima ex G.P. Lewis (1915) showed three growth phases: relatively slow growth at the juvenile stage, stabilization of annual increments at around 80 years, and a gradual decline from 140 years onwards, resulting in a BORA of 140 years (López and Villalba, 2011). However, tropical forest species in plantations can undergo significantly accelerated growth relative to their counterparts in natural forests if management methods that optimize growth conditions are used. As a result, cutting cycles can be drastically reduced, shortening the time required to reach commercial maturity (Cañadas, 1963, 1965, 1983; Lamprecht, 1989).
According to the CR-GADA models developed for SPS, AG would reach a DBH of 40 cm at 60 years on the best-quality sites. In contrast, in Bolivian natural forests, trees of this genus require between 115 and 140 years to reach this DBH (López and Villalba, 2011, 2020). The Ministry of Environment, Water and Ecological Transition of Ecuador (Ministerio del Ambiente, Agua y Transición Ecológica, 2015) established a Minimum Cutting Diameter (MCD) of 40 cm for AG, which could imply a risk of premature logging in natural forests as no appropriate silvicultural and ecological criteria have been determined to date. This practice can hinder natural regeneration processes and jeopardize the long-term conservation of the species. In this context, SPS represents a strategy to produce AG that meets the MCD without putting additional pressure on natural forests. However, given that AG growth depends on SI, climate variability and the expected increase in droughts in neotropical dry forests in the 21st century could negatively affect their growth production (López and Villalba, 2011) and negatively impact productivity and economic risk for the regional forestry sector. In this sense, in SPS, it is recommended to apply the BORA determined in this study to fix MCD in SPS, thus ensuring sustainable AG production and conservation of this endangered species. Under natural forest conditions, however, specific research is proposed for an appropriate AG MCD.
AG can be considered a medium-growing species with the potential to produce timber and other goods and services, including shade for livestock, fodder, erosion control, soil fertility improvement, and biodiversity conservation in SPS, provided it is established on sites with favorable environmental conditions for its development. This characteristic makes AG suitable for sites where teak or similar species struggle to thrive. However, planting native trees poses challenges due to the lack of technical information about their growth, production, and adaptation to low-quality soils (Nguyen et al., 2014; Tellez et al., 2020). As a result, forest land rehabilitation programmes often use exotic species in preference to native species (Wang et al., 2013; Chechina and Hamann, 2015; Papaioannou et al., 2016; Brus et al., 2019; Vítková et al., 2020). Globally, forest plantations with exotic species cover approximately 44% of a total of 58 million hectares (Food and Agriculture Organization, 2020), with native species predominating in North and Central America and exotic species predominating in South America (Food and Agriculture Organization, 2020). This pattern was reflected in Ecuador's Forestry Incentives Programme, where 71% of planted species were identified as exotic (Cañadas-López et al., 2016a, 2019).
4.4 H-DBH relationship
Ten models were evaluated to describe the relationship between H and DBH. Although the linear model yielded the best values of adjusted R2, RMSE, and AIC, it was not selected due to the lower flexibility. This model presented better adjustments for pure plantations, according to Nazari Sendi et al. (2023) and Tanovski et al. (2023). The alternative model was the one proposed by Larson (1986), which showed greater consistency in the fit. Larson (1986) has been used in different ecosystems in North America, showing good results (Larson et al., 2008). Applying the logarithm of H- DBH data from 415 SPS studied in seven provinces of WLRE yielded a slope of 1.01 (Table 6). When this relationship was disaggregated by SI in the WLRE, the AG slope varied from 1.11 for the most favorable growing conditions to an AG slope of 0.74 for the poorest conditions.
Unlike what Assmann (1970) described for pure plantations, where H and DBH growth are not synchronized, SPS with live fences exhibit synchronized H and DBH growth (see Cañadas-López et al., 2018, 2023b). Under conditions of water stress, the partitioning of tree growth within a forest stand tends to become more symmetric in terms of size (decreasing from 1.11 to 0.74). Trees are affected by water stress, which reduces their growth and causes them to lose some of their advantages in light capture (Pretzsch et al., 2018; Pretzsch, 2018). In this context, the H–DBH relationship could serve as an indicator of survival or growth strategies (Gao et al., 2023).
These data were consistent with those of previous studies, e.g., Feldpausch et al. (2011), Weiskittel et al. (2015), Cañadas-López et al. (2016b), and Wang et al. (2023). These regional studies found variations in the H-DBH relationship due to several factors, including geographical location, environmental conditions, and forest structure. SI classification thus emerges as a valuable tool for understanding this relationship. Height, being site-specific for a given reference diameter, can be considered an expression of the growing conditions at each site (Fehrmann and Kleinn, 2006).
These values differ from those observed for the Cupressaceae family, with a slope of 0.67 for the H-DBH relationship under forest conditions in the temperate zone (Niklas and Spatz, 2004). While Goodman et al. (2014) reported a slope of 0.44 for several South American tropical forests, Duncanson et al. (2015) reported values of 0.40 for hardwoods and 0.43 for mixed conifer/hardwood. Levine et al. (2021) found that the best-fitting allometric model suggests that the size relationship varied between different stands and shows species-specific variation patterns for each tree species within these stands. Based on the results obtained, exploring the possibility of adjusting tree spacing for the AG SPS is essential. In areas of high productivity, reducing the distance between trees can encourage balanced growth, while in less productive areas, increasing the distance between trees can help mitigate competition and promote more uniform growth.
5 Conclusion
Our findings provide unpublished and fundamental information that can be used to improve more effective and sustainable AG management and conservation. The growth gradient related to water availability suggests that row planting in SPS is the optimal way to exploit its growth potential (H and DBH) while minimizing competition for water resources. It also proposes to determine the carbon sequestration potential of AG in silvopastoral systems, as well as to evaluate the effect of different spacing between AG trees in live fences as a function of site index, with the aim of maximizing volume growth and site use efficiency.
Setting a single MCD value ignores the biological, growth, and production characteristics of any forest species. In this sense, the imposition of a 40 cm MCD for AG by the Ecuadorian Ministry of Environment, Water, and Ecological Transition, without specific data on the growth of threatened native tropical species, could be counterproductive. The data obtained on AG through BORA for different site qualities provide basic information that allows for a review, at least, of the AG MCD and contributes to ensuring both sustainable forest production and the conservation of this threatened native species.
Statements
Data availability statement
The original contributions presented in the study are included in the article/supplementary material, further inquiries can be directed to the corresponding author.
Author contributions
ÁC-L: Conceptualization, Formal analysis, Investigation, Methodology, Validation, Visualization, Writing – original draft, Writing – review & editing. PG-T: Data curation, Supervision, Writing – original draft, Writing – review & editing. CW: Conceptualization, Methodology, Software, Validation, Writing – original draft, Writing – review & editing.
Funding
The author(s) declare that financial support was received for the research and/or publication of this article. The Central University of Ecuador provided the resources for the publication of the article.
Acknowledgments
We are thankful to the Director of the Portoviejo Experimental Research Station (EEP) of the National Institute of Agricultural Research (INIAP) for the period 2015–2016, as well as to UISEK, UTN, and ULEAM for their logistical support of the research project. We would like to thank the three reviewers for their contributions to the improvement of the manuscript.
Conflict of interest
The authors declare that the research was conducted in the absence of any commercial or financial relationships that could be construed as a potential conflict of interest.
Generative AI statement
The author(s) declare that no Gen AI was used in the creation of this manuscript.
Publisher’s note
All claims expressed in this article are solely those of the authors and do not necessarily represent those of their affiliated organizations, or those of the publisher, the editors and the reviewers. Any product that may be evaluated in this article, or claim that may be made by its manufacturer, is not guaranteed or endorsed by the publisher.
References
1
Antón-Fernández C. Burkhart H. E. Strub M. Amateis R. L. (2011). Effects of initial spacing on height development of loblolly pine. For. Sci. 57:3. 10.1093/forestscience/57.3.201
2
Assmann E. (1970). Principles of Forest Yield Study. Oxford: Pergamon Press.
3
Avery T. E. Burkhart H. E. (2015). Forest Measurements. Long Grove: Waveland Press.
4
Ayala Cifuentes M. E. (2023). Crecimiento, producción y captura de carbono aéreo, de Centrolobium ochroxylum Rose ex Rudd en sistemas silvopastoriles, Costa baja del Ecuador [master's thesis]. [Quito (UIO)]: Universidad Andina Simón Bolívar.
5
Bailey R. L. Clutter J. L. (1974). Base-age invariant polymorphic site curves. For. Sci. 20:2.
6
Bates D. M. Watts D. G. (1980). Relative curvature measures of nonlinearity. J. R. Stat. Soc. Ser. B. Stat. Method42:1. 10.1111/j.2517-6161.1980.tb01094.x
7
Benjamin T. J. Hoover W. L. Seifert J. R. Gillespie A. R. (2000). Defining competition vectors in a temperate alley cropping system in the midwestern USA: 4. The economic return of ecological knowledge. Agrofor. Syst. 48, 79–93. 10.1023/A:1006367303800
8
Brienen R. J. Caldwell L. Duchesne L. Voelker S. Barichivich J. Baliva M. et al . (2020). Forest carbon sink neutralized by pervasive growth-lifespan trade-offs. Nat. Commun. 11:4241. 10.1038/s41467-020-17966-z
9
Brienen R. J. Schöngart J. Zuidema P. A. (2016). “Tree rings in the tropics: insights into the ecology and climate sensitivity of tropical trees,” in Tropical Tree Physiology: Adaptations and Responses in a Changing Environment, eds. G. Goldstein and Louis S. (Heidelberg: Springer), 439–461. 10.1007/978-3-319-27422-5_20
10
Brook R. Forster E. Styles D. Mazzetto A. M. Arndt C. Esquivel M. J. et al . (2022). Silvopastoral systems for offsetting livestock emissions in the tropics: a case study of a dairy farm in Costa Rica. ASD. 42:5. 10.1007/s13593-022-00834-z
11
Brus R. Pötzelsberger E. Lapin K. Brundu G. Orazio C. Straigyte L. et al . (2019). Extent, distribution and origin of non-native forest tree species in Europe. Scand. J. For. Res. 34:7. 10.1080/02827581.2019.1676464
12
Buford M. A. (1986). Height-diameter relationships at age 15 in loblolly pine seed sources. For. Sci. 32:3. 10.1093/forestscience/32.3.812
13
Callaway R. M. (1995). Positive interactions among plants. Bot. Rev. 61, 306–349. 10.1007/BF02912621
14
Calsavara L. H. F. (2023). Eucalypt modelling as a function of spatial arrangement in agrosilvopastoral systems. Agrofor. Syst. 97:4. 10.1007/s10457-023-00805-7
15
Camargo García J. C. Kleinn C. (2010). Length curves and volume functions for guadua bamboo (Guadua angustifolia Kunth) for the coffee region of Colombia. Eur. J. For. Res. 129, 1213–1222. 10.1007/s10342-010-0411-2
16
Cañadas L. (1963). Comportamiento de pseudoestacas en cinco especies maderables variando dosel y época de plantación (master's thesis). Turrialba: Centro Agronómico Tropical de Investigación y Enseñanza.
17
Cañadas L. (1965). Los bosques pantanosos en la zona de San Lorenzo, Ecuador. Turrialba. 15, 225–230.
18
Cañadas L. (1966). Correlación entre el número de medio anual de meses ecológicamente secos u precipitación promedio anual en la provincia de Esmeraldas. Turrialba. 16, 50–70.
19
Cañadas L. (1982). Clima, Vegetación y Suelos del Ecuador, in Atlas del Ecuador, ed. A. Collin-Delavaud. Quito, Pi: Les éditions J.A.
20
Cañadas L. (1983). El mapa ecológico y bioclimático del Ecuador. Quito: Editores Asociados Cia. Ltd.
21
Cañadas-López Á. Andrade-Candell J. Domínguez J. M. Molina-Hidrovo C. Schnabel-Delgado O. Vargas-Hernández J. J. et al . (2018). Growth and yield models for teak planted as living fences in coastal Ecuador. Forests9:2. 10.3390/f9020055
22
Cañadas-López Á. Gamboa-Trujillo P. Buitrón-Garrido S. Medina-Torres B. Vargas-Hernández J. J. (2023b). Thinning levels of laurel natural regeneration to establish traditional agroforestry systems, ecuadorian amazon upper basin. Forests14:667. 10.3390/f14040667
23
Cañadas-López Á. Gamboa-Trujillo P. Buitrón-Garrido S. Medina-Torres B. Velasco C. Vargas-Hernández J. J. et al . (2023a). Laurel regeneration management by smallholders to generate agroforestry systems in the ecuadorian amazon upper basin: growth and yield models. Forests14:6. 10.3390/f14061174
24
Cañadas-López Á. Rade-Loor D. Domínguez J. M. Murillo I. Molina C. (2016a). Modelación forestal como Innovación tecnológica para el manejo silvicultural y aprovechamiento económico de la Balsa, Región Costa-Ecuador. Quito: Ed. Abya Yala.
25
Cañadas-López Á. Rade-Loor D. Siegmund-Schultze M. Moreira-Muñoz G. Vargas-Hernández J. J. Wehenkel C. et al . (2019). Growth and yield models for balsa wood plantations in the coastal lowlands of Ecuador. Forests10:9. 10.3390/f10090733
26
Cañadas-López Á. Rade-Loor D. Zambrano C. Molina C. Arce L. (2013). “Condiciones de sitio y crecimiento de Centrolobium ochroxylum especie nativa con potencial Agrosilvopastoril del Litoral Ecuatoriano,” in Primer encuentro nacional de Bosques, Recursos Genéticos Forestales y Agroforestería, eds. Grijalba et al. (Quito: INIAP), 1–5. 10.18272/aci.v5i1.123
27
Cañadas-López Á. Rade-Loor D. R. Fernández-Cevallos G. F. Domínguez-Andrade J. M. Murillo I. Molina-Hidrovo C. et al . (2016b). Ecuaciones generales de diámetro-altura para Ochroma pyramidale, Región Costa-Ecuador. Bosques Latitud Cero. 6:1.
28
Cañadas-López Á. Roca A. (2011). Can the reforestation projects stop the extraction of wood from the Protected Forest Chongón-Colonche?, in Tropentag, Development on the Margin, eds. M. Becker, Ch. Kreye, Ch. Ripken, and E. Tiekles (Bonn: DITSL Verlag Gmbh), 1–6.
29
Carl C. Biber P. Veste M. Landgraf D. Pretzsch H. (2018). Key drivers of competition and growth partitioning among Robinia pseudoacacia L. trees. For. Ecol. Manage. 430, 86–93. 10.1016/j.foreco.2018.08.002
30
Cavanaugh J. E. Neath A. A. (2019). The Akaike information criterion: Background, derivation, properties, application, interpretation, and refinements. Wiley Interdiscip. Rev: Compu. Stat. 11:3. 10.1002/wics.1460
31
Chechina M. Hamann A. (2015). Choosing species for reforestation in diverse forest communities: social preference versus ecological suitability. Ecosphere6:11. 10.1890/ES15-00131.1
32
Cieszewski C. J. (2001). Three methods of deriving advanced dynamic site equations demonstrated on inland Douglas-fir site curves. Can. J. For. Res. 31, 165–173. 10.1139/x00-132
33
Cieszewski C. J. (2002). Comparing fixed-and variable-base-age site equations having single versus multiple asymptotes. For. Sci. 48:1. 10.1093/forestscience/48.1.7
34
Cieszewski C. J. (2003). Developing a well-behaved dynamic site equation using a modified Hossfeld IV function Y 3=(axm)/(c+ xm-1), a simplified mixed-model and scant subalpine fir data. For. Sci. 49:4. 10.1093/forestscience/49.4.539
35
Cieszewski C. J. Bailey R. L. (2000). Generalized algebraic difference approach: theory-based derivation of dynamic site equations with polymorphism and variable asymptotes. For. Sci. 46:1. 10.1093/forestscience/46.1.116
36
Duan G. Lei X. Zhang X. Liu X. (2022). Site index modelling of larch using a mixed-effects model across regional site types in Northern China. Forests13:5. 10.3390/f13050815
37
Duncanson L. Rourke O. Dubayah R. (2015). Small sample sizes yield biased allometric equations in temperate forests. Sci. Rep. 5:17153. 10.1038/srep17153
38
Fehrmann L. Kleinn C. (2006). General considerations about the use of allometric equations for biomass estimation on the example of Norway spruce in central Europe. For. Ecol. Manage. 236, 2–3. 10.1016/j.foreco.2006.09.026
39
Feldpausch T. R. Banin L. Phillips O. L. Baker T. R. et al . (2011). Height-diameter allometry of tropical forest trees. Biogeosciences8:5. 10.5194/bg-8-1081-2011
40
Fleming C. H. Calabrese J. M. Mueller T. Olson K. A. Leimgruber P. Fagan W. F. et al . (2014). Non-Markovian maximum likelihood estimation of autocorrelated movement processes. Methods Ecol. Evol. 5, 462–472. 10.1111/2041-210X.12176
41
Food and Agriculture Organization (2020). Global Forest Resources Assessment 2020. Rome: FAO.
42
Gamboa-Trujillo P. (2019). Macrohongos del Ecuador, notas etnomicológicas y técnicas de colecta de campo. Quito: Ed. LNS.
43
Gao H. Cui K. von Gadow K. Wang X. (2023). Using functional traits to improve estimates of height-diameter allometry in a temperate mixed forest. Forests14:8. 10.3390/f14081604
44
Gea-Izquierdo G. Cañellas I. Montero G. (2008). Site index in agroforestry systems: age-dependent and age-independent dynamic diameter growth models for Quercus ilex in Iberian open oak woodlands. Can. J. For. Res. 38:1. 10.1139/X07-142
45
Goodman R. C. Phillips O. L. Baker T. R. (2014). The importance of crown dimensions to improve tropical tree biomass estimates. Ecol. Appl. 24:4. 10.1890/13-0070.1
46
Hastie T. Tibshirani R. Friedman J. H. (2009). “Model assessment and selection,” The Elements of Statistical Learning: Data Mining, Inference, and Prediction (New York: Springer). 10.1007/b94608_7
47
Hatcher R. L. Johnson L. A. Hopper G. M. (1993). Economic potential of black walnut on small acreage tracts. South. J. Appl. For. 17:2. 10.1093/sjaf/17.2.64
48
Honer T. G. (1965). A new total cubic foot volume function. For. Chron. 41:4. 10.5558/tfc41476-4
49
Hossfeld J. W. (1805). Vollständiges System zur Taxation der Hölzer und Regulirung der Forste. Diana3, 91–226.
50
International Union for Conservation of Nature (2021). Centrolobium ochroxylum. The IUCN Red List of Threatened Species 2021. Gland: IUCN. Available online at: https://www.iucnredlist.org
51
International Union for Conservation of Nature (2022). IUCN Red List of Threatened Species, version 2021.3. Gland: IUCN. Available online at: https://www.iucnredlist.org
52
Krainovic P. M. de Resende A. F. Amazonas N. T. de Almeida C. T. et al . (2023). Potential native timber production in tropical forest restoration plantations. Perspect. Ecol. Conser. 21:4. 10.1016/j.pecon.2023.10.002
53
Lamprecht H. (1989). Waldbau in den Tropen: die tropischen Waldökosysteme und ihre Baumarten - Möglichkeiten und Methoden zu ihrer nachhaltigen Nutzung. Hamburg: Verlag Paul Parey.
54
Larson A. J. Lutz J. A. Gersonde R. F. Franklin J. F. Hietpas F. F. (2008). Potential site productivity influences the rate of forest structural development. Ecol. Appl.18, 899–910. 10.1890/07-1191.1
55
Larson B. C. (1986). Development and growth of even-aged stands of Douglas-fir and grand fir. Can. J. For. Res. 16:2. 10.1139/x86-063
56
Levine J. de Valpine P. Battles J. (2021). Generalized additive models reveal among-stand variation in live tree biomass equations. Can. J. For. Res. 51:4. 10.1139/cjfr-2020-0219
57
Lewis C. E. (1980). Simulated cattle injury to planted slash pine: combinations of defoliation, browsing, and trampling. J. Range. Manage. 33, 340–345. 10.2307/3897879
58
López L. Rodríguez-Catón M. Villalba R. (2019). Convergence in growth responses of tropical trees to climate driven by water stress. Ecography42:11. 10.1111/ecog.04296
59
López L. Villalba R. (2011). Climate influences on the radial growth of centrolobium microchaete, a valuable timber species from the tropical dry forests in Bolivia. Biotropica43:1. 10.1111/j.1744-7429.2010.00653.x
60
López L. Villalba R. (2020). Climate-growth relationships for Aspidosperma tomentosum Mart. in South American tropical dry forests. Ann. For. Sci. 77:4. 10.1007/s13595-020-01001-8
61
Love B. E. Bork E. W. Spaner D. (2009). Tree seedling establishment in living fences: a low-cost agroforestry management practice for the tropics. Agrofor. Syst. 77, 1–8. 10.1007/s10457-009-9244-8
62
Mendivelso H. A. Camarero J. J. Gutiérrez E. Zuidema P. A. (2014). Time-dependent effects of climate and drought on tree growth in a Neotropical dry forest: short-term tolerance vs. long-term sensitivity. Agr. For. Meteorol. 188, 13–23. 10.1016/j.agrformet.2013.12.010
63
Ministerio del Ambiente Agua y Transición Ecológica. (2015). Diámetros mínimos de corta para especies forestales en Ecuador. Available online at: https://mluisforestal.wordpress.com/2015/12/08/diametros-minimos-de-corta-para-especies-forestales-en-ecuador-2/ (Accessed December 6, 2024).
64
Mlambo D. Ulman Y. Álvarez-Álvarez P. Chavan S. B. (2025). Editorial: Agroforestry for biodiversity and ecosystem services. Front. For. Glob. Change. 8:1616451. 10.3389/ffgc.2025.1616451
65
Moreira C. Hidalgo J. (2018). Crecimiento y producción del Amarillo Guayaquil bajo condiciones de bosque seco tropical (bachelor thesis).Chone (Ma): Universidad Laica Eloy Alfaro, Chone.
66
Nascimento M. dos S. Aragão M. (2021). Form quotient in estimating caatinga tree volume. J. Sustain. For. 40, 508–517. 10.1080/10549811.2020.1779090
67
Nash J. C. Varadhan R. (2011). Unifying optimization algorithms to aid software system users: optimx for R. J. Stat. Softw. 43, 1–14. 10.18637/jss.v043.i09
68
Nazari Sendi M. R. N. Navroodi I. H. Kalteh A. M. (2023). Estimation of Fagus orientalis Lipsky height using nonlinear models in Hyrcanian forests, Iran. J. For. Sci. 69:10. 10.17221/93/2022-JFS
69
Newnham R. M. (1992). Variable-form taper functions for four Alberta tree species. Can. J. For. Res. 22:2. 10.1139/x92-028
70
Nguyen T. T. Koellner T. Le Q. B. Lambini C. K. Choi I. Shin H. et al . (2014). An economic analysis of reforestation with a native tree species: the case of Vietnamese farmers. Biodivers. Conser. 23:4. 10.1007/s10531-014-0635-4
71
Niklas K. J. Spatz H. C. (2004). Growth and hydraulic (not mechanical) constraints govern the scaling of tree height and mass. PNAS101:44. 10.1073/pnas.0405857101
72
Nouri M. Homaee M. Bannayan M. (2017). Quantitative trend, sensitivity and contribution analyses of reference evapotranspiration in some arid environments under climate change. WRM31:7. 10.1007/s11269-017-1638-1
73
Papaioannou A. Chatzistathis T. Papaioannou E. Papadopoulos G. (2016). Robinia pseudoacacia as a valuable invasive species for the restoration of degraded croplands. Catena137, 310–317. 10.1016/j.catena.2015.09.019
74
Pearl R. Reed L. J. (1920). On the rate of growth of the population of the United States since 1790 and its mathematical representation. PNAS6:6. 10.1073/pnas.6.6.275
75
Piotto D. Montagnini F. Ugalde L. (2003). Growth and effects of thinning of mixed and pure plantations with native trees in humid tropical Costa Rica. For. Ecol. Manag. 177, 427–439. 10.1016/S0378-1127(02)00445-0
76
Pretzsch H. (2018). Forest Dynamics, Growth, and Yield: From Measurement to Model, 2nd Edn. Freising: Springer.
77
Pretzsch H. Biber P. (2005). A re-evaluation of Reineke's rule and stand density index. For. Sci. 51:4. 10.1093/forestscience/51.4.304
78
Pretzsch H. Schütze G. Biber P. (2018). Drought can favor the growth of small in relation to tall trees in mature stands of Norway spruce and European beech. For. Ecosyst. 5:1. 10.1186/s40663-018-0139-x
79
Prodan M. Peters R. Cox F. Real P. (1997). Mensura Forestal. San José: GTZ-IICA.
80
Protazio J. M. B. Souza M. A. Hernández-Díaz J. C. Escobar-Flores J. G. López-Sánchez C. A. Carrillo-Parra A. et al . (2022). A dynamical model based on the chapman-richards growth equation for fitting growth curves for four pine species in Northern Mexico. Forests13:11. 10.3390/f13111866
81
Pucha-Cofrep D. Peters T. Bräuning A. (2015). Wet season precipitation during the past century reconstructed from tree-rings of a tropical dry forest in Southern Ecuador. Glob. Planet. Change. 133, 65–78. 10.1016/j.gloplacha.2015.08.003
82
R Core Team (2020). R: A Language and Environment for Statistical Computing. Vienna: R Foundation for Statistical Computing.
83
R Core Team (2023). R: A Language and Environment for Statistical Computing. Vienna, Austria: R Foundation for Statistical Computing.
84
Rade-Loor D. Cañadas-López A. Zambrano C. Ormaza A. Wehenkel C. (2017). Silvopastoral system economical and financial feasibility with Jatropha curcas L. in Manabí, Ecuador. Revista MVZ Córdoba. 22:3. 10.21897/rmvz.1129
85
Rade-Loor D. Siegmund-Schultze M. Oñate-Mancero J. Gamboa-Trujillo P. Cañadas-López A. Wehenkel C. et al . (2025). Jatropha for Galápagos: targeted approaches to promoting bioenergy are needed given the different practices and objectives of smallholder farmers. Tree For. People20:100801. 10.1016/j.tfp.2025.100801
86
Ramírez J. A. del Valle J. I. (2011). Paleoclima de La Guajira, Colombia; según los anillos de crecimiento de Capparis odoratissima (Capparidaceae). Rev. Biol. Trop. 59.3, 1389–1405.
87
Richards F. J. (1959). A flexible growth function for empirical use. J. Exp. Bot. 10:2. 10.1093/jxb/10.2.290
88
Rodríguez R. Mabres A. Luckman B. Evans M. Masiokas M. Ektvedt T. M. et al . (2005). “El Niño” events recorded in dry-forest species of the lowlands of northwest Peru. Dendrochronologia22:3. 10.1016/j.dendro.2005.05.002
89
Ruiz R. M. Martínez G. E. R. Mata J. J. (2007). Análisis del crecimiento y producción de látex en plantaciones forestales comerciales de hule (Hevea brasiliensis Muell Arg.) en el estado de Oaxaca, México. Ra Ximhai3, 565–578. 10.35197/rx.03.03.2007.06.rm
90
Santos F. M. Terra G. Chaer G. M. Monte M. A. (2019). Modeling the height-diameter relationship and volume of young African mahoganies established in successional agroforestry systems in northeastern Brazil. New For.50:3. 10.1007/s11056-018-9665-1
91
SAS Institute Inc (2008). SAS/ETS®9.2 User's Guide. Cary, NC: SAS Institute Inc.
92
Schumacher F. X. Hall F.S. (1933). Logarithmic expression of timber-tree volume. J. Agric. Res. 47, 719–733.
93
Sharma H. Pant K. S. Bishist R. Lal Gautam K. Ludarmani D. R. Kumar M. et al . (2023). Estimation of biomass and carbon storage potential in agroforestry systems of northwestern Himalayas, India. Catena. 225:107009. 10.1016/j.catena.2023.107009
94
Shater Z. De-Miguel S. Kraid B. Pukkala T. Palahí M. (2011). A growth and yield model for even-aged Pinus brutia Ten. stands in Syria. Ann. For. Sci. 68:1. 10.1007/s13595-011-0016-z
95
Shenkin A. Bentley L. P. Oliveras I. Salinas N. et al . (2020). The influence of ecosystem and phylogeny on tropical tree crown size and shape. Front. For. Glob. Change. 3:501757. 10.3389/ffgc.2020.501757
96
Shibu J. Udawatta R. P. (2021). Agroforestry and Ecosystem Services. Missouri: Springer. 10.1007/978-3-030-80060-4
97
Snipes M. Taylor D. C. (2014). Model selection and akaike information criteria: an example from wine ratings and prices. Wine Econ. Policy. 3:1. 10.1016/j.wep.2014.03.001
98
Spurr S. H. (1952). Forest Inventory. New York: Ronald Press Co.
99
Tanovski V. Matović B. Risteski M. Trajkov P. (2023). Modelling the tree height-diameter relationship of Macedonian pine (Pinus peuce Gris.) forests in North Macedonia. J. For. Sci. 69:11. 10.17221/68/2023-JFS
100
Tellez O. Mattana E. Diazgranados M. Kühn N. Castillo-Lorenzo E. Rafael L. et al . (2020). Native trees of Mexico: diversity, distribution, uses and conservation. Peer J8, 559–902. 10.7717/peerj.9898
101
Toraño Caicoya A. Pretzsch H. (2021). Stand density biases the estimation of the site index especially on dry sites. Can. J. For. Res. 51:7. 10.1139/cjfr-2020-0389
102
Torres B. Herrera-Feijoo R. Torres Y. García A. (2023). Global evolution of research on silvopastoral systems through bibliometric analysis: insights from Ecuador. Agronomy13:2. 10.3390/agronomy13020479
103
Trorey L. G. (1932). A mathematical method for the construction of diameter-height curves based on site. For. Chron. 8, 121–132. 10.5558/tfc8121-2
104
Valenzuela Que F. G. Villanueva-López G. Alcudia-Aguilar A. Medrano-Pérez O. R. et al . (2022). Silvopastoral systems improve carbon stocks at livestock ranches in Tabasco, Mexico. Soil Use Manage. 38:2. 10.1111/sum.12799
105
van Laar A. Akça A. (1997). Forest Mesuration. Göttingen: Cluvier.
106
Vanclay J. K. (1994). Modelling Forest Growth and Yield: Applications to Mixed Tropical Forests. Lismor: Southern Cross University.
107
Vandermeer J. (1989). The Ecology of Intercropping. Cambridge University Press. 10.1017/CBO9780511623523
108
Vítková M. Sádlo J. Roleček J. Petrík P. Sitzia T. Müllerová J. et al . (2020). Robinia pseudoacacia-dominated vegetation types of Southern Europe: species composition, history, distribution and management. Sci. Total. Environ. 707:134857. 10.1016/j.scitotenv.2019.134857
109
von Gadow K. Nagel J. Saborowski J. (2001). Continuous Cover Forestry. Berlín, Heidelberg: Springer. 10.1007/978-94-015-9886-6
110
Wang F. Zhu W. Zou B. Neher D. A. Fu S. Xia H. et al . (2013). Seedling growth and soil nutrient availability in exotic and native tree species: implications for afforestation in southern China. Plant Soil. 364, 1–2. 10.1007/s11104-012-1353-x
111
Wang J. Wang Y. Zhang Z. Wang W. Jiang L. (2023). Enhanced awareness of height-diameter allometry in response to climate, soil, and competition in secondary forests. For. Ecol. Manage. 548:121386. 10.1016/j.foreco.2023.121386
112
Wehenkel C. Cruz-Cobos F. Carrillo A. Lujan-Soto J. E. (2012). Estimating bark volumes for 16 native tree species on the Sierra Madre Occidental, Mexico. Scand. J. For. Res. 27:6. 10.1080/02827581.2012.661453
113
Weiskittel A. R. MacFarlane D. W. Radtke P. J. Affleck D. L. R. Temesgen H. Woodall C. W. et al . (2015). A call to improve methods for estimating tree biomass for regional and national assessments. J. For. 113, 414–424. 10.5849/jof.14-091
114
Wykoff W. R. (1982). User's guide to the Stand Prognosis Model (Gen. Tech. Rep. INT-133). Ogden, UT: U.S. Department of Agriculture, Forest Service, Intermountain Forest and Range Experiment Station. 10.2737/INT-GTR-133
115
Wykoff W. R. (1990). A basal area increment model for individual conifers in the northern Rocky Mountains. For. Sci. 36:4. 10.1093/forestscience/36.4.1077
116
Zeide B. (1993). Analysis of growth equations. For. Sci. 39:3. 10.1093/forestscience/39.3.594
Summary
Keywords
DBH growth curve, forest management, H-DBH relationship, threatened species, site index models, tree total volume
Citation
Cañadas-López Á, Gamboa-Trujillo P and Wehenkel C (2025) Growth and yield models for Centrolobium ochroxylum Rose ex Rudd in silvopastoral systems of Ecuadorian western lowlands. Front. For. Glob. Change 8:1577103. doi: 10.3389/ffgc.2025.1577103
Received
15 February 2025
Accepted
09 June 2025
Published
10 July 2025
Volume
8 - 2025
Edited by
Romà Ogaya, Ecological and Forestry Applications Research Center (CREAF), Spain
Reviewed by
Sourav Ranjan Mohapatra, Orissa University of Agriculture and Technology, India
Alonso Barrios, Tolima University, Colombia
Ramiro Puc Kauil, National Technological Institute of Mexico, Venustiano Carranza Superior Technological Institute, Mexico
Updates
Copyright
© 2025 Cañadas-López, Gamboa-Trujillo and Wehenkel.
This is an open-access article distributed under the terms of the Creative Commons Attribution License (CC BY). The use, distribution or reproduction in other forums is permitted, provided the original author(s) and the copyright owner(s) are credited and that the original publication in this journal is cited, in accordance with accepted academic practice. No use, distribution or reproduction is permitted which does not comply with these terms.
*Correspondence: Álvaro Cañadas-López agcanadas@uce.edu.ec
Disclaimer
All claims expressed in this article are solely those of the authors and do not necessarily represent those of their affiliated organizations, or those of the publisher, the editors and the reviewers. Any product that may be evaluated in this article or claim that may be made by its manufacturer is not guaranteed or endorsed by the publisher.