 Chih-Lin Liu1
 You-Ren Wang
 Wan-Yu Liu
- 1Department of Forestry, National Chung Hsing University, Taichung, Taiwan
- 2Department of Marine Environment and Engineering, National Sun Yat-sen University, Kaohsiung, Taiwan
- 3Aerosol Science Research Center, National Sun Yat-sen University, Kaohsiung, Taiwan
- 4Innovation and Development Center of Sustainable Agriculture, National Chung Hsing University, Taichung, Taiwan
This study advances environmental management practices by developing a comprehensive multi-index remote sensing methodology for rapid and accurate forest fire impact assessment in protected areas. Applied to the 2021 Yushan National Park fire in Taiwan, the approach integrates three complementary vegetation indices—Normalized Burn Ratio (NBR), Burned Area Index (BAI), and Normalized Difference Vegetation Index (NDVI)—to evaluate pre-fire and post-fire conditions across forest compartments No. 51 and No. 52. The methodology demonstrates significant advantages for protected area management where recreational activities intersect with conservation priorities. The NBR analysis identified 68.89 hectares of burned area with 97.1% accuracy compared to official reports, establishing the method’s reliability for rapid damage assessment. NDVI and BAI analyses provided complementary insights, with NDVI effectively detecting 27.99 hectares of completely destroyed vegetation and BAI identifying 17.80 hectares of severely charred areas, both showing statistical significance when validated against ground observations. Through carbon storage analysis, we quantified a loss ranging from 7 to 18,000 metric tons, demonstrating the approach’s capability for environmental impact quantification. The multi-index methodology reveals varying degrees of burn severity across different forest compartments, enabling precise mapping of ecosystem damage patterns. This framework offers a cost-effective, reproducible approach for both immediate impact evaluation and long-term monitoring of forest recovery, supporting evidence-based management decisions in protected areas globally, though local calibration may be required for optimal performance.
1 Introduction
The ability to track and measure forest fires through remote sensing has become a critical tool for environmental management, particularly as fire occurrence rises globally with increasing frequency and severity (Arnett et al., 2015; Gale et al., 2021; Hamilton et al., 2023; Jodhani et al., 2024a; Lentile et al., 2006). Satellite-based monitoring platforms offer unique, rapid, large-scale assessment capabilities that complement traditional ground surveys (Chen et al., 2022; Chuvieco et al., 2020; Omar and Kumar, 2021; Zheng et al., 2023). Recent research demonstrates the growing importance of remote sensing applications for fire damage assessment and ecosystem impact estimation (Cui et al., 2022; Burrell et al., 2022; Jodhani et al., 2024b).
The global scope of fire-related impacts on forest ecosystems is substantial, with more than 1 million ha of forests burned annually in Europe, the Middle East, and Africa (Kolanek et al., 2021). Fires triggered by climate change and human activities have caused significant ecological deterioration (Sadowska et al., 2021; Senande-Rivera et al., 2022). Several region-specific case studies further illustrate the multifaceted impacts of fire-related disturbances. For instance, Dong et al. (2021), Krikken et al. (2021), and Lohmander et al. (2022) report localized yet severe ecological degradation associated with increasing fire frequencies and land-use pressures. In Australia, fires, drought, and habitat loss have reduced koala populations by 30% in just 3 years (Law et al., 2022; Phillips et al., 2021).
In fire severity detection and burn pattern analysis, remote sensing technologies, particularly Landsat-8 satellite imagery, have demonstrated considerable potential (Bonney et al., 2020; Soubry et al., 2021). Integrating multiple vegetation indices enables accurate fire impact analysis that supports immediate assessment and long-term monitoring (Hislop et al., 2019). These capabilities are especially crucial for protected areas, where timely, high-quality assessment is essential for management and restoration planning (Chen et al., 2024; Yu et al., 2024; Yu et al., 2025).
Taiwan provides a compelling case study for advanced fire monitoring applications, with forests covering 60.71% of the island (2,197,000 hectares) (Forestry Bureau, Council of Agriculture, Executive Yuan, 2016). Despite occupying only 3% of Taiwan’s land mass, Yushan National Park hosts over half of the island’s native species, making accurate fire damage estimation crucial for biodiversity management (Chou and Tang, 2016; Li and Jones, 2021). A fire event at the intersection of forest compartments No. 51 and No. 52 at 3,150 meters altitude revealed significant limitations in existing assessment approaches (Forestry Bureau, Council of Agriculture, Executive Yuan, 2021a,b) (Figure 1).
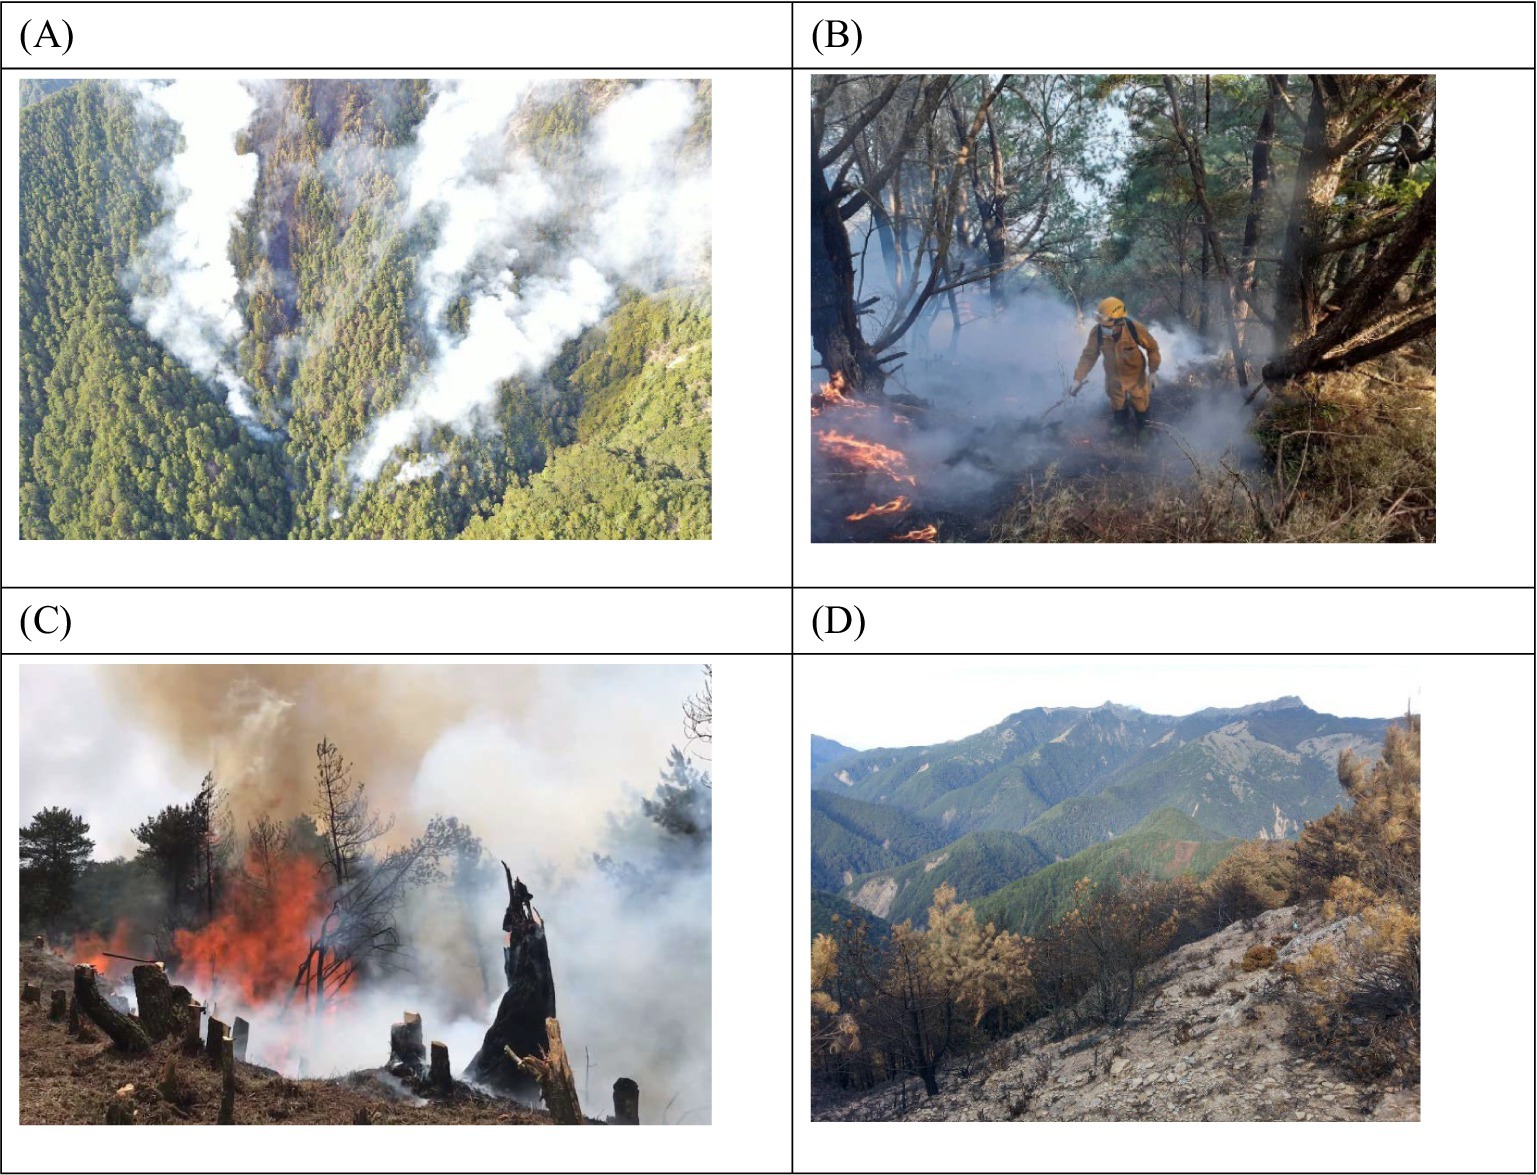
Figure 1. Photos of the forest fire of Yushan National Park in 2021. (A) The burning Yushan National Park, (B) firefighters putting out the fire, (C) forest compartments engulfed in flames, and (D) POST status of the burned Yushan National Park. Photos courtesy of Forestry and Nature Conservation Agency, Ministry of Agriculture, Taiwan.
Traditional assessment methods in Taiwan rely on aerial photographs and ground surveys from the Aerial Survey Office (Forestry Bureau, Council of Agriculture, Executive Yuan, 2016). However, this approach proved inadequate during the 2021 Yushan forest fire assessment, when a two-year lag between pre- and post-fire aerial images and persistent cloud cover compromised practical damage assessment (Forestry Bureau, Council of Agriculture, Executive Yuan, 2023; Forestry and Nature Conservation Agency, Ministry of Agriculture, 2024). These challenges highlight the need for more robust, timely, and accurate assessment methods.
Recent advances in remote sensing technologies have demonstrated the efficacy of integrated approaches using multiple vegetation indices (Camps-Valls et al., 2021; Egorov et al., 2023; Huete, 2012). These methods provide more precise fire damage assessment and facilitate evidence-based restoration planning and monitoring (Chausson et al., 2020). The combination of different spectral indices offers a robust framework for quantifying immediate fire impacts and long-term ecosystem changes (Pérez-Cabello et al., 2021).
This study presents an advanced methodology using Landsat-8 satellite data for rapid, large-scale assessment of forest fire impacts (Santos et al., 2020; Roy et al., 2014; Wassner et al., 2025), taking the Yushan National Park fire of 2021 as a case study. By integrating multiple vegetation indices, including the Normalized Burn Ratio (NBR), Normalized Difference Vegetation Index (NDVI), and Burned Area Index (BAI), we demonstrate a comprehensive approach for determining fire damage and supporting protected area management decisions (Alcaras et al., 2022; Zhang et al., 2023).
2 Materials and methods
2.1 Study area
Yushan National Park covers 103,121.4 hectares of land across four Taiwanese counties in its central region. The research area consists of forest compartments No. 51 and No. 52 within Yushan National Park whose location falls in Nantou County (Figure 2). The area of No. 51 forest compartment is 874.11 hectares and that of No. 52 is 544.07 hectares. The total area of the two forest compartments accounts for approximately 1.38% of Yushan National Park.
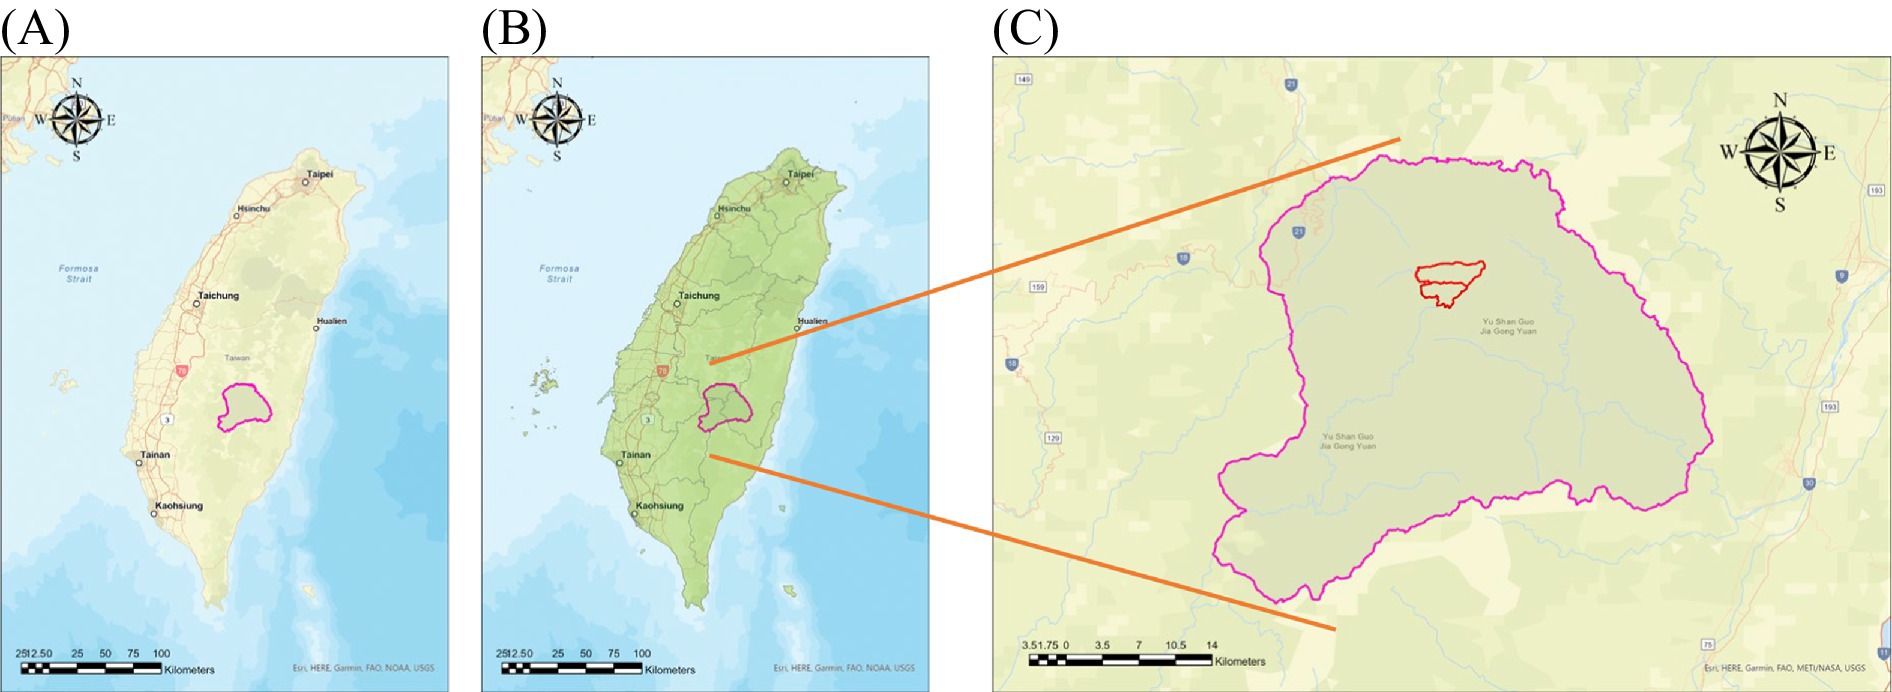
Figure 2. The locations of Yushan National Park and the forest compartments No.51 and No.52 in Taiwan. (A) Yushan National Park, (B) counties containing Yushan National Park, and (C) locations of No. 51 and No. 52 Forest compartments.
2.2 Landsat-8 datasets
We used Landsat-8 Collection 2 data distributed by the United States Geological Survey (USGS) EarthExplorer for the estimation of burned area. The Landsat Level-1 scene-based products provide Landsat 1 to Landsat 9 global images, including all bands or individual bands calculated for spectral indices. Landsat-8 product provides monthly satellite images, available from February 2013 onwards.
The observatory consists of the spacecraft bus and its payload of two Earth-observing sensors, the Operational Land Imager (OLI) and the Thermal Infrared Sensor (TIRS). OLI and TIRS images consist of nine spectral bands with a spatial resolution of 30 meters for Bands 1 to 7 and 9. Bands 5 and 7 are Near Infrared (NIR) and SWIR (Short-wave Infrared) 2, respectively. We used both of the two bands to identify burned areas and provide a measure of burn severity, which is calculated as a ratio between the NIR and SWIR values in traditional fashion. Similarly, we use red (R) and NIR light to calculate NDVI and BAI.
2.2.1 Normalized burning ratio, NBR
NBR is an index for detecting and mapping burned areas. Both SWIR and NIR were used to identify images of burning trees for the determination of NBR (Boucher et al., 2020; Cardil et al., 2019; Xiao et al., 2019). Images of both wavelengths are available in Landsat-8 satellite images from the USGS. Among Landsat-8 imagery data, Bands 5 and 7 are NIR and SWIR 2, respectively. We calculated the value of NBR with Equation 1:
ArcGIS Pro 2.8 Indices were used to calculate the NBR indices before the fire in February and after the fire in July. The value of NBR is between −1 and 1, where negative values indicate burned areas and positive values indicate unburned or normal vegetation.
2.2.2 Burn area index, BAI
BAI is a metric used to assess the severity of burn damage in a particular area, typically in a forest or grassland. It is derived from remote sensing data, such as satellite imagery or aerial photography, and is calculated by comparing the reflectance value of a burned area with those of an unburned area. Landsat-8 data bands 4 (Red) and 5 (NIR) were used, and we calculated the value of BAI with Equation 2 (Chuvieco et al., 2002):
ArcGIS Pro 2.8 Indices were used to calculate the BAI indices before and after the fire. Higher BAI values indicate more severe burn damages.
2.2.3 Normalized difference vegetation index, NDVI
NDVI is a commonly used vegetation index that is calculated using the reflectance values of R and NIR light. Since Landsat-8 imagery data include the reflectance values for the R and NIR bands, the difference between Red and NIR wavelengths was used to reflect the distribution of vegetation with Equation 3 (Rouse et al., 1974):
Similarly, ArcGIS Pro 2.8 Indices were used to calculate the NDVI before the fire in February and after the fire in July. NDVI value is between −1 and 1. A higher NDVI indicates a greener forest area.
2.3 Taiwan open data portal
We used the forest management and national park data distributed by the Taiwan Open Data Portal, which provides free access to a wide variety of government data in machine-readable formats. The portal includes data related to demographics, economy, environment, education, transportation, and more. We used the forest data including the locations of the compartments which were burned. We also used the geographical data of Yushan National Park to present the burned areas. Datasets used in this study are summarized in Table 1.
Table 1. Datasets used in this study.
2.4 Analysis approach
2.4.1 Assess burn severity using the NBR and dNBR
Our burn severity analysis involved multiple steps using the Normalized Burn Ratio (NBR). First, we computed NBR values from satellite imagery captured at two distinct time points: pre-fire (February 2021) and post-fire (July 2021). To isolate the burned regions, we generated a differential NBR (dNBR) by subtracting the post-fire NBR values from the pre-fire NBR values. We then applied a mask to eliminate areas that showed no evidence of burning between these dates, effectively highlighting only the fire-affected zones. In our final GIS cartographic output, we visualized the burned areas using red coloration, with the intensity of red corresponding to the magnitude of the NBR difference. Higher dNBR values indicate more severe fire damage, helping us identify the most critically impacted regions.
2.4.2 Assess burn severity using the BAI and dBAI
We employed the Burned Area Index (BAI) in ArcGIS Pro to conduct a detailed burn severity assessment. Our analysis began with BAI calculations for two temporal snapshots: pre-fire (February 2021) and post-fire (July 2021). To identify the affected regions, we generated a differential BAI by subtracting the July values from the February measurements. We then applied a mask to remove all unburned areas from the analysis period, creating a focused visualization of only the fire-impacted zones. In our final GIS cartographic representation, we symbolized the burn severity using a red color gradient, where the intensity corresponds to the magnitude of BAI change. Higher differential values in our results signify areas that experienced more intense burning, providing a quantitative measure of fire severity across the landscape. This BAI-based methodology enabled us to produce a precise spatial assessment of the burn patterns within our study area.
2.4.3 Assess burn severity using the NDVI and dNDVI
We analyzed vegetation loss using the Normalized Difference Vegetation Index (NDVI) following the same methodological approach as our previous analyses. We computed NDVI values at two critical time points: pre-fire conditions in February 2021 and post-fire conditions in July 2021. To quantify the fire’s impact on vegetation, we calculated the differential NDVI (dNDVI) between these temporal snapshots. Following our established protocol, we applied a mask to exclude all unburned areas during this period, ensuring our analysis focused solely on fire-affected regions. This masking procedure aligned with our NBR analysis methodology, allowing us to isolate and examine only the areas directly impacted by the fire event.
3 Results
3.1 Results of NBR analysis
Our NBR analysis compared pre- and post-fire conditions in the Yushan forest. Pre-fire assessment (February) (Figure 3A) shows that NBR range is from −0.179 to 0.503, with mean NBR equal to 0.225. Post-Fire Assessment (July) (Figure 3B) shows a NBR range from −0.051 to 0.574, with mean NBR equal to 0.290.
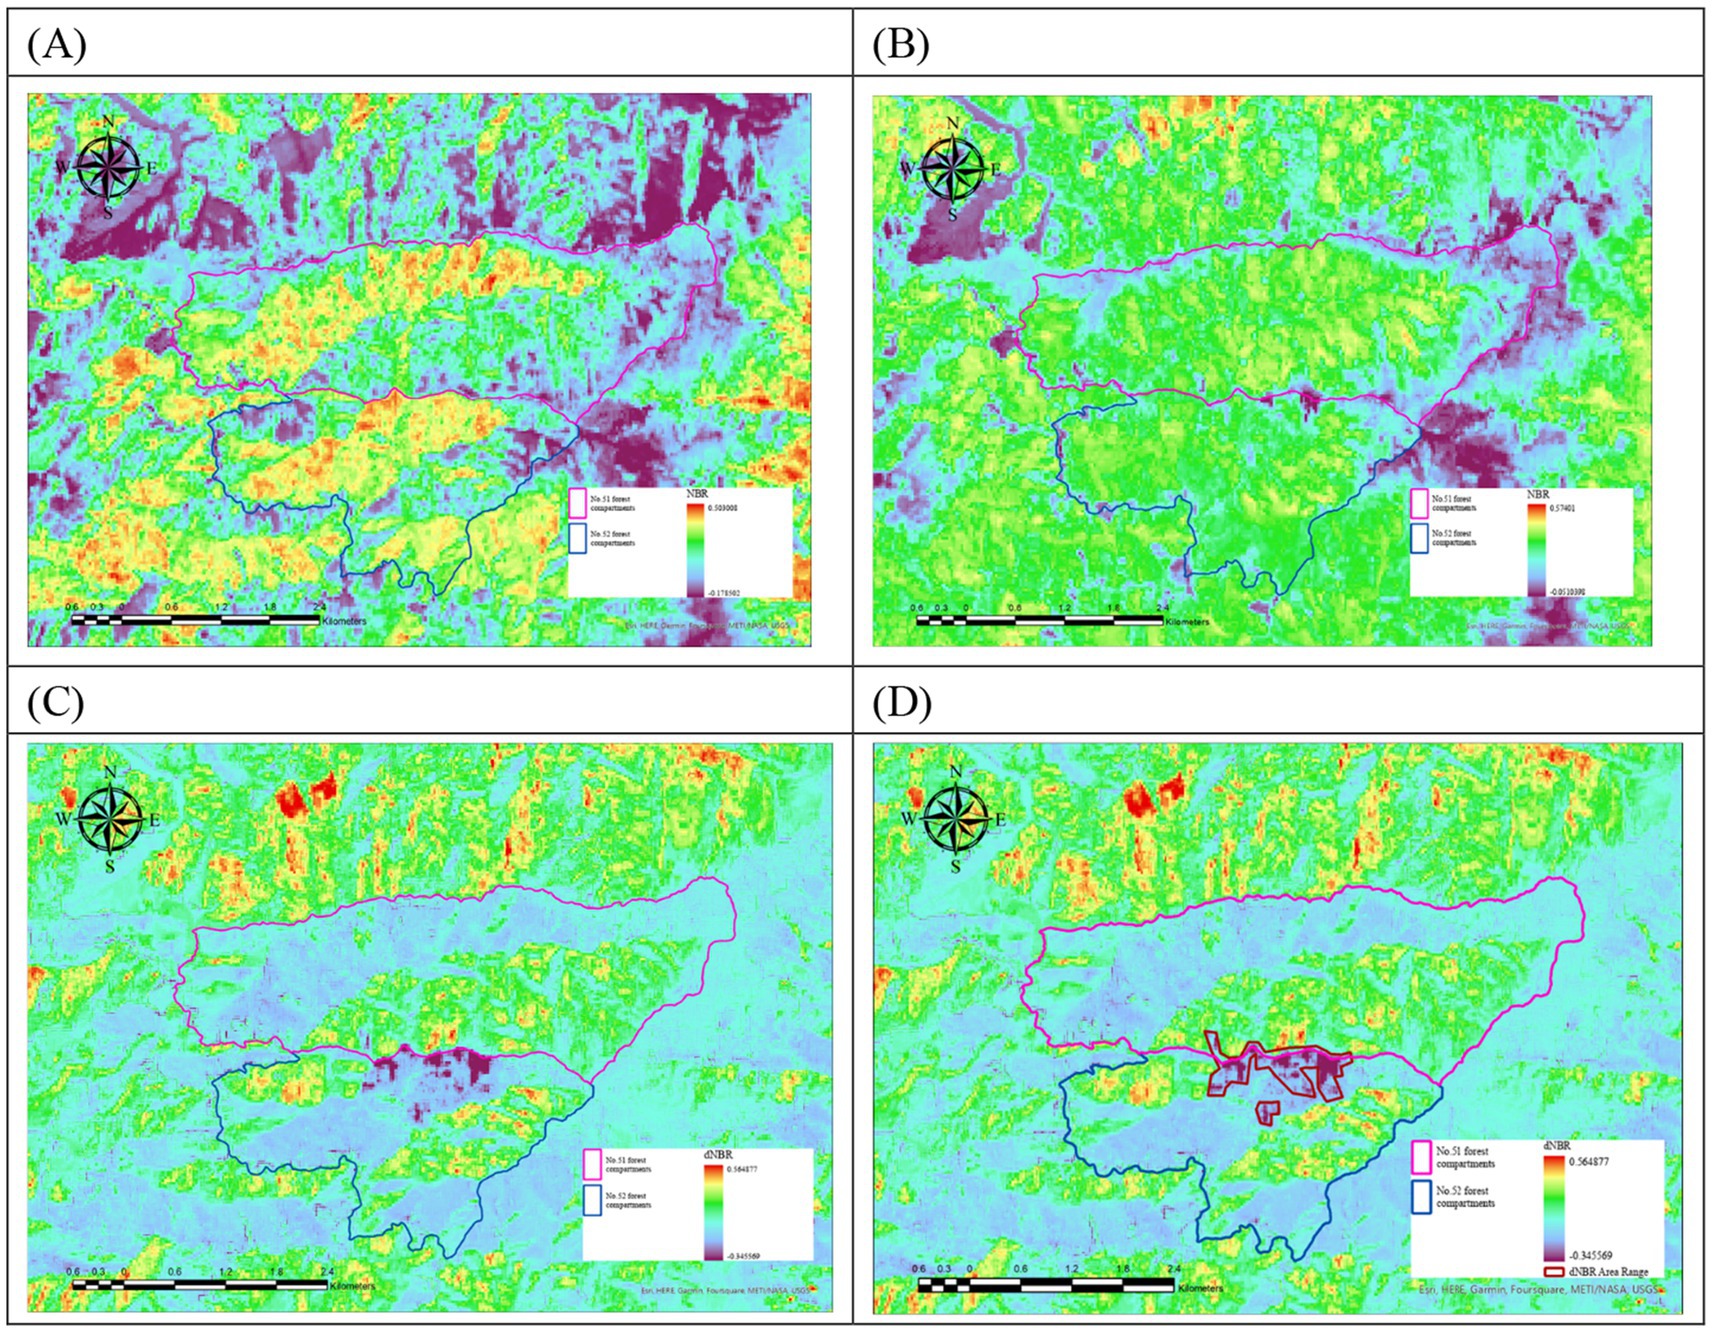
Figure 3. NBR analysis results. (A) NBR values before the fire in February 2021, (B) NBR values after the fire in July 2021, (C) differential NBR (dNBR) with negative values highlighted in purple showing burn-affected areas, and (D) manually digitized burn extent within Forest Compartments No. 51 and No. 52.
The NBR methodology leverages the distinct spectral responses of Near-Infrared (NIR) and Short-Wave Infrared (SWIR) radiation. Healthy vegetation typically exhibits high NIR reflectance and low SWIR reflectance due to water content in plant tissues. Fire damage inverts this pattern, producing lower NIR reflectance and higher SWIR reflectance, resulting in decreased or negative NBR values that indicate vegetation loss and increased surface temperatures.
Differential NBR (dNBR) Analysis reveals a range from −0.346 to 0.565. It can be seen that most severe burn impacts (lowest dNBR values) concentrated at the intersection of Forest Compartments No. 51 and 52, as the burn-affected areas visualized in purple (Figure 3C).
Through manual digitization of the most severely impacted areas (highlighted in red) (Figure 3D), we quantified the total burned area to be 68.89 hectares, of which 5.18 hectares occurred in Forest Compartment No. 51, and the main part with 63.70 hectares was found in Forest Compartment No. 52.
3.2 Results of BAI analysis
The Burned Area Index (BAI) effectively identifies fire-affected zones through its heightened sensitivity to both vegetation changes and charred biomass signatures. Using the same Landsat-8 satellite imagery employed in our NBR analysis, we conducted a temporal comparison between pre- and post-fire conditions, generating a differential BAI map (Figure 4A).

Figure 4. BAI analysis results. (A) Difference of BAI values between February and July 2021, (B) results of Iso cluster unsupervised Classification showing four categories of burn severity, (C) vector conversion of severely burned areas [shown in red in (B)], and (D) final burn area delineation within forest compartments No. 51 and No. 52.
Unlike the NBR analysis, BAI produced more distinct pixel classifications, enabling a robust automated analysis approach. We implemented a four-category classification using the Iso Cluster Unsupervised Classification geoprocessing function (Figure 4B). The severely burned forest areas, highlighted in red, were subsequently converted to vector format for area calculation (Figure 4C).
The spatial analysis revealed a concentrated burn pattern, where the total burned area was 17.80 hectares, found in Forest Compartment No. 52 (southern section) with 17.80 hectares, and zero in Forest Compartment No. 51 (northern section). The final visualization (Figure 4D) clearly demonstrates the fire’s localized impact, with damage exclusively confined to the southern forest compartment.
3.3 Results of NDVI analysis
NDVI provides crucial insights into fire-induced vegetation changes. Following severe forest fires, NDVI values typically show a marked decrease, often becoming negative due to the fire’s impact on vegetation reflectance patterns. This phenomenon occurs because burned areas exhibit reduced Near-Infrared (NIR) reflectance coupled with increased red light reflectance.
Our temporal NDVI analysis comprised three key stages: pre-fire assessment (February) (Figure 5A), post-fire assessment (July) (Figure 5B), and differential NDVI calculation (Figure 5C). The differential analysis isolated burn-affected areas by removing unchanged regions between February and July. Our detailed visualization (Figure 5D) highlights these burn-impacted zones using purple coloration, revealing stark contrasts between burned and unburned areas. Given these pronounced differences, we leveraged ArcGIS Pro (2.9)'s unsupervised classification capabilities for automated interpretation.
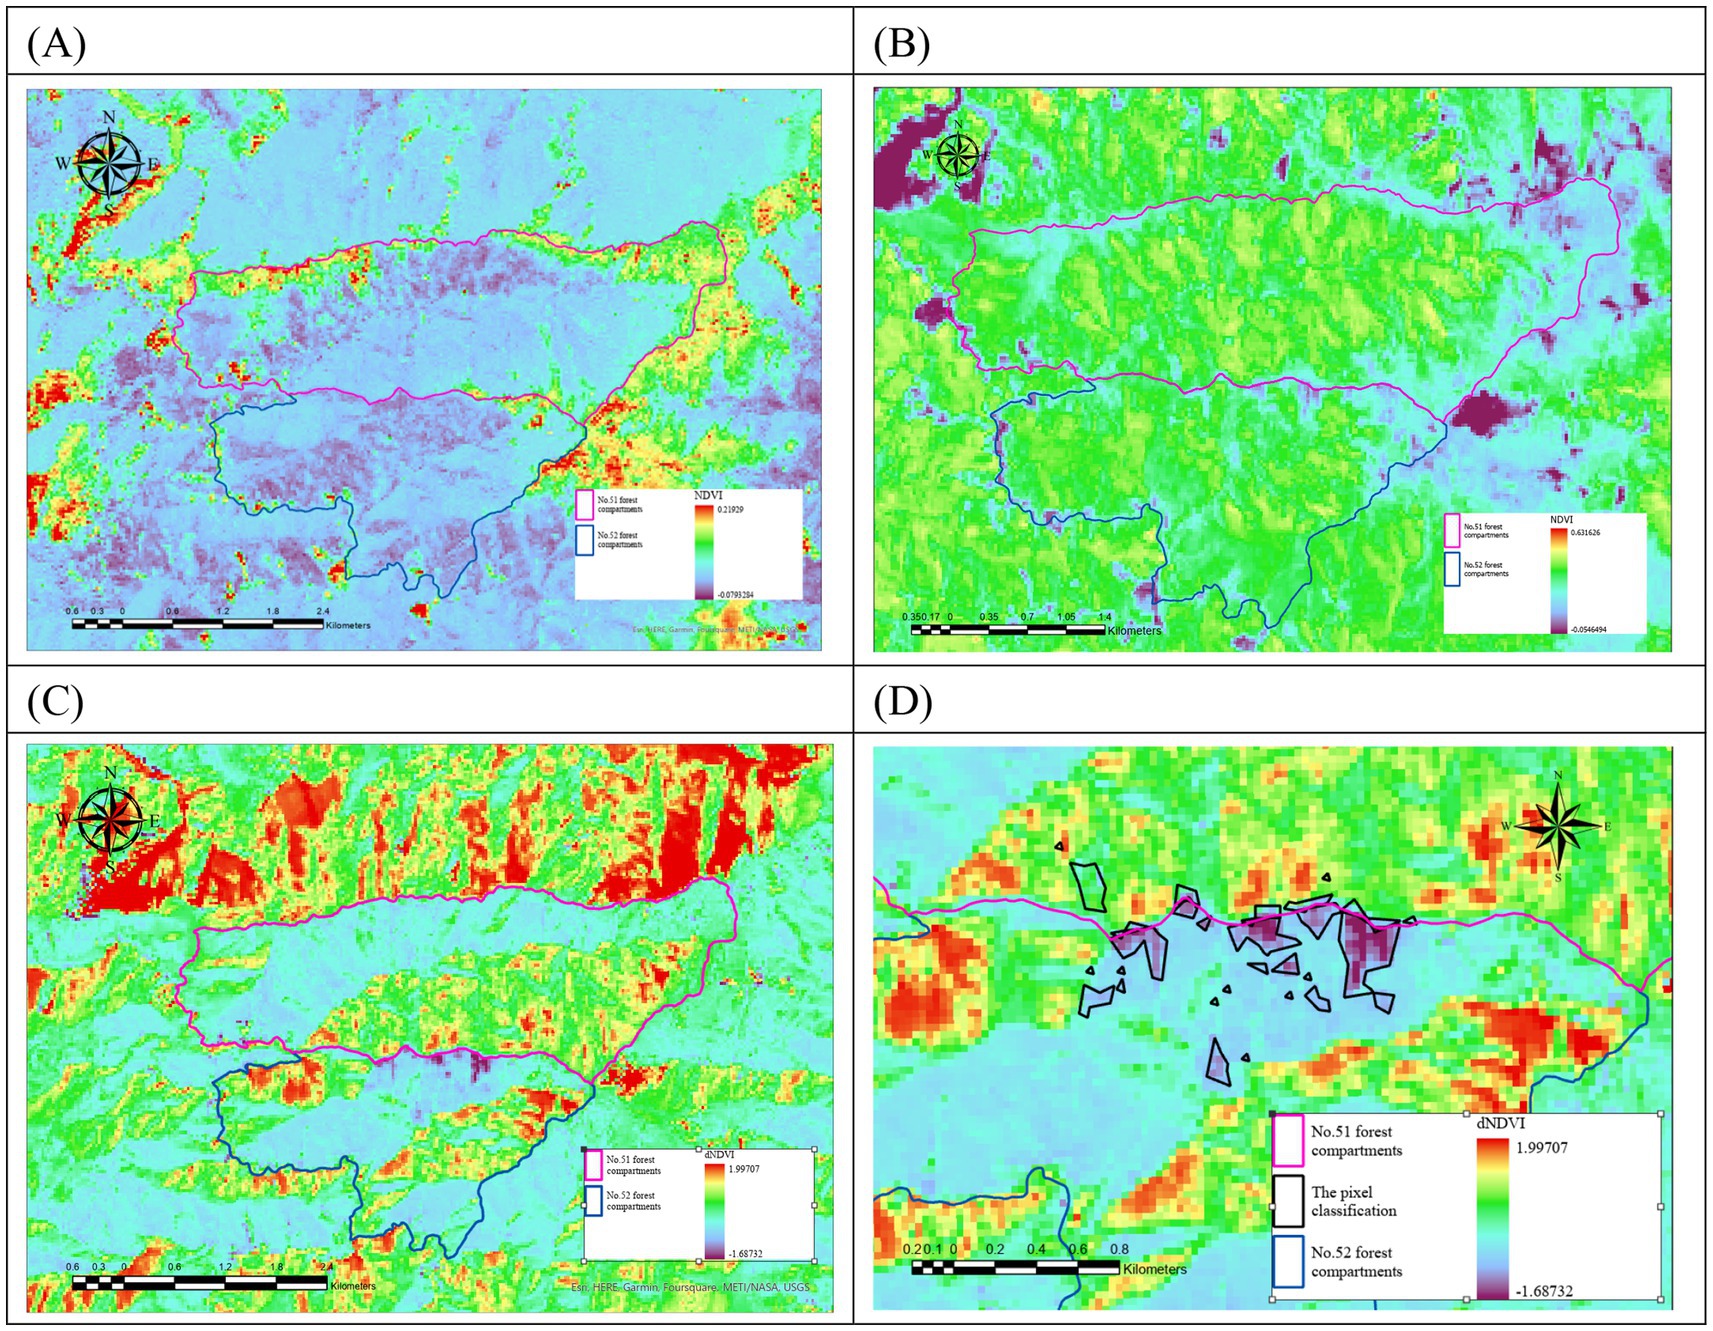
Figure 5. NDVI analysis results. (A) NDVI values before the fire in February 2021, (B) NDVI values after the fire in July 2021, (C) differential NDVI (dNDVI) showing burn-affected areas in Forest Compartments No. 51 and No. 52, and (D) unsupervised classification of burn extent (highlighted in purple) validated against previously calculated negative NBR values.
While negative NDVI values can result from various landscape features (water bodies, shadows, bare soil, or cloud cover), we refined our burn area identification by cross-referencing with our previous dNBR analysis. This integrated approach ensured accurate burn area delineation (Figure 5D). The quantitative assessment revealed that the total burned area is 27.99 hectares, where Forest Compartment No. 51 accounts for 6.48 hectares, and Forest Compartment No. 52 contributed 21.51 hectares.
3.4 Carbon storage loss analysis
We quantified post-fire carbon storage loss using burn extent estimates derived from the multi-index remote sensing framework. Based on a standard carbon density value of 272 Mg/ha for subtropical forests (IPCC Change, 2006), we calculated carbon loss across the areas identified as burned by each index.
The NBR analysis detected 68.89 hectares of burned forest, corresponding to an estimated carbon loss of 18,738.08 metric tons. In contrast, the NDVI analysis identified 27.99 hectares of destroyed vegetation, resulting in a lower-bound estimate of 7,557.92 metric tons. These differences reflect the distinct sensitivities of the two indices, with NBR capturing broader canopy disturbance and NDVI emphasizing total vegetation loss.
The BAI analysis delineated 17.80 hectares of severely charred forest concentrated in Compartment No. 52. Applying the same carbon density; this area corresponds to an estimated loss of 4,841.60 metric tons. Although more conservative, the BAI-derived estimate falls within the range defined by NDVI and NBR and offers a reference point for high-intensity fire zones.
These loss values are consistent with patterns reported in previous post-fire carbon assessments. Studies in subtropical-temperate mixed forests have observed up to 39% reductions in aboveground biomass following fire events (Hu et al., 2020). Fires in Sierra Nevada coniferous systems reduced forest floor carbon stocks by 77% (36.4 Mg C/ha) and disproportionately affected small-diameter trees (Pellegrini et al., 2021; Souza et al., 2022).
Spatially, our multi-index outputs consistently revealed that carbon loss was concentrated at the intersection of Forest Compartments No. 51 and No. 52, aligning with zones of pronounced spectral change across all indices. Such localized reductions in carbon stocks have implications for atmospheric regulation (Reid et al., 2005), particularly in forest systems with high carbon storage capacity, such as boreal and montane environments, which globally contain an estimated 367–1,716 Pg of carbon (Bradshaw and Warkentin, 2015).
We applied a uniform carbon density of 272 Mg/ha based on IPCC Tier 1 values. To account for potential within-stand variation in species composition and forest structure, we performed a sensitivity analysis using ±15% uncertainty margins. The resulting carbon loss estimates ranged from 6,424 to 21,548 metric tons, providing a bounded estimate consistent with values reported in comparable forest systems.
These results demonstrate that the multi-index remote sensing approach offers an efficient, replicable framework for estimating post-fire carbon dynamics, particularly when detailed field-based biomass inventories are unavailable.
4 Discussion
4.1 Performance analysis of multi-index remote sensing methods
Our remote sensing analysis results strongly agreed with official Forestry Bureau data, which documented a total burn area of 71 hectares, including 22 hectares of destroyed forest. The NBR analysis identified 68.89 hectares of burned area, achieving a 2.9% error rate. NDVI analysis detected 27.99 hectares, closely matching the destroyed area with a 26.6% error rate. BAI yielded a more conservative estimate of 17.80 hectares, with a 19.1% error rate.
These differences arise from the distinct spectral sensitivities of the three indices. NBR effectively captures regions with low NIR and high SWIR reflectance—hallmarks of fire impact (Alcaras et al., 2022; Delcourt et al., 2021; Giddey et al., 2022; Van Gerrevink and Veraverbeke, 2021a, 2021b). NDVI, based on red-NIR contrast, excels in identifying destroyed vegetation (Digavinti and Manikiam, 2021; Segah et al., 2010; Wang et al., 2022), whereas BAI is exceptionally responsive to charred surfaces.
Despite their differences, the indices showed substantial spatial agreement in high-burn zones, especially at the intersection of Compartments No. 51 and 52. NBR and NDVI consistently identified severely affected regions, while BAI refined the delineation of partially degraded vegetation. This convergence affirms the robustness and complementarity of the multi-index approach (Cardil et al., 2019). Comparable index-based analyses have also been applied in urban environments to reveal how surface thermal behavior varies with land cover types. For example, Omar and Kumar (2021) found that LST derived from Landsat TIRS data correlates positively with NDBI (built-up areas) and negatively with SAVI (vegetated surfaces), illustrating how index selection can influence sensitivity to thermal or structural disturbance. While our study focuses on post-fire vegetation change, such findings reinforce the interpretability of index behavior in relation to biophysical surface conditions.
We implemented a composite burn assessment framework to enhance precision that integrates NBR, NDVI, and BAI under a differential masking workflow. This multi-dimensional approach proved especially effective in cloud-prone, high-altitude terrain. In addition to traditional manual digitization, we employed Iso Cluster Unsupervised Classification on dBAI layers to map severely burned zones semi-automatically. We recommend that future studies incorporate ensemble classification models (e.g., Random Forest) or threshold fusion (e.g., dNDVI × dBAI composites) to optimize fire severity mapping further.
4.2 Carbon storage and ecosystem service implications
The fire significantly impaired atmospheric regulation services in the forest landscape by reducing aboveground biomass and altering vegetation structure (Reid et al., 2005). Our multi-index analysis revealed substantial post-fire carbon storage loss, with NDVI identifying 27.99 hectares of destroyed vegetation (7,557.92 metric tons) and NBR delineating a broader 68.89-hectare burn extent (18,738.08 metric tons). These results are consistent with previous studies in subtropical-temperate forests, which have documented up to 39% reductions in aboveground biomass following fire events (Hu et al., 2020). In Sierra Nevada coniferous systems, fire reduced forest floor carbon by 77% (36.4 Mg C/ha), with small-diameter trees exhibiting heightened susceptibility (Pellegrini et al., 2021; Souza et al., 2022). Longitudinal research indicates that increasing fire frequency contributes to sustained soil carbon depletion and declining ecosystem productivity (Pellegrini et al., 2018).
Although our estimates adopted a uniform carbon density of 272 Mg/ha by IPCC Tier 1 guidelines (IPCC Change, 2006), we acknowledge the limitation of not accounting for within-stand heterogeneity in biomass. We conducted a ± 15% sensitivity analysis to partially address this uncertainty, resulting in a revised carbon loss range of 6,424–21,548 metric tons. This bracket encompasses likely variability and aligns with site-level studies of post-fire carbon dynamics.
Although we did not directly use BAI for carbon quantification due to its narrower sensitivity to surface charring, we employed it as a critical spatial reference to validate the high-severity burn areas identified by NBR and NDVI. The BAI-derived burned area totaled 17.80 hectares, corresponding to an estimated loss of 4,841.60 metric tons. This value falls within the broader range defined by the other indices and reinforces the internal consistency of the multi-index approach. Cross-index convergence supports more robust fire severity mapping, particularly in topographically complex or spectrally mixed forest systems. Future studies may enhance this framework by incorporating ensemble-based integration or automated spectral fusion techniques to optimize post-disturbance carbon diagnostics.
Beyond direct carbon loss, the fire disrupted broader ecosystem services such as biodiversity conservation and recreational value. Studies from the Huisun Experimental Forest Station in Taiwan demonstrate substantial seasonal variation in recreation-related willingness to pay, with higher values during summer visitation (Liu et al., 2020; Liu et al., 2019). These losses underscore the need for climate adaptation strategies incorporating fire prevention, early-warning systems, and community-based monitoring. As observed in comparable high-risk regions, such measures can improve protected area resilience while maintaining ecosystem function and visitor engagement (Coban and Erdin, 2020).
4.3 Aerosol and air pollution implications
The forest fire in Yushan National Park, which occurred at an elevation of 3,150 meters, generated substantial airborne pollutants and aerosols dispersed across the surrounding region. It released significant quantities of delicate particulate matter (PM2.5 and PM10), along with carbon monoxide (CO), nitrogen oxides (NOₓ), and volatile organic compounds (VOCs).
Forest fires in mountainous terrain are particularly problematic for pollution retention, as dispersion is often limited. Studies have shown that such fires can account for up to 30% of PM2.5 concentrations in affected areas (Pani et al., 2018). Due to the high-altitude location of the event, emissions were subject to long-range atmospheric transport. Similar East Asian cases have demonstrated that wildfire pollutants can travel over 1,000 kilometers, driven by strong monsoon winds and favorable synoptic patterns (Fan et al., 2023). In the case of Taiwan, the springtime northeastern monsoon likely facilitated the transboundary movement of pollutants to adjacent regions.
Future systems aiming to improve smoke monitoring and air quality assessment should incorporate satellite-derived aerosol optical depth (AOD), which has been shown to correlate strongly with ground-level PM₂.₅ concentrations during wildfire episodes (Ma et al., 2019). While our current study qualitatively discusses aerosol and PM2.5 emissions, we did not incorporate remote sensing aerosol products (e.g., MODIS AOD, MERRA-2 reanalysis). Future iterations will aim to integrate these datasets to quantitatively estimate smoke dispersion and surface-level particulate concentrations, further supporting real-time mitigation and early-warning applications.
4.4 Methodological considerations and future applications
Several technical factors influenced the accuracy of this study. Persistent cloud and fog cover required restricting the analysis to the official fire boundary at the junction of Forest Compartments No. 51 and No. 52. Established protocols for mountainous terrain analysis excluded potential classification artifacts beyond this boundary (Sarkar et al., 2019).
The limited temporal resolution of Landsat-8 imagery—restricted to February and July 2021—represents a key constraint, especially given the high-altitude location and frequent cloud cover in the study area. Bi-monthly or seasonal time-series imagery would better capture fire recovery dynamics (Wang et al., 2022; Yu et al., 2024). To address this limitation, we will incorporate Harmonized Landsat-Sentinel (HLS) and Sentinel-2 time series in future work to assess post-fire vegetation recovery trajectories with improved temporal fidelity.
The rugged topography also posed challenges for atmospheric correction and spectral calibration. Accurate reflectance interpretation in steep terrain remains essential, as highlighted by studies in similar high-altitude environments (Fujii et al., 2017). To mitigate these limitations, we recommend incorporating Sentinel-1 Synthetic Aperture Radar (SAR), which offers cloud-penetrating capabilities and sensitivity to surface moisture. SAR integration with optical indices can improve burn detection in low-visibility regions, especially in persistently clouded protected areas like Yushan National Park (Sarkar et al., 2019).
Region-specific machine learning models and drone-based monitoring systems could enhance fire severity mapping and resolution. In incomparable protected areas, locally calibrated models have improved classification accuracy by 15–20% (Reddington et al., 2021), reinforcing the need to tailor monitoring approaches to regional landscape conditions.
Finally, the multi-index remote sensing framework developed in this study directly supports integration into Taiwan’s National Disaster Prevention and Protection Plan. By incorporating this approach into existing systems—such as the Fire Weather Index (FWI), the Central Disaster Prevention and Response System, and the Taiwan National Land Use Monitoring System—government agencies could enhance real-time detection, spatial targeting of suppression efforts, and post-fire recovery planning. In particular, the proposed framework allows for early identification of high-burn zones and quantification of carbon loss, which are critical for prioritizing conservation responses under limited resources. We recommend that this framework be piloted in high-risk protected areas to inform adaptive management protocols and to develop automated alert systems based on satellite data fusion. Such integration would not only improve operational readiness but also support long-term policy goals in climate adaptation and forest resilience planning.
5 Conclusion
This study advances environmental management practice by demonstrating the effectiveness of an integrated remote sensing approach for protected area fire assessment. The methodology’s high accuracy rate of 97.1% in burn area detection validates its reliability as a management tool, while its multi-index framework provides comprehensive insights into fire damage patterns and severity levels. By successfully integrating NBR, NDVI, and BAI analyses, the study establishes a robust foundation for rapid and accurate fire impact assessment that supports evidence-based decision-making in protected area management.
This study offers several significant contributions to environmental management practice. The methodology provides protected area managers with a practical, cost-effective alternative to traditional ground-based surveys, enabling rapid assessment even in challenging terrain. The precise quantification of carbon storage loss, ranging from 7,558 to 18,738 metric tons, delivers valuable data for ecosystem service valuation and climate change mitigation planning. Furthermore, the study’s findings regarding aerosol emissions and air quality impacts enhance understanding of the broader environmental consequences of forest fires in protected areas.
The approach’s reliance on freely available Landsat-8 data ensures its accessibility to management agencies globally, though optimal performance may require local calibration to account for specific ecosystem characteristics. This accessibility, combined with the methodology’s demonstrated accuracy, positions it as a valuable tool for protected area managers facing similar challenges worldwide. The framework’s ability to support both immediate post-fire assessment and long-term ecosystem recovery monitoring provides managers with a comprehensive solution for fire impact management.
Looking forward, the integration of machine learning techniques and automated processing workflows could further enhance the methodology’s utility for protected area management. Additionally, incorporating real-time aerosol monitoring and expanding the range of spectral indices could provide more comprehensive environmental impact assessments. These enhancements would strengthen managers’ ability to respond effectively to fire events while monitoring long-term ecosystem recovery.
The success of this approach in the Yushan National Park case study demonstrates its potential for broader application in protected area management, particularly in regions where traditional assessment methods face practical constraints. By providing accurate, timely, and comprehensive fire impact data, this methodology enables protected area managers to make informed decisions about resource allocation, restoration planning, and long-term ecosystem management strategies.
Data availability statement
The original contributions presented in the study are included in the article/supplementary material, further inquiries can be directed to the corresponding author.
Author contributions
W-YL: Conceptualization, Data curation, Formal analysis, Funding acquisition, Investigation, Methodology, Validation, Visualization, Writing – original draft, Writing – review & editing. C-LL: Formal analysis, Investigation, Methodology, Writing – original draft. Y-RW: Conceptualization, Formal analysis, Supervision, Validation, Visualization, Writing – original draft.
Funding
The author(s) declare that financial support was received for the research and/or publication of this article. This work was financially supported by National Science and Technology Council (NSTC) of Taiwan under Grants 113-2628-H-005-002-MY2 and 113-2321-B-005-005. It was also financially supported by the “Innovation and Development Center of Sustainable Agriculture” from The Featured Areas Research Center Program within the framework of the Higher Education Sprout Project by the Ministry of Education (MOE) of Taiwan, and by the Aerosol Science Research Center (NSYSU, Taiwan) to Y-RW.
Acknowledgments
We thank USGS for providing Landsat-8 satellite imagery, and thank the Forestry and Nature Conservation Agency, Ministry of Agriculture, Taiwan, for the photos of forest fires of Yushan National Park. We also thank Y. H. Lin, H. C. Huang and P. Z. Li for assisting with the manuscript. YRW acknowledges the support from the Aerosol Science Research Center, National Sun Yat-sen University under the grant of “Higher Education Sprout Project - The Featured Areas Research Center Program”, Ministry of Education, Taiwan.
Conflict of interest
The authors declare that the research was conducted in the absence of any commercial or financial relationships that could be construed as a potential conflict of interest.
Generative AI statement
The authors declare that no Gen AI was used in the creation of this manuscript.
Publisher’s note
All claims expressed in this article are solely those of the authors and do not necessarily represent those of their affiliated organizations, or those of the publisher, the editors and the reviewers. Any product that may be evaluated in this article, or claim that may be made by its manufacturer, is not guaranteed or endorsed by the publisher.
References
Alcaras, E., Costantino, D., Guastaferro, F., Parente, C., and Pepe, M. (2022). Normalized burn ratio plus (NBR+): a new index for sentinel-2 imagery. Remote Sens. 14, 1727–1742. doi: 10.3390/rs14071727
Arnett, J. T. T. R., Coops, N. C., Daniels, L. D., and Falls, R. W. (2015). Detecting forest damage after a low-severity fire using remote sensing at multiple scales. Int. J. Appl. Earth Obs. Geoinf. 35:239. doi: 10.1016/j.jag.2014.09.013
Bonney, M. T., He, Y., and Myint, S. W. (2020). Contextualizing the 2019–2020 kangaroo island bushfires: quantifying landscape-level influences on past severity and recovery with Landsat and Google earth engine. Remote Sens. 12:3942. doi: 10.3390/rs12233942
Boucher, J., Hébert, C., and Bauce, E. (2020). A flexible approach for predicting and mapping postfire wood borer attacks in black spruce and jack pine forests using the differenced normalized burn ratio (dNBR). Can. J. For. Res. 50, 880–889. doi: 10.1139/cjfr-2019-0334
Bradshaw, C. J., and Warkentin, I. G. (2015). Global estimates of boreal forest carbon stocks and flux. Glob. Planet. Change 128, 24–30. doi: 10.1016/j.gloplacha.2015.02.004
Burrell, A. L., Sun, Q., Baxter, R., Kukavskaya, E. A., Zhila, S., Shestakova, T., et al. (2022). Climate change, fire return intervals and the growing risk of permanent forest loss in boreal Eurasia. Sci. Total Environ. 831, 154885–154899. doi: 10.1016/j.scitotenv.2022.154885
Camps-Valls, G., Campos-Taberner, M., Moreno-Martínez, Á., Walther, S., Duveiller, G., Cescatti, A., et al. (2021). A unified vegetation index for quantifying the terrestrial biosphere. Sci. Adv. 7, 1–10. doi: 10.1126/sciadv.abc7447
Cardil, A., Mola-Yudego, B., Blázquez-Casado, Á., and González-Olabarria, J. R. (2019). Fire and burn severity assessment: calibration of relative differenced normalized burn ratio (RdNBR) with field data. J. Environ. Manag. 235, 342–349. doi: 10.1016/j.jenvman.2019.01.077
Chausson, A., Turner, B., Seddon, D., Chabaneix, N., Girardin, C. A., and Kapos, V. (2020). Mapping the effectiveness of nature-based solutions for climate change adaptation. Glob. Change Biol. 26, 6134–6155. doi: 10.1111/gcb.15310
Chen, X., Hopkins, B., Wang, H., O’Neill, L., Afghah, F., Razi, A., et al. (2022). Wildland fire detection and monitoring using a drone-collected RGB/IR image dataset. IEEE Access 10:121301. doi: 10.1109/access.2022.3222805
Chen, Y. Y., Wang, S. Y. S., Yu, Y. W., and Liu, W. Y. (2024). When forests hold their breath: will increasing drought further disrupt carbon sequestration? Environ. Res. Lett. 19:031002. doi: 10.1088/1748-9326/ad27ba
Chou, C. H., and Tang, H. Y. (2016). Conservation of biodiversity in Taiwan. Bot. Orient. 10, 1–5. doi: 10.3126/botor.v10i0.21016
Chuvieco, E., Aguado, I., Salas, J., García, M., Yebra, M., and Oliva, P. (2020). Satellite remote sensing contributions to wildland fire science and management. Curr. Forestry Rep. 6:81. doi: 10.1007/s40725-020-00116-5
Chuvieco, E., Martin, M. P., and Palacios, A. (2002). Assessment of different spectral indices in the red-near-infrared spectral domain for burned land discrimination. Int. J. Remote Sens. 23, 5103–5110. doi: 10.1080/01431160210153129
Coban, H., and Erdin, C. (2020). Forest fire risk assessment using GIS and AHP integration in Bucak forest enterprise, Turkey. Appl. Ecol. Environ. Res. 18, 3645–3659. doi: 10.15666/aeer/1801_15671583
Cui, L., Luo, C., Yao, C., Zou, Z., Wu, G., and Li, Q. (2022). The influence of climate change on forest fires in Yunnan province, Southwest China detected by GRACE satellites. Remote Sens. 14, 712–728. doi: 10.3390/rs14030712
Delcourt, C. J., Combee, A., Izbicki, B., Mack, M. C., Maximov, T., Petrov, R., et al. (2021). Evaluating the differenced normalized burn ratio for assessing fire severity using sentinel-2 imagery in northeast Siberian larch forests. Remote Sens. 13, 2311–2329. doi: 10.3390/rs13122311
Digavinti, J., and Manikiam, B. (2021). Satellite monitoring of forest fire impact and regeneration using NDVI and LST. J. Appl. Remote. Sens. 15, 42412–42428. doi: 10.1117/1.JRS.15.042412
Dong, S., Jiang, Y., and Yu, X. (2021). Analyses of the impacts of climate change and forest fire on cold region slopes stability by random finite element method. Landslides 18, 2531–2545. doi: 10.1007/s10346-021-01637-1
Egorov, A., Roy, D. P., and Boschetti, L. (2023). Generation and comprehensive validation of 30 m conterminous United States Landsat percent tree cover and forest cover loss annual products. Sci. Remote Sens. 7:100084. doi: 10.1016/j.srs.2023.100084
Fan, W., Li, J., Han, Z., Wu, J., Zhang, S., Zhang, C., et al. (2023). Impacts of biomass burning in Southeast Asia on aerosols over the low-latitude plateau in China: an analysis of a typical pollution event. Front. Environ. Sci. 11:1101745. doi: 10.3389/fenvs.2023.1101745
Forestry and Nature Conservation Agency, Ministry of Agriculture. (2024). Forestry and conservation statistics: yearbook 2024 (ISSN 1815-4123). Available online at: https://www.forest.gov.tw/0004647
Forestry Bureau, Council of Agriculture, Executive Yuan. (2016). The fourth national forest resource survey. Taiwan biodiversity information facility (TaiBIF). Available online at: http://taibif.tw/ipt/resource.do?r=forest_resource-4
Forestry Bureau, Council of Agriculture, Executive Yuan. (2021a). Yushan forest fire: offender indicted for illegal logging and fire-setting; forestry bureau seeks over NT$200 million in damages. Available online at: https://www.forest.gov.tw/0000013/0068109
Forestry Bureau, Council of Agriculture, Executive Yuan. (2021b). Yushan forest fire extinguished: forestry bureau discloses behind-the-scenes challenges and vows legal action against offender. Available online at: https://www.forest.gov.tw/0000013/0067737
Forestry Bureau, Council of Agriculture, Executive Yuan. (2023). Forestry statistics: Yearbook 2022 (ISBN 30031453). Forestry and Nature Conservation Agency, Ministry of Agriculture. Available online at: https://www.forest.gov.tw/0004586
Fujii, Y., Tohno, S., Amil, N., and Latif, M. T. (2017). Quantitative assessment of source contributions to PM2.5 on the west coast of peninsular Malaysia to determine the burden of Indonesian peatland fire. Atmos. Environ. 171, 111–117. doi: 10.1016/j.atmosenv.2017.10.009
Gale, M. G., Cary, G. J., van Dijk, A. I. J. M., and Yebra, M. (2021). Forest fire fuel through the lens of remote sensing: review of approaches, challenges and future directions in the remote sensing of biotic determinants of fire behaviour. Remote Sens. Environ. 255:112282. doi: 10.1016/j.rse.2020.112282
Giddey, B. L., Baard, J. A., and Kraaij, T. (2022). Verification of the differenced normalised burn ratio (dNBR) as an index of fire severity in Afrotemperate forest. S. Afr. J. Bot. 146, 348–353. doi: 10.1016/j.sajb.2021.11.005
Hamilton, D., Gibson, W., Harris, D., and McGath, C. (2023). Evaluation of multi-spectral band efficacy for mapping wildland fire burn severity from PlanetScope imagery. Remote Sens. 15:5196. doi: 10.3390/rs15215196
Hislop, S., Jones, S., Soto-Berelov, M., Skidmore, A., Haywood, A., and Nguyen, T. H. (2019). A fusion approach to forest disturbance mapping using time series ensemble techniques. Remote Sens. Environ. 221, 188–197. doi: 10.1016/j.rse.2018.11.025
Huete, A. (2012). Vegetation indices, remote sensing and forest monitoring. Geogr. Compass 6:513. doi: 10.1111/j.1749-8198.2012.00507.x
Hu, M., Liu, Y., Wang, T., Hao, Y., Li, Z., and Wan, S. (2020). Fire alters soil properties and vegetation in a coniferous–broadleaf mixed forest in Central China. Forests 11, 164–178. doi: 10.3390/f11020164
IPCC Change (2006). IPCC guidelines for national greenhouse gas inventories. Hayama: Institute for Global Environmental Strategies.
Jodhani, K. H., Gupta, N., Parmar, A. D., Bhavsar, J. D., Patel, H., Patel, D., et al. (2024a). Synergizing google earth engine and earth observations for potential impact of land use/land cover on air quality. Results Eng. 22:102039. doi: 10.1016/j.rineng.2024.102039
Jodhani, K. H., Patel, H., Soni, U., Patel, R., Valodara, B., Gupta, N., et al. (2024b). Assessment of forest fire severity and land surface temperature using Google Earth Engine: A case study of Gujarat State, India. Fire Ecol. 20:23. doi: 10.1186/s42408-024-00254-2
Kolanek, A., Szymanowski, M., and Raczyk, A. (2021). Human activity affects forest fires: the impact of anthropogenic factors on the density of forest fires in Poland. Forests 12, 728–742. doi: 10.3390/f12060728
Krikken, F., Lehner, F., Haustein, K., Drobyshev, I., and van Oldenborgh, G. J. (2021). Attribution of the role of climate change in the forest fires in Sweden 2018. Nat. Hazards Earth Syst. Sci. 21, 2169–2179. doi: 10.5194/nhess-21-2169-2021
Law, B. S., Gonsalves, L., Burgar, J., Brassil, T., Kerr, I., and O'Loughlin, C. (2022). Fire severity and its local extent are key to assessing impacts of Australian mega-fires on koala (Phascolarctos cinereus) density. Glob. Ecol. Biogeogr. 31, 714–726. doi: 10.1111/geb.13458
Lentile, L. B., Holden, Z. A., Smith, A. M. S., Falkowski, M. J., Hudak, A. T., Morgan, P., et al. (2006). Remote sensing techniques to assess active fire characteristics and post-fire effects. Int. J. Wildland Fire 15:319. doi: 10.1071/wf05097
Li, C. L., and Jones, T. E. (2021). “Taiwan’s national network of protected areas and nature-based tourism” in Nature-based tourism in Asia’s mountainous protected areas: a trans-regional review of peaks and parks (Cham: Springer International Publishing), 91–107.
Liu, W. Y., Huang, Y. H., and Hsieh, C. M. (2020). The impacts of different climate change scenarios on visits toward the national forest park in Taiwan. Forests 11, 1203–1218. doi: 10.3390/f11111203
Liu, W. Y., Lin, Y. Y., Chen, H.-S., and Hsieh, C. M. (2019). Assessing the amenity value of forest ecosystem services: perspectives from the use of sustainable green spaces. Sustain. For. 11, 4500–4515. doi: 10.3390/su11164500
Lohmander, P., Mohammadi, Z., Kašpar, J., Tahri, M., Berčák, R., and Holuša, J. (2022). Future forest fires as functions of climate change and attack time for central bohemian region, Czech Republic. Ann. For. Res. 65, 17–30. doi: 10.15287/afr.2022.2183
Ma, Y., Xin, J., Zhang, W., Liu, Z., Ma, Y., Kong, L., et al. (2019). Long-term variations of the PM2.5 concentration identified by MODIS in the tropical rain forest, southeast asia. Atmos. Res. 219, 140–152. doi: 10.1016/j.atmosres.2018.12.024
Omar, P. J., and Kumar, V. (2021). Land surface temperature retrieval from TIRS data and its relationship with land surface indices. Arab. J. Geosci. 14:1897. doi: 10.1007/s12517-021-08255-0
Pani, S. K., Lin, N.-H., Chantara, S., Wang, S.-H., Khamkaew, C., Prapamontol, T., et al. (2018). Radiative response of biomass-burning aerosols over an urban atmosphere in northern peninsular Southeast Asia. Sci. Total Environ. 633, 892–911. doi: 10.1016/j.scitotenv.2018.03.204
Pellegrini, A. F., Ahlström, A., Hobbie, S. E., Reich, P. B., Nieradzik, L. P., and Staver, A. C. (2018). Fire frequency drives decadal changes in soil carbon and nitrogen and ecosystem productivity. Nature 553, 194–198. doi: 10.1038/nature24668
Pellegrini, A. F., Caprio, A. C., Georgiou, K., Finnegan, C., Hobbie, S. E., and Hatten, J. A. (2021). Low-intensity frequent fires in coniferous forests transform soil organic matter in ways that may offset ecosystem carbon losses. Glob. Change Biol. 27, 3810–3823. doi: 10.1111/gcb.15648
Pérez-Cabello, F., Montorio, R., and Alves, D. B. (2021). Remote sensing techniques to assess post-fire vegetation recovery. Curr. Opin. Environ. Sci. Health 21:100251:100251. doi: 10.1016/j.coesh.2021.100251
Phillips, S., Wallis, K., and Lane, A. (2021). Quantifying the impacts of bushfire on populations of wild koalas (Phascolarctos cinereus): insights from the 2019/20 fire season. Ecol. Manage. Restor. 22, 80–88. doi: 10.1111/emr.12458
Reddington, C. L., Conibear, L., Robinson, S., Knote, C., Arnold, S. R., and Spracklen, D. V. (2021). Air pollution from forest and vegetation fires in Southeast Asia disproportionately impacts the poor. GeoHealth 5:e2021GH000418. doi: 10.1029/2021GH000418
Reid, W. V., Mooney, H. A., Cropper, A., Capistrano, D., Carpenter, S. R., and Chopra, K. (2005). Ecosystems and human well-being-synthesis: a report of the millennium ecosystem assessment. Washington, DC: Island Press.
Rouse, J. W., Haas, R. H., Deering, D. W., Schell, J. A., and Harlan, J. C. (1974). Monitoring the vernal advancement and Retrogradation (green wave effect) of natural vegetation. College Station, TX: Texas A&M University.
Roy, D. P., Wulder, M. A., Loveland, T. R., Woodcock, C. E., Allen, R. G., Anderson, M. C., et al. (2014). Landsat-8: science and product vision for terrestrial global change research. Remote Sens. Environ. 145, 154–172. doi: 10.1016/j.rse.2014.02.001
Sadowska, B., Grzegorz, Z., and Stępnicka, N. (2021). Forest fires and losses caused by fires – an economic approach. WSEAS Trans. Environ. Dev. 17:181. doi: 10.37394/232015.2021.17.18
Santos, S. M. B., Bento-Gonçalves, A., Franca-Rocha, W., and Baptista, G. M. d. M. (2020). Assessment of burned forest area severity and postfire regrowth in Chapada Diamantina National Park (Bahia, Brazil) using dNBR and RdNBR spectral indices. Geosciences 10:106. doi: 10.3390/geosciences10030106
Sarkar, C., Roy, A., Chatterjee, A., Ghosh, S. K., and Raha, S. (2019). Factors controlling the long-term (2009–2015) trend of PM2.5 and black carbon aerosols at eastern Himalaya, India. Sci. Total Environ. 656, 280–296. doi: 10.1016/j.scitotenv.2018.11.367
Segah, H., Tani, H., and Hirano, T. (2010). Detection of fire impact and vegetation recovery over tropical peat swamp forest by satellite data and ground-based NDVI instrument. Int. J. Remote Sens. 31, 5297–5314. doi: 10.1080/01431160903302981
Senande-Rivera, M., Ínsua-Costa, D., and Miguez-Macho, G. (2022). Spatial and temporal expansion of global wildland fire activity in response to climate change. Nat. Commun. 13, 1–9. doi: 10.1038/s41467-022-28835-2
Soubry, I., Doan, T., Chu, T., and Guo, X. (2021). A systematic review on the integration of remote sensing and GIS to forest and grassland ecosystem health attributes, indicators, and measures. Remote Sens. 13:3262. doi: 10.3390/rs13163262
Souza, C. R., Maia, V. A., Mariano, R. F., Souza, F. C.de, Araújo, F. de Carvalho, and Paula, G. G.de. (2022). Tropical forests in ecotonal regions as a carbon source linked to anthropogenic fires: a 15-year study case in Atlantic forest–Cerrado transition zone. For. Ecol. Manag. 519: 120326–120342. doi: 10.1016/j.foreco.2022.120326
van Gerrevink, M. J., and Veraverbeke, S. (2021a). Evaluating the hyperspectral sensitivity of the differenced normalized burn ratio for assessing fire severity. Remote Sens. 13, 4611–4628. doi: 10.3390/rs13224611
van Gerrevink, M. J., and Veraverbeke, S. (2021b). Evaluating the near and mid infrared bi-spectral space for assessing fire severity and comparison with the differenced normalized burn ratio. Remote Sens. 13, 695–712. doi: 10.3390/rs13040695
Wang, C., Wang, A., Guo, D., Li, H., and Zang, S. (2022). Off-peak NDVI correction to reconstruct Landsat time series for post-fire recovery in high-latitude forests. Int. J. Appl. Earth Obs. Geoinf. 107, 102704–102718. doi: 10.1016/j.jag.2022.102704
Wassner, N., Figueiredo, A., and Nunes, A. (2025). Applying remote sensing to assess post-fire vegetation recovery: a case study of Serra do Açor (Portugal). Fire 8:163. doi: 10.3390/fire8050163
Xiao, C., Li, P., and Feng, Z. (2019). A renormalized modified normalized burn ratio (RMNBR) index for detecting mature rubber plantations with Landsat-8 OLI in Xishuangbanna, China. Remote Sens. Lett. 10, 214–223. doi: 10.1080/2150704X.2018.1541106
Yu, H. W., Wang, S., and Liu, W. Y. (2024). Estimating wildfire potential in Taiwan under different climate change scenarios. Clim. Chang. 176:17. doi: 10.1007/s10584-023-03669-z
Yu, H. W., Wang, S., and Liu, W. Y. (2025). Do fire weather conditions significantly affect wildfires in subtropical forests in Taiwan? J. Appl. Meteorol. Climatol. 64, 165–184. doi: 10.1175/JAMC-D-24-0031.1
Zhang, S., Bai, M., Wang, X., Peng, X., Chen, A., and Peng, P. (2023). Remote sensing technology for rapid extraction of burned areas and ecosystem environmental assessment. PeerJ 11:e14557. doi: 10.7717/peerj.14557
Keywords: remote sensing, forest fire impact assessment, burn severity mapping, carbon loss estimation, protected areas
Citation: Liu C-L, Wang Y-R and Liu W-Y (2025) Multi-index remote sensing for post-fire damage assessment: accuracy, carbon loss, and conservation implications. Front. For. Glob. Change. 8:1577612. doi: 10.3389/ffgc.2025.1577612
Edited by:
Ana Novo, University of Vigo, SpainReviewed by:
Mustafa Tolga Esetlili, Ege University, TürkiyePadam Jee Omar, Babasaheb Bhimrao Ambedkar University, India
Copyright © 2025 Liu, Wang and Liu. This is an open-access article distributed under the terms of the Creative Commons Attribution License (CC BY). The use, distribution or reproduction in other forums is permitted, provided the original author(s) and the copyright owner(s) are credited and that the original publication in this journal is cited, in accordance with accepted academic practice. No use, distribution or reproduction is permitted which does not comply with these terms.
*Correspondence: Wan-Yu Liu, d3lsaXVAbmNodS5lZHUudHc=