Abstract
Climate and land use changes significantly endanger tree species’ structure and diversity in savanna woodlands. The destruction of these ecosystems hinders the achievement of several global environmental and development targets, notably SDGs 2, 13, and 15, which underscores the need for continuous tree monitoring to inform decision-making on biodiversity conservation. This study aims to characterize the relationships between tree diversity and structure across different land cover (LC) classes—Dense tree cover (D), Sparse tree cover (S), Grasslands (G), and Wetlands (W)—and altitudinal gradients (AGs) in Alain forest, located in Sudan’s savanna woodlands. A systematic sampling was used across varying AGs and LC types to collect data on tree species richness and structure in 926 circular plots. Tree diversity, measured using Shannon and Simpson indices, showed significant differences among LC classes (p < 0.05), with the highest diversity observed in D and the lowest in G. Both indices exhibited a significant negative correlation with AGs (Shannon: R = –0.33, p < 0.001; Simpson: R = –0.30, p < 0.001), indicating a decline in tree diversity with increasing elevation. Tree structural attributes also varied significantly across LC types: tree height and density were highest in D and lowest in G (p < 0.05). While tree height showed a weak but significant negative correlation with altitude (R = –0.106, p = 0.003), tree density did not (R = –0.048, p = 0.185). Principal Component Analysis (PCA) revealed distinct clustering of LC classes based on combined diversity and structural attributes, with tree height and diversity indices contributing strongly to the first two principal components. These findings highlight the influence of LC and AGs on tree community structure and biodiversity in Alain forest, offering valuable insights for conservation and land-use planning. Further research based on more comprehensive datasets is recommended to boost scientific knowledge for biodiversity conservation and sustainable management.
1 Introduction
Savannas remain vital for biodiversity conservation, yet savanna woodlands are increasingly endangered by land-use change and climate stressors, primarily driven by human activities and land degradation (Tripathi et al., 2021; Mtsetfwa et al., 2023). These threats not only impact savannas’ ecosystem sustainability but also have negative socioeconomic impacts, especially on rural populations (Marchant, 2010). Notably, they pose significant challenges to achieving a number of the United Nations Sustainable Development Goals (Arora and Mishra, 2024; Raman et al., 2024) and fulfilling key international commitments such as the Kunming-Montreal Global Biodiversity Framework, and the UN Strategic Plan for Forests 2017-2030 (Department of Economic and Social Affairs Forests, 2017; Pillay et al., 2024)
Given the ongoing global warming, savanna ecosystems face an urgent need for adaptation in their structure and composition to cope with climate risks (Oliveira et al., 2017). The structural complexity of tree stands is particularly critical, as diverse and well-structured vegetation can buffer the impacts of climate change on species abundance, enhance ecosystem resilience, and support long-term biodiversity conservation (Koller et al., 2025). In Sudan, savanna woodlands are recognized as biodiversity habitats, supporting a rich diversity of floral and faunal species that have adapted to persist in the highly dynamic and fluctuating environment (Dudley et al., 2020; Mohammed et al., 2021a). This complexity is understudied, yet anthropological activities have led to the distinction of an increasing number of tree species (Masolele et al., 2024).
According to Bradter et al. (2013), such environmental heterogeneity, coupled with topographic variability and disturbances like fire, drive the evolution and persistence of locally adapted floral and faunal assemblages across savannas over evolutionary time scales. The unique biodiversity and ecological significance characterize the savanna woodlands of Sudan, which play an important role in supporting local communities and maintaining ecosystem balance (Siddig, 2019; Adam et al., 2024). Among these woodlands, Alain Forest is a good example of the diverse tree species and varied landforms found in Sudan (Elzaki and Gang, 2019). Yet, rapid agricultural expansion, infrastructure development, unsustainable extraction of wood products, and climate change threaten this ecosystem (Siddig, 2019; Gadallah et al., 2021).
While many studies have explored vegetation dynamics in African savannas, a few have quantitatively assessed how tree diversity and structure vary simultaneously across land cover types and elevation gradients in Sudan’s savanna ecosystems. For instance, Hasoba et al. (2020) conducted a study in southeastern Sudan assessing tree composition, diversity, density, and stage structure, providing valuable insights into the dynamics of savanna woodlands. Mohammed et al. (2021b) emphasized the role of sustainably managed forests in climate change mitigation by assessing tree diversity and stand structure in similar ecosystems. These studies underscore the need for comprehensive research on tree diversity to inform effective conservation efforts. Specifically, an integrated quantification distinguishing variation in tree alpha diversity metrics like species richness and structure across major land cover types along defined elevation gradients remains important but limited. This represents a key knowledge gap in understanding how tree species’ compositions and structure differ based on their topo-climatic factors for better conservation investments toward preserving biodiversity in Sudan’s savanna woodlands.
Thus, this study aims to address this deficit by examining the combined effects of land cover and altitude on tree diversity (Shannon and Simpson indices) and structure (height and density) in Alain forest area, as one under-researched savanna woodlands of Sudan. This research provides insights into how landscape heterogeneity shapes biodiversity in one of the least-studied regions of the Sudano-Sahelian zone. Particularly, it responds to these questions: (i) How do altitudinal gradients and land cover influence tree species diversity? (ii) How does tree structure (tree density and tree height) vary across the land cover types and along altitudinal gradients? The main hypothesis is that the land cover and altitudinal gradients do not shape the structural and diversity patterns of Alain forest area trees. Precisely, the hypothesis are: (A) Tree communities located in the greener land cover will have higher species richness, higher tree height, and higher density than those located in less green cover; and (B) Tree communities from higher elevations have a higher species richness, higher tree height, and higher density than those located at lower elevations.
2 Data and methods
2.1 Research site
Alain Forest Area is a prime woodland area in the North Kordofan State of Sudan. The research site is confined within longitude (30°14′–30°26″ E) and latitude (12°50″–13°02″ N), covering an area of 18854.73 ha (Figure 1). The area has a mountainous terrain in the northern and central parts and semi-flat and flat topography in the eastern and southern parts of the area. The area records rainfall in the summer months (July–October), reaching 250–450 mm/annum (Gadallah et al., 2022). The mean minimum and maximum temperatures are 34.7 and 19.9°C, respectively (Gamreldin and Hamadalnel, 2024).
FIGURE 1

Map of the research site showing the geographical location and sampling design. Sample plots were distributed systematically across different land cover classes and altitudinal gradients in Alain forest.
The forest is considered to be one of the most important natural forests in the region. It is reserved and managed by the Forest National Corporation of Sudan. The forest is the source of many tree genera, such as Acacia senegal and Adansonia digitata, that have several industrial applications. The dominant trees and shrubs are Maerua crassifolia, Acacia mellifera- commiphora desert scrub, and other tree species found in depressions, such as Acacia nilotica (Elzaki and Gang, 2019). The area is also inhabited by some grasses such as Aristida spp., Eragrostis tremula, and Cenchrus biflorus (Darbyshire et al., 2015).
The soil varies from coarse sand in the mountainous areas to crackly clay soils, still predominantly sandy or clay, in the alluvial plain adjacent to seasonal water bodies (Taha et al., 2014). Almost all rainwater runs over and off these mostly impermeable soils.
2.2 Depicting land cover classes
The first stage was the determination of the area of interest using a boundary map of Alain Forest Area. This was followed by downloading the Landsat 8 image (path 72 row 51 acquisition on October 10, 2022) from the United States Geological Survey (USGS), with a spatial resolution of 30 m, which was used for land cover (LC) delineation. The year 2022 was chosen for the LC observations, considering the field visit where a Garmin Etrex 10 handheld portable GPS device was used for taking ground points from each class as a training area to determine the type of LC, as recommended by Immitzer and Atzberger (2023). All the records collected were projected using a WGS 84 datum.
The image was preprocessed in terms of image calibration; geometrical and atmospheric correction, layer-stacking, and contrast stretching, depicting the normalized difference vegetation index (NDVI) values and formation of color composite. The NDVI values were extracted as it is sensitive to changes in plant canopy and provide unique information (Mallegowda et al., 2015; Liu et al., 2024). The fusion techniques were examined to identify the research site’s classes through the Maximum Likelihood Classifier (MLC), which is considered the most widely adopted parametric classification algorithm (Salih et al., 2017). Through the existing knowledge of research site LC and GPS ground points, the image was supervisedly classified, and displayed as false color composite images and interpreted for LC classes using Arc-Map version 10.5 (Environmental Systems Research Institute [ESRI], 2016). An accuracy test expressed by the Kappa coefficient (K), was performed using the confusion matrix method, where 400 points were equally considered (100 point/class) to compared the types of class cover interpretation results with the actual conditions in the form of ground points, and the result was 87.5% (Supplementary Appendix A).
2.3 Extracting altitudinal gradients
The topographic factor was also considered in this research as an important driver of the spatial distribution of tree species (Bhat et al., 2020; Negi et al., 2024). Sample plots-based GPS elevation points (926) and a 30 m resolution digital elevation model from the Shuttle Radar Topography Mission (SRTM), provided by the USGS Earth Explorer service,1 were employed to estimate the altitudinal gradients. Analysis of SRTM data for characterizing AGs was combined with the field survey data to get accurate elevation values before inserting them in the tree species table to display their patterns on the map. The SRTM was chosen since it provides valuable insights into the complex interactions between topography, climate, and ecological processes along elevational gradients (Zandbergen, 2008; Higgins et al., 2012). Even though 30 m resolution is coarse, it was adopted in consistency with the Landsat 8 images’ resolution, which is used for the LC classifications.
2.4 Site surveys and tree inventory for assessing stand attributes
A lot of literature on forest surveys and inventory (Kangas and Maltamo, 2006; Magnussen et al., 2020; Suggitt et al., 2021) recommended the adoption of systematic sampling. Accordingly, sample plots have been drawn based on methods and guidelines used in other studies (Van Vuuren and Carter, 2014; Gadallah et al., 2022). Thus, Map-Source-version 6.11.5 (Garmin, United States) and Arc-Map software were used to prepare and design the geo-sample plots via creating a fish net (spaces 500*500 m) after the pilot visit to the research site. Thus, a grid of the samples was created with parallel survey-lines spaced 500 m apart. Along each survey line, circular sample plots (radius 17.84 m with an area of 1,000 m2) were located every 500 m, constituting a total of 926 plots in all LC classes (Figure 1). Eventually, the plots’ coordinates were transferred to a GPS device and were visited for data collection.
To form tree species richness and stand structure, at each plot (i.e., 926 plots), tree species have been identified together with their attributes. Their names, count, tree height (H) using a Haga altimeter, and diameter at breast height (DBH) using a diameter tape and Caliper, were measured and recorded with the assistance of a skilled taxonomist and a field manual of woody tree species. All tree species with a DBH ≥ 5 cm were counted and measured, while those with a smaller DBH were considered regenerations and hence counted as per tree species throughout the sample plots.
2.4.1 Characterizing tree species diversity
Tree species identification was carried out with the assistance of a skilled botanist. The taxonomic classification was verified using an annotated checklist (Darbyshire et al., 2015), African Plant Database,2 and World Plant Names.3 The identified tree species were classified into their respective genera and families, allowing for the calculation of diversity indices to assess species-environment relationships and gain deeper insights into the factors influencing tree composition along LC and AGs.
Species composition as expressed through species richness and diversity measures and abundance was determined in terms of the number of counts of each present in a community, where all species encountered were categorized into their respective families and genera. Total species richness was thereafter computed as the total number of species across all sample plots. Through the R package vegan, species diversity was computed using the Shannon-Weiner diversity index (H’) and Simpson’s diversity index (D). The Shannon Diversity index (Shannon, 1948) was calculated using the number of tree species occurring in whole classes at each sample plot to compare species diversity between the LC classes. The Simpson index was measured by the similarity of the abundance of the different woody species sampled. Its value varies between 0 and 1, where 0 represents one or few species that have higher abundance than others, and 1 in a situation where all species have equal abundance (Simpson, 1949; He and Hu, 2005). The Simpson Index is often referred to as equitability index because it not only accounts for the richness (number of species) in a community, but also the relative abundance of each species (Simpson, 1949).
2.4.2 Exploring stand structure
The population structure of the tree species was examined across the LC classes and AGs. To evaluate the dominance and ecological significance of tree species, the Importance Value Index (IVI) was firstly calculated based on species density, frequency, and dominance across all plots and within LC classes. Secondly, the stand structure was analyzed with classical forest attributes, including tree density and tree height, which were computed at the LC class level for trees with a diameter ≥ 5 cm to be comparable with other studies (Husch et al., 2003). Stem density and tree height, respectively, correspond to the number of trees in the sample plot, and tree height corresponds to the average of the sample’s tree height as an indicator of species contribution for each class (Kiernan, 2023). Tree density was calculated by dividing all trees in the sample plot over the area sampled in hectares (ha). While stand structure encompasses various features, such as tree density, height, DBH, and basal area, this research focused on the effects of LC and AGs on tree density and height as core indicators because they represent the fundamental vertical and horizontal dimensions of tree structure. The height reflects canopy layering variation, while density captures stand crowding, both of which are ecologically meaningful and widely used in structural assessments (Barreras et al., 2023).
2.5 Statistical analysis
The collected data were entered, cross-checked for errors, and processed in Microsoft Excel 2021 spreadsheets (Microsoft Corporation, 2021) to meet the needs of statistical programs. The Excel data was meticulously cleaned and structured to align with R’s data handling capabilities, allowing for efficient data manipulation, exploration, and statistical modeling.
Three statistical analyses were used to determine linkages and variations in tree attributes across the LC classes and AGs. First, to evaluate the effect of LC classes (D, S, G, and W) on tree characteristics, we conducted one-way analyses of variance (ANOVA) separately (i.e., tree diversity and structure). Assumptions of normality and homogeneity of variances were assessed using the Shapiro-Wilk and Levene’s tests, respectively, and for each ANOVA, the F-statistic, degrees of freedom, and associated p-value were reported. Post hoc comparisons were performed using Tukey’s honest significance (HSD) test, and confidence intervals (95%) were calculated for the means. Pearson’s correlation tests between altitude and each response variable (Shannon, Simpson, tree height, and tree density) were used to assess the influence of altitude on tree diversity and structure. Prior to analysis, scatterplots were visually inspected to verify linearity, and normality of variables was checked using the Shapiro–Wilk test.
Additionally, a species accumulation curve was generated to evaluate the adequacy of the sampling effort and to estimate species richness across plots. The curve was constructed using the “specaccum” function from the vegan package in R, based on random permutations of the sample order. The cumulative number of tree species was plotted against the number of sampling units, and the curve’s asymptotic trend was used to assess whether sampling captured the majority of species in the research site (Supplementary Appendix B). Finally, an advanced analysis through multivariate techniques in terms of Principal Component Analysis (PCA) was performed using standardized variables (tree height, tree density, Shannon and Simpson indices, and altitude) to explore multivariate relationships, with LC classes used as grouping factors. All statistical analyses were performed in R (v4.4.2) (R Core Team, 2024).
3 Results
3.1 Research site land covers, altitudinal gradients and tree attributes
Based on the ground observation and satellite imagery analysis vis-à-vis land cover (LC) classes and altitudinal gradients (AGs), the research site exhibited a varied distribution of LC classes, with 2741.85 ha classified as Dense trees (D), 7713.99 ha as Sparse trees (S), 7920.27 ha as Grasslands (G), and 478.62 ha as Wetland (W) (Figure 2A). Likewise, the research site showed a range of AGs, with elevations varying from 508 to 758 meters (Figure 2B). The distribution of the LC classes was found to be closely linked to the AGs, with the different classes occupying distinct elevation zones. The D and S classes were predominantly found at the mid-range elevations, from 608 to 658 meters zones. In contrast, the G class was observed at low and higher elevations, ranging from 658 to 708 meters, while the W class was confined to the low-level elevation zones.
FIGURE 2
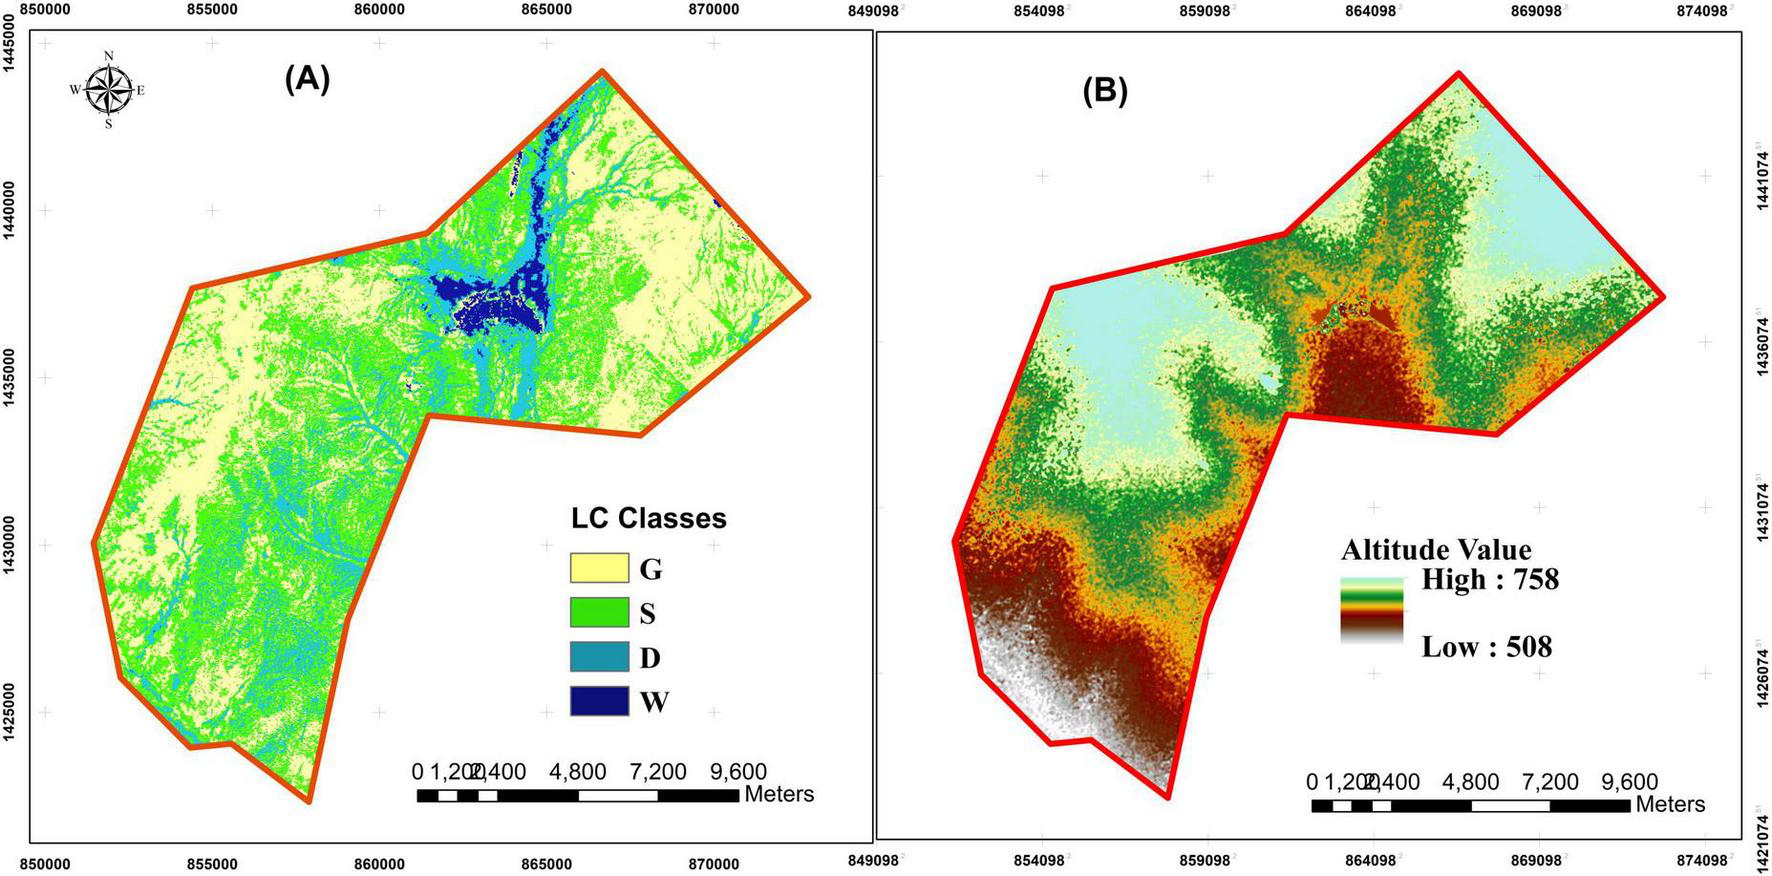
Maps of land cover classes (A) including Dense tree cover (D), Sparse tree cover (S), grasslands (G), and wetlands (W), (B) altitudinal gradients across the study landscape showing elevation variation associated with different land cover types.
The tree attributes show a rich tapestry of tree richness and structure, where a total of 7,483 mature woody plants were counted, representing 63 species across 43 genera and 16 families (Supplementary Appendix B). The Fabaceae, Capparaceae, Combretaceae, and Malvaceae families exhibited dominance in the area, with distinct patterns observed across various LC classes, highlighting the diverse ecological niches present in the area as presented in Figure 3. The IVI analysis (Table 1) and detailed per LC class in Supplementary Appendix C shows that Acacia mellifera is the most ecologically dominant species in D (121.17), Sparse (106.74), and G (129.08) land cover classes, indicating broad adaptability. Adansonia digitata exhibited significant dominance in D (63.21) and G (93.44) areas due to its high basal area despite lower frequency. W areas supported fewer species, with Ziziphus spina-christi and Acacia nilotica showing relatively higher IVI scores.
FIGURE 3

Representative landscape features and tree cover characteristics across the Alain Forest land cover classes: Dense tree cover (D) indicating high canopy closure; Sparse tree cover (S) with widely spaced trees and moderate undergrowth; Grasslands (G) dominated by herbaceous vegetation and minimal woody cover; and Wetlands (W) featuring saturated soils with aquatic trees.
TABLE 1
| Species | Family | F | D | RD | RF | RDom | IVI | IVI% | Category |
| Acacia mellifera (Vahl.) Benth. | Fabaceae (Mimosoideae) | 588 | 14.785 | 77.977 | 51.175 | 5.536 | 134.7 | 44.9 | Dominant |
| Acacia nilotica (L.) Delile subsp. Tomentosa (Benth.) | Fabaceae | 32 | 184.407 | 0.441 | 2.785 | 69.051 | 72.3 | 24.1 | Dominant |
| Acacia nilotica subsp. Nilotica (Brenan.) A. F. Hill | Fabaceae | 54 | 19.558 | 4.931 | 4.700 | 7.324 | 17.0 | 5.7 | Dominant |
| Acacia laeta Benth ex.Br.R | Fabaceae (Caesalpinioideae) | 33 | 13.831 | 5.386 | 2.872 | 5.179 | 13.4 | 4.5 | Dominant |
| Acacia senegal (L.) Willd. | Fabaceae (Mimosoideae) | 48 | 4.398 | 0.949 | 4.178 | 1.647 | 6.8 | 2.3 | Abandanat |
| Balanites aegyptiaca (L.), Del. | Zygophyllaceae (Tribuloideae) | 35 | 0.449 | 1.898 | 3.046 | 0.168 | 5.1 | 1.7 | Abandanat |
| Acacia seyal var. seyal Del. | Fabaceae (Mimosoideae) | 40 | 0.533 | 1.203 | 3.481 | 0.200 | 4.9 | 1.6 | Abandanat |
| Acacia tortilis subsp. raddiana (Savi) Brenan. | Fabaceae | 7 | 9.218 | 0.214 | 0.609 | 3.452 | 4.3 | 1.4 | Frequent |
| Adansonia digitata Linn. | Malvaceae (Bombacoideae) | 25 | 0.898 | 0.762 | 2.176 | 0.336 | 3.3 | 1.1 | Frequent |
| Acacia nubica Benth. | Fabaceae (Mimosoideae) | 13 | 2.981 | 0.374 | 1.131 | 1.116 | 2.6 | 0.9 | Frequent |
| Terminalia laxiflora Engl. & Diels. | Combretaceae | 14 | 2.328 | 0.281 | 1.218 | 0.872 | 2.4 | 0.8 | Frequent |
| Combretum molle R. Br. ex G. Don. | Combretaceae | 17 | 0.266 | 0.628 | 1.480 | 0.100 | 2.2 | 0.7 | Frequent |
| Terminalia brownii Fresen. | Combretaceae | 14 | 1.302 | 0.200 | 1.218 | 0.488 | 1.9 | 0.6 | Frequent |
| Boscia senegalensis (Pers.) Lam. Ex Poir. | Capparaceae | 12 | 1.442 | 0.321 | 1.044 | 0.540 | 1.9 | 0.6 | Frequent |
| Khaya senegalensis Juss.A (Desr) | Meliaceae | 11 | 1.937 | 0.200 | 0.957 | 0.725 | 1.9 | 0.6 | Frequent |
| Ziziphus spina-christi (L.) Desf. | Rhaminaceae | 14 | 0.044 | 0.428 | 1.218 | 0.016 | 1.7 | 0.6 | Frequent |
| Faidherbia albida (Delile) A. Chev. | Mimosoideae (Mimosaceae) | 10 | 1.432 | 0.187 | 0.870 | 0.536 | 1.6 | 0.5 | Frequent |
| Sclerocarya birrea (A. Rich.) Hochst. | Anacardiaceae | 11 | 0.021 | 0.160 | 0.957 | 0.008 | 1.1 | 0.4 | Frequent |
| Albizia amara (Roxb.) Boiv. | Fabaceae (Caesalpinioideae) | 8 | 0.570 | 0.214 | 0.696 | 0.213 | 1.1 | 0.4 | Frequent |
| Acacia polyacantha Willd. | Fabaceae (Mimosoideae) | 10 | 0.010 | 0.241 | 0.870 | 0.004 | 1.1 | 0.4 | Frequent |
| Combretum aculeatum Vent, Choix. | Combretaceae | 7 | 0.591 | 0.160 | 0.609 | 0.221 | 1.0 | 0.3 | Frequent |
| Dichrostachys cinerea (L.) White &Arn. | Fabaceae (Mimosoideae) | 9 | 0.087 | 0.174 | 0.783 | 0.032 | 1.0 | 0.3 | Frequent |
| Lonchocarpus laxiflorus Guill. & Perr. | Fabaceae (Faboideae) | 8 | 0.093 | 0.174 | 0.696 | 0.035 | 0.9 | 0.3 | Frequent |
| Salvadora persica L. | Salvadoraceae | 8 | 0.009 | 0.174 | 0.696 | 0.004 | 0.9 | 0.3 | Frequent |
| Stereospermum kunthianum Cham. | Bignoniaceae | 5 | 0.802 | 0.134 | 0.435 | 0.300 | 0.9 | 0.3 | Frequent |
| Dalbergia melanoxylon Guill. & Perr. | Fabaceae (Faboideae) | 7 | 0.154 | 0.174 | 0.609 | 0.058 | 0.8 | 0.3 | Frequent |
| Cordia sinensis Lam. | Cordiaceae | 7 | 0.103 | 0.094 | 0.609 | 0.038 | 0.7 | 0.2 | Occasional |
| Maerua angolensis DC. | Capparaceae | 5 | 0.421 | 0.107 | 0.435 | 0.158 | 0.7 | 0.2 | Occasional |
| Albizia anthelmintica Bring. | Fabaceae | 4 | 0.660 | 0.080 | 0.348 | 0.247 | 0.7 | 0.2 | Occasional |
| Crateva adansonii DC. | Capparaceae | 6 | 0.075 | 0.094 | 0.522 | 0.028 | 0.6 | 0.2 | Occasional |
| Lannea humilis (Oliv.) Engl. | Anacardiaceae | 6 | 0.021 | 0.107 | 0.522 | 0.008 | 0.6 | 0.2 | Occasional |
| Parkinsonia aculeata L. | Fabaceae | 3 | 0.858 | 0.053 | 0.261 | 0.321 | 0.6 | 0.2 | Occasional |
| Acacia seyal var. fistulal. Schwinf. Oliv. | Fabaceae (Mimosoideae) | 4 | 0.434 | 0.067 | 0.348 | 0.162 | 0.6 | 0.2 | Occasional |
| Adenium obesum (Forssk.) Roem & Schult. | Apocynaceae | 5 | 0.028 | 0.080 | 0.435 | 0.011 | 0.5 | 0.2 | Occasional |
| Azanza garckeana (F. Hoff.) Exell & Hillcoat. | Malvaceae | 4 | 0.258 | 0.080 | 0.348 | 0.097 | 0.5 | 0.2 | Occasional |
| Commiphora africana (A. Rich.) Engl. | Burseraceae | 4 | 0.209 | 0.067 | 0.348 | 0.078 | 0.5 | 0.2 | Occasional |
| Guiera senegalensis J. F.Gmel. | Combretaceae | 3 | 0.460 | 0.040 | 0.261 | 0.172 | 0.5 | 0.2 | Occasional |
| Anogeissus leiocarpus (DC.) Guill. & Perr. | Combretaceae | 4 | 0.071 | 0.094 | 0.348 | 0.026 | 0.5 | 0.2 | Occasional |
| Bauhinia reticulata DC. | Fabaceae | 4 | 0.071 | 0.080 | 0.348 | 0.027 | 0.5 | 0.2 | Occasional |
| Bauhinia rufescens Lam. | Fabaceae | 4 | 0.029 | 0.053 | 0.348 | 0.011 | 0.4 | 0.1 | Occasional |
| Boscia angustifolia A. Rich. | Capparaceae | 4 | 0.003 | 0.053 | 0.348 | 0.001 | 0.4 | 0.1 | Occasional |
| Boswellia papyrifera (Del.) Hochst. | Burseraceae | 3 | 0.040 | 0.094 | 0.261 | 0.015 | 0.4 | 0.1 | Occasional |
| Hyphaene thebaica (L.) Mart. | Arecaceae (Palmae) | 3 | 0.008 | 0.053 | 0.261 | 0.003 | 0.3 | 0.1 | Occasional |
| Lannea fruticosa (Hochst. ex A. Rich.) Engl. | Anacardiaceae | 3 | 0.003 | 0.053 | 0.261 | 0.001 | 0.3 | 0.1 | Occasional |
| Piliostigma reticulatum (DC.) Hochst. | Fabaceae (Cercidoideae) | 2 | 0.281 | 0.027 | 0.174 | 0.105 | 0.3 | 0.1 | Occasional |
| Prosopis chilensis (Molina) Stuntz. | Fabaceae | 2 | 0.220 | 0.040 | 0.174 | 0.082 | 0.3 | 0.1 | Occasional |
| Tamarix aphylla (L.) Karst. | Tamaricaceae | 2 | 0.142 | 0.053 | 0.174 | 0.053 | 0.3 | 0.1 | Occasional |
| Ziziphus abyssinica Hochst., A. Rich. | Rhaminaceae | 2 | 0.015 | 0.080 | 0.174 | 0.006 | 0.3 | 0.1 | Occasional |
| Borassus aethiopum (Ron Palm) Mart. | Arecaceae | 2 | 0.069 | 0.053 | 0.174 | 0.026 | 0.3 | 0.1 | Occasional |
| Capparis tomentosa Lam. | Capparaceae | 2 | 0.125 | 0.027 | 0.174 | 0.047 | 0.2 | 0.1 | Occasional |
| Combretum hartmannianum Schweinf. | Combretaceae | 2 | 0.004 | 0.053 | 0.174 | 0.002 | 0.2 | 0.1 | Occasional |
| Sterculia setigera Del. | Malvaceae (Sterculioideae) | 2 | 0.004 | 0.053 | 0.174 | 0.001 | 0.2 | 0.1 | Occasional |
| Azadirachta indica A. Juss. | Meliaceae | 2 | 0.041 | 0.027 | 0.174 | 0.015 | 0.2 | 0.1 | Rare |
| Cadaba rotundifolia Forssk. | Capparaceae | 2 | 0.002 | 0.040 | 0.174 | 0.001 | 0.2 | 0.1 | Rare |
| Calotropis procera (Aiton.) Aiton | Apocynaceae (Apocynoideae) | 2 | 0.003 | 0.027 | 0.174 | 0.001 | 0.2 | 0.1 | Rare |
| Capparis decidua (Forssk.) Edgew. | Capparaceae | 2 | 0.002 | 0.027 | 0.174 | 0.001 | 0.2 | 0.1 | Rare |
| Cassia siamea L. | Fabaceae (Caesalpinioideae) | 2 | 0.002 | 0.027 | 0.174 | 0.001 | 0.2 | 0.1 | Rare |
| Pterocarpus lucens GuilL. & Perr. | Fabaceae (Faboideae) | 1 | 0.076 | 0.040 | 0.087 | 0.029 | 0.2 | 0.1 | Rare |
| Tamarindus indica L. | Fabaceae (Detarioideae) | 1 | 0.102 | 0.013 | 0.087 | 0.038 | 0.1 | 0.01 | Rare |
| Albizia aylmeri Hutch | Fabaceae (Mimosoideae) | 1 | 0.040 | 0.027 | 0.087 | 0.015 | 0.1 | 0.01 | Rare |
| Combretum lamprocarpum Diels. | Combretaceae | 1 | 0.025 | 0.013 | 0.087 | 0.010 | 0.1 | 0.01 | Rare |
| Erythrina abyssinica DC. | Fabaceae | 1 | 0.006 | 0.013 | 0.087 | 0.002 | 0.1 | 0.01 | Rare |
| Grewia mollis Juss. | Malvaceae (Grewioideae) | 1 | 0.001 | 0.013 | 0.087 | 0.000 | 0.1 | 0.01 | Rare |
| Grewia tenax (Forsk.) Fiori. | Malvaceae (Grewioideae) | 1 | 0.000 | 0.013 | 0.087 | 0.000 | 0.1 | 0.01 | Rare |
Importance Value Index (IVI) of tree species in Alain Forest, indicating the relative ecological dominance, commonness, and rarity of species.
F, Frequency; D, Dominance; RDO, Relative dominance; RD, relative density; RF, relative frequency; IVI, Importance values index.
3.3 Distribution of tree diversity among land cover classes and altitudinal gradients
3.3.1 Tree species diversity across the land cover classes
The ANOVA results show how land cover affects tree richness, evident by the values of Shannon and Simpson’s indices in the different classes (Figure 4). Shannon index varied significantly accross LC classes (F3,732 = 7.31, p < 0.001) and the post hoc comparisons using Tukey’s test further show the variation with lowest means in G (0.202 ± 0.022), followed by S (0.252 ± 0.018), D (0.338 ± 0.029), and W (0.517 ± 0.091). Particularly, there is a significant difference between W and G, while some overlaps exist between S and D (Figure 4A).
FIGURE 4
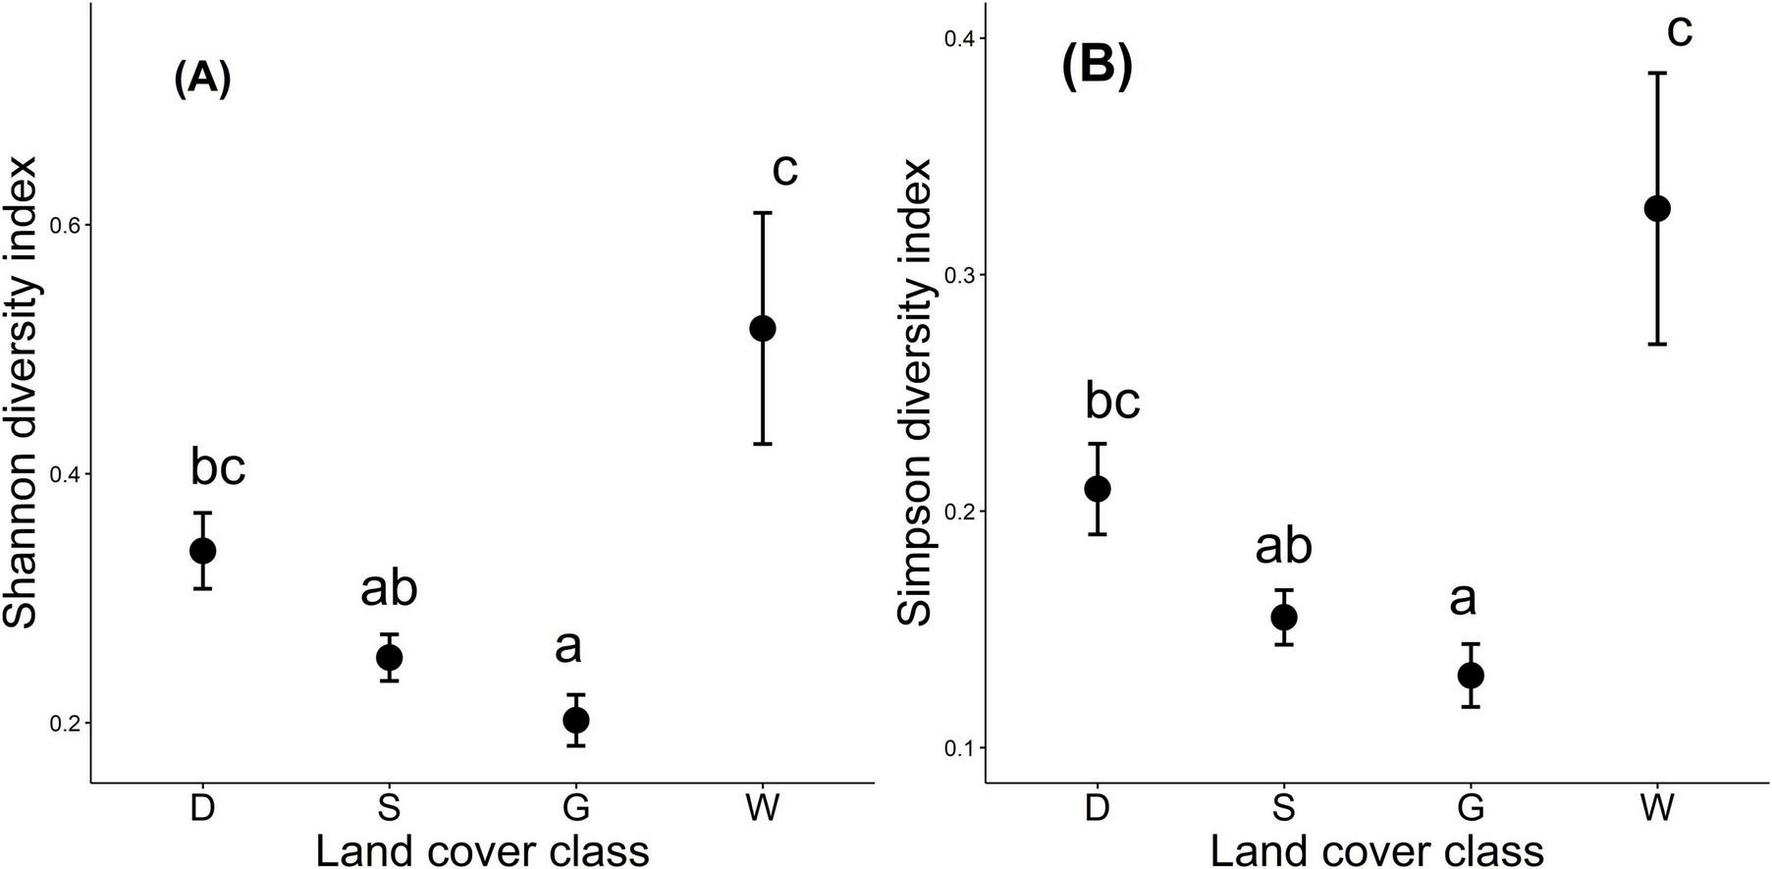
Variation in tree diversity indices across different LC classes (Dense tree cover (D), Sparse tree cover (S), Grasslands (G), and Wetlands (W). Points represent means of (A) Shannon and (B) Simpson diversity indices, while vertical lines indicate standard deviations. Different letters above the points (a, b, c) denote statistically significant differences among LC classes based on Tukey-adjusted comparisons (p < 0.05).
Similarly, the ANOVA test shows a significant LC effect on Simpson diversity index values (F3,732 = 6.83, p < 0.001) as they varied significantly across the LC classes. Post hoc analysis further shows different means differed among the LC classes, with the W class pics the highest mean (0.328 ± 0.057), followed by the D (0.209 ± 0.018), which is significantly higher than G (0.131 ± 0.014), but not significantly different from S (0.155 ± 0.011). The G class had the lowest Simpson index values (Figure 4B).
3.3.2 Tree species diversity along altitudinal gradients
The correlation analysis indicates a significant negative correlation between tree diversity and altitude. Figure 5A indicates a significant negative correlation (R = -0.33, p < 0.001) between the Shannon diversity index and AGs, suggesting that as altitude increases, there is a tendency for tree diversity to decrease. Similarly, Figure 5B shows a significant negative correlation (-0.30, p < 0.001) between the Simpson diversity index and AGs, indicating a similar trend of decreasing tree diversity with an increase in elevation. The negative links further highlight the importance of considering altitude as a key factor influencing species composition in ecosystems with clear elevation gradients.
FIGURE 5
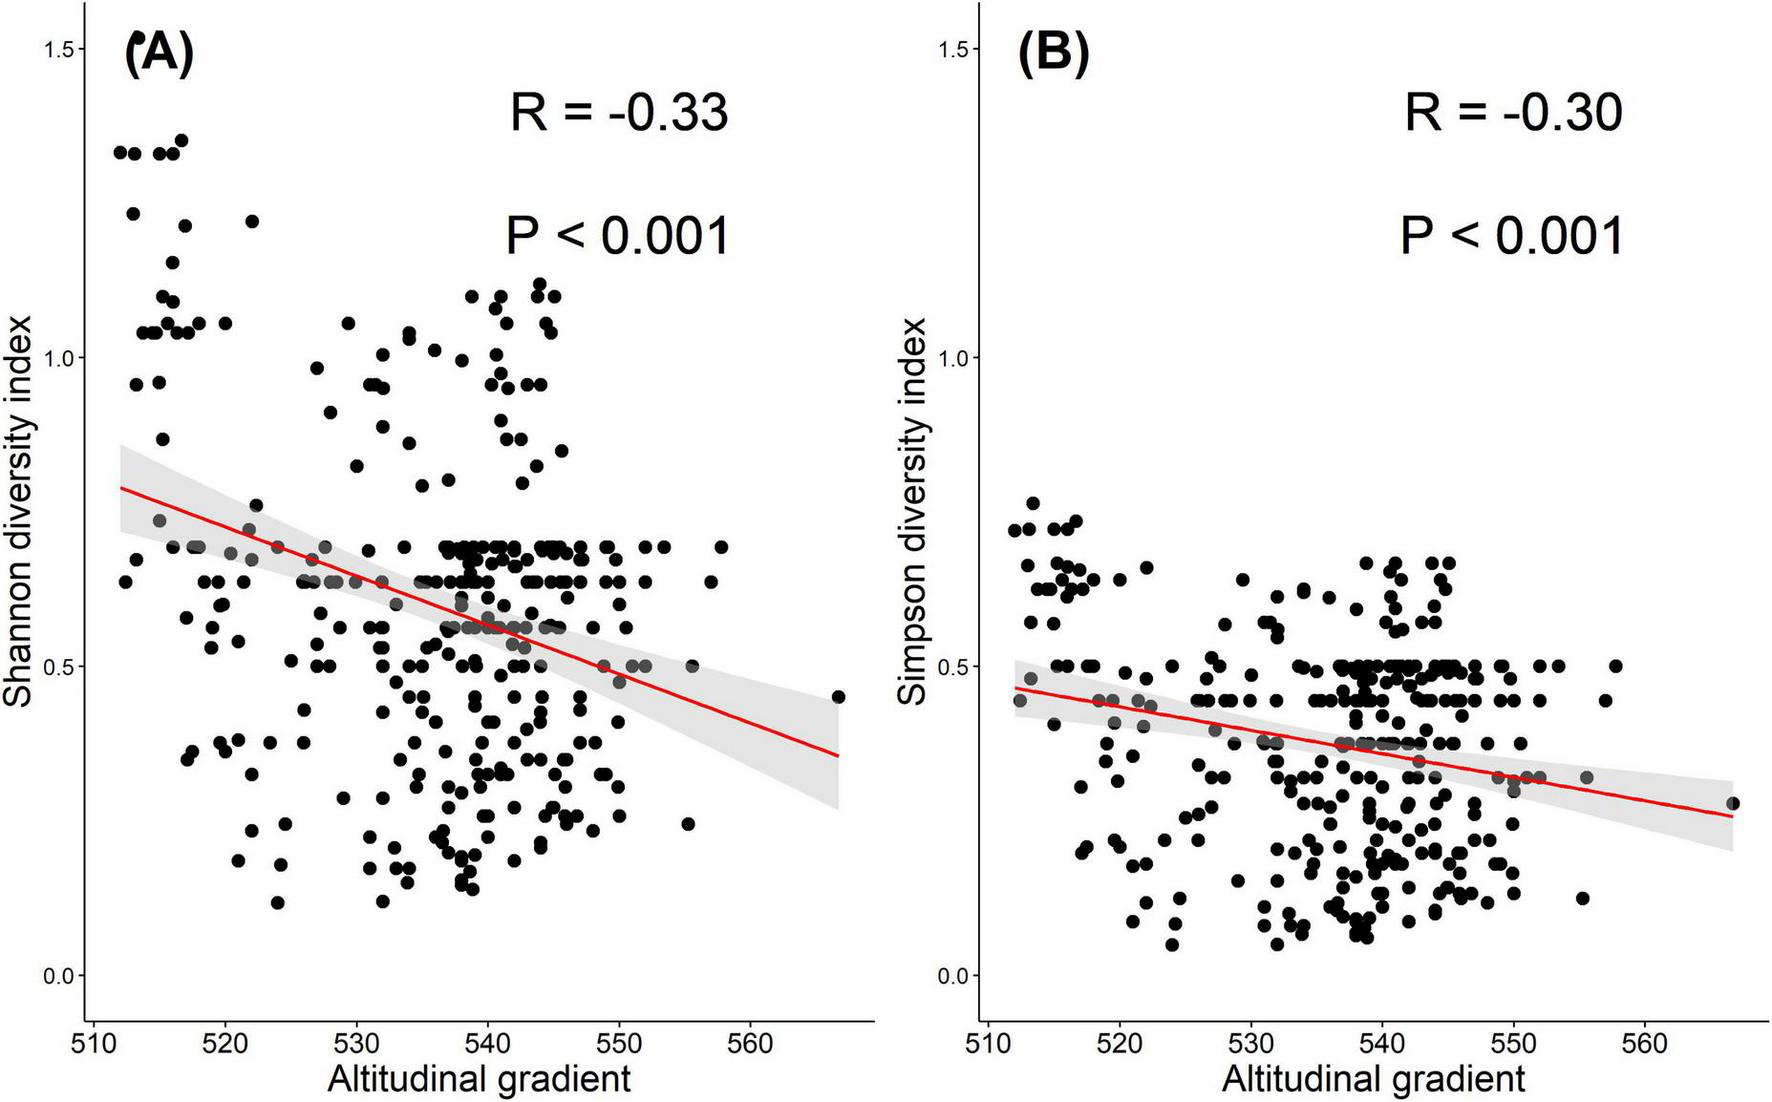
Relationship between the AGs and tree diversity based on two indices: (A) Shannon and (B) Simpson. Both indices show a significant negative correlation with altitude (R = –0.33 and –0.30, respectively; P < 0.001), indicating a decline in tree diversity with increasing elevation. The red lines represent linear regression fits, with shaded areas indicating 95% confidence intervals.
3.4 Patterns of stand structure across land cover classes and altitudinal gradients
3.4.1 Stand structure over land cover classes
The ANOVA outcomes show a significant difference in tree structure (tree density and height) along the LC classes (Figure 6). There was a significant difference in tree density among the LC classes G, W, D, and S (F3, 732 = 16.51, p < 0.001). Comparatively, post hoc comparisons using Tukey’s method revealed that class G has a significantly lower mean tree density (54.5 ± 5.73) compared to classes S (98.1 ± 4.62) and D (112.1 ± 7.46), which are not significantly different from each other, and the W class (77.9 ± 23.26) was not substantially different from either G or S. Accordingly, LC classes with the highest tree densities were S and D, followed by W, and lastly G (Figure 6A).
FIGURE 6
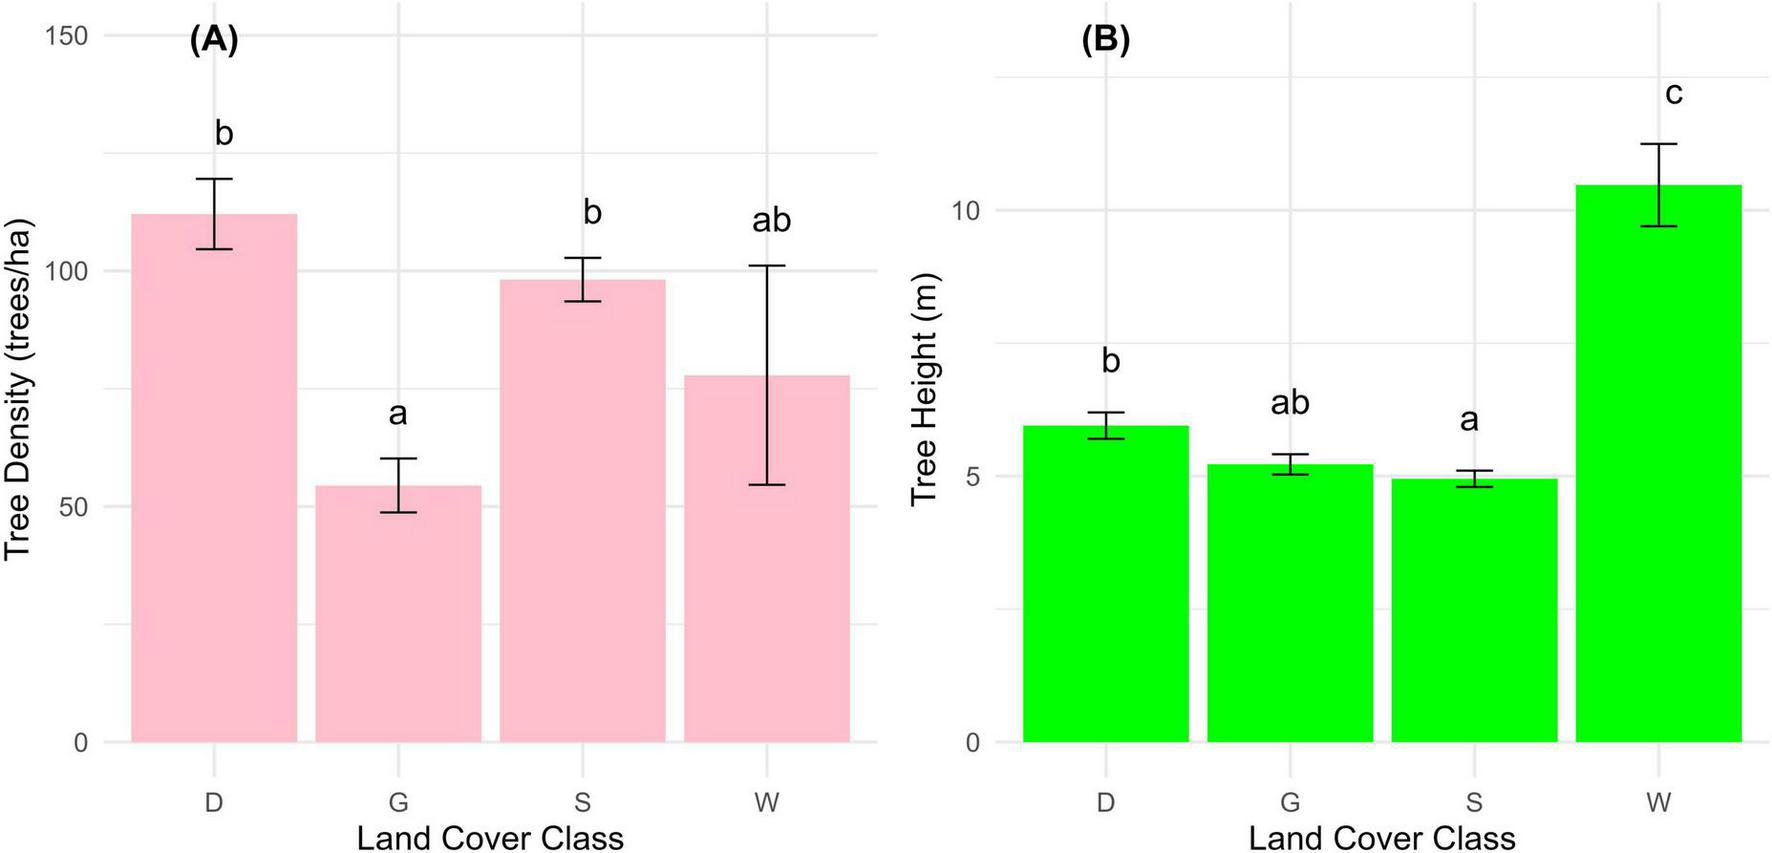
Differences in tree structural attributes across different LC classes: (A) tree density and (B) tree height. LC classes include Dense tree cover (D), Sparse tree cover (S), Grasslands (G), and Wetlands (W). Error bars represent standard errors around the means. Different letters (a,b,c) indicate statistically significant differences among classes (P < 0.05) based on post hoc comparisons.
Similarly, on the flip side, there was a significant difference in tree height among the LC classes (F3, 732 = 18.93, p < 0.001). Relatively, post hoc comparisons via Tukey’s method indicated the W class has the tallest trees (10.47 ± 0.774), significantly taller than classes D (5.95 ± 0.248), G (5.22 ± 0.191), and S (4.95 ± 0.154. Thus, there was a distinct relationship between tree height and LC classes, with class W showing the tallest trees, followed by the D, G, and S (Figure 6B). The significant differences in tree density and height among these classes underscore the variability in tree structure across different LC types in Alain forest.
3.4.2 Stand structure along altitudinal gradients
The research findings indicated a weak negative correlation between tree structure (height and density) and altitude based on Figure 7. The correlation between tree height and altitude revealed a modest but significant inverse relationship (R = –0.106, P < 0.003) in the research site; as altitude increases, tree height tends to decrease slightly (Figure 7A). Likewise, the correlation between tree density and altitude (Figure 7B) shows a weak negative correlation, as indicated by Pearson’s correlation coefficient of –0.048. However, the p-value of 0.185 indicates that this correlation is not statistically significant, with a 95% confidence interval ranging from –0.1207 to 0.0235.
FIGURE 7
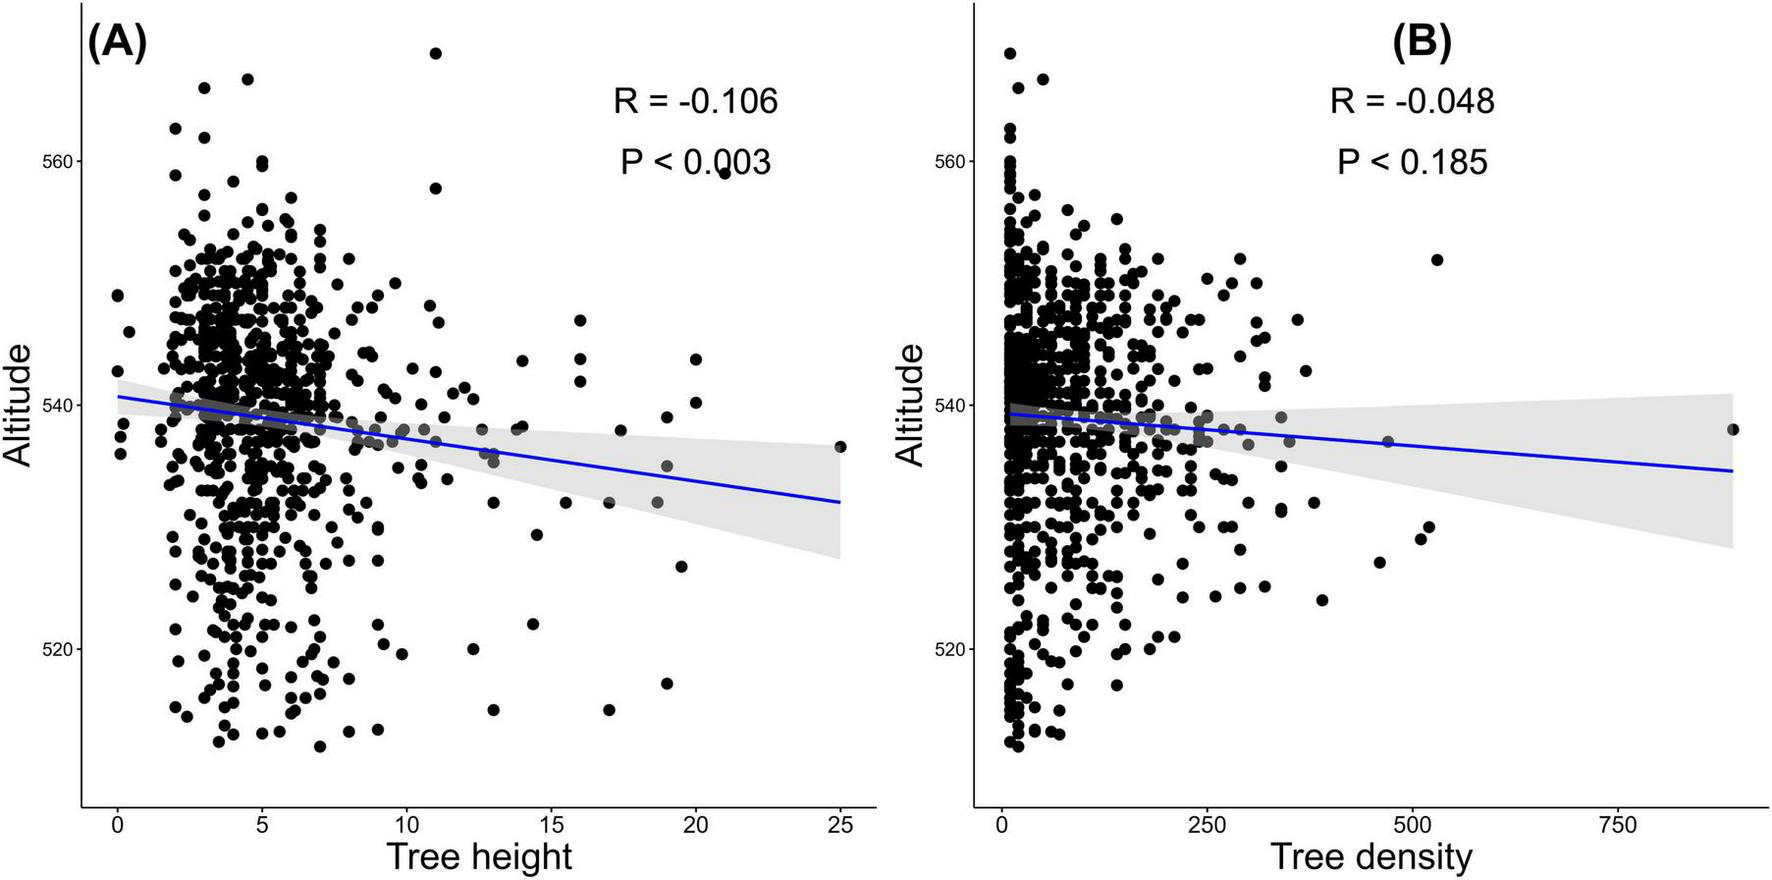
Correlation between tree structure and altitudinal gradient: (A) tree height exhibits a weak but significant negative correlation with altitude (R = –0.106, P < 0.003); (B) tree density shows no significant correlation with altitude (R = –0.048, P < 0.185).
3.5 Multivariate insights into tree diversity and structure
Figure 8 presents the patterns in tree traits across the four land cover classes. The first two principal components accounted for 66.9% of the total variance (PC1 explaining 44.6% and PC2 22.3%). PC1 was largely associated with biodiversity indices, with both Shannon and Simpson diversity loading strongly and positively. PC2 captured variation in tree density and altitude, with altitude loading positively and tree density loading negatively, while tree height had a moderate influence on both axes.
FIGURE 8
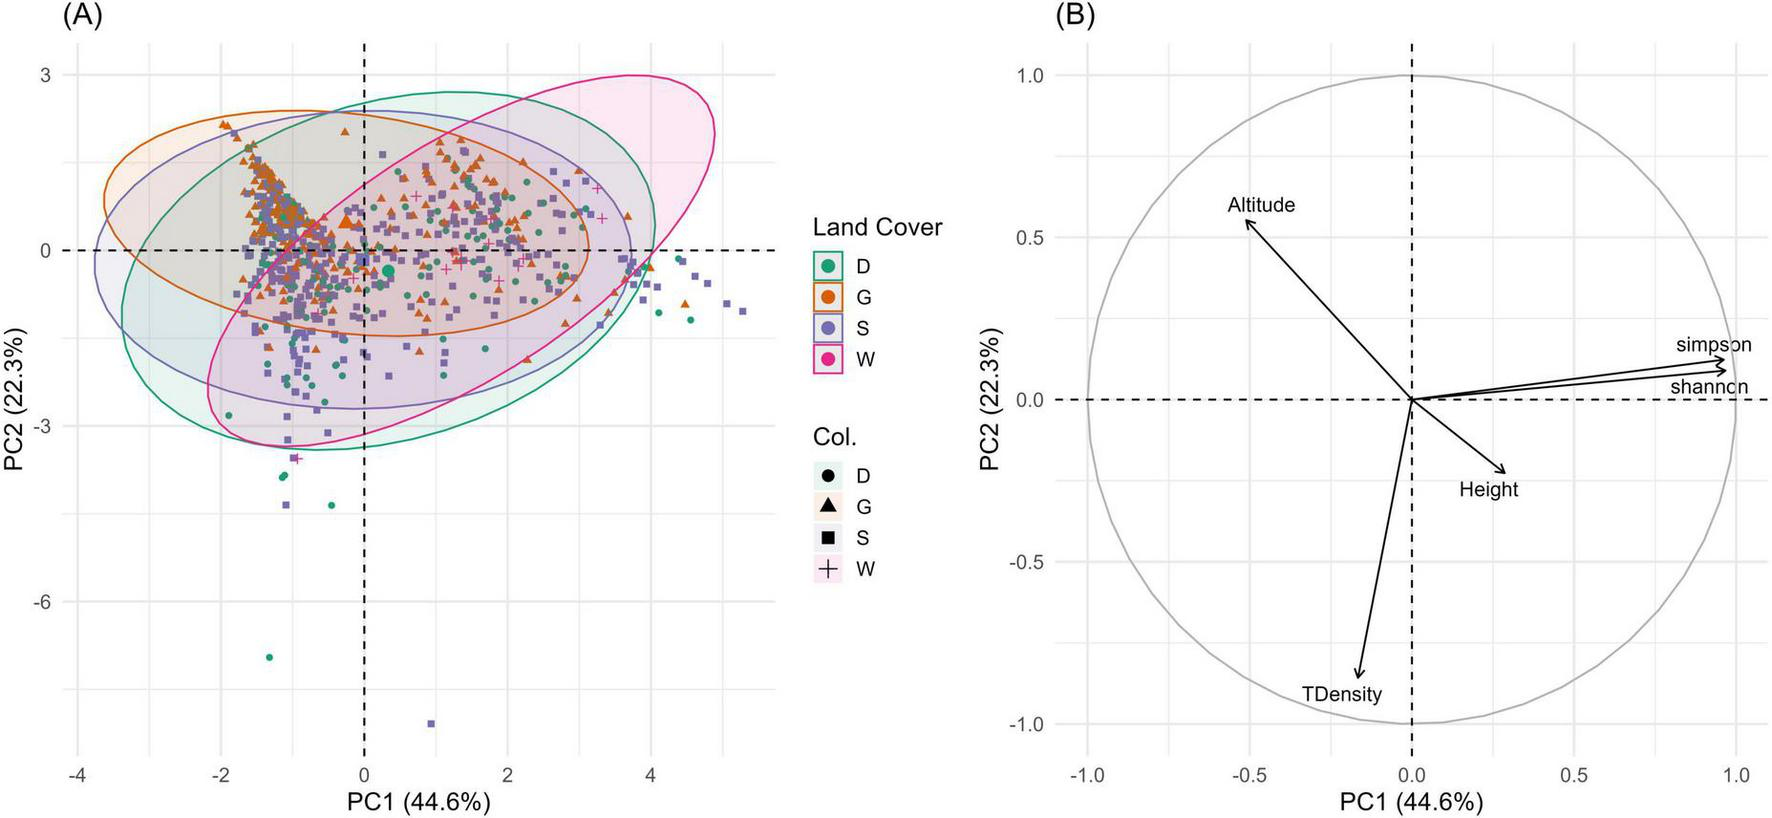
Principal Component Analysis (PCA) of tree diversity and structural attributes across land cover classes. (A) PCA based on standardized values of tree height, tree density, Shannon and Simpson diversity indices, and altitude. Points represent plots colored by land cover class (Dense Trees, Sparse Trees, Grasslands, and Wetlands), with ellipses indicating 95% confidence intervals. (B) PCA variable plot showing the contribution of each variable to the principal components (PC1 and PC2), highlighting correlations among ecological attributes.
The individuals’ plot (Figure 8A) showed partial clustering among LC classes. The W and G were more clearly separated in PCA space, suggesting distinct structural and compositional profiles. In contrast, D and S classes showed some overlap, though differences in distribution still imply ecological differentiation. The variable plot (Figure 8B) indicated strong associations of biodiversity metrics with PC1, while structural and topographic variables aligned along PC2.
4 Discussion
4.1 Influences of land cover classes and altitudinal gradients on research site features
The distinct LC classes and AGs in Figure 2 were influential in characterizing the stand attributes within the research site, providing valuable insights into the spatial composition of vegetation types. The delineation of LC classes not only enhances the understanding of the ecosystem’s tree structure but also contributes significantly to assessing ecological dynamics within the research site (Nunes et al., 2022; Darem et al., 2023). These classes are similar to the USGS land use and land cover classification system, which categorizes forest land into dense trees, sparse trees, and other classes based on the density and type of vegetation (Gomarasca, 2009). These results highlight the strong relationship between LC classes and AGs, as the distribution of vegetation and LC types is heavily influenced by the changes in elevation and associated environmental factors, zones similar to the findings by Zhu et al. (2019).
Figure 3 and the list of tree species in Table 1 illustrate the presence of a diverse range of species, each contributing to the ecosystem’s complexity, highlighting the significance of the Alain Forest Area as a refuge for biodiversity conservation in Sudan. This diversity not only supports a multitude of plant and animal species but also plays a vital role in maintaining ecosystem stability and resilience (Cleland, 2011). According to Durmaz et al. (2024), the enrichment of an ecosystem comes with an increase in the variety of species, and when the diversity of plant species per unit area rises, it generates more complex environments, ensuring stability. Similarly, it is thought that diverse forests can be more productive than species-poor ones and deliver numerous goods and services for sustainability (Dupont-Leduc et al., 2024).
The IVI and dominance results (Table 1) further underscore the variation in species composition and structural importance across LC types. Acacia mellifera’s dominance across D, S, and G classes reflects its ecological plasticity and adaptability to varying moisture and soil conditions. Its high frequency and abundance make it a key species for ecosystem functionality, particularly in these semi-arid environments. Similarly, Adansonia digitata, though less frequent, achieved high IVI values due to its substantial basal area, indicating its significance in biomass contribution and ecological services such as carbon storage. The limited diversity in W areas and the prominence of Ziziphus spina-christi and Acacia nilotica suggest environmental filtering under wetter conditions, where only flood-tolerant or water-demanding species thrive. These findings align with studies reporting reduced species richness in saturated soils compared to upland sites (Sallam et al., 2023). Differences in dominance patterns between LC classes highlight the importance of LC heterogeneity in shaping plant community structure.
4.2 The effect of land cover classes and altitudinal gradients on tree diversity
4.2.1 The influence of land cover classes on tree richness
Figure 4 highlights the significant influence of LC classes on the patterns of tree diversity within the Alain forest area, as LC played a vital role in determining species richness. Studies (e.g., Chen et al., 2015; Gholizadeh et al., 2020) have also reported that species richness increases with an increase in thickness and greenness, which suggests that greener and more vegetated LC cover classes tend to harbor greater tree species diversity. The high values of Shannon and Simpson indices in W class indicate a more even distribution of tree species (Daly et al., 2018). This composition is attributed to the availability of water, which facilitates the cohabitation of diverse plant species (Madonsela et al., 2021; Fundisi et al., 2022).
Contrarywise, the smaller values of Shannon and Simpson indices in the G class signify a less even distribution and potential dominance by a few adapted species (Daly et al., 2018). This is due to the biotic and abiotic disturbances (i.e., grazing and fire) in this class, which threaten the diversity and heterogeneity of these ecosystems. Other studies (e.g., Behera et al., 2023; Gadallah et al., 2021; Mohammed et al., 2021b) have attributed the distinct impacts of different LC classes on tree diversity patterns to various factors, such as resource availability, disturbance regimes, and species interactions. These findings also align with the statement drawn by Kudas et al. (2024) and Nagendra (2002), on the perception that the Simpson index is more sensitive to the presence of common LC types, as opposed to the Shannon index, which is more responsive to rare cover types.
4.2.2 Effect of altitudinal gradients on the tree diversity
The observed trend of significant negative correlations between Shannon and Simpson’s indices and altitude in Figure 5 is attributed to numerous factors associated with higher elevations, such as harsh environmental conditions, limited habitat availability, and specific ecological factors that influence plant establishment and survival (Sekar et al., 2024). Construing from findings reported by Coomes and Allen (2007) and Wang et al. (2023), at higher altitudes, plants face challenges related to temperature extremes, increased exposure to wind and solar radiation, and reduced availability of essential resources like water and nutrients. Another factor reported by Zhu et al. (2019), which affirms the decline of suitable habitat with increasing elevation and consequently leads to a reduction in tree richness, as fewer species can thrive in the limited suitable areas. These outcomes are consistent with previous studies that have documented a decline in plant diversity along altitudinal gradients in different geographical regions (Shimono et al., 2010; Bhat et al., 2020; Abrha et al., 2023; Wang et al., 2023). Thus, the presence of fewer but highly specialized tree species, resilient and adapted to harsh environmental conditions, can generate micro-environmental variations that influence species survival and distribution.
4.3 Effect of land cover classes and altitudinal gradients on stand structure
4.3.1 Effect of land cover classes on the patterns of stand structure
The ANOVA result in Figure 6 shows the influence and substantial differences in these structural attributes among the LC classes, where environmental factors, such as wind, water availability, nutrient availability, and soil conditions, have played a key role in stand structure across different LC classes within Alain forest area. The pattern of tree density (Figure 6A) describes this inducement of different LC types on stand distribution at the research site, which aligns with Attua and Pabi (2013) findings in the northern forest-savanna ecotone of Ghana, who found significant differences in tree densities across different sites, with savanna tree species being more abundant than forest species. This research reported the mean tree densities ranging from 127 ± 15 to 164 ± 12 trees per hectare, which is slightly higher than Alain forest. Another study in Rwanda revealed that savannas supported substantial tree populations with median densities of 64 and 100 trees per hectare, which is to some extent similar to this result (Mugabowindekwe et al., 2023).
Further, the distinct pattern of tree height (Figure 6B) as the tallness in W and D classes is driven by the availability of water and soil types in class W and tree competition in class D. For instance, a study conducted in the Miombo woodlands of Tanzania found that tree height was positively correlated with soil moisture content, with the tallest trees occurring in areas with higher water availability (Giliba et al., 2011). Similarly, research in the Cerrado savanna of Brazil discovered that tree height was significantly greater in riparian zones and gallery forests compared to upland areas, attributed to the increased water availability and nutrient-rich soils in the former (Colli et al., 2020). Also, recent findings in the West African savanna ecosystem showed significant influences of land cover types on tree height (Taonda et al., 2024), with the tallest trees found in the wetland and dense woodland classes, while the grassland and sparse woodland classes had shorter trees.
4.3.2 Effect of altitudinal gradients on the pattern tree structure
The observed pattern of decreasing tree height with increasing altitude in Figure 7A aligns with findings from various savanna ecosystems worldwide. For example, research conducted in the Serengeti-Mara savanna ecosystem of East Africa revealed a significant negative correlation between tree height and elevation (Lupala et al., 2014). Another study attributed this pattern to the harsher environmental conditions, such as lower temperatures, reduced precipitation, and increased exposure to wind, encountered at higher altitudes (Shirima et al., 2011). Likewise, a study in the Zambezian savanna woodlands of Mozambique found that tree height decreased significantly with increasing elevation (Chidumayo, 2014). The authors suggested that this trend might be driven by the combined effects of lower temperatures, shorter growing seasons, and increased risk of frost damage at higher elevations. Furthermore, in the Western Ghats of India, a study on tropical dry forests showed a significant decline in tree height along altitudinal gradients, with the tallest trees found at lower levels and a gradual decrease in height with increasing height (Krishnamurthy et al., 2010). This pattern was also attributed to the climatic factors and changes in soil nutrient availability along the altitudinal gradient. These findings from diverse savanna ecosystems support the vital influence of AGs on tree height. Additionally, other factors like changes in species composition, competition dynamics, and physiological adaptations of trees may also contribute to the observed patterns (Colli et al., 2020; de Souza et al., 2023). Hence, the observed weak negative correlation between tree height and altitude is driven by similar mechanisms, such as changes in temperature, water availability, soil conditions, and exposure to other stresses
On the other hand, the weak negative correlation between tree density and AGs in Figure 7B, is similar to many findings in savanna ecosystems, where elevations have been found to influence tree density. In the Miombo woodlands of Tanzania, Shirima et al. (2011) reported a decrease in tree density from 1,200 trees/ha at lower altitudes to 800 trees/ha at higher altitudes. Similarly, research in Brazil found a decrease in tree density from 1,500 trees/ha at lower altitudes to 1,000 trees/ha at higher altitudes, while this trend was not statistically significant (Oliveira-Filho et al., 2008). In Mozambique, there was a significant reduction in tree density from 1,800 trees/ha at lower elevations to 1,200 trees/ha at higher elevations (Chidumayo, 2014). Though, a research in the Andean montane forests of Peru revealed a more complex relationship, with tree density initially increasing from 600 trees/ha at lower elevations to 900 trees/ha at mid-elevations, and then decreasing to 400 trees/ha at higher (Malizia et al., 2020). Hence, the varying degrees of influence and patterns observed across different ecosystems suggest the complexity of the relationship between tree density and AGs in Alain forest, which similary driven by a combination of factors, including changes in temperature, precipitation, resource availability, and exposure to environmental stresses.
4.4 Integrated structural and compositional responses to land cover and altitudinal gradients
The PCA in Figure 8 displays how tree features vary significantly across different LC types and AGs in Alain forest area. The W class showed the highest diversity values and taller trees, which line up with the direction of Shannon and Simpson indices along PC1. This informs that these areas likely offer more stable, moisture-rich conditions that support a wider range of species and larger individual trees. The G class, in contrast, was more associated with lower diversity and lower tree density, reflecting more open environments with higher exposure and possibly more frequent disturbance (e.g., grazing and fire). D and S classes shared overlapping PCA space, but showed differentiation in structural variables. Dense tree areas, while variable, tended to associate with higher tree density and moderate diversity, indicating more stable or mature woodland stands. S class areas were more dispersed, possibly reflecting more heterogeneous conditions or disturbance regimes that lead to patchier distributions and lower overall tree height and density. The strong influence of elevation on PC2 emphasizes its role in shaping ecological gradients across the ecosystem. Higher altitude areas are meant to offer different microclimatic conditions and soil types, which, in turn, influence species composition and structural features.
Overall, the observed variations in tree species diversity and structural attributes across LC classes and altitudinal gradients highlight the ecological complexity of Alain forest as one of Sudanese savanna woodlands. These findings offer important implications for land-use planning and policy development. For instance, the higher diversity and tree density in D and W classes suggest that these areas serve as biodiversity hotspots and should be prioritized in conservation zoning efforts. Conversely, the comparatively low diversity and structure in G areas may reflect anthropogenic pressure, stressing their suitability for targeted restoration interventions. Furthermore, the significant relationships between land cover, altitude, and tree diversity support the development of spatially explicit management plans that incorporate ecological gradients. Therefore, by integrating tree diversity monitoring into national forest inventories and land-use frameworks, policymakers can promote more sustainable forest management, enhance climate resilience, and protect ecosystem services critical to food security and land health. These insights provide a scientific basis for aligning conservation strategies with local ecological patterns, enabling more adaptive and effective policy actions in Sudan’s savanna regions.
5 Conclusion and recommendations
The comprehensive analyses of the Alain forest area in Sudan’s savanna ecosystem provided valuable insights into the complex relationships between land cover classes, altitudinal gradients, tree diversity, and stand structure that show its integrity and resilience to these harsh conditions. The findings underscore the different levels of influence of LC heterogeneity on tree richness patterns, with the W class exhibiting the highest diversity and the G class displaying the lowest. This highlights the influence of soil conditions and availability of water in W class, which facilitates the cohabitation of diverse trees, and conversely, the presence of disturbances that drives less tree composition in G.
There was a significant negative correlation between tree diversity and altitude; as elevation increases, tree diversity tends to decrease. This pattern is attributed mainly to harsher environmental conditions, soil erosion for seed banks, limited habitat availability, and specific ecological factors that influence plant establishment and survival at higher altitudes.
Land cover classes have a distinct impact on tree stand structure, particularly tree density and height, where the sparse and D classes had the highest tree densities, while the W class harbored the tallest trees. These patterns are also attributed to species competition and other environmental factors, such as water availability and soil conditions, on tree structure within Alain forest.
These findings show the need for action to enhance the resiliency and conservation of Alain forest area and other Sudan savanna ecosystems in the face of ongoing environmental challenges and contribute to the achievement of the SDGs. Implementing targeted management strategies that consider the unique characteristics of different land cover classes to maintain and promote tree diversity, contributing to SDG 15 and climate change mitigation through carbon sequestration.
Nevertheless, one of our study limitations is that our sample size is relatively small compared to other studies, which might not represent the real diversity among the classes. Future studies might consider a bigger sample size and a smaller spacing in land cover classes that have lower tree density. Secondly, our study hasn’t investigated diversity-structure interactions; hence, further research on the complex interactions between vegetation structure, diversity, and environmental factors in Sudan’s savanna ecosystems will be crucial to curb these gaps, including to elucidate and advance scientific knowledge for sustainable management. Developing consistent and robust ecosystem-wide databases through comprehensive biophysical assessments and adoption of long-term ecological monitoring programs will safeguard the planning and management strategies of the forest ecosystems.
Statements
Data availability statement
The raw data supporting the conclusions of this article will be made available by the authors, without undue reservation.
Author contributions
NG: Writing – original draft, Writing – review & editing, Conceptualization, Data curation, Formal Analysis, Funding acquisition, Methodology, Project administration, Resources, Software, Validation, Visualization. ZG: Supervision, Validation, Visualization, Writing – review & editing, Conceptualization. VO: Supervision, Validation, Visualization, Writing – review & editing. AO: Formal Analysis, Writing – review and editing. AA: Writing – review & editing. AH: Writing – review & editing. AS: Conceptualization, Supervision, Validation, Visualization, Writing – review & editing.
Funding
The author(s) declare that financial support was received for the research and/or publication of this article. This work was funded by the Partnership for Applied Skills in Sciences, Engineering and Technology-Regional Scholarship and Innovation Fund (PASET-Rsif) and Carnegie Corporation of New York.
Acknowledgments
We extend our sincere gratitude to the National Forest Corporation of Sudan, particularly the headquarters in Khartoum and the North Kordofan Office, for their invaluable support during this research. Special thanks go to our colleagues Tarig Aziz, Jameel Allah Gumaa, Elyass Daak, and Khatir Tebin for their assistance and collaboration in the field. We also appreciate Alain Forest’s guards for their help during data collection. Furthermore, we express our deep appreciation to the PASET-RSIF for their financial support, which has been instrumental in facilitating this research at the African Center of Excellence on Climate Change, Biodiversity, and Sustainable Agriculture, University Félix Houphouët-Boigny, Côte d’Ivoire.
Conflict of interest
The authors declare that the research was conducted in the absence of any commercial or financial relationships that could be construed as a potential conflict of interest.
Generative AI statement
The authors declare that no Generative AI was used in the creation of this manuscript.
Publisher’s note
All claims expressed in this article are solely those of the authors and do not necessarily represent those of their affiliated organizations, or those of the publisher, the editors and the reviewers. Any product that may be evaluated in this article, or claim that may be made by its manufacturer, is not guaranteed or endorsed by the publisher.
Supplementary material
The Supplementary Material for this article can be found online at: https://www.frontiersin.org/articles/10.3389/ffgc.2025.1581188/full#supplementary-material
References
1
Abrha H. Dodiomon S. Ongoma V. Birhane E. Manaye A. (2023). Assessing structure, species diversity, and carbon stocks across altitudinal gradients in Hugumbrda Grat-kahsu forest, Tigray, Ethiopia: Implications for ecosystem service management.Forest Sci. Technol.2067–77. 10.1080/21580103.2023.2296012
2
Adam I. A. A. Adam Y. O. Olumeh D. E. Mithöfer D. (2024). Livelihood strategies, baobab income and income inequality: Evidence from Kordofan and Blue Nile, Sudan.Forest Pol. Econ.158:103116. 10.1016/j.forpol.2023.103116
3
Arora N. K. Mishra I. (2024). Life on land: Progress, outcomes and future directions to achieve the SDG targets.Environ. Sustain.7369–375. 10.1007/s42398-024-00330-y
4
Attua E. M. Pabi O. (2013). Tree species composition, richness and diversity in the northern forest-savanna ecotone of Ghana.J. Appl. Biosci.695437–5448. 10.4314/jab.v69i0.95069
5
Barreras A. Alanís de la Rosa J. A. Mayorga R. Cuenca R. Moreno-G C. Godínez C. et al (2023). Spatial predictions of tree density and tree height across Mexico forests using ensemble learning and forest inventory data.Ecol. Evol.131–14. 10.1002/ece3.10090
6
Behera M. C. Sahoo U. K. Mohanty T. L. Prus P. Smuleac L. Pascalau R. (2023). Species composition and diversity of plants along human-induced disturbances in tropical moist sal forests of Eastern Ghats, India.Forests14:1931. 10.3390/f14101931
7
Bhat J. A. Kumar M. Negi A. K. Todaria N. P. Malik Z. A. Pala N. A. et al (2020). Species diversity of woody vegetation along altitudinal gradient of the Western Himalayas.Glob. Ecol. Conserv.24:e01302. 10.1016/j.gecco.2020.e01302
8
Bradter U. Kunin W. E. Altringham J. D. Thom T. J. Benton T. G. (2013). Identifying appropriate spatial scales of predictors in species distribution models with the random forest algorithm.Methods Ecol. Evol.4167–174. 10.1111/j.2041-210x.2012.00253.x
9
Chen J. Chen J. Liao A. Cao X. Chen L. Chen X. et al (2015). Global land cover mapping at 30 m resolution: A POK-based operational approach.ISPRS J. Photogram. Remote Sens.1037–27. 10.1016/j.isprsjprs.2014.09.002
10
Chidumayo E. N. (2014). Estimating tree biomass and changes in root biomass following clear-cutting of Brachystegia-Julbernardia (miombo) woodland in central Zambia.Environ. Conserv.4154–63. 10.1017/S0376892913000210
11
Cleland E. E. (2011). Biodiversity and ecosystem stability. The nature education. Available online at: https://www.nature.com/scitable/knowledge/library/biodiversity-and-ecosystem-stability-17059965/(accessed March 26, 2024).
12
Colli G. R. Vieira C. R. Dianese J. C. (2020). Biodiversity and conservation of the Cerrado: Recent advances and old challenges.Biodivers. Conserv.291465–1475. 10.1007/s10531-020-01967-x
13
Coomes D. A. Allen R. B. (2007). Effects of size, competition and altitude on tree growth.J. Ecol.951084–1097. 10.1111/j.1365-2745.2007.01280.x
14
Daly A. J. Baetens J. M. De Baets B. (2018). Ecological diversity: Measuring the unmeasurable.Mathematics6:119. 10.3390/math6070119
15
Darbyshire I. Kordofani M. Farag I. Candiga R. Pickering H. (2015). The plants of Sudan and south Sudan – an annotated checklist. Royal botanic gardens.Kew: Kew Publishing.
16
Darem A. A. Alhashmi A. A. Almadani A. M. Alanazi A. K. Sutantra G. A. (2023). Development of a map for land use and land cover classification of the Northern Border Region using remote sensing and GIS.Egypt. J. Remote Sens. Space Sci.26341–350. 10.1016/j.ejrs.2023.04.005
17
de Souza P. C. G. da Luz Lima Mota S. Corrêa R. S. Pinto J. R. R. (2023). How substrate type and elevation drive woody communities and influence species ecological strategies in the Brazilian savanna at local scale.Ecol. Res.38815–827. 10.1111/1440-1703.12413
18
Department of Economic and Social Affairs Forests (2017). United Nations strategic plan for forests 2017–2030 and quadrennial programme of work of the United Nations forum on forests for the period 2017–2020.New York, NY: United Nations.
19
Dudley N. Eufemia L. Fleckenstein M. Periago M. E. Petersen I. Timmers J. F. (2020). Grasslands and savannahs in the UN decade on ecosystem restoration.Restor. Ecol.281313–1317. 10.1111/rec.13272
20
Dupont-Leduc L. Power H. Fortin M. Schneider R. (2024). Climate interacts with the trait structure of tree communities to influence forest productivity.J. Ecol.1121758–1773. 10.1111/1365-2745.14350
21
Durmaz A. Torunoðlu E. I Aydın B. Aytar E. C. (2024). Need for biodiversity conservation and conservation strategies.Biodivers. Loss Assess. Ecosyst. Protect.5167–187. 10.4018/979-8-3693-3330-3.ch010
22
Elzaki E. A. E. Gang T. (2019). Financial Viability and Sustainable Management of Acacia nilotica plantations in el AIN natural forest reserve, Sudan.Small Scale For.18323–333. 10.1007/s11842-019-09421-9
23
Environmental Systems Research Institute [ESRI] (2016). ArcMap. Available online at: https://desktop.arcgis.com/en/arcmap/(accessed April 05, 2024).
24
Fundisi E. Tesfamichael S. G. Ahmed F. (2022). Remote sensing of savanna woody species diversity: A systematic review of data types and assessment methods.PLoS One17:e0278529. 10.1371/journal.pone.0278529
25
Gadallah N. A. H. Hano A. I. A. Diab E. Omer G. (2021). Characterizing conservative and protective needs of the aridland forests of Sudan.J. For. Res.322365–2373. 10.1007/s11676-021-01341-9
26
Gadallah N. A. H. Taha I. S. A. Hano A. I. A. Siddig A. A. H. Bo H. J. (2022). Integrated approach for assessment and monitoring of forests conditions in the Drylands of Sudan.Arid Ecosyst.12142–153. 10.1134/S2079096122020032
27
Gamreldin E. Hamadalnel M. (2024). Spatial and temporal analysis of maximum and minimum temperature trends in northern Sudan during (1990-2019).J. Geosci. Environ. Protect.12266–288. 10.4236/gep.2024.125015
28
Gholizadeh H. Gamon J. A. Helzer C. J. Cavender-Bares J. (2020). Multi-temporal assessment of grassland α−and β−diversity using hyperspectral imaging.Ecol. Appl.30:e02145. 10.1002/eap.2145
29
Giliba R. A. Boon E. K. Kayombo C. J. Musamba E. B. Kashindye A. M. Shayo P. F. (2011). Species composition, richness and diversity in Miombo woodland of Bereku Forest Reserve, Tanzania.J. Biodivers.21–7. 10.1080/09766901.2011.11884724
30
Gomarasca M. A. (2009). Land use/land cover classification systems.Basics Geomat.2561–598. 10.1007/s12518-010-0029-6
31
Hasoba A. M. Siddig A. A. Yagoub Y. E. (2020). Exploring tree diversity and stand structure of savanna woodlands in southeastern Sudan.J. Arid Land12609–617. 10.1007/s40333-020-0076-8
32
He F. Hu X.-S. (2005). Hubbell’s fundamental biodiversity parameter and the Simpson diversity index.Ecol. Lett.8386–390. 10.1111/j.1461-0248.2005.00729.x
33
Higgins M. A. Asner G. P. Perez E. Elespuru N. Tuomisto H. Ruokolainen K. et al (2012). Use of landsat and SRTM data to detect broad-scale biodiversity patterns in Northwestern Amazonia.Remote Sens.42401–2418. 10.3390/rs4082401
34
Husch B. Beers T. Kershaw J. (2003). Forest mensuration.Hoboken, NJ: John willey & Sons. Inc.
35
Immitzer M. Atzberger C. (2023). Tree species diversity mapping—success stories and possible ways forward.Remote Sens.15:3074. 10.3390/rs15123074
36
Kangas A. Maltamo M. (2006). Forest inventory: Methodology and applications.Dordrecht: Springer Science & Business Media.
37
Kiernan D. (2023). Natural resources biometrics.New York, NY: SUNY College of Environmental Science and Forestry.
38
Koller A. Kunz M. Perles-Garcia M. D. von Oheimb G. (2025). 3D structural complexity of forest stands is determined by the magnitude of inner and outer crown structural attributes of individual trees.Agric. For. Meteorol.363:110424. 10.1016/j.agrformet.2025.110424
39
Krishnamurthy Y. Prakasha H. Nanda A. Krishnappa M. Dattaraja H. Suresh H. (2010). Vegetation structure and floristic composition of a tropical dry deciduous forest in Bhadra Wildlife Sanctuary, Karnataka, India.Trop. Ecol.51:235.
40
Kudas D. Wnêk A. Hudecová L’ Fencik R. (2024). Spatial diversity changes in land use and land cover mix in central European capitals and their commuting zones from 2006 to 2018.Sustainability16:2224. 10.3390/su16062224
41
Liu X. Liang S. Ma H. Li B. Zhang Y. Li Y. et al (2024). Landsat-observed changes in forest cover and attribution analysis over Northern China from 1996-2020.GIScience Remote Sens.61:2300214. 10.1080/15481603.2023.2300214
42
Lupala Z. Lusambo L. Ngaga Y. (2014). Management, growth, and carbon storage in miombo woodlands of Tanzania.Int. J. For. Res.20141–11. 10.1155/2014/629317
43
Madonsela S. Cho M. A. Ramoelo A. Mutanga O. (2021). Investigating the relationship between tree species diversity and landsat-8 spectral heterogeneity across multiple phenological stages.Remote Sens.13:2467. 10.3390/rs13132467
44
Magnussen S. McRoberts R. E. Breidenbach J. Nord-Larsen T. Ståhl G. Fehrmann L. et al (2020). Comparison of estimators of variance for forest inventories with systematic sampling-results from artificial populations.For. Ecosyst.71–19. 10.1186/s40663-020-00223-6
45
Malizia A. Blundo C. Carilla J. Acosta O. O. Cuesta F. Duque A. et al (2020). Elevation and latitude drives structure and tree species composition in Andean forests: Results from a large-scale plot network.PLoS One15:e0231553. 10.1371/journal.pone.0231553
46
Mallegowda P. Rengaian G. Krishnan J. Niphadkar M. (2015). Assessing habitat quality of forest-corridors through NDVI analysis in dry tropical forests of south India: Implications for conservation.Remote Sens.71619–1639. 10.3390/rs70201619
47
Marchant R. (2010). Understanding complexity in savannas: Climate, biodiversity and people.Curr. Opin. Environ. Sustain.2101–108. 10.1016/j.cosust.2010.03.001
48
Masolele R. N. Marcos D. De Sy V. Abu I.-O. Verbesselt J. Reiche J. et al (2024). Mapping the diversity of land uses following deforestation across Africa.Sci. Rep.14:1681. 10.1038/s41598-024-52138-9
49
Mohammed E. M. I. H E. A. M. Ndakidemi P. A. Treydte A. C. (2021a). Anthropogenic pressure on tree species diversity, composition, and growth of balanites aegyptiaca in dinder biosphere reserve, Sudan.Plants10:483. 10.3390/plants10030483
50
Mohammed E. M. I. Hassan T. T. Idris E. A. Abdel-Magid T. D. (2021b). Tree population structure, diversity, regeneration status, and potential disturbances in Abu Gadaf natural reserved forest, Sudan.Environ. Challenges5:100366. 10.1016/j.envc.2021.100366
51
Mtsetfwa F. P. Kruger L. McCleery R. A. (2023). Climate change decouples dominant tree species in African savannas.Sci. Rep.13:7619. 10.1038/s41598-023-34550-9
52
Mugabowindekwe M. Brandt M. Chave J. Reiner F. Skole D. L. Kariryaa A. et al (2023). Nation-wide mapping of tree-level aboveground carbon stocks in Rwanda.Nat. Clim. Change1391–97. 10.1038/s41558-022-01544-w
53
Nagendra H. (2002). Opposite trends in response for the Shannon and Simpson indices of landscape diversity.Appl. Geogr.22175–186. 10.1016/S0143-6228(02)00002-4
54
Negi V. S. Pandey A. Singh A. Bahukhandi A. Pharswan D. S. Gaira K. S. et al (2024). Elevation gradients alter vegetation attributes in mountain ecosystems of eastern Himalaya, India.Front. For. Glob. Change7:1381488. 10.3389/ffgc.2024.1381488
55
Nunes C. A. Berenguer E. França F. Ferreira J. Lees A. C. Louzada J. et al (2022). Linking land-use and land-cover transitions to their ecological impact in the Amazon.Proc. Natl. Acad. Sci. U.S.A.119e2202310119. 10.1073/pnas.2202310119
56
Oliveira R. Farias H. Perdiz R. Scudeller V. Barbosa R. I. (2017). Structure and tree species composition in different habitats of savanna used by indigenous people in the Northern Brazilian Amazon.Biodivers. Data J.5:e20044. 10.3897/BDJ.5.e20044
57
Oliveira-Filho A. T. Curi N. Vilela E. A. Carvalho D. A. (2008). Effects of canopy gaps, topography, and soils on the distribution of woody species in a central Brazilian deciduous dry forest 1.Biotropica30362–375. 10.1111/j.1744-7429.1998.tb00071.x
58
Pillay R. Watson J. E. Goetz S. J. Hansen A. J. Jantz P. A. Ramírez-Delgado J. P. et al (2024). The Kunming-Montreal global biodiversity framework needs headline indicators that can actually monitor forest integrity.Environ. Res. Ecol.3:043001. 10.1088/2752-664x/ad7961
59
R Core Team (2024). R: A language and environment for statistical computing.Vienna: R Core Team.
60
Raman R. Manalil S. Dénes D. L. Nedungadi P. (2024). The role of forestry sciences in combating climate change and advancing sustainable development goals.Front. For. Glob. Change7:9667. 10.3389/ffgc.2024.1409667
61
Salih A. A. M. Ganawa E. T. Elmahl A. A. (2017). Spectral mixture analysis (SMA) and change vector analysis (CVA) methods for monitoring and mapping land degradation/desertification in arid and semiarid areas (Sudan), using Landsat imagery.Egypt. J. Remote Sens. Space Sci.20S21–S29. 10.1016/j.ejrs.2016.12.008
62
Sallam H. Alzain M. N. Abuzaid A. O. Loutfy N. Badry M. O. Osman A. K. et al (2023). Wild plant diversity and soil characteristics of desert roadside vegetation in the eastern desert.Diversity15:874. 10.3390/d15070874
63
Sekar K. C. Thapliyal N. Pandey A. Joshi B. Mukherjee S. Bhojak P. et al (2024). Plant species diversity and density patterns along altitude gradient covering high-altitude alpine regions of west Himalaya, India.Geol. Ecol. Landsc.8559–573. 10.1016/j.tfp.2022.100196
64
Shannon C. E. (1948). A mathematical theory of communication.Bell Syst. Tech. J.27379–423. 10.1002/j.1538-7305.1948.tb01338.x
65
Shimono A. Zhou H. Shen H. Hirota M. Ohtsuka T. Tang Y. (2010). Patterns of plant diversity at high altitudes on the Qinghai-Tibetan Plateau.J. Plant Ecol.31–7. 10.1093/jpe/rtq002
66
Shirima D. D. Munishi P. K. Lewis S. L. Burgess N. D. Marshall A. R. Balmford A. et al (2011). Carbon storage, structure and composition of miombo woodlands in Tanzania’s Eastern Arc Mountains.Afr. J. Ecol.49332–342. 10.1111/j.1365-2028.2011.01269.x
67
Siddig A. A. (2019). Why is biodiversity data-deficiency an ongoing conservation dilemma in Africa?J. Nat. Conserv.50:125719. 10.1016/j.jnc.2019.125719
68
Simpson E. H. (1949). Measurement of diversity.Nature163688–688. 10.1038/163688a0
69
Suggitt A. J. Yeong K. L. Lindhe A. Agama A. Hamer K. C. Reynolds G. et al (2021). Testing the effectiveness of the forest integrity assessment: A field-based tool for estimating the condition of tropical forest.Ecol. Solut. Evid.2:e12067. 10.1002/2688-8319.12067
70
Taha M. E. Bekele T. Siddig F. (2014). Participatory management of natural community forests: The case of El Ain natural forest management project, North Kordofan, Sudan.Am. J. Res. Commun.2212–233.
71
Taonda A. Zerbo I. N’Guessan A. E. Traoré I. C. E. Justin N. Thiombiano A. (2024). Effects of land use and climate on the diversity and population structure in natural stands of Detarium microcarpum Guill. & Perr.(Fabaceae) in Burkina Faso (West Africa).Glob. Ecol. Conserv.51:e02909. 10.1016/j.gecco.2024.e02909
72
Tripathi H. Woollen E. S. Carvalho M. Parr C. L. Ryan C. M. (2021). Agricultural expansion in African savannas: Effects on diversity and composition of trees and mammals.Biodivers. Conserv.303279–3297. 10.1007/s10531-021-02249-w
73
Van Vuuren D. P. Carter T. R. (2014). Integrated approach for assessment and monitoring of forests conditions in the Drylands of Sudan.Clim. Change122415–429.
74
Wang X. Peng S. Sun J. Li M. Wang L. Li Y. et al (2023). Altitude restricts the restoration of community composition and vegetation coverage of quarries on the Qinghai-Tibet Plateau.Ecol. Indic.151:110339. 10.1016/j.ecolind.2023.110339
75
Zandbergen P. (2008). Applications of shuttle radar topography mission elevation data.Geogr. Compass21404–1431. 10.1111/j.1749-8198.2008.00154.x
76
Zhu Z.-X. Nizamani M. M. Sahu S. K. Kunasingam A. Wang H.-F. (2019). Tree abundance, richness, and phylogenetic diversity along an elevation gradient in the tropical forest of Diaoluo Mountain in Hainan, China.Acta Oecol.101:103481. 10.1016/j.actao.2019.103481
Summary
Keywords
ecosystem, forests, savanna woodlands, sustainable development, Sudan
Citation
Gadallah NAH, Gone Bi ZB, Ongoma V, Omer A, Ahmed AEM, Hasoba AMM and Siddig AAH (2025) Investigating tree diversity and structure across varying land cover classes and altitudes in the savanna woodlands of Sudan. Front. For. Glob. Change 8:1581188. doi: 10.3389/ffgc.2025.1581188
Received
21 February 2025
Accepted
19 May 2025
Published
09 June 2025
Volume
8 - 2025
Edited by
Yashwant Singh Rawat, Federal Technical and Vocational Education and Training Institute (FTVETI), Ethiopia
Reviewed by
Nuria Torrescano, El Colegio de la Frontera Sur, Mexico
Panna Chandra Nath, Assam University, India
Bwalya Mutale, Kapasa Makasa Univeristy, Zambia
Updates
Copyright
© 2025 Gadallah, Gone Bi, Ongoma, Omer, Ahmed, Hasoba and Siddig.
This is an open-access article distributed under the terms of the Creative Commons Attribution License (CC BY). The use, distribution or reproduction in other forums is permitted, provided the original author(s) and the copyright owner(s) are credited and that the original publication in this journal is cited, in accordance with accepted academic practice. No use, distribution or reproduction is permitted which does not comply with these terms.
*Correspondence: Nasradeen A. H. Gadallah, naouofk@gmail.com
Disclaimer
All claims expressed in this article are solely those of the authors and do not necessarily represent those of their affiliated organizations, or those of the publisher, the editors and the reviewers. Any product that may be evaluated in this article or claim that may be made by its manufacturer is not guaranteed or endorsed by the publisher.