 Pierluigi Bonello
 Anna O. Conrad
 Dušan Sadiković
 Mateusz Liziniewicz
 Michelle Cleary
- 1Department of Plant Pathology, The Ohio State University, Columbus, OH, United States
- 2USDA Forest Service, Northern Research Station, Delaware, OH, United States
- 3Southern Swedish Forest Research Centre, Swedish University of Agricultural Sciences, Alnarp, Sweden
- 4Skogforsk – The Forest Research Institute, Ekebo, Sweden
Non-destructive tree phenotyping for resistance screening and early, presymptomatic disease detection figures prominently among the most important practical limitations inherent in forest health management. The need for point-of-care tools is particularly acute for managing diseases caused by non-native pathogens, often resulting in difficult-to-control biological invasions. One such case is represented by ash dieback in Europe, caused by Hymenoscyphus fraxineus, which has led Sweden to red-list its main host, European ash (Fraxinus excelsior). We evaluated the use of near-infrared (NIR) spectroscopy and machine learning for detection of presymptomatic infections by H. fraxineus and identification of disease-resistance European ash accessions. Here, we show that presymptomatic infected trees can be distinguished from pathogen-free trees with a testing error rate of 0.161 in a controlled inoculation experiment. We also show that the same approach can be used to identify disease-resistant European ash accessions based on data from two independent, multiyear clonal trials, with a testing error rate of 0.155. These results confirm that NIR spectroscopy combined with machine learning is sensitive enough for early disease detection and resistance screening in this system. This is consistent with prior findings in other tree pathosystems and suggests that this approach could be developed into an operational tool to facilitate the management of biological invasions of forest environments by non-native pathogens, including habitat restoration with resistant germplasm.
1 Introduction
Invasions by non-native forest pathogens and insect pests (PIPs), often introduced into new environments through global commerce pathways, have dramatically altered forests worldwide, sometimes with enormous economic and ecological impacts (Gandhi and Herms, 2010; Hicke et al., 2012; Loo, 2009; Lovett et al., 2016). By killing trees on landscape scales, PIP invasions lead to major losses in fundamental ecosystem services, such as weather and climate regulation, carbon fixation, and provisioning of abundant clean water, wildlife habitat, and fiber, with major impacts on environmental sustainability and human wellbeing. All these changes also have major disruptive effects on human communities that are directly forest-dependent for their economies.
One important contemporary PIP example is Hymenoscyphus fraxineus (T. Kowalski) Baral, Queloz and Hosoya, the causal agent of ash dieback (ADB) in Europe. This ascomycete fungus originates from East Asia, where it has co-evolved with, and is a benign associate of, native Fraxinus species, including F. mandshurica Rupr. (Cleary et al., 2016; Baral and Bemmann, 2014; Gross et al., 2014; Zheng and Zhuang, 2014). In Europe, however, the fungus is an aggressive pathogen of several species of Fraxinus, especially European ash (F. excelsior L.). Leaves and rachises are the primary habitats of H. fraxineus and the tissues in which the fungus completes its lifecycle, usually after leaf fall (Cleary et al., 2013; Gross et al., 2014). The fungus forms apothecia on rachises resting on the forest floor; during several weeks in the summer, apothecia release wind-disseminated ascospores that then invade through numerous infection points on leaves of young shoots, then spreading to petiole, rachis, and eventually woody tissue, causing necrosis and dieback of twigs, branches and stems. Young trees can be girdled and die quickly, while on older trees, the cumulative effect of multiple and annual infections leads to progressive tree decline and eventual tree death.
In Sweden, ash is considered an important, “noble” broadleaved tree species (Götmark et al., 2005). Despite its minority status relative to other tree species, it has regional importance, making up a large component of local broadleaved forest landscapes (Cleary et al., 2017), and is valued for its economic, cultural, and ecological importance. Nearly a decade after the first report of H. fraxineus in Sweden, the population of European ash had seriously declined to the point where it became a red-listed species (Hultberg et al., 2020). Fortunately, several studies across Europe have demonstrated large genotypic variation in susceptibility to ADB among individuals, a low level (ca. 1–2%) of natural resistance in the population, a strong genetic basis for resistance that is heritable, which suggests that considerable gain can be achieved through intensive selection and breeding (McKinney et al., 2011; Pliura et al., 2016; Pliura et al., 2011; Stener, 2013).
Recently, Hultberg et al. (2020) argued that ADB in Sweden poses a serious risk of instigating an extinction cascade due to the large number of threatened species associated with, or singularly dependent on, ash. Ash has a critical role as a keystone species, in that it provides a critical habitat for many other species and significantly contributes to the ecosystem functioning of temperate broadleaved forests (Pautasso et al., 2013; Broome and Mitchell, 2017). Breeding for disease resistance is the only sustainable, long-term strategy to reduce the risk of local extirpation of ash and its associated biodiversity. Previous studies offer evidence for quantitative disease resistance (variably referred to as tolerance in the case of ADB) (Cleary et al., 2014; Liziniewicz et al., 2022), marked by specific constitutive biochemical differences that include several key compounds, including two coumarins, fraxetin and esculetin, and several other phenolics, especially secoiridoids (Nemesio-Gorriz et al., 2020; Sambles et al., 2017).
Resistance screening currently relies on multiyear experiments to expose ash accessions to natural infection in common garden experiments or genetic trials. Typically, parent trees are identified in the field in areas of high disease pressure as survivors who display largely healthy crowns. From the time propagative material is collected from these parents to the time it is planted and monitored for resistance, 3–10 years can pass. Thus, phenotyping efforts would be greatly facilitated by non-destructive point-of-care tools to rapidly screen accessions for resistance, even before they are ever challenged with the pathogen. That is, such screening could, in theory, be applied directly on parent trees in the field, even in areas of low or no disease pressure, and extended to the offspring in the common garden for early identification of superior, i.e., disease-resistant, genotypes.
Recently, advanced phenotyping techniques based on mid-infrared spectroscopy, specifically Fourier Transform Infrared (FT-IR) spectroscopy, coupled with multivariate statistical modeling, have shown significant potential for use in the classification of individual trees that are resistant to specific pathogens (Conrad and Bonello, 2016). FT-IR spectroscopy is a type of vibrational spectroscopy that targets the region between 2,500 and 25,000 nm (4,000–400 cm−1) of the electromagnetic spectrum (Cozzolino, 2014). It measures the absorbance of organic chemical structures containing O-H, N-H, and C-H bonds (Cozzolino, 2014), which in plants are found in both primary and specialized metabolites (Martinelli et al., 2015). Thus, these methods are based on the discriminating power of chemical fingerprints, i.e., a profile based on all the chemicals present within a given sample (Conrad and Bonello, 2016). Their success is predicated on biochemical differences between resistance classes, such as those mentioned above for European ash. Indeed, we were able to demonstrate the usefulness of FT-IR-based classification for ash dieback in prior work (Villari et al., 2018), while examples from other pathosystems include coast live oak (Quercus agrifolia Née) and Phytophthora ramorum Werres et al. (sudden oak death) (Conrad et al., 2014), Norway spruce [Picea abies (L.) H. Karst.] and Heterobasidion annosum (Fr.) Bref. (annosus root and butt rot) (Mukrimin et al., 2019), and Austrian pine (Pinus nigra Arnold) and Diplodia pinea (Desm.) Kickx (Diplodia tip blight and canker) (Conrad et al., 2020b). However, while representing a considerable advancement for the rapid, non-destructive classification of trees into resistant and susceptible phenotypes, such techniques require highly specialized and expensive lab equipment and advanced technical knowledge, which is a significant obstacle to their uptake as a practical tool.
The solution is to create novel approaches that involve the use of relatively inexpensive, handheld instruments that require minimal training, allowing for point-of-care applications. In particular, Conrad et al. (2020a) demonstrated the potential of using a portable near-infrared (NIR) sensor to detect the pre-symptomatic diseased state of rice plants for early detection of infection by the fungus Rhizoctonia solani J. G. Kühn, which causes rice sheath blight, while (Fearer et al., 2022) demonstrated the feasibility of a similar approach on American beech (Fagus grandifolia Murray) trees infected with the causal agent of beech leaf disease (Ewing et al., 2019), the foliar nematode Litylenchus crenatae mccannii Handoo et al. Unlike FT-IR spectroscopy, NIR spectroscopy targets the region between 750 and 2,500 nm (13,400–4,000 cm−1) of the electromagnetic spectrum (Cozzolino, 2014), but like FT-IR, it measures organic chemical structures containing O-H, N-H, and C-H bonds (Cozzolino, 2014). Plant metabolism can be significantly altered by the presence of infectious organisms that activate plant defenses, even at a pre-symptomatic stage, i.e., before visual symptoms, and this can be detected in spectral profiles of the plants’ primary and specialized metabolites (e.g., Fearer et al., 2022; Conrad et al., 2020a). Based on the totality of this information, we hypothesized that disease-resistant and disease-susceptible trees can also be classified using NIR spectroscopy.
Therefore, the objective of this study was to test the applicability of portable NIR leaf reflectance spectroscopy as a rapid, non-destructive tool for the identification of pre-symptomatic ADB-infected trees (early detection) and the selection of ADB-resistant trees (resistance phenotyping).
2 Materials and methods
2.1 Pre-symptomatic detection of H. fraxineus
2.1.1 Plant material and inoculation
To obtain infected but asymptomatic plants, F. excelsior seedlings were inoculated under controlled conditions in accordance with the inoculation assay described by Cleary et al. (2013). The experiment was performed in purpose-built humidity enclosures consisting of a PVC-pipe frame covered with transparent plastic sheeting (Supplementary Figure S1). The humidity enclosures were placed and maintained in climate rooms at the Biotron growth facility at the Swedish University of Agricultural Sciences, Alnarp, Sweden, for the duration of the study. Fifty uninfected one-year-old F. excelsior seedlings were exposed to a natural H. fraxineus spore rain as described below and constituted the inoculated treatment. The seed originated from a single location in Southern Sweden and the seedlings were up to ~25 cm tall at the time of the experiment. In the same climate room, 50 seedlings of the same genetic origin were placed in a separate, negative control humidity enclosure, which, therefore, had no spore rain. The two humidity chambers were placed on opposite sides of the room to minimize cross-contamination between the two seedling groups (Supplementary Figure S1). The plastic sheeting was secured by clipping it to the frame all around to maintain high humidity (which favors apothecia development on rachises and sporulation). High constant relative air humidity was maintained in the plastic enclosures by using ultrasonic humidifiers (Vevor 12 Head Ultrasonic Fogger Humidifier). Environmental parameters in the Biotron room were: 24/19°C day/night temperature, with a 16 h photoperiod of 90–100 μmol m−2 s−1 light intensity (measured inside the plastic enclosures), and relative air humidity of 80–90%.
Inoculation commenced on July 4, 2023, by placing sporulating ash rachises on a mesh suspended approximately 10–20 cm above the top of the seedlings in an amount sufficient to cover the whole inoculation area (at least 100 rachises). Rachises bearing fresh and maturing H. fraxineus apothecia were collected from the base of infected trees in a nearby infected ash progeny trial. Seedling exposure to the pathogen in the chamber lasted for a month, with fresh sporulating rachises being added every week. Both infected and control plants were first acclimated under the above-mentioned conditions for several days before the baseline measurements were taken to minimize abiotic stress signaling. On Aug. 4, 2023, we collected leaflets for NIR measurements, then wiped them using 70% alcohol and stored them at −80°C until further use.
2.1.2 NIR spectral measurements
Two sets of NIR spectral measurements were acquired – baseline (pre-inoculation) and post-inoculation. Measurements on negative controls were done on the same days as inoculated plants. All spectra were acquired from the leaflet adaxial surface to maximize consistency across samples. The NIR spectra were collected using a handheld NeoSpectra Scanner (Si-Ware Systems, Menlo Park, CA, United States), with the spectral range of the instrument set between 1,365–2,550 nm (3922–7,407 cm−1). A minimum of five readings (one per leaflet) from each seedling were acquired with 3-s scans and 7-s intervals each from infected and negative control plants.
In total, 247 baseline spectra were collected before the start of the inoculation experiment on June 30, 2023 (t0), from 46 trees randomly selected from the 100 trees in the experiment. A total of 502 scans were then taken from all 50 control trees and 49 inoculated trees (one tree died due to undetermined fragility) on August 4, 2023 (t1). Only data from seedlings confirmed infected (see below) were used for downstream spectral analysis.
2.1.3 Infection verification
After the infection period and spectral measurements, all inoculated seedlings were screened for the presence of H. fraxineus. All negative control plants were also screened to verify that no cross-contamination had occurred between the two treatments. Genomic DNA was extracted from 1 to 2 leaflets (approximately 100 mg) from each plant using the DNeasy™ Plant Pro Kit (Qiagen, Valencia, California, USA) according to the manufacturer’s recommendations.
Screening was performed using H. fraxineus-specific ITS-based PCR primer pairs developed by Johansson et al. (2010). Amplifications were conducted in a 12.5 μL reaction volume, using 6.2 μL GoTaq ® G2 Green Master Mix (Promega, USA), 3.3 μL of molecular grade H2O, 0.5 μL of each 10 mM of each primer, and 2 μL of genomic DNA. PCR reactions were performed under the following conditions: 5 min of 95°C followed by 35 cycles of denaturation at 95°C for 30 s, annealing at 62°C for 30 s, and extension at 72°C for 1 min, with a final extension step at 72°C for 8 min. The PCR amplicons were separated by gel electrophoresis on 1% agarose gel stained with GelRed (Biotium, Hayward, CA, USA) and verified under UV light.
2.2 Resistance phenotyping
2.2.1 Plant material
For this part of the study, we used two sources of plant material. In 2023, plant material was selected from a clonal field trial established in 2016 in Snogeholm, Sjöbo, Sweden (55°32′46.2”N 13°42′20.7″E). The trial was comprised of 7-yr-old trees derived from a selection of genotypes from around Sweden which showed good vitality and little to no symptoms of crown dieback. In 2024, we conducted a similar assay but on plant material selected from a 28-yr-old clonal seed orchard established in 1995 in Trollehom, Svalöv, Sweden (55°56′41.1252”N 13°12′32.1192″E).
2.2.2 NIR spectral measurements
Forty-four genotypes and up to five ramets per genotype were sampled across a gradient of low susceptibility to high susceptibility based on a 6-point scale of increasing disease severity from annual surveys during the previous 5 years. Health class ratings (HCR) were assigned as follows: 1 = symptomless, 2 = light damage, <1/3 of the crown has necrotic lesions on branches; 3 = light damage, <1/3 of the crown has necrotic lesions on branches and main stem is necrotic; 4 = moderate damage, between 1/3 and 2/3 of the crown has necrotic lesions on branches and two or more necrotic lesions on stems; 5 = severely damaged, more than 2/3 of the crown has necrotic lesions on branches and stems; 6 = dead.
In total, 24 clones with low susceptibility (HCR 1–3), and 26 clones with intermediate to high susceptibility (HCR 4–5), were sampled. A minimum of five leaflets per tree were scanned for a total of 371 scans from 34 most resistant and 39 most susceptible individuals. Scans were collected on June 27 (resistant trees) and June 29 (susceptible trees), 2023, prior to the peak sporulation period for H. fraxineus in southern Sweden. The NIR spectra were collected from the adaxial surface of the leaflet using the NeoSpectra Scanner, using the same set-up as in the inoculation experiment. Spectral measurements were taken in Trolleholm on July 2, 2024, from 32 mature trees (comprising seven clones, up to 6 ramets per clone) known to be resistant. Of the seven clones that were sampled in Trolleholm, six were also planted at Snogeholm.
2.2.3 Data preprocessing and analysis
Data were preprocessed and analyzed for all experiments in the same manner. Raw NIR spectra was imported into R version 4.4.0 (RCoreTeam, 2024) for preprocessing and analysis. Raw reflectance data were visualized (R package: mdatools) (Kucheryavskiy, 2020), and outliers were identified and trimmed according to the method of Heim et al. (2018) (R packages: fda; fda.usc) (Febrero-Bande and de la Fuente, 2012; Ramsay et al., 2024). Additional outliers were visualized using boxplots at 5188 cm−1 (reflectance > 18% was removed) and 7,230 cm−1 (reflectance < 45% was removed). Following removal of outliers, the remaining spectra from each individual tree were averaged and transformed with the second derivative function (R package: mdatools; width: 15, porder: 2, dorder: 2). Transformed data were then split into training and testing sets (80% training, 20% testing) while maintaining proportions of resistant and susceptible trees in each data set (R package: caret) (Kuhn, 2024).
Principal components analysis (PCA) with scaling was used to visualize variation between groups based on second derivative transformed spectra (R packages: stats, ggfortify, ggplot2, MixOmics) (RCoreTeam, 2024; Tang et al., 2016; Wickham, 2016; Rohart et al., 2017). Sparse partial least squares discriminant analysis (sPLS-DA) with 5-fold cross-validation (CV) repeated 50 times was run to evaluate whether spectra could be used to discriminate between resistant and susceptible trees and to identify the most optimal parameters for group separation (R package: mixOmics) (Rohart et al., 2017; Le Cao et al., 2011). sPLS-DA classification performance was assessed based on the repeated CV training maximum distance balanced error rate (and the maximum distance error rate for each class of the training data set). The balanced error rate (hereafter referred to as error rate) adjusts for the number of samples in each group and is useful for unbalanced data sets (Rohart et al., 2017). The repeated CV area (mean ± standard deviation) under the receiver operating characteristic curve (area under the curve, AUC) was evaluated as well, although for supervisory analysis, like the one performed here, it can only be used as a complementary metric (Rohart et al., 2017). Additionally, the error rate of the testing set was evaluated to examine how the calibrated model performed on the testing data set.
3 Results
3.1 Pre-symptomatic detection of H. fraxineus
3.1.1 Verification of infection
Based on the analysis using species-specific ITS-based primers, all 49 surviving seedlings from the inoculation chamber were shown to be positive for the presence of H. fraxineus DNA, thereby confirming successful inoculation, while all samples taken from the control chamber proved negative for H. fraxineus DNA, confirming the lack of any cross-contamination between the two chambers (Figure 1).

Figure 1. Presymptomatic verification of infection in the Biotron experiment via PCR using H. fraxineus-specific ITS-based PCR primer pairs developed by Johansson et al. (2010). (A) Control seedlings (n = 50). (B) Inoculated seedlings (n = 49). C − = negative control, i.e., H2O; C + = positive control, i.e., H. fraxineus DNA template.
3.1.2 Classification based on pre-symptomatic infection
Spectra were averaged by tree at each scan time (Figure 2). Thirty seven of 749 spectra were identified as outliers and removed prior to averaging by tree. Clustering of trees based on time and treatment group was observed based on an unsupervised PCA (Figure 3). Pre-experimental (t0) readings clustered separately from experimental (t1) readings, particularly so for control trees.
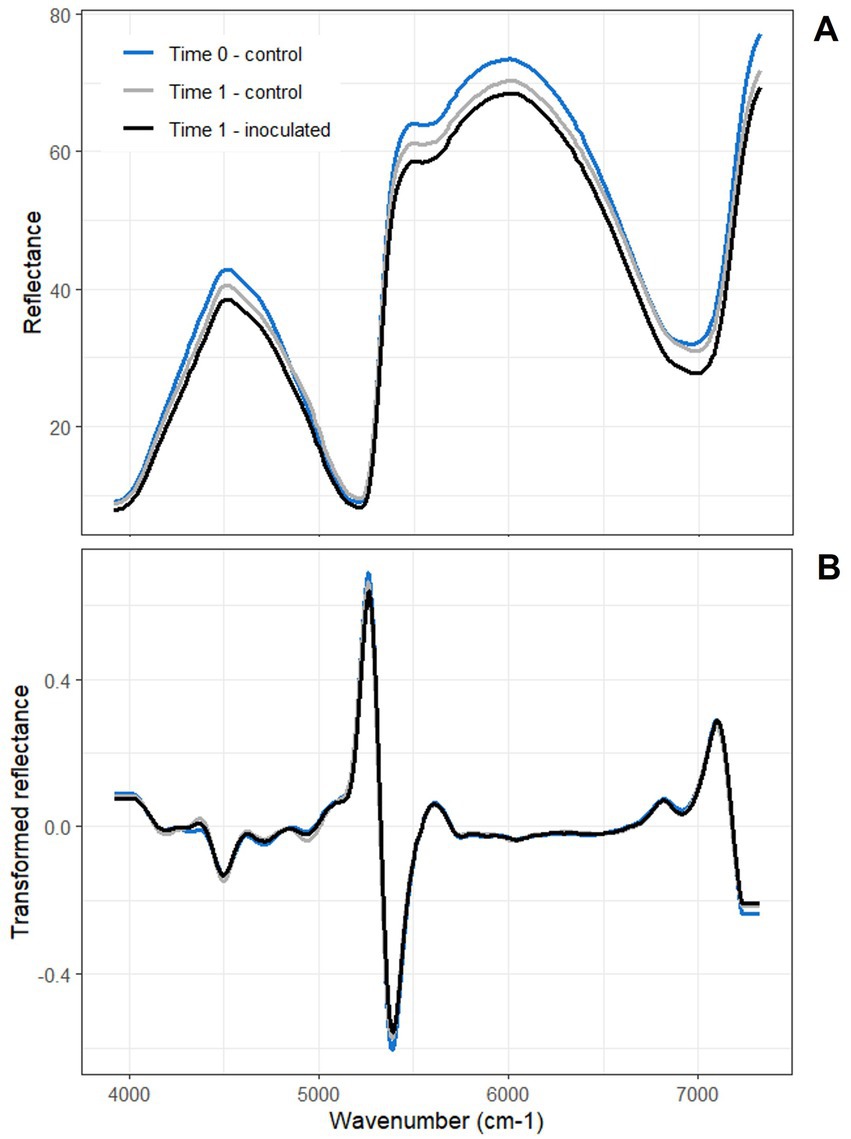
Figure 2. Biotron mean (A) raw and (B) second derivative-transformed NIR spectra from 3,922–7,325 cm−1. Color indicates time and treatment: baseline time point (Time 0) - control; first reading post-inoculation (Time 1) - control; first reading post-inoculation (Time 1) - inoculated. Some minor differentiations in reflectance and its derivative among the group means can be seen in different regions of the spectrum in both panels.
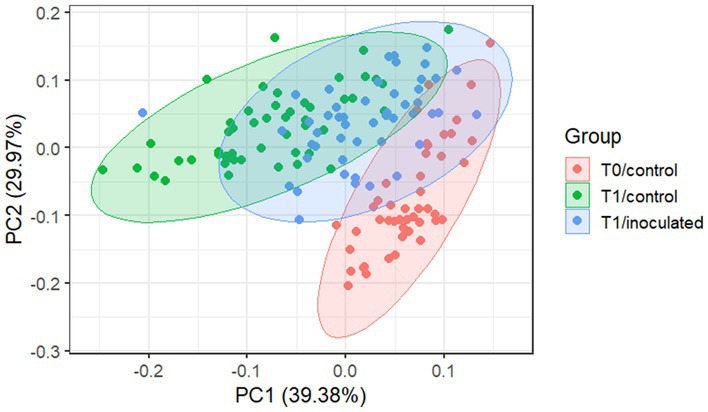
Figure 3. PCA of all biotron data. Color indicates time point (T0: baseline; T1: first reading) and treatment (control; inoculated). Clear clustering by treatment can be observed, with ~69% of the variance explained by the first two components.
The optimized sPLS-DA model of the t1 spectra contained four components with 50, 110, 6, and 150 spectral bands, respectively. The error rate at four components for the training set was 0.027 (N = 80), with an error rate of 0.021 for control and 0.034 for inoculated groups (Figure 4). The AUC was 1 for four components, although this metric can only be used as a complementary tool for evaluating classification. The error rate of the testing set was 0.161 (N = 19).
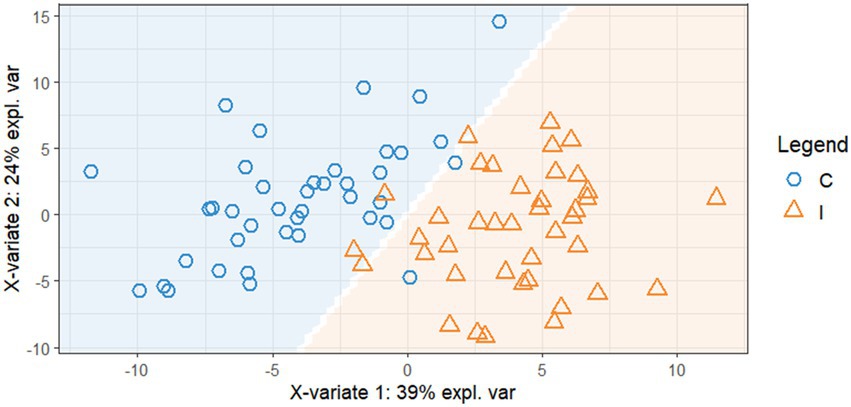
Figure 4. sPLS-DA projection of biotron first reading training data set with prediction background indicated by shading [orange (I), inoculated; blue (C), control], showing clear separation between treatments with minor overlap.
3.2 Resistance phenotyping
For the clonal material in the clonal trial in Snogeholm, 14 of 371 spectra were identified as outliers and removed prior to averaging spectra by tree (Figure 5). No obvious clustering of trees by resistance/susceptibility was observed based on an unsupervised PCA of the training data set (Supplementary Figure S2).
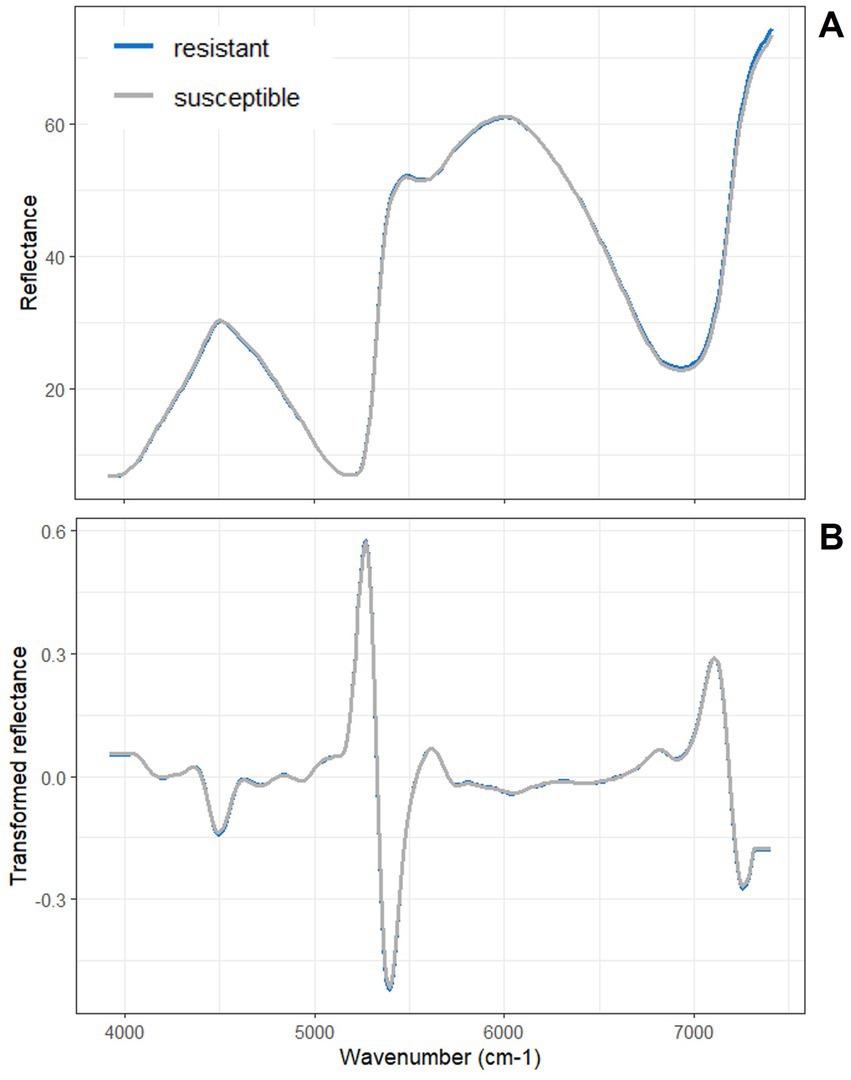
Figure 5. Snogeholm mean (A) raw and (B) second derivative transformed NIR spectra from 3,922–7,407 cm−1. No differentiations in reflectance and its derivative are evident to the naked eye between the resistant and susceptible ash group means.
The optimized sPLS-DA model contained four components with 3, 60, 2, and 11 spectral bands, respectively. The error rate of the training data set at four components was 0.146 (N = 60), with an error rate of 0.186 for resistant and 0.106 for susceptible (Supplementary Figure S3). The AUC was 0.974 for four components, although this metric can only be used as a complementary tool for evaluating classification. The error rate of the testing set was 0.155 (N = 13).
The accuracy of the model was further evaluated using the Trollehom validation data set. Of 181 spectra, nine were identified as outliers and removed prior to averaging spectra by tree. The optimized sPLS-DA model developed from the Snogeholm data set was used to predict the susceptibility of the Trolleholm trees. All Trolleholm trees were predicted as susceptible based on the Snogeholm model.
Due to the inability of the Snogeholm model to correctly classify the susceptibility of Trolleholm trees, a new model was calibrated using spectra collected from both Snogeholm and Trolleholm. All data were visualized using a PCA of second derivative transformed spectra. In the first two components, clustering of Trolleholm trees is observed (Supplementary Figure S4). The optimized sPLS-DA model based on the training data contained four components with 1, 40, 80, and 100 spectral bands, respectively. The error rate at four components for the training set was 0.123 (N = 85), with an error rate of 0.170 for susceptible and 0.077 for resistant trees (Figure 6). The AUC was 0.982 for four components, although this metric can only be used as a complementary tool for evaluating classification. The error rate of the testing set was 0.253 (N = 20). Classification of the testing data set is available in Table 1. While not all Snogeholm trees in the testing set were correctly classified, all Trolleholm trees were correctly classified in the testing set.

Figure 6. sPLS-DA projection of Snogeholm and Trolleholm combined training data set with prediction background indicated by shading (blue: resistant; orange: susceptible), showing clear separation between the treatments with minor overlap.
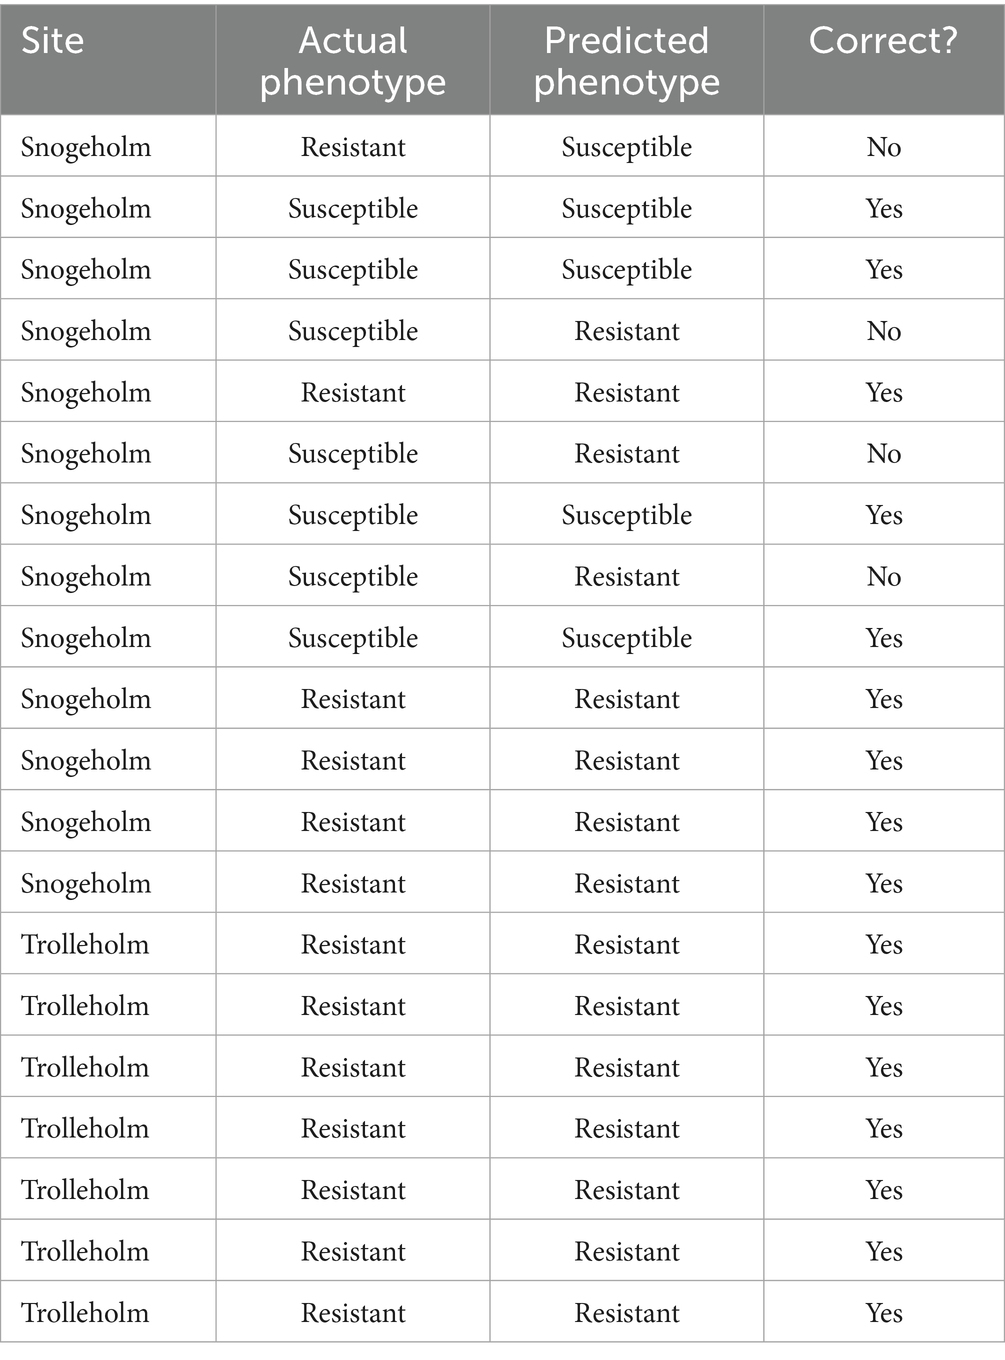
Table 1. Actual and predicted phenotypes for the Snogeholm and Trolleholm testing data set based on the model calibrated using the Snogeholm and Trolleholm training data set.
4 Discussion
In this study, we have demonstrated that point-of-care phenotyping using NIR spectroscopy of tree leaves, coupled with machine learning, is possible to detect presymptomatic infections in the ADB pathosystem, at least under controlled conditions. The results regarding phenotyping trees for resistance were also highly encouraging, with high predictive ability for the Snogeholm trial. When trees from both the Snogeholm and Trolleholm datasets were included in the model, the error rates were 0.077 and 0.170 for resistant and susceptible trees, respectively. The low error rates for susceptible trees is particularly relevant, as in any resistance screening program, it is especially important to exclude susceptible individuals. These error rates are also quite realistic, as the model predicted the phenotype correctly for 16 of 20 testing ramets between Snogeholm and Trolleholm, i.e., the overall error rate was 0.253 of the cases.
Conceptually, two fundamental, practical approaches can be used for the effective management of established forest pathogen invasions such as ADB, especially in combination: (1) surveillance/monitoring for pathogen detection and control, and (2) development of resistant hosts for restoration. To implement (1) fast, reliable, sensitive, and single tree-to-landscape scale diagnostics are necessary to prevent and/or delimit infestations to eradicate or contain them; to implement (2) rapid, reliable, and non-destructive screening for selection and breeding of resistant tree germplasm is a necessary prerequisite to restoring resilient environments in which tree-killing phytophagous insects and phytopathogens (PIPs) have become established. Although molecular methods have boosted our ability to accurately detect (and/or diagnose) PIPs earlier than was once possible (Munck and Bonello, 2018; Bonello, 2024), currently, this can be done only at a single tree level while screening for resistance is based on very time consuming, and expensive, destructive approaches that involve artificial inoculations or natural infection of test subjects. Both interventions require specialized training and extensive use of always scarce human capital to scout large areas, collect samples, and process them in the lab or in seedling trials.
Early detection of infected but asymptomatic (i.e., pre-symptomatic) plants is very important. Such trees represent a lag phase between infection and symptom expression that results in the true disease front always falling outside the margin of infection areas determined by visible symptoms (Figure 7), and furthermore, from an epidemiological perspective, they can be considered as (potentially) silent disease carriers. This confirms prior results from our program, including early detection of rice plant diseases (Conrad et al., 2020a) and, significantly, beech leaf disease (Fearer et al., 2022), another devastating forest PIP (Ewing et al., 2019). Whether our growth chamber results can be translated to biosurveillance operations under variable field environments and settings or whether such an approach could provide sufficiently advanced warning to allow for pre-emptive sanitation (i.e., elimination of silent disease carriers) remains to be determined. Moreover, implementation of such an approach would presume acceptance of the concept that, once pre-symptomatic trees are located, they would have to be destroyed in an attempt to interrupt disease transmission. Such considerations are beyond the scope of our study, but it may be worth it to investigate the applicability and acceptability of an approach that could provide much-needed early warning.
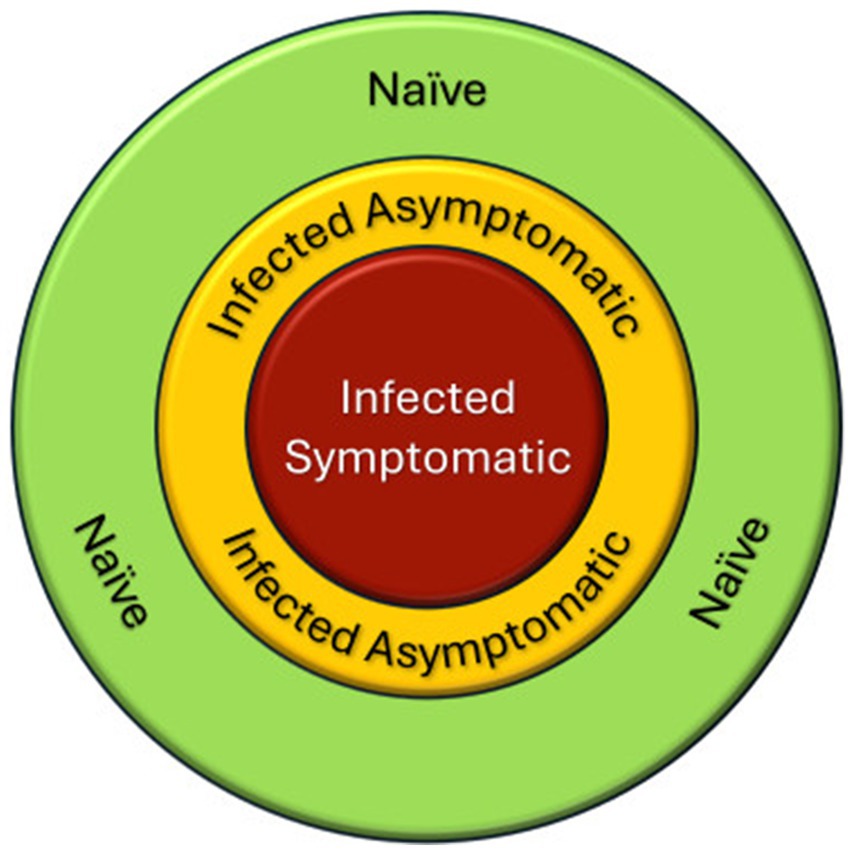
Figure 7. Schematic representation of an infection center, e.g., ADB. The visible front is delimited by symptomatic trees, but that area will be surrounded by infected and asymptomatic trees (silent disease carriers). Unless those trees are identified and managed, the infection will keep spreading to naive trees.
In the face of the ADB epidemic, “a glimmer of hope” lies in our ability to exploit the low proportion of genetic resistance to H. fraxineus exhibited by European ash (Gossner et al., 2023). Indeed, even if ADB could be detected early and transmission interrupted (or the disease eradicated in early stages of establishment in new areas), the question would remain of what to do in the aftermath of local ADB-induced tree loss, or indeed the epidemic overall. If society determines that ash ecosystem restoration is of pre-eminent importance, then developing host resistance is the ultimate solution, and such a program would need to be implemented on an operational basis as soon as possible, supported by adequate public and private resources (Showalter et al., 2018). As Scandinavia has been a hot spot of extreme mortality since the start of the ADB epidemic (George et al., 2022), there is some urgency in conserving the remaining genetic diversity in ash populations, especially considering the imminent arrival of emerald ash borer (Agrilus planipennis Fairmaire). It is a fact that the development of resistance has been shown to be feasible even in naïve systems, i.e., those between partners that lack a co-evolutionary history. Examples exist with many recent epidemics by both non-native pathogens and insect pests – to wit: sudden oak death (Conrad et al., 2019; Conrad et al., 2017; McPherson et al., 2014; Conrad et al., 2014), emerald ash borer (Stanley et al., 2022; Koch et al., 2015), rapid ʻōhi’a death (Luiz et al., 2022), and laurel wilt (Hughes et al., 2022).
While prior research has shown that biochemical analysis could, at least in principle, be used specifically to identify resistant ash (Nemesio-Gorriz et al., 2020; Sambles et al., 2017), the technology requires high levels of expertise, is logistically complex, and is prohibitively expensive in operational settings. Thus, screening for ash resistance so far has relied solely on testing individuals in common gardens by exposing them to natural infection, as in the case of our Snogeholm and Trolleholm trials (Liziniewicz et al., 2022). In this study, we clearly showed that NIR phenotyping of ash foliage can be highly effective and the tool itself is relatively inexpensive, with the caveat that we conducted our analyses in only two relatively close locations, albeit in different years. Thus, while extremely encouraging, validation of our models over larger spatial and temporal scales would be advisable before this approach can be operationalized.
Ultimately, the advantages afforded by our techniques could be extended to identifying resistant trees in advance of the epidemic front so that they can be propagated and used in breeding or directly in reforestation. Such usage would tremendously accelerate the process and allow forest managers to be much more proactive and effective in their fight against PIPs across the globe.
Data availability statement
The datasets presented in this study can be found in online repositories. The names of the repository/repositories and accession number(s) can be found at: https://datadryad.org/stash, 10.5061/dryad.s1rn8pkkn.
Author contributions
PB: Investigation, Project administration, Supervision, Writing – original draft, Writing – review & editing, Conceptualization, Formal analysis, Funding acquisition, Methodology, Validation, Visualization. AC: Formal analysis, Methodology, Validation, Visualization, Writing – original draft, Writing – review & editing. DS: Formal analysis, Writing – review & editing, Investigation. ML: Resources, Writing – review & editing. MC: Conceptualization, Investigation, Writing – review & editing, Data curation, Project administration, Resources, Supervision, Writing – original draft.
Funding
The author(s) declare that financial support was received for the research and/or publication of this article. This study was partly supported by a Fulbright Fellowship to PB and the Swedish Research Council Formas (Grant #2018-00966) to MC.
Acknowledgments
The use of trade names is for the information and convenience of the reader and does not imply official endorsement or approval by the USDA or the Forest Service of any product to the exclusion of others that may be suitable. We are grateful to Paal Krokene, Tod Ramsfield, and Caterina Villari for help with field data acquisition, and the Cleary Lab’s staff for assistance both in the field and the lab.
Conflict of interest
The authors declare that the research was conducted in the absence of any commercial or financial relationships that could be construed as a potential conflict of interest.
The reviewer TP declared a shared affiliation with the author AC to the handling editor at time of review.
The author(s) declared that they were an editorial board member of Frontiers, at the time of submission. This had no impact on the peer review process and the final decision.
Generative AI statement
The authors declare that no Gen AI was used in the creation of this manuscript.
Publisher’s note
All claims expressed in this article are solely those of the authors and do not necessarily represent those of their affiliated organizations, or those of the publisher, the editors and the reviewers. Any product that may be evaluated in this article, or claim that may be made by its manufacturer, is not guaranteed or endorsed by the publisher.
Supplementary material
The Supplementary material for this article can be found online at: https://www.frontiersin.org/articles/10.3389/ffgc.2025.1588428/full#supplementary-material
SUPPLEMENTARY FIGURE S1 | The humidity enclosures were placed and maintained in climate rooms in a Biotron growth facility. One enclosure served as a control chamber while the other served to inoculate the seedlings.
SUPPLEMENTARY FIGURE S2 | PCA of Snogeholm training data set.
SUPPLEMENTARY FIGURE S3 | sPLS-DA projection of Snogeholm training data set with prediction background indicated by shading (blue: resistant; orange: susceptible), showing clear separation between the treatments with minor overlap.
SUPPLEMENTARY FIGURE S4 | PCA of second derivative transformed spectra from Snogeholm (green) and Trolleholm (orange). Shape indicates phenotype, resistant (circle) and susceptible (triangle). Some clustering by treatment can be observed, with ~ 61% of the variance explained by the first two components.
References
Baral, H.-O., and Bemmann, M. (2014). Hymenoscyphus fraxineus vs. Hymenoscyphus albidus – a comparative light microscopic study on the causal agent of European ash dieback and related foliicolous, stroma-forming species. Mycology 5, 228–290. doi: 10.1080/21501203.2014.963720
Bonello, P. (2024). Complex forest tree diseases – diagnostics beyond Koch’s postulates. Curr. Forestry Rep. 10:220. doi: 10.1007/s40725-024-00220-w
Broome, A., and Mitchell, R. J. (2017). Ecological impacts of ash dieback and mitigation methods. Edinburgh: UK Forest Research Technical Report FCRN029, 1–16.
Cleary, M. R., Andersson, P. F., Broberg, A., Elfstrand, M., Daniel, G., and Stenlid, J. (2014). Genotypes of Fraxinus excelsior with different susceptibility to the ash dieback pathogen Hymenoscyphus pseudoalbidus and their response to the phytotoxin viridiol – a metabolomic and microscopic study. Phytochemistry 102, 115–125. doi: 10.1016/j.phytochem.2014.03.005
Cleary, M. R., Daniel, G., and Stenlid, J. (2013). Light and scanning electron microscopy studies of the early infection stages of Hymenoscyphus pseudoalbidus on Fraxinus excelsior. Plant Pathol. 62, 1294–1301. doi: 10.1111/ppa.12048
Cleary, M., Nguyen, D., Marciulyniene, D., Berlin, A., Vasaitis, R., and Stenlid, J. (2016). Friend or foe? Biological and ecological traits of the European ash dieback pathogen Hymenoscyphus fraxineus in its native environment. Sci. Rep. 6:21895. doi: 10.1038/srep21895
Cleary, M., Nguyen, D., Stener, L.-G., Stenlid, J., and Skovsgaard, J.-P. (2017). “Ash and ash dieback in Sweden: a review of disease history, current status, pathogen and host dynamics, host tolerance and management options in forests and landscapes” in Dieback of European ash (Fraxinus spp.) - consequences and guidelines for sustainable management. eds. R. Vasaitis and R. Enderle (Uppsala: Swedish University of Agricultural Sciences), 195–208.
Conrad, A. O., and Bonello, P. (2016). Application of infrared and Raman spectroscopy for the identification of disease resistant trees. Front. Plant Sci. 6:1152. doi: 10.3389/fpls.2015.01152
Conrad, A. O., Li, W., Lee, D.-Y., Wang, G.-L., Rodriguez-Saona, L., and Bonello, P. (2020a). Machine learning-based presymptomatic detection of rice sheath blight using spectral profiles. Plant Phenomics 2020:8954085. doi: 10.34133/2020/8954085
Conrad, A. O., McPherson, B. A., Lopez-Nicora, H. D., D'Amico, K. M., Wood, D. L., and Bonello, P. (2019). Disease incidence and spatial distribution of host resistance in a coast live oak/sudden oak death pathosystem. For. Ecol. Manag. 433, 618–624. doi: 10.1016/j.foreco.2018.11.035
Conrad, A. O., McPherson, B. A., Wood, D. L., Madden, L. V., and Bonello, P. (2017). Constitutive phenolic biomarkers identify naive Quercus agrifolia resistant to Phytophthora ramorum, the causal agent of sudden oak death. Tree Physiol. 37, 1686–1696. doi: 10.1093/treephys/tpx116
Conrad, A. O., Rodriguez-Saona, L. E., McPherson, B. A., Wood, D. L., and Bonello, P. (2014). Identification of Quercus agrifolia (coast live oak) resistant to the invasive pathogen Phytophthora ramorum in native stands using Fourier-transform infrared (FT-IR) spectroscopy. Front. Plant Sci. 5:521. doi: 10.3389/fpls.2014.00521
Conrad, A. O., Villari, C., Sherwood, P., and Bonello, P. (2020b). Phenotyping Austrian pine for resistance using Fourier-transform infrared spectroscopy. Arboric. Urban. For. 46, 276–286. doi: 10.48044/jauf.2020.020
Cozzolino, D. (2014). Use of infrared spectroscopy for in-field measurement and phenotyping of plant properties: instrumentation, data analysis, and examples. Appl. Spectrosc. Rev. 49, 564–584. doi: 10.1080/05704928.2013.878720
Ewing, C. J., Hausman, C. E., Pogacnik, J., Slot, J., and Bonello, P. (2019). Beech leaf disease: an emerging forest epidemic. For. Pathol. 49:12488. doi: 10.1111/efp.12488
Fearer, C. J., Conrad, A. O., Marra, R. E., Georskey, C., Villari, C., Slot, J., et al. (2022). A combined approach for early in-field detection of beech leaf disease using near-infrared spectroscopy and machine learning. Front. For. Glob. Change 5:934545. doi: 10.3389/ffgc.2022.934545
Febrero-Bande, M., and de la Fuente, M. O. (2012). Statistical computing in functional data analysis: the R package fda.Usc. J. Stat. Softw. 51, 1–28. doi: 10.18637/jss.v051.i04
Gandhi, K. J. K., and Herms, D. A. (2010). Direct and indirect effects of alien insect herbivores on ecological processes and interactions in forests of eastern North America. Biol. Invasions 12, 389–405. doi: 10.1007/s10530-009-9627-9
George, J.-P., Sanders, T. G. M., Timmermann, V., Potočić, N., and Lang, M. (2022). European-wide forest monitoring substantiate the necessity for a joint conservation strategy to rescue European ash species (Fraxinus spp.). Sci. Rep. 12:4764. doi: 10.1038/s41598-022-08825-6
Gossner, M. M., Perret-Gentil, A., Britt, E., Queloz, V., Glauser, G., Ladd, T., et al. (2023). A glimmer of hope - ash genotypes with increased resistance to ash dieback pathogen show cross-resistance to emerald ash borer. New Phytol. 240, 1219–1232. doi: 10.1111/nph.19068
Götmark, F., Fridman, J., Kempe, G., and Norden, B. (2005). Broadleaved tree species in conifer-dominated forestry: regeneration and limitation of saplings in southern Sweden. For. Ecol. Manag. 214, 142–157. doi: 10.1016/j.foreco.2005.04.001
Gross, A., Hosoya, T., and Queloz, V. (2014). Population structure of the invasive forest pathogen Hymenoscyphus pseudoalbidus. Mol. Ecol. 23, 2943–2960. doi: 10.1111/mec.12792
Heim, R. H. J., Wright, I. J., Chang, H.-C., Carnegie, A. J., Pegg, G. S., Lancaster, E. K., et al. (2018). Detecting myrtle rust (Austropuccinia psidii) on lemon myrtle trees using spectral signatures and machine learning. Plant Pathol. 67, 1114–1121. doi: 10.1111/ppa.12830
Hicke, J. A., Allen, C. D., Desai, A. R., Dietze, M. C., Hall, R. J., Hogg, E. H., et al. (2012). Effects of biotic disturbances on forest carbon cycling in the United States and Canada. Glob. Change Biol. 18, 7–34. doi: 10.1111/j.1365-2486.2011.02543.x
Hughes, M. A., Smith, K. E., Sims, A., Zhang, J., Held, B. W., Blanchette, R. A., et al. (2022). Screening of Persea borbonia clones for resistance to the laurel wilt pathogen, Raffaelea lauricola. For. Pathol. 52:e12776. doi: 10.1111/efp.12776
Hultberg, T., Sandström, J., Felton, A., Öhman, K., Rönnberg, J., Witzell, J., et al. (2020). Ash dieback risks an extinction cascade. Biol. Conserv. 244:108516. doi: 10.1016/j.biocon.2020.108516
Johansson, S. B. K., Vasaitis, R., Ihrmark, K., Barklund, P., and Stenlid, J. (2010). Detection of Chalara fraxinea from tissue of Fraxinus excelsior using species-specific ITS primers. For. Pathol. 40, 111–115. doi: 10.1111/j.1439-0329.2009.00614.x
Koch, J. L., Carey, D. W., Mason, M. E., Poland, T. M., and Knight, K. S. (2015). Intraspecific variation in Fraxinus pennsylvanica responses to emerald ash borer (Agrilus planipennis). New For. 46, 995–1011. doi: 10.1007/s11056-015-9494-4
Kucheryavskiy, S. (2020). Mdatools – R package for chemometrics. Chemometr. Intell. Lab. Syst. 198:103937. doi: 10.1016/j.chemolab.2020.103937
Kuhn, M. (2024). Caret: classification and regression training. Available online at: https://github.com/topepo/caret/ (Accessed May 29, 2024).
Le Cao, K. A., Boitard, S., and Besse, P. (2011). Sparse PLS discriminant analysis: biologically relevant feature selection and graphical displays for multiclass problems. BMC Bioinformatics 12:253. doi: 10.1186/1471-2105-12-253
Liziniewicz, M., Tolio, B., and Cleary, M. (2022). Monitoring of long-term tolerance of European ash to Hymenoscyphus fraxineus in clonal seed orchards in Sweden. For. Pathol. 52:e12773. doi: 10.1111/efp.12773
Loo, J. A. (2009). Ecological impacts of non-indigenous invasive fungi as forest pathogens. Biol. Invasions 11, 81–96. doi: 10.1007/s10530-008-9321-3
Lovett, G. M., Weiss, M., Liebhold, A. M., Holmes, T. P., Leung, B., Lambert, K. F., et al. (2016). Nonnative forest insects and pathogens in the United States: impacts and policy options. Ecol. Appl. 26, 1437–1455. doi: 10.1890/15-1176
Luiz, B. C., Giardina, C. P., Keith, L. M., Jacobs, D. F., Sniezko, R. A., Hughes, M. A., et al. (2022). A framework for establishing a rapid ‘Ōhi‘a death resistance program. New For. 54, 637–660. doi: 10.1007/s11056-021-09896-5
Martinelli, F., Scalenghe, R., Davino, S., Panno, S., Scuderi, G., Ruisi, P., et al. (2015). Advanced methods of plant disease detection. A review. Agron. Sustain. Dev. 35, 1–25. doi: 10.1007/s13593-014-0246-1
McKinney, L. V., Nielsen, L. R., Hansen, J. K., and Kjaer, E. D. (2011). Presence of natural genetic resistance in Fraxinus excelsior (Oleaceae) to Chalara fraxinea (Ascomycota): an emerging infectious disease. Heredity 106, 788–797. doi: 10.1038/hdy.2010.119
McPherson, B. A., Mori, S. R., Opiyo, S. O., Conrad, A. O., Wood, D. L., and Bonello, P. (2014). Association between resistance to an introduced invasive pathogen and phenolic compounds that may serve as biomarkers in native oaks. For. Ecol. Manag. 312, 154–160. doi: 10.1016/j.foreco.2013.10.009
Mukrimin, M., Conrad, A. O., Kovalchuk, A., Julkunen-Tiitto, R., Bonello, P., and Asiegbu, F. O. (2019). Fourier-transform infrared (FT-IR) spectroscopy analysis discriminates asymptomatic and symptomatic Norway spruce trees. Plant Sci. 289:110247. doi: 10.1016/j.plantsci.2019.110247
Munck, I. A., and Bonello, P. (2018). Modern approaches for early detection of forest pathogens are sorely needed in the United States. For. Pathol. 48:12445. doi: 10.1111/efp.12445
Nemesio-Gorriz, M., Menezes, R. C., Paetz, C., Hammerbacher, A., Steenackers, M., Schamp, K., et al. (2020). Canditate metabolites for ash dieback tolerance in Fraxinus excelsior. J. Exp. Bot. 71, 6074–6083. doi: 10.1093/jxb/eraa306
Pautasso, M., Aas, G., Queloz, V., and Holdenrieder, O. (2013). Dieback of European ash: let’s avoid this kind of opportunities for nature conservation. Biol. Conserv. 167, 452–453. doi: 10.1016/j.biocon.2013.07.020
Pliura, A., Lygis, V., Marciulyniene, D., Suchockas, V., and Bakys, R. (2016). Genetic variation of Fraxinus excelsior half-sib families in response to ash dieback disease following simulated spring frost and summer drought treatments. iForest – Biogeosci. Forestry 9, 12–22. doi: 10.3832/ifor1514-008
Pliura, A., Lygis, V., Suchockas, V., and Bartkevicius, E. (2011). Performance of twenty four European Fraxinus excelsior populations in three Lithuanian progeny trials with a special emphasis on resistance to Chalara fraxinea. Balt. For. 17, 17–34.
Ramsay, J. O., Graves, S., and Hooker, G. (2024). FDA: functional data analysis. Available online at: http://www.functionaldata.org (Accessed May 29, 2024).
RCoreTeam (2024). R: a language and environment for statistical computing. Available online at: https://www.R-project.org/ (Accessed May 29, 2024).
Rohart, F., Gautier, B., Singh, A., and Lê Cao, K.-A. (2017). mixOmics: an R package for ‘omics feature selection and multiple data integration. PLoS Comput. Biol. 13:e1005752. doi: 10.1371/journal.pcbi.1005752
Sambles, C. M., Salmon, D. L., Florance, H., Howard, T. P., Smirnoff, N., Nielsen, L. R., et al. (2017). Ash leaf metabolomes reveal differences between trees tolerant and susceptible to ash dieback disease. Sci. Data 4:170190. doi: 10.1038/sdata.2017.190
Showalter, D. N., Raffa, K. F., Sniezko, R. A., Herms, D. A., Liebhold, A. M., Smith, J. A., et al. (2018). Strategic development of tree resistance against forest pathogen and insect invasions in defense-free space. Front. Ecol. Evol. 6:124. doi: 10.3389/fevo.2018.00124
Stanley, R. K., Carey, D. W., Mason, M. E., Poland, T. M., Koch, J. L., Jones, A. D., et al. (2022). Profiles of secoiridoids and alkaloids in tissue of susceptible and resistant green ash progeny reveal patterns of induced responses to emerald ash borer in Fraxinus pennsylvanica. bioRxiv 18:492370. doi: 10.1101/2022.05.18.492370
Stener, L.-G. (2013). Clonal differences in susceptibility to the dieback of Fraxinus excelsior in southern Sweden. Scand. J. For. Res. 28, 205–216. doi: 10.1080/02827581.2012.735699
Tang, Y., Horikoshi, M., and Li, W. (2016). Ggfotify: unified interface to visualize statistical result of popular R packages. R J 8, 478–489. doi: 10.32614/RJ-2016-060
Villari, C., Dowkiw, A., Enderle, R., Ghasemkhani, M., Kirisits, T., Kjær, E. D., et al. (2018). Advanced spectroscopy-based phenotyping offers a potential solution to the ash dieback epidemic. Sci. Rep. 8:17448. doi: 10.1038/s41598-018-35770-0
Keywords: ash dieback, disease resistance, early detection, European ash, non-destructive phenotyping
Citation: Bonello P, Conrad AO, Sadiković D, Liziniewicz M and Cleary M (2025) Point-of-care diagnostics and resistance phenotyping to combat ash dieback. Front. For. Glob. Change. 8:1588428. doi: 10.3389/ffgc.2025.1588428
Edited by:
Bernard Slippers, University of Pretoria, South AfricaReviewed by:
Therese Marie Poland, Northern Research Station, Forest Service (USDA), United StatesGitta Jutta Langer, Northwest German Forest Research Institute, Germany
Copyright © 2025 Bonello, Conrad, Sadiković, Liziniewicz and Cleary. This is an open-access article distributed under the terms of the Creative Commons Attribution License (CC BY). The use, distribution or reproduction in other forums is permitted, provided the original author(s) and the copyright owner(s) are credited and that the original publication in this journal is cited, in accordance with accepted academic practice. No use, distribution or reproduction is permitted which does not comply with these terms.
*Correspondence: Pierluigi Bonello, Ym9uZWxsby4yQG9zdS5lZHU=