Abstract
Accurate detection of phenological events, such as growth onset, cessation, and seasonal transitions, is essential for understanding tree growth dynamics, particularly in Mediterranean forests where bimodal growth patterns are common. While microcore analysis remains the most precise method, its labor-intensive nature has led researchers to rely on dendrometer-based approaches. However, traditional methods using dendrometer data— such as parametric growth curve fitting with phenological events detected as relative thresholds—are often biased by hydration-related fluctuations and may fail to accurately capture complex growth patterns. In this study, we compared commonly used detection methods, including the Gompertz and Richards parametric functions, a generalized additive model (GAM), and the zero-growth (ZG) concept, with a novel approach: the two-stage threshold approach (2STA). Our results showed that the 2STA consistently outperformed existing methods in identifying spring onset, summer cessation, and autumn onset, exhibiting deviations within the expected measurement uncertainty (±7 days). The method’s reliance on direct growth rate transitions, rather than smoothed curves or arbitrary percentiles, reduced errors associated with hydration-related stem fluctuations. However, year cessation was best estimated using a 95% relative growth threshold derived from the Richards function. These findings highlight the potential of the 2STA as a robust and objective method for phenological event detection using manually collected band dendrometer data, particularly for species with complex intra-annual growth patterns. Future research should focus on refining climate-based thresholds for cambial activity and validating the method across a wider range of species and environmental conditions.
1 Introduction
Xylem phenology describes the moments when the cambium initiates or ceases xylem cell production (phenological events), offering insight into tree productivity (De Swaef et al., 2015) and tree responses to environmental factors (Deslauriers et al., 2007; Drew and Downes, 2009). Increased drought frequency in the Mediterranean region (Peñuelas and Sardans, 2021) may influence cambial dynamics (de Luis et al., 2011; Vieira et al., 2020), which are primarily regulated by temperature and water availability (Begum et al., 2018) and further modulated by species identity, competition, and photoperiod (Cruz-García et al., 2019; Cuny et al., 2019; de Lara et al., 2017; Drew and Downes, 2018). Moreover, cambial activity may halt during summer if cambial cells lose turgor as a result of water stress (Rashid et al., 2024; Vieira et al., 2020). In warmer climate zones, such as the Mediterranean region, the dormancy stage of the cambium may end under a continuous water supply, thereby triggering an autumn onset of growth (Rahman et al., 2022).
Microcore analysis remains the most precise method for detecting phenological events (Miller et al., 2022), however, its labor-intensive nature and the potential for tissue damage during sample extraction (Mäkinen et al., 2008) have led researchers to rely on dendrometers (Deslauriers et al., 2007). Automated dendrometers capture high-resolution data but are susceptible to noise and environmental artifacts (Knüsel et al., 2021; van der Maaten et al., 2016), while manually measured band dendrometers provide more robust but lower-frequency data prone to reading errors (Drew and Downes, 2009). Phenological events can be derived from intra-annual growth data by defining them as fixed percentiles of the raw accumulated growth (e.g., 5 and 95%). However, this approach is often inaccurate (Cruz-García et al., 2019), as dendrometers record not only effective xylem growth but also fluctuations in stem size due to tissue hydration (van der Maaten et al., 2016; Zweifel et al., 2016). To address this issue, smoothing of the raw growth curve is commonly applied using parametric functions such as the Richards, Gompertz, or logistic models (D’Orangeville et al., 2022; Oswald et al., 2012). However, simple sigmoid curves (e.g., the 3-parameter logistic; Strieder and Vospernik, 2021) assume symmetrical growth patterns that are often unrealistic (McMahon and Parker, 2015). Moreover, the growth of temperate tree species can be approximated by a sigmoid function (Burkhart and Tomé, 2012). Fitting such functions to Mediterranean species with bimodal growth is more complex as it requires additional parameters. This was the case when modeling Quercus pyrenaica and Pinus uncinata growth using the Richards and Gompertz functions, respectively (Aldea et al., 2023; Camarero et al., 2010), making parameter estimation a challenging process (McMahon and Parker, 2015). An alternative approach is the zero-growth (ZG) concept, which converts growth data into cumulative maximum curves based on the premise that wood formation only occurs when the cambium is hydrated (Zweifel et al., 2016). The ZG method is physiologically valid, although it may underestimate growth cessation compared to parametric models, as observed in temperate-climate conifers from southern Germany (Miller et al., 2022).
Relative thresholds of smoothed accumulated growth are commonly used to determine phenological events (e.g., 5% for growth onset and 95% for cessation; Gutiérrez et al., 2011; van der Maaten et al., 2018), but their arbitrary nature leads to large errors compared to microcore analysis (Miller et al., 2022). Accordingly, Miller et al. (2022) proposed using different thresholds—3.5% for growth onset and 85% for year cessation—to improve the accuracy of phenological event determination. Some studies did not attempt to identify specific phenological events. Instead, they reported the timing of fixed percentiles of accumulated growth during the most physiological active phases, such as 25, 50, and 75% (D’Orangeville et al., 2022; Olivar et al., 2022). While this facilitates comparisons between individuals or treatments, it does not provide precise estimates of cambial onset or cessation. Phenological events can also be estimated by visually inspecting non-linear models fitted to aggregated tree data—for example, using grouped datasets to fit parametric curves (Askarieh et al., 2024; Strieder and Vospernik, 2021). However, this approach reflects an average growth pattern and thus masks individual tree dynamics. Promising attempts have been made to use the cumulative sum chart (CUSUM) method for objective and automated phenological event detection (Korpela et al., 2010). The method iteratively positions a V-Mask graph at every point of the accumulated growth curve. When a given point is found outside the V-Mask arms, it is considered a significant deviation from the mean signal, marking a phenological event. The major difficulty in implementing this method is the selection of optimal parameters describing the V-Mask, which shape the method’s sensitivity. Sudden growth jumps due to stem hydration during spring have been shown to decrease the accuracy of growth onset detection. Furthermore, the optimal parameter set was found to differ between individual trees (Korpela et al., 2010). Despite its limitations, it is important to point out that the study by Korpela et al. was the first attempt to develop a methodology that allowed to determine phenological events objectively and individually for each tree.
To address these challenges, we compared commonly used methods for detecting phenological events in trees monitored with band dendrometers, focusing on Mediterranean species exhibiting bimodal growth. Our aim was to determine which method performs best at identifying phenological events when considering growth patterns that are more complex than those exhibited by temperate tree species. In addition, we introduced the two-stage threshold approach (2STA), a novel method that eliminates the need for curve smoothing. We hypothesized that the 2STA, which operates on raw data, would be able to determine phenological events more precisely than established smoothing methods. We believe that smoothing functions distort the information stored in raw data, as they are not flexible enough to approximate the complex shape of intra-annual growth in Mediterranean trees.
2 Materials and methods
2.1 Data collection and preparation
In April 2022, self-made stainless steel band dendrometers (Supplementary Figure S1) were installed on trees in the public forest “El Carrascal” (41°35′17.9”N 4°21′28.0”W), located in the Spanish Northern Plateau at 885 m a.s.l. The soils are calcareous cambisols and arkosic sands, with a water-holding capacity of 176 mm × m −1 (de Dios García et al., 2018). The site experiences a continental Mediterranean climate, with an annual precipitation of 434 mm and a mean temperature of 12.9°C (1996–2023). There is a pronounced dry period, which in 2023 lasted from June through August, during which the hydrological balance was strongly negative (Supplementary Table S1; Instituto Tecnológico Agrario de Castilla y León, 2025). In March 2022, after bark removal, we installed a total of 154 band dendrometers on trees representing the main stand components: Pinus pinea L., Pinus pinaster Ait., Juniperus thurifera L., and Quercus ilex L. We used data from 104 dendrometers measured during 2023, excluding records with decaying or irregular (non-bimodal) growth, which ensured consistent measurements over a complete year. Table 1 provides the characteristics and sample sizes for each species. Stem girth variations at breast height (1.3 m) were measured biweekly before midday using a 0.01 mm precision electronic caliper. Each tree was measured 18 times at intervals of 16 ± 4 days, yielding a total of 104 trees × 18 times = 1,872 records during 2023. The periodically observed girth variations were converted into basal area variations. From the ratio of the difference between two consecutive basal area records and the number of days between measurements, we obtained daily basal area variations. Summing these daily variations produced cumulative basal area (CBA) curves for each tree (Figures 1, 2, gray line).
Table 1
| Species | Number of trees | DBH [cm] | BAV2023 [cm2] |
|---|---|---|---|
| Juniperus thurifera | 30 | 12.3 ± 0.9 | 0.35 ± 0.05 |
| Pinus pinea | 39 | 36.8 ± 1.7 | 2.64 ± 0.22 |
| Pinus pinaster | 22 | 31.8 ± 1.7 | 1.72 ± 0.26 |
| Quercus ilex | 13 | 9.0 ± 0.3 | 0.16 ± 0.02 |
Characteristics of the trees for which the precision of the phenological event detection methods were compared.
DBH, diameter at breast height; BAV2023: basal area variation during the year 2023, ± the respective standard error.
Figure 1

Example of a cumulative basal area (CBA) growth curve for tree no. 30 (solid gray line), with phenological events (PEs) estimated using various smoothing methods (black dashed lines). Reference phenological events—spring onset (SO), summer cessation (SC), autumn onset (AO), and year cessation (YC)—are shown as red diamonds (in that order). Vertical lines mark the corresponding events as identified by each method, based on two relative threshold approaches (5–95% and 3.5–85%), with line types distinguishing between the methods.
Figure 2
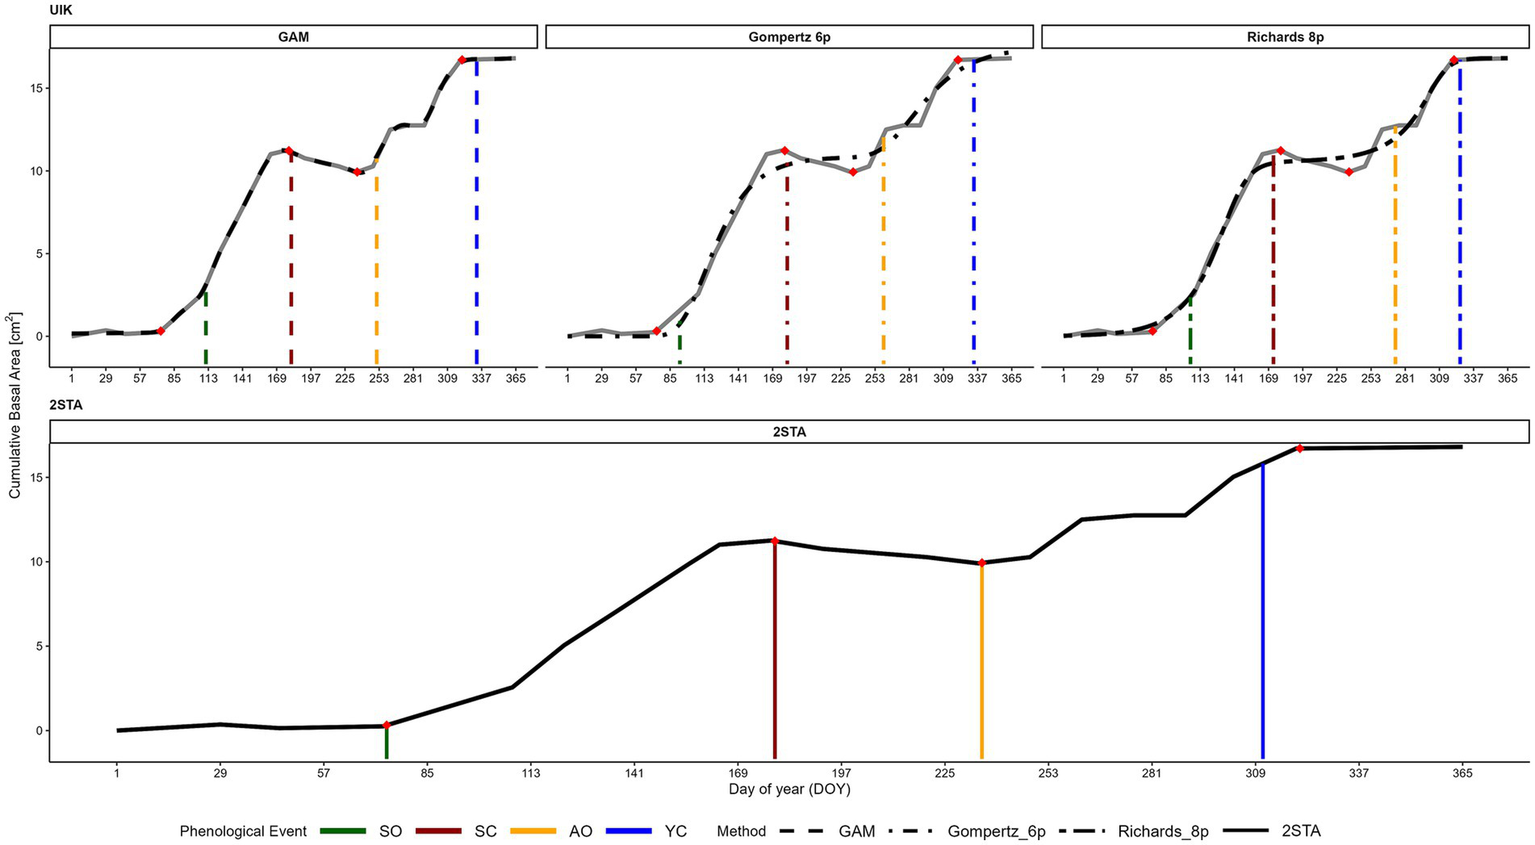
Example of a cumulative basal area (CBA) growth curve for tree no. 30 (solid gray line), with phenological events (PEs) estimated using the UIK approach and 2STA. In the top row, the UIK approach was applied to the smoothed curves from the GAM, Gompertz, and Richards functions (black dashed lines). In the bottom panel, the 2STA estimated PEs directly from the raw CBA data (solid black line), without smoothing. Reference phenological events—spring onset (SO), summer cessation (SC), autumn onset (AO), and year cessation (YC)—are shown as red diamonds. Vertical lines mark the estimated events, with colors indicating the PE type and line types distinguishing the smoothing methods in the UIK panels.
2.2 Smoothing the growth curves
We then smoothed each individual tree’s CBA curve using four methods: (i) the Richards and (ii) Gompertz parametric functions, both commonly used for smoothing intra-annual growth curves (Oswald et al., 2012); (iii) a generalized additive model (GAM); and (iv) the zero-growth concept (ZG), which transforms the CBA curve into a continuously cumulative form by eliminating shrinkage phases. The four methods are described below:
-
(1) Richards 4-parameter (double) function, which has been previously used to approximate intra-annual growth in Mediterranean oak species (Aldea et al., 2023):
A is the upper asymptote, I is the inflection point, k is the rate parameter, and m is the shape parameter of the growth curve during spring time; hence, the A parameter marks the CBA value attained by a tree at the start of the summer cessation period. The parameters Aa, Ia, ka, and ma have the same meaning but describe the second (autumn) part of intra-annual growth, with the parameter Aa marking the CBA value at the end of yearly growth.
-
(2) Gompertz 3-parameter (double) function, which, among various parametric functions, has been shown to best approximate phenological events identified through microcore analysis (Miller et al., 2022).
We used the double version of this function, described as follows:
where A is the asymptote, C is the inflection point, and D is the rate parameter during the spring growth period. The parameters Aa, Ca, and Da are the respective equivalents for the autumn growth phase.
“Double” versions of these parametric functions were used to accommodate both spring and autumn growth by each part of the function (Aldea et al., 2023).
To find suitable initial parameter values for the parametric functions, an iterative approach (500 repetitions) was used, each time attempting to fit the function using a set of plausible pre-initial starting values (Supplementary Table S2). The best-fitting solution—defined by the lowest residual sum of squares (RSS)—then provided the initial parameters for the final smoothing of each tree’s CBA curve (more details in SM§1). The summary statistics of the final fitted parameters for all trees are presented in Supplementary Table S3.
-
(3) A GAM was fitted to each tree’s CBA curve:
When fitting the GAM, a cubic regression spline was used as the basis function, with a maximum of seven knots placed at the days of the year (DOY) corresponding to the boundaries between established thermo-hydrological phases of the year (Table 2). The first knot was positioned at the spring start DOY. This approach helped prevent excessive wiggliness in the fitted GAM (McMahon and Parker, 2015) and linearized potential minor fluctuations during winter.
-
(4) The ZG concept converts the growth curve into a continuously cumulative form by eliminating any shrinkage periods, while the other parts of the curve (with positive or no increment) remain unaffected. Therefore, the zero-growth concept assumes that wood formation occurs only when the stem is hydrated (Knüsel et al., 2021; Zweifel et al., 2016).
Table 2
| Climate threshold | Thermal condition | Hydric condition | Day of the year, DOY (Date) |
|---|---|---|---|
| Spring start | Tavg ≥ 8°C | – | 70 (11th of March) |
| Summer start | Tavg ≥ 20°C | CWB < 0 [mm] | 168 (17th of June) |
| Autumn start | Tavg < 20°C | CWB > [mm] | 238 (26th of August) |
| Winter start | Tavg < 8°C | – | 322 (18th of November) |
Climatic thresholds used in the search for phenological events.
Climatic variables represent mean values (temperature) or sums (CWB) over each biweekly period. The dates correspond to 2023. Tavg, average daily temperature [°C]. Climatic water balance (CWB) was calculated as the difference between precipitation and potential evapotranspiration (computed using the Penman–Monteith method). , average CWB during months with Tavg > 20°C following spring start.
2.3 Finding the phenological events
To detect the four phenological events—spring onset, summer cessation, autumn onset, and year cessation—we applied several detection approaches in combination with the four smoothing or transformation methods described in Section 2.2. In this section, we describe how phenological events were derived for each method. In every case, the starting point of the CBA curve was defined as the spring start, determined using climatic thresholds (Table 2; Strieder and Vospernik, 2021). The only exception was the ZG method, where the curve began at the point when the previous year’s maximum accumulated growth was reached.
2.3.1 Parametric smoothing methods: Richards and Gompertz parametric functions
Both functions were applied in a double form, allowing separate modeling of the spring and autumn growth phases. The CBA curve was split between these phases at DOY 212 (August 1), corresponding to the midpoint between thermal summer and autumn start (Supplementary Table S2; adopted from: Aldea et al., 2021). Over the fitted CBA curve, we determined phenological events using the following approaches: (a) the relative threshold approach and (b) the Unit Invariant Knee (UIK) approach.
For the relative threshold approach, spring onset was estimated as the date when the tree reached either 3.5% or 5% of the total annual cumulative growth. Summer cessation was defined as the date when 85% or 95% of the spring-phase growth had been reached. Autumn onset was defined as the date when 3.5% or 5% of the autumn-phase growth had accumulated. Finally, year cessation was determined as the date when 85% or 95% of the total annual growth had been attained.
For the UIK approach, phenological events were identified as elbows (knees) of the fitted curve—points where the increment sharply increased or decreased—using the unit invariant knee method described by Christopoulos (2016). Each knee point was searched along the fitted CBA curve, trimmed to season-specific ranges defined by climatic thresholds (Table 2). Accordingly, a knee point located between spring start and summer start was marked as spring onset; one between summer start and autumn start as summer cessation; and one between autumn start and winter start as autumn onset. The search for year cessation was performed after the winter start.
2.3.2 Generalized additive model
Phenological events were identified from the GAM-smoothed CBA curves using three detection approaches: (a) relative thresholds, (b) local extrema, and (c) the UIK approach. In the relative threshold approach, the same percentiles were used to detect spring onset and year cessation as in the parametric functions (see Section 2.3.1).
The local extrema approach identified summer cessation as the local maximum between summer start and autumn start and identified autumn onset as the local minimum between autumn start and winter start. This approach takes advantage of the GAM’s non-parametric flexibility, as parametric functions typically lack such local maxima or minima, which are characteristic of bimodal growth patterns (Figure 1, “GAM” panels).
In the UIK approach, knees were searched within seasonally constrained intervals
(Table 2) to identify each phenological event in the smoothed curve, following the same logic applied to the parametric models (Section 2.3.1; Figure 2, “UIK” panel).
2.3.3 Zero-growth concept
For the ZG-smoothed curves, two detection approaches were used depending on the phenological event: (a) relative thresholds and (b) shrinkage/swelling-based logic specific to the ZG concept.
In the relative threshold approach, spring onset was defined as the date when the cumulative growth curve reached 3.5% or 5% of the total annual increment, while year cessation was marked by the curve reaching 85% or 95%.
In the shrinkage/swelling-based approach, summer cessation was marked as the first moment of growth stagnation following spring onset (the first DOY with no increase in CBA), while autumn onset was set as the first day when the maximum CBA from the preceding phase of shrinkage was exceeded. Therefore, we followed the original concept of Zweifel et al. (2016), adapting it to account for the bimodal growth patterns typical of Mediterranean species.
2.4 Two-stage threshold approach
As an alternative to the abovementioned methods, a new approach called the Two-Stage Threshold Approach (2STA) was developed. This new method does not require smoothing and relies solely on observed data, assuming that smoothing may obscure critical growth transitions. It considers only current measurement dates for pinpointing phenological events, ensuring direct detection of changes in growth. This method is applied to data recorded from manually measured band dendrometers, where stem increment cannot be distinguished from hydration-related fluctuations. Hence, when we use the term “increment,” we refer to mere growth variations and not the net growth.
The method is described in the following steps (Figure 3):
-
(1) Calculation of the Daily MetricVariation (DMV). Manual dendrometer readings were taken every 14 to 16 days, resulting in discrete measurement intervals. Within each tree’s growth record, for each of these intervals, we calculated the daily metric variation (DMV), which quantifies the average daily growth between two consecutive measurements. The DMV is computed by dividing the change in recorded size by the number of days that elapsed between the two measurements. As no intermediate data are available, growth within each interval (segment) is approximated as linear, with a constant daily growth rate (DMVS). Each segment begins on the date the measurement was taken (see Figure 3).
-
(2) Standardization of the Daily Metric Variation. As absolute growth rates varied across species, individuals, and years, we standardized the DMV values for each ith tree in each yth year. This was performed using z-score normalization (mean-zero), resulting in standardized daily metric variations (). This transformation ensures that all trees contribute comparably to threshold determination, as their increments are expressed as distances from their respective mean DMV. Such a relative scale allows the growth patterns of many trees to be analyzed jointly.
-
(3) Definition of the growth threshold from dormant periods (winter or summer). First, we identified seasonal phases based on temperature and climatic water balance (see Table 2). These seasonal markers defined the dormant periods preceding phenological transitions—winter for spring onset and summer for autumn onset. They also constrained the search windows for detecting phenological events to ecophysiologically meaningful periods. Once seasonal phases were defined, we calculated growth thresholds to distinguish true growth from hydration-related fluctuations. For each species-year group, we first extracted standardized DMV values from the dormant period preceding the phenological transition of interest—winter for spring onset and summer for autumn onset. From these values, we calculated the winter (or summer) threshold, : the 75th percentile of during the respective dormant period.
-
(4) Definition of the growth threshold from the transition period (onset threshold). We analyzed the distribution of within a 30-day window starting from the beginning of the target season (e.g., 30 days after spring start). For the species-year group, we computed the deciles of (i.e., 10 to 90% percentiles at 10% intervals). The lowest decile that exceeded 110% of the dormant reference threshold ( was designated as the spring or autumn onset threshold, . This approach ensured that only growth values meaningfully distinct from dormancy-driven noise were considered indicative of true phenological transitions.
-
(5) Identification of possible onset dates. Within each tree’s cumulative growth record, we calculated the change in the DMV between adjacent growth segments (ΔDMVS). Candidate onset dates were defined as the first day of any segment where ΔDMVS > 0, that is, where the daily growth rate increased compared to the previous segment. These candidates were limited to season-specific search windows: from 14 days before spring start to summer start for spring onset and from 14 days before autumn start to winter start for autumn onset.
-
(6) Confirmation of final onset date. Each candidate onset date was evaluated against three ecological and growth-related criteria to ensure that it represented phenological onset as accurately as possible:
-
a) Above-threshold growth rate. The standardized DMV at the candidate date—and throughout the entire segment—must exceed the onset threshold defined in step 5:
-
b) Sustained growth beyond swelling. The cumulative metric value (CMV) at the end of the following segment must be greater than at the candidate date. This prevents misinterpreting temporary hydration as true growth.
-
c) Monotonic pattern. All CMV values preceding the candidate date must be lower than all values following it, ensuring there is no long-term shrinkage or decay. This condition helps rule out the possibility that the cambium did not actually reinitiate xylem cell differentiation at the candidate onset date. The first candidate date that satisfies all three conditions is recorded as the spring or autumn onset date.
-
(7) Identification of summer cessation. Summer cessation was defined as the first date after spring onset when the DMV became negative or equal to zero, indicating a halt in radial growth and/or the beginning of stem shrinkage. This search was restricted to a seasonal window spanning from 14 days before summer start to autumn start. Within this window, a date was selected as the summer cessation if it satisfied the following conditions:
-
a) The daily metric variation on that date was negative or null: DMVS ≤ 0.
-
b) The preceding segment exhibited positive daily metric variation: DMVS-1 > 0 (i.e., active growth was occurring just before the cessation).
Figure 3

Visualization of the concepts of the Two-Stage Threshold Approach (2STA) for detecting phenological events. The numbers 1), 2)…6) correspond to the method description in the §2.4 “Materials and Methods: Two-Stage Threshold Approach (2STA)”.
This transition reflects the moment when cambial activity ceases due to adverse summer conditions, such as high temperature and water deficit.
-
(8) Identification of year cessation. Year cessation was defined as the first date after autumn onset when the tree reached 85% of the growth accumulated since autumn onset. This relative threshold was adopted following comparisons made by Miller et al. (2022). This approach avoids relying on -based transition detection, which would be unreliable due to sparse winter measurements.
The percentile used to define the dormant-season threshold ( was determined through an iterative process. We tested percentiles ranging from 0 to 95%, in 5% increments. For each value, we calculated the corresponding threshold and used it to estimate the spring or autumn onset dates for all trees. We then computed the mean error of the deviations between the estimated and reference phenological events. The optimal percentile was defined as the one that minimized the mean error for the respective phenological event (Supplementary Figure S2).
2.5 Comparison of the accuracy of the methods
To evaluate the accuracy of these methods, we first identified reference phenological events through visual inspection of the raw cumulative basal area curves, following the approach of Korpela et al. (2010). Spring onset and autumn onset were defined as the points at which the growth curve began to increase steadily after a preceding phase of oscillation around a limit or decline. Summer cessation and year cessation were identified as the moments when the growth curve became flat, resumed oscillatory behavior, or started to decline following spring or autumn growth. To ensure consistency, we included only trees that exhibited positive annual growth, with a clear bimodal pattern. Based on this criterion, 50 of 154 trees (32%) were excluded. For each remaining tree, we calculated the difference between the phenological events estimated by each approach and the reference values. To assess overall accuracy, we computed the mean deviation for each approach and generated 2.5–97.5% confidence intervals using 1,000 bootstrap resamples of these mean deviations. In addition, we tested whether the deviations of each approach differed significantly from the 2STA estimates by applying a paired Welch’s t-test. In total, we estimated phenological events using 10 methods for summer cessation and autumn onset and 12 methods for spring onset and year cessation. All statistical analyses, including the implementation of the 2STA, were conducted in the R Statistical Programming Environment, version 4.2.2, using RStudio as the interface (R Core Team, 2024). The non-parametric curves (GAM) were fitted using the mgcv package (Wood, 2017). The script of the 2STA is available at https://doi.org/10.5281/zenodo.14929969 and in the Supplementary material.
3 Results and discussion
We estimated the timing of key phenological events in xylogenesis for 104 trees over 1 year using both established methods (the Gompertz and Richards parametric functions and ZG concept) and newly applied or developed methods (GAM and 2STA). The precision of each method was assessed by comparing its estimates to visually determined reference phenological events. Among all tested methods, the 2STA exhibited the highest accuracy, closely aligning with the reference phenological events for spring onset, summer cessation, and autumn onset, although it was less precise in detecting year cessation (Figure 4; Supplementary Tables S4, S5).
Figure 4

Accuracy of phenological event (PE) estimates using different approaches (Supplementary Tables S4, S5). The mean deviations from the reference phenological events are shown (points) with 2.5–97.5% confidence intervals. The green band represents the potential accuracy range due to measurement frequency (± 8 days). Negative values (−) indicate that a method advanced the phenological event. Positive values (+) indicate that a method delayed the event. Zero (0) denotes perfect alignment with the reference PE.
3.1 Spring onset
The 2STA estimated spring onset on average 1 day earlier compared to the reference phenological event [confidence interval (CI): −3 to 1 day], making it the most precise method (Supplementary Table S5). In contrast, the smoothing-based methods significantly delayed spring onset estimates, with delays ranging from 11 days (Richards-3.5%) to 26 days (Richards-UIK). The ZG-5% method estimated spring onset earlier than the reference by 8 days (CI: −15 to −2 days), making it the second most precise method (Figure 3; Supplementary Table S5). The inaccuracies of the established methods, ranging from 8 to even 26 days, pose various risks. Firstly, using phenological events with such estimation errors in studies analyzing climate–phenology relationships could distort the conclusions. It has been shown that cambial reactivation in spring occurs when the temperature threshold is surpassed by 10–25 days, which closely matches the estimation errors observed in this study (Begum et al., 2013). Moreover, climatic conditions during just one month can affect radial growth throughout the entire season (Camarero et al., 2021). If the period of active growth is wrongly determined, the most influencing climate signal window will be distorted. The high accuracy of the 2STA likely stems from its direct reliance on observed data without smoothing, thereby avoiding distortions introduced by curve fitting during critical transition periods (i.e., the elbows of the single-tree growth curve). Using climatic thresholds to constrain the search space for spring onset also contributed to the method’s success. Although some studies have justifiably set search windows for spring onset (e.g., Strieder and Vospernik, 2021), their setting was arbitrary. Our approach was grounded in the fact that the cambium is highly responsive to temperature changes (Begum et al., 2013). The applied 8°C mean daily temperature threshold aligns well with empirical studies on the onset of cambial activity after the rest phase (Deslauriers et al., 2008; Nguyen et al., 2023; Rossi et al., 2008).
3.2 Summer cessation
Three methods—2STA, ZG, and Gompertz-UIK—accurately estimated summer cessation within ± 2 days of the reference value, with 2STA providing the most precise result (0-day deviation; Supplementary Table S5). Other methods varied in accuracy, with Richards-85% and Gompertz-85% advancing summer cessation by up to 23 days. Such errors can be considered substantial, given that potential evapotranspiration during August alone undermined the radial growth of J. thurifera during the July–August period (Camarero et al., 2021). The ability of the 2STA to precisely pinpoint summer cessation relies on the search for absolute changes in the growth rate (ΔDMV) rather than on cumulative growth percentiles, allowing it to detect the cessation of active xylogenesis exactly when it occurs (considering the constraints of sampling frequency). False local maxima in growth are partially avoided by restricting the window search to periods characterized by negative water balance and high temperatures. This approach aligns with findings confirming that cambial activity ceases due to low water supply (Rahman et al., 2022).
3.3 Autumn onset
Both the 2STA and GAM (local minimum variant) estimated autumn onset earlier by 1 to 3 days, with the 2STA method being more accurate. Other methods—particularly Richards-UIK—delayed autumn onset by 11 to 28 days (Figure 4; Supplementary Tables S4, S5). Autumn onset detection is more challenging because it depends on the reactivation of cambial cells, which is strongly influenced by soil moisture conditions (de Luis et al., 2011; Rahman et al., 2022). Autumn rainfall can restore soil hydration within a short period (sometimes in as little as a week; Camarero et al., 2021). Therefore, an error in detecting autumn onset by as much as a month can effectively obscure the tight coupling between soil moisture rehydration and growth reassumption. Our approach of constraining the search space using a joint thermal and hydric threshold aligns with findings showing that bimodal growth patterns in trees depend on soil rehydration and temperature shifts (Battipaglia et al., 2023). However, some subjectivity remains in defining the exact temperature and moisture thresholds for cambial activity, as species-specific responses have so far been investigated primarily in temperate, rather than Mediterranean, tree species (Nguyen et al., 2023).
3.4 Year cessation
Unlike other phenological events, year cessation was best estimated using the Richards-95% method, which pinpointed it accurately with an uncertainty of ± 4 days. In contrast, the 2STA delayed year cessation by 7 days (CI: 4 to 10 days; Figure 4; Supplementary Tables S4, S5). While searching for year cessation, we did not use an absolute threshold of daily growth, despite Miller et al. (2022) reporting that a threshold of 5 μm × day−1 (for radial measurements) performed best for identifying year cessation. However, this threshold is only valid for temperate species, for which it was tested. Some Mediterranean species such as Quercus ilex and Juniperus thurifera exhibit much lower daily radial increments even during the growing season, making this threshold unsuitable. Future research could explore species-specific absolute thresholds for Mediterranean trees. In addition, we did not design the 2STA to detect changes in for year cessation as we did for other phenological events due to the reduced frequency of winter measurements, which decreases accuracy. Instead, we applied a threshold of 85% accumulated growth since autumn onset. Therefore, we strongly advocate maintaining high-frequency data collection from band dendrometers even during cambial rest periods to improve the detection of year cessation (and spring onset). Furthermore, the cambium rest phase transitions into the quiescence phase, during which the cambium remains inactive but sensitive to environmental changes (Begum et al., 2018). With climate change driving unexpected cambial reactivations, continuous monitoring is essential.
3.5 Comparative accuracy of the methods
Overall, the 2STA was the most accurate for detecting spring onset, summer cessation, and autumn onset, with deviations well within the range of biweekly sampling uncertainty (± 7 days). For the detection of year cessation, it was not the most precise method, but its accuracy still fell within a reasonable range. Interestingly, the relative-threshold methods (percentiles of cumulative growth) consistently failed to accurately identify spring onset. They also did not yield accurate results for detecting summer cessation and autumn onset, which was done for the first time in the context of dendrometer measurements as far as we know. Even constraining their search spaces by climatic thresholds did not improve their reliability, supporting concerns that such approaches are biased by growth curve shape, particularly for species with non-sigmoid (bimodal) growth patterns (Camarero et al., 2010). The estimation errors yielded by all methods were significantly higher than those of the 2STA. Only two exceptions were observed: the Gompertz-UIK and ZG methods estimated summer cessation with accuracy comparable to that of the 2STA (Supplementary Tables S4, S5). The differences in estimating phenological events between the 2STA and the other methods, reaching up to 28 days, are important not only due to the risk of obscuring phenology–climate relationships but also because of the influence that the growing season duration has on total growth attained. Yearly growth accumulated by trees can be strongly correlated with the duration of the growth period (Lempereur et al., 2017; Lempereur et al., 2015). Therefore, an accurate determination of phenological events seems crucial to precisely estimate the length of the active growth period. However, studies have also shown that the number of days with active growth, or the growth rate, has a stronger impact on total accumulated growth than the duration of the growth period (Etzold et al., 2022; Vieira et al., 2014).
Dendrometer data reflect two overlapping processes: stem swelling due to rehydration and xylem cell division (effective growth; Deslauriers et al., 2007). This overlap complicates the identification of spring onset, which is often preceded by large stem variations in winter. A similar issue arises before autumn onset, as rainfall can trigger immediate rehydration, mimicking growth on the dendrometer curve. The zero-growth concept (Zweifel et al., 2016) effectively addresses this problem by assuming that cambial activity can occur only when the stem is hydrated. By defining growth onset (spring or autumn) as the first instance when the previous maximum stem size is reached, the ZG method eliminates the misleading effects of hydration-driven fluctuations. Effectively, in our study, the ZG approach was the second most precise method for determining spring onset (Supplementary Table S5). However, it located spring onset too early, as seemingly winter rehydration alone can restore the previous stem size. Conversely, autumn onset was delayed since the ZG method requires the previous maximum to be surpassed, whereas we visually determined it as the start of steady positive growth after the summer depression. Given these limitations, we acknowledge that accurately determining the exact onset of cambial activity is impossible using dendrometer data alone (Cruz-García et al., 2019), especially when collected from manually measured band dendrometers. The 2STA was designed to reduce the risk of misidentifying both spring onset and autumn onset. Instead of relying on hydration levels or fixed percentiles, it compares growth rate distributions—contrasting the oscillatory fluctuations of inactive periods with the first sustained period of steady positive growth under favorable climatic conditions. While the 2STA does not aim to pinpoint the precise initiation of cell division, it provides a practical and systematic method for identifying the moment when continuous, measurable growth begins, making it particularly suited for band dendrometer data.
3.6 Implications and future directions
Future research could focus on refining climate-based thresholds for phenological event detection, particularly for Mediterranean species. Developing species-specific cambial reactivation indices based on heat accumulation could provide a more physiologically robust alternative to fixed temperature thresholds (Begum et al., 2013; Rahman et al., 2020) while also enhancing the 2STA. In addition, integrating short-term growth fluctuation metrics (e.g., the CUSUM chart, Korpela et al., 2010) to refine phenological event detection in manually collected dendrometer data for trees with bimodal growth patterns would be interesting.
In summary, our results suggest that manually measured band dendrometers—when analyzed correctly—can yield phenological event estimates nearly as precise as those obtained using automated dendrometers, which themselves deviated by 9 to 13 days from microcores analysis (Miller et al., 2022). Furthermore, the lower resolution of band dendrometers may actually help reduce errors by smoothing out high-frequency fluctuations (Deslauriers et al., 2007). Nonetheless, we acknowledge that automated dendrometers provide much more detailed daily information than manually measured devices. This provides deeper insights into xylogenesis –climate relationships by analyzing shrinkage-swelling patterns in response to daily weather variations. Their use also offers more robust decoupling between rehydration and true xylem increment (as demonstrated by the applicability of the ZG concept) due to the much higher data recording frequency. Therefore, we strongly advocate using automated dendrometers in intra-annual tree growth studies, whenever possible. If, for any reason, this option is not available, the 2STA offers a viable alternative when only manually measured band dendrometers are available, as these devices are cheaper and therefore more accessible. By avoiding distortions from smoothing and integrating climatic thresholds, the 2STA provides a promising new approach for phenological event detection, particularly for species with complex growth patterns. The phenological events estimated by the 2STA almost imitated the reference ones, except for year cessation. However, it is important to remember that we established the reference phenological events visually. Although this approach has been used before (Korpela et al., 2010), future studies would benefit from long-term location monitoring of cambial phenology and wood formation dynamics (xylogenesis) using microcores as a reference, thereby eliminating any subjective bias. Therefore, we acknowledge that our method must be validated on other datasets to overcome a possibly major limitation of this study— the lack of a reference robust enough to validate the 2STA without any doubt.
4 Conclusion
The two-stage threshold approach (2STA) represents both a conceptual and practical shift from traditional phenological event detection methods. Unlike conventional approaches that rely on smoothed growth curves and arbitrary percentile thresholds—often misaligned with the physiological realities of trees—the 2STA detects phenological events based on real changes in growth rate dynamics. By analyzing raw dendrometer data without distortion from curve fitting, the 2STA enables objective identification of growth onset and cessation, even in species with irregular or bimodal intra-annual growth. Its reliance on standardized growth rate distributions and climate-informed search windows makes it especially suited for manually measured dendrometer data, which are more accessible in under-resourced contexts. While it does not pinpoint the exact initiation of cambial activity, the 2STA reliably identifies the onset of sustained measurable growth, providing a practical bridge between dendrometer records and phenological inference. This method facilitates broader participation in intra-annual growth studies and offers a robust alternative in situations where high-resolution automated dendrometers or microcore data are unavailable. We acknowledge that the reference events used in this study were visually determined and thus could be subjective. Future validation using long-term xylogenesis data is essential to confirm the accuracy of the 2STA. Nonetheless, our findings suggest that the 2STA is a reliable and physiologically grounded tool for phenological research in trees with complex growth patterns.
Statements
Data availability statement
The datasets presented in this study can be found in online repositories. The names of the repository/repositories and accession number(s) can be found at: https://doi.org/10.5281/zenodo.14929969.
Author contributions
PJ: Conceptualization, Data curation, Formal analysis, Investigation, Methodology, Writing – original draft, Writing – review & editing. RC: Supervision, Validation, Writing – review & editing. JA: Conceptualization, Writing – review & editing. MG: Data curation, Writing – review & editing. GM: Data curation, Writing – review & editing. MP: Funding acquisition, Project administration, Supervision, Writing – review & editing.
Funding
The author(s) declare that financial support was received for the research and/or publication of this article. The study is supported by ETN Skill-For. Action project that has received funding from: (1) the European Union’s HORIZON 2020 research and innovation programme under the Marie Skłodowska - Curie Grant Agreement No. 956355; (2) Spanish Agencia Estatal de Investigación under the agreement PID2022-136906OB-C21. BEGINPINE; (3) Ministerio para la Transición Ecológica y el Reto Demográfico, within the project MITECO2023-AF. 20234TE005. TC MITECO-CSIC. Jorge Aldea’s work was supported by the grant RYC2021-033031-I, funded by MCIN/AEI/10.13039/501100011033 and by the European Union “NextGenerationEU/PRTR.”
Acknowledgments
We would like to thank the Forest Service of Junta de Castilla y León for facilitating the installation of sample plots in the El Carrascal forest.
Conflict of interest
The authors declare that the research was conducted in the absence of any commercial or financial relationships that could be construed as a potential conflict of interest.
Generative AI statement
The author(s) declare that no Gen AI was used in the creation of this manuscript.
Publisher’s note
All claims expressed in this article are solely those of the authors and do not necessarily represent those of their affiliated organizations, or those of the publisher, the editors and the reviewers. Any product that may be evaluated in this article, or claim that may be made by its manufacturer, is not guaranteed or endorsed by the publisher.
Supplementary material
The Supplementary material for this article can be found online at: https://www.frontiersin.org/articles/10.3389/ffgc.2025.1589579/full#supplementary-material
References
1
Aldea J. Bravo F. Vázquez-Piqué J. Ruíz-Peinado R. del Río M. (2021). Differences in stem radial variation between Pinus pinaster Ait. And Quercus pyrenaica Willd. May release inter-specific competition. For. Ecol. Manag.481:118779. doi: 10.1016/j.foreco.2020.118779
2
Aldea J. Rio M. Cattaneo N. Riofrío J. Ordóñez Alonso C. Uzquiano S. et al . (2023). Short-term effect of thinning on inter-and intra-annual radial increment in Mediterranean scots pine-oak mixed forests. For. Ecol. Manag.549:121462. doi: 10.1016/j.foreco.2023.121462
3
Askarieh A. del Río M. Aldea J. Riofrío J. Bravo F. (2024). Radial increment dynamics of maritime pine (Pinus pinaster Ait.) in pure and mixed stands with scots pine (Pinus sylvestris L.) under changing environmental conditions. Eur J Forest Res143, 671–686. doi: 10.1007/s10342-023-01650-0
4
Battipaglia G. Kabala J. P. Pacheco-Solana A. Niccoli F. Bräuning A. Campelo F. et al . (2023). Intra-annual density fluctuations in tree rings are proxies of air temperature across Europe. Sci. Rep.13:12294. doi: 10.1038/s41598-023-39610-8
5
Begum S. Kudo K. Rahman M. H. Nakaba S. Yamagishi Y. Nabeshima E. et al . (2018). Climate change and the regulation of wood formation in trees by temperature. Trees32, 3–15. doi: 10.1007/s00468-017-1587-6
6
Begum S. Nakaba S. Yamagishi Y. Oribe Y. Funada R. (2013). Regulation of cambial activity in relation to environmental conditions: understanding the role of temperature in wood formation of trees. Physiol. Plant.147, 46–54. doi: 10.1111/j.1399-3054.2012.01663.x
7
Burkhart H. E. Tomé M. (2012). Modeling Forest trees and stands. Netherlands, Dordrecht: Springer.
8
Camarero J. J. Olano J. M. Parras A. (2010). Plastic bimodal xylogenesis in conifers from continental Mediterranean climates. New Phytol.185, 471–480. doi: 10.1111/j.1469-8137.2009.03073.x
9
Camarero J. J. Rubio-Cuadrado Á. Gazol A. (2021). Climate windows of intra-annual growth and post-drought recovery in Mediterranean trees. Agric. For. Meteorol.308-309:108606. doi: 10.1016/j.agrformet.2021.108606
10
Christopoulos D. , (2016). Introducing unit invariant knee (UIK) as an objective choice for elbow point in multivariate data analysis techniques. Available at SSRN: https://ssrn.com/abstract=3043076 or http://dx.doi.org/10.2139/ssrn.3043076 (Accessed March 01, 2016).
11
Cruz-García R. Balzano A. Čufar K. Scharnweber T. Smiljanić M. Wilmking M. (2019). Combining Dendrometer series and Xylogenesis imagery—DevX, a simple visualization tool to explore plant secondary growth phenology. Front. For. Glob. Change2:60. doi: 10.3389/ffgc.2019.00060
12
Cuny H. E. Fonti P. Rathgeber C. B. K. von Arx G. Peters R. L. Frank D. C. (2019). Couplings in cell differentiation kinetics mitigate air temperature influence on conifer wood anatomy. Plant Cell Environ.42, 1222–1232. doi: 10.1111/pce.13464
13
D’Orangeville L. Itter M. Kneeshaw D. Munger J. W. Richardson A. D. Dyer J. M. et al . (2022). Peak radial growth of diffuse-porous species occurs during periods of lower water availability than for ring-porous and coniferous trees. Tree Physiol.42, 304–316. doi: 10.1093/treephys/tpab101
14
de Dios García J. Manso R. Calama R. Fortin M. Pardos M. (2018). A new multifactorial approach for studying intra-annual secondary growth dynamics in Mediterranean mixed forests: integrating biotic and abiotic interactions. Can. J. For. Res.48, 333–344. doi: 10.1139/cjfr-2017-0139
15
de Lara N. O. T. da Silva M. R. Nogueira A. Marcati C. R. (2017). Duration of cambial activity is determined by water availability while cambial stimulus is day-length dependent in a Neotropical evergreen species. Environ. Exp. Bot.141, 50–59. doi: 10.1016/j.envexpbot.2017.07.001
16
de Luis M. Novak K. Raventós J. Gričar J. Prislan P. Čufar K. (2011). Cambial activity, wood formation and sapling survival of Pinus halepensis exposed to different irrigation regimes. For. Ecol. Manag.262, 1630–1638. doi: 10.1016/j.foreco.2011.07.013
17
De Swaef T. De Schepper V. Vandegehuchte M. W. Steppe K. (2015). Stem diameter variations as a versatile research tool in ecophysiology. Tree Physiol.35, 1047–1061. doi: 10.1093/treephys/tpv080
18
Deslauriers A. Rossi S. Anfodillo T. , (2007). Dendrometer and intra-annual tree growth: What kind of information can be inferred?Dendrochronologia.25, 113–124. doi: 10.1016/j.dendro.2007.05.003
19
Deslauriers A. Rossi S. Anfodillo T. Saracino A. (2008). Cambial phenology, wood formation and temperature thresholds in two contrasting years at high altitude in southern Italy. Tree Physiol.28, 863–871. doi: 10.1093/treephys/28.6.863
20
Drew D. M. Downes G. M. (2009). The use of precision dendrometers in research on daily stem size and wood property variation: A review. Dendrochronologia.27, 159–172. doi: 10.1016/j.dendro.2009.06.008
21
Drew D. M. Downes G. M. (2018). Growth at the microscale: long term thinning effects on patterns and timing of intra-annual stem increment in radiata pine. For. Ecosyst.5, 1–13. doi: 10.1186/s40663-018-0153-z
22
Etzold S. Sterck F. Bose A. K. Braun S. Buchmann N. Eugster W. et al . (2022). Number of growth days and not length of the growth period determines radial stem growth of temperate trees. Ecol. Lett.25, 427–439. doi: 10.1111/ele.13933
23
Gutiérrez E. Campelo F. Camarero J. J. Ribas M. Muntán E. Nabais C. et al . (2011). Climate controls act at different scales on the seasonal pattern of Quercus ilex L. stem radial increments in NE Spain. Trees25, 637–646. doi: 10.1007/s00468-011-0540-3
24
Instituto Tecnológico Agrario de Castilla y León , (2025). Inforiego. Available online at: https://www.inforiego.org/opencms/opencms (accessed 5.11.25).
25
Knüsel S. Peters R. L. Haeni M. Wilhelm M. Zweifel R. (2021). Processing and extraction of seasonal tree physiological parameters from stem radius time series. Forests12:765. doi: 10.3390/f12060765
26
Korpela M. Mäkinen H. Nöjd P. Hollmén J. Sulkava M. (2010). Automatic detection of onset and cessation of tree stem radius increase using dendrometer data. Neurocomputing, Subspace Learning/Selected papers from the European Symposium on Time Series Prediction73, 2039–2046. doi: 10.1016/j.neucom.2009.11.035
27
Lempereur M. Limousin J.-M. Guibal F. Ourcival J.-M. Rambal S. Ruffault J. et al . (2017). Recent climate hiatus revealed dual control by temperature and drought on the stem growth of Mediterranean Quercus ilex. Glob. Chang. Biol.23, 42–55. doi: 10.1111/gcb.13495
28
Lempereur M. Martin-StPaul N. K. Damesin C. Joffre R. Ourcival J.-M. Rocheteau A. et al . (2015). Growth duration is a better predictor of stem increment than carbon supply in a Mediterranean oak forest: implications for assessing forest productivity under climate change. New Phytol.207, 579–590. doi: 10.1111/nph.13400
29
Mäkinen H. Seo J.-W. Nöjd P. Schmitt U. Jalkanen R. (2008). Seasonal dynamics of wood formation: a comparison between pinning, microcoring and dendrometer measurements. Eur J Forest Res127, 235–245. doi: 10.1007/s10342-007-0199-x
30
McMahon S. M. Parker G. G. (2015). A general model of intra-annual tree growth using dendrometer bands. Ecol. Evol.5, 243–254. doi: 10.1002/ece3.1117
31
Miller T. W. Stangler D. F. Larysch E. Honer H. Seifert T. Kahle H.-P. (2022). A methodological framework to optimize models predicting critical dates of xylem phenology based on dendrometer data. Dendrochronologia72:125940. doi: 10.1016/j.dendro.2022.125940
32
Nguyen T. T. T. Bae E.-K. Tran T. N. A. Lee H. Ko J.-H. (2023). Exploring the seasonal dynamics and molecular mechanism of Wood formation in gymnosperm trees. Int. J. Mol. Sci.24:8624. doi: 10.3390/ijms24108624
33
Olivar J. Rais A. Pretzsch H. Bravo F. (2022). The impact of climate and Adaptative Forest management on the intra-annual growth of Pinus halepensis based on long-term Dendrometer recordings. Forests13:935. doi: 10.3390/f13060935
34
Oswald S. A. Nisbet I. C. T. Chiaradia A. Arnold J. M. (2012). Flex Param curve: R package for flexible fitting of nonlinear parametric curves. Methods Ecol. Evol.3, 1073–1077. doi: 10.1111/j.2041-210X.2012.00231.x
35
Peñuelas J. Sardans J. (2021). Global change and Forest disturbances in the Mediterranean Basin: breakthroughs, knowledge gaps, and recommendations. Forests12:603. doi: 10.3390/f12050603
36
R Core Team , (2024). R: A language and environment for statistical computing. R Foundation for Statistical Computing, Vienna, Austria. Available at: https://www.R-project.org/
37
Rahman M. H. Begum S. Nugroho W. D. Nakaba S. Funada R. (2022). The effects of watering on cambial activity in the stems of evergreen hardwood (Samanea saman) during the pre-monsoon season in subtropical Bangladesh. J. Wood Sci.68, 1–13. doi: 10.1186/s10086-022-02053-2
38
Rahman M. H. Kudo K. Yamagishi Y. Nakamura Y. Nakaba S. Begum S. et al . (2020). Winter-spring temperature pattern is closely related to the onset of cambial reactivation in stems of the evergreen conifer Chamaecyparis pisifera. Sci. Rep.10:14341. doi: 10.1038/s41598-020-70356-9
39
Rashid M. H. U. Li Y. Farooq T. H. Ahmad I. Nawaz M. F. Sohail M. et al . (2024). Influence of cambium mechanism in Plantsin relation to different environmental stresses. Pol. J. Environ. Stud.33, 503–514. doi: 10.15244/pjoes/171578
40
Rossi S. Deslauriers A. Griçar J. Seo J.-W. Rathgeber C. B. Anfodillo T. et al . (2008). Critical temperatures for xylogenesis in conifers of cold climates. Glob. Ecol. Biogeogr.17, 696–707. doi: 10.1111/j.1466-8238.2008.00417.x
41
Strieder E. Vospernik S. (2021). Intra-annual diameter growth variation of six common European tree species in pure and mixed stands. Silva Fennica55:10449. doi: 10.14214/sf.10449
42
van der Maaten E. Pape J. van der Maaten-Theunissen M. Scharnweber T. Smiljanić M. Cruz-García R. et al . (2018). Distinct growth phenology but similar daily stem dynamics in three co-occurring broadleaved tree species. Tree Physiol.38, 1820–1828. doi: 10.1093/treephys/tpy042
43
van der Maaten E. van der Maaten-Theunissen M. Smiljanić M. Rossi S. Simard S. Wilmking M. et al . (2016). Dendromete R: analyzing the pulse of trees in R. Dendrochronologia40, 12–16. doi: 10.1016/j.dendro.2016.06.001
44
Vieira J. Carvalho A. Campelo F. (2020). Tree growth under climate change: evidence from Xylogenesis timings and kinetics. Front. Plant Sci.11:90. doi: 10.3389/fpls.2020.00090
45
Vieira J. Rossi S. Campelo F. Freitas H. Nabais C. (2014). Xylogenesis of Pinus pinaster under a Mediterranean climate. Ann. For. Sci.71, 71–80. doi: 10.1007/s13595-013-0341-5
46
Wood S. N. (2017). Generalized additive models: An introduction with R. New York: Chapman and Hall/CRC.
47
Zweifel R. Haeni M. Buchmann N. Eugster W. (2016). Are trees able to grow in periods of stem shrinkage?New Phytol.211, 839–849. doi: 10.1111/nph.13995
Summary
Keywords
stem radial variation, band dendrometers, Mediterranean forests, intraannual growth, parametric growth models, tree-ring phenology, xylem growth
Citation
Jankowski PA, Calama R, Aldea J, García M, Madrigal G and Pardos M (2025) Improving phenological event identification in trees using manually measured dendrometer data: conventional approaches vs. the novel two-stage threshold approach. Front. For. Glob. Change 8:1589579. doi: 10.3389/ffgc.2025.1589579
Received
07 March 2025
Accepted
27 May 2025
Published
18 June 2025
Volume
8 - 2025
Edited by
Gabriel Sangüesa-Barreda, University of Valladolid, Spain
Reviewed by
Thainna Waldburger, Digital Group, Agroscope Tänikon, Switzerland
Sugam Aryal, Friedrich-Alexander-Universität Erlangen-Nürnberg Institut für Geographie, Germany
Updates
Copyright
© 2025 Jankowski, Calama, Aldea, García, Madrigal and Pardos.
This is an open-access article distributed under the terms of the Creative Commons Attribution License (CC BY). The use, distribution or reproduction in other forums is permitted, provided the original author(s) and the copyright owner(s) are credited and that the original publication in this journal is cited, in accordance with accepted academic practice. No use, distribution or reproduction is permitted which does not comply with these terms.
*Correspondence: Przemysław A. Jankowski, przemyslawjankow@gmail.com
†ORCID: Rafael Calama, https://orcid.org/0000-0002-2598-9594
Jorge Aldea, https://orcid.org/0000-0003-2568-5192
Matías García, https://orcid.org/0000-0003-1428-9733
Guillermo Madrigal, https://orcid.org/0000-0002-1265-2124
Disclaimer
All claims expressed in this article are solely those of the authors and do not necessarily represent those of their affiliated organizations, or those of the publisher, the editors and the reviewers. Any product that may be evaluated in this article or claim that may be made by its manufacturer is not guaranteed or endorsed by the publisher.