Abstract
Timber harvesting plays an important role in determining how forest management practices influence carbon storage and sequestration patterns. We analyzed recent harvesting patterns across the eastern United States to quantify harvest area, intensity, and type of silviculture across timberlands. We observed timberland area harvested to vary considerably depending on how harvest occurrence was defined, ranging from 7.8 to 23.4 million hectares harvested between approximately 2016 and 2022. Harvest intensity, as measured by basal area removed in a stand if a harvest occurred, was similar across all ownerships, states, and regions (mean percent of basal area removed was 44.2 ± 29.3% [mean ± standard deviation]), but forest type-level differences were apparent, e.g., harvest intensity was greatest in aspen/birch forests in the Lake States (mean percent of basal area removed of 59.1 ± 31.2%). Policymakers, forest managers, and carbon project developers require an accurate assessment of baseline harvest rates to estimate potential tonnes of additional carbon dioxide equivalents generated in a forest carbon offset project. Using localized timber harvesting patterns derived from historical data will assist in prioritizing the silvicultural prescriptions with the greatest positive climate impacts while additionally informing policies and investments that value the natural capital that forests provide.
1 Introduction
Understanding the frequency and intensity of timber harvesting is essential to determine how forests store and sequester carbon. Including both natural and anthropogenic disturbances, harvesting is the dominant agent of disturbance in the northeastern US (Canham et al., 2013). In the Southern US, nearly 13 million hectares of pine plantations are managed, making it the “wood basket of the world” (Fox et al., 2007). There continues to be widespread interest across the eastern US to investigate the relationship between harvest practices and carbon sequestration patterns (Dangal et al., 2014; Brown et al., 2018; Gunn and Buchholz, 2018; Giffen et al., 2022; Papa et al., 2023; Brown et al., 2024). Landowner interest in implementing such “climate-smart forestry” practices (Ontl et al., 2019; Cooper and MacFarlane, 2023), defined as a branch of sustainable forest management whose goal is to manage forests in response to climate change (Bowditch et al., 2020), is being supported by a global voluntary carbon marketplace that rewards Improved Forest Management (IFM) practices through carbon credit payments. These credits are based on the performance of a project’s relevant carbon pools during a specified time period, often including harvested wood products as a part of those credits (Forest Trends’ Ecosystem Marketplace, 2024). The potential of IFM for carbon sequestration varies considerably by ecosystem type and ownership throughout this region. For example, private forestlands account for the majority of the 78% of the net carbon sink in all US forests (Domke et al., 2024), indicating the importance of examining ownership patterns in quantifying harvest removals.
With timber harvesting being such a widespread disturbance agent in eastern US forests (Canham et al., 2013; Brown et al., 2018), understanding existing harvest behavior is required to understand the potential impact of alternative forest management practices including both regulatory and voluntary carbon market programs relative to baseline practices. A baseline scenario is “a description of the situation and the outcome that is predicted or assumed to occur in the absence of the incentives created by the carbon credits and their associated mitigation activities, while holding all other factors constant” (Integrity Council for the Voluntary Carbon Market (ICVCM), 2024). From a forest management and forest carbon program perspective, this involves comparing the carbon sequestered on enrolled properties to the baseline (or “business as usual”) activity of similar unenrolled properties or a modelled scenario of carbon stored on the enrolled properties if they had not enrolled. The choice of how to define a baseline can result in orders of magnitude differences and subsequent over-crediting for a project (Griscom et al., 2009; Badgley et al., 2022). Periodically updated modeled and dynamic baselines, where enrolled properties are matched to a frequently updated control set of unenrolled properties based on similar ecosystem types, ownerships, and stocking levels, are adopted in some forest carbon methodologies (e.g., VM0045; Verra, 2024) and have many advantages over baseline techniques that rely on predictive models and their associated assumptions (Haya et al., 2023; Elias et al., 2025). Dynamic or updated baselines require a robust set of data with enough samples to compare to the enrolled property with reasonable statistical accuracy and uncertainty, and are remeasured at a frequency meaningful for detecting change for the duration of a carbon project (e.g., every 5 years). Data that characterize forest management behaviors (i.e., accessible roads, slope, ownership type, etc.) and the frequency and intensity of timber harvesting that has occurred in a localized area should be well documented in these data, as tree removals directly impact the amount of carbon stored and sequestered in the residual stand and in associated harvested wood products pools.
Dynamic baselines can depict harvesting practices in “near real time,” i.e., they can reflect current markets and forest management techniques implemented in localized regions, even when those conditions differ from what would have been assumed at the start of a carbon project or by an updated model. This is essential in regions such as the eastern US, where the previous 30 years has seen a tremendous change in ownership leading to more intensively managed plantations in the southern states and a decline in silvicultural investments in the northern states (D’Amato et al., 2017). Clearcutting as a silvicultural practice has declined in many eastern US forests (Windmuller-Campione et al., 2020; Maine Forest Service, 2024) as a result of forest regulations and the increasing influence of the public on forest management practices, leading to an increase in uneven or multi-aged silvicultural systems (D’Amato et al., 2017) or partial harvesting practices (Legaard et al., 2015). Silvicultural systems that employ selection cuttings have been shown promoting greater carbon storage (Kern et al., 2021), particularly when compared to results from even-aged treatments such as silvicultural clearcutting (Puhlick et al., 2016; Gunn and Buchholz, 2018). Intermediate stand treatments such as thinning also impact carbon sequestration and resulting stand growth and yield. For example, thinning from below the diameter distribution in Central Appalachian hardwood forests shows higher carbon sequestration rates compared to those thinned from above or throughout the range of the diameter distribution (Hoover and Stout, 2007). Hence, stand metrics such as changes in quadratic mean diameter pre- and post-thinning may help to identify trends in harvesting practices. In general, multi-aged management practices that seek to maintain or increase carbon stored in large mature trees can use thinning, selection cuttings, or shelterwoods as appropriate silvicultural techniques. These approaches can create a light environment that promotes the presence and abundance of small, young trees which can boost carbon sequestration rates while maintaining high carbon storage in mature trees (Nunery and Keeton, 2010; D'Amato et al., 2011; Kern et al., 2021). If an accurate assessment of timber harvest occurrence and intensity is observed in a baseline scenario, the uncertainty surrounding potential credits available in a carbon project can be reduced, while simultaneously minimizing overcrediting. Verra’s (2024) VM0045 methodology can be supported using national forest inventory data, hence, there is a direct need to detect harvest patterns using Forest Inventory and Analysis data for carbon projects located in the United States.
Economic drivers such as stumpage prices influence a landowner’s decision on whether or not to harvest (Prestemon and Wear, 2000; Silver et al., 2015; Zhao et al., 2020). Across the 48 conterminous US states, timber harvest frequency was found to be highest in forests with private compared to public ownerships (Wear and Coulston, 2024). At a regional level, Thompson et al. (2017) estimated an annual probability of a harvest event in the northeastern US to be 3% per year in privately-owned forests and half of that in publicly-owned forests (1.5% per year). Recent economic events in the last two decades have also resulted in a number of closures of mills and other wood processing facilities, decreasing the amount of wood harvested across many regions. The Great Recession spurred a loss of 1.1 million jobs across six forestry sectors in the US between 2005 and 2009 (Woodall et al., 2011). The COVID-19 pandemic beginning in 2020 resulted in several mill closures either on a temporary or permanent basis, particularly for pulp and paper mills (Stanturf and Mansuy, 2021). Turbulent changes within the forest products sector require the need to understand timber harvesting characteristics and trends to inform forest carbon baseline projections. Such an analysis is needed to develop robust, replicable methods for identifying harvests and characterizing their attributes to inform silvicultural strategies that can inform predictive growth and yield modeling. This helps policymakers, funders, and project implementors answer questions related to forest management prescriptions that have the greatest climate impact.
The goal of this work is to employ nationwide forest inventory data to investigate recent timber harvest removals, harvest intensity, and method of timber harvest removals across forestlands in the eastern US. Specific objectives are to (1) determine recent timber harvest occurrence in forests across different state and forest type groups, (2) evaluate alternative methods of determining timber harvest occurrence with inventory data, (3) quantify harvest intensity of removals, and (4) categorize methods of timber harvest removals by broad silviculture methods (e.g., clearcut or partial removals from above, below, or throughout a diameter range).
2 Materials and methods
2.1 Study region
Eastern US forests range from conifer, hardwood, and mixed-species forest types in the north to planted and natural forests of pine, oak/hickory, and oak/gum/cypress types in the south (Oswalt et al., 2019). Our study area ranged westward from Maine to Minnesota in the north and from Florida to east Texas and Oklahoma in the south. Approximately 171 million hectares of forestland exist in the region, of which 81% is privately-owned. Much of the annual timber harvest occurs in eastern US forests, with private lands in the southern and northern regions accounting for 58 and 15% of national timber removals, respectively (Oswalt et al., 2019). Measured on the capacity to grow industrial wood, productivity across this region ranged from as low as 1.4 to as high as 15.7 m3ha−1 yr.−1. We analyzed data within US region [based on the geographic variants suggested for use in the Forest Vegetation Simulator (Shaw, 2009; Supplementary Figure S1)], state, and forest type group. This level of analysis is based on an adequate number of forest inventory plots available to determine harvest occurrence and timber removal characteristics.
2.2 Forest inventory data
Data were compiled from the US Department of Agriculture–Forest Service’s Forest Inventory and Analysis (FIA program), a nationwide forest inventory of the US (Westfall et al., 2022). Phase 2 sample plots, the inventory phase in which data were compiled for this analysis, were established at an intensity of approximately one plot per 2,400 ha. These plots consisted of four 7.32-m fixed radius subplots where standing tree and site attributes were measured, for a total plot area of approximately 0.07 ha. All live and standing dead trees with a diameter at breast height (DBH) of at least 12.7 cm were measured on these subplots. Within each subplot a 2.07-m microplot was established where live trees with a DBH between 2.5 and 12.7 cm were measured. The most recent measurement on a plot was selected for analysis, ranging between 2012 and 2023, depending on US state. Plots were limited to those that were found on timberland, were not in reserved status, and displayed a minimum wood productivity potential of 1.4 m3ha−1 yr.−1. A total of 93 forest types representing 20 broader forest type groups (defined by FIA) were analyzed in this region.
The core FIA data tables used were the plot (PLOT), condition (COND), population stratum (POP_STRATUM), and population plot stratum assignment tables (POP_PLOT_STRATUM_ASSGN). Forest inventory data were summarized at the condition level to quantify total area harvested within each state during the most recent measurement cycle, identified through the POP_STRATUM.EVALID variable. All conditions within an inventory plot were summarized. We replicated population estimates provided by the FIA program by weighting plot conditions by their population stratum and the corresponding timberland area that the stratum represented (i.e., the expansion factor; POP_STRATUM.EXPNS; see link to available code below).
2.3 Harvest occurrence
The FIA program designates several variables to represent the cutting at the tree and condition level, including a code indicating whether a plot was treated by removing one or more trees in a stand (COND.TRTCD = 10) and a code indicating whether an individual tree was dead and its cause was due to harvesting or other silvicultural activity (TREE.STATUSCD = 2 and TREE.AGENTCD = 80). We summarized plot data to derive other attributes indicating changes in stocking from one plot measurement to the next. To determine stocking prior to timber harvest, we calculated attributes based on data stored in the tree growth, removal, and mortality midpoint table (TREE_GRM_MIDPT), a data set that contains information for remeasured trees at the midpoint of the remeasurement period. Plot measurements ranged from between 5 and 11 years with the median midpoint between measurements of 3.5 years.
Compared to stocking prior to harvesting, these harvest definitions included if a plot’s basal area in live trees was reduced by more than 25% (BA_RED) and if more than 25% of the basal area in live trees were cut, as indicated by a TREE.AGENTCD = 80 (BA_RED_TREE). Similarly, we calculated metrics of relative density reductions that may have occurred related to cutting activities using the method presented in Ducey and Knapp (2010). After exploratory analysis, a 10% reduction threshold for the relative density metric aligned well with the 25% threshold used for basal area reductions and was used in this analysis. Harvest occurrence attributes included if a plot’s relative density in live trees was reduced by greater than 10% (RD_RED) and if more than 10% of the relative density in live trees were cut, as indicated by a TREE.AGENTCD = 80 (RD_RED_TREE). These five different variables were examined individually, and four additional harvest occurrence variables were determined which included each variable along with the COND.TRTCD variable and plot basal area in live trees was reduced. For example, harvest was noted to occur if the FIA plot was treated by removing one or more trees in a stand (i.e., COND.TRTCD = 10) and plot basal area in live trees was reduced, or if plot basal area in live trees was reduced by greater than 25% at remeasurement (abbreviated as TRTCD + BA_RED). For comparison, values representing area of forests treated annually by cutting were obtained from FIA estimates. The percent difference and correlation between area harvested for each of the definitions with FIA-derived estimates of area harvested was determined by calculating Pearson’s correlation coefficient. A summary of the 10 different harvest occurrence variables are presented in Table 1.
Table 1
| Abbreviation | Description | Hectares harvested (million) | Timberland harvested (%)1 | r with FIA estimate2 | Difference from FIA estimate (%) |
|---|---|---|---|---|---|
| TRTCD | FIA code indicating a condition was treated by removing of one or more trees in a stand. Does not include stands that were disturbed. | 13.9 | 9.4 | 0.99 | −19.2 |
| BA_RED | Condition basal area in live trees was reduced by greater than 25% at remeasurement. | 21.8 | 14.8 | 0.94 | 26.7 |
| BA_RED_TREE | Condition basal area in live trees was reduced by greater than 25%, as indicated by a tree-level harvest code. | 18.0 | 12.2 | 0.97 | 4.7 |
| RD_RED | Condition relative density in live trees was reduced by greater than 10% at remeasurement. | 7.8 | 5.3 | 0.92 | −54.7 |
| RD_RED_TREE | Condition relative density in live trees was reduced by greater than 10%, as indicated by a tree-level harvest code. | 8.0 | 5.4 | 0.96 | −53.5 |
| TRTCD + BA_RED | FIA code indicating a condition was treated by removing of one or more trees in a stand (and condition basal area in live trees was reduced) OR condition basal area in live trees was reduced by greater than 25% at remeasurement. | 23.8 | 16.2 | 0.94 | 38.4 |
| TRTCD + BA_RED_TREE | FIA code indicating a condition was treated by removing of one or more trees in a stand (and condition basal area in live trees was reduced) OR condition basal area in live trees was reduced by greater than 25%, as indicated by a tree-level harvest code. | 18.2 | 12.4 | 0.96 | 5.8 |
| TRTCD + RD_RED | FIA code indicating a condition was treated by removing of one or more trees in a stand (and condition basal area in live trees was reduced) OR condition relative density in live trees was reduced by greater than 10% at remeasurement. | 12.5 | 8.5 | 0.97 | −27.3 |
| TRTCD + RD_RED_TREE | FIA code indicating a condition was treated by removing of one or more trees in a stand (and condition basal area in live trees was reduced) OR condition relative density in live trees was reduced by greater than 10%, as indicated by a tree-level harvest code. | 11.0 | 7.5 | 0.98 | −36.0 |
| FIA estimate | FIA estimate using TRTCD obtained from EVALIDator, including disturbed stands. FIA code indicating a plot was treated by removing one or more trees in a stand. | 17.2 | 11.6 | - | - |
Overview of timber harvest occurrence variables calculated from Forest Inventory and Analysis (FIA) data across the eastern United States, approximately 2016 through 2022.
Note that all definitions except for last row exclude plots that experienced a natural disturbance over the remeasurement interval.
Total timberland area was 148.1 million hectares.
Pearson correlation coefficient with FIA estimates (USDA Forest Service, 2024); all p ≤ 0.001.
2.4 Harvest intensity and removals
For simplification, the COND.TRTCD variable (i.e., the FIA code indicated a condition was treated by removing of one or more trees in a stand) was used to subsequently inform harvest intensity and removal method. The amount and percent of basal area in live trees that was removed was used to represent harvest intensity. These removal amounts were compared to the code indicating harvest type (e.g., clearcut, partial harvest, commercial thinning; COND.HARVEST_TYPE_SRS) collected on a subset of our states in the southern US. For these states, we observed a mean basal area removal of 60.0% (SD = 38.0%) for plots designated as being clearcut. Similarly, Luppold and Bumgardner (2018) concluded that clearcuts removed 90% or more basal area in several eastern US states. For the purposes of labeling harvest intensity under a broad type of removal in this analysis, we designated any harvest that removed more and less than 70% of the live tree basal area as “clearcut” and “partial harvest,” respectively.
While quantifying harvest intensity allows one to understand the amount of timber removed in an entry, it does not characterize the size of trees removed or the harvest method. To characterize harvest removal method, we quantified the d/D ratio for each FIA plot (Smith et al., 1997), where d was the quadratic mean diameter (QMD) of removed trees (summarized from all trees in a plot if TREE.AGENTCD = 80) and D was the QMD of the plot immediately prior to harvest. To determine d, we computed the QMD of all trees that were cut and removed by human activity but were previously live (i.e., TREE.AGENTCD = 80 & TREE.PREV_STATUS_CD = 1). The midpoint diameter of trees prior to the harvest were used to determine QMD. The values for d/D indicated different removal methods: if d/D < 1.0 the removal indicates a removal from below (i.e., a low or free thinning); if d/D > 1.0 it indicates a removal from above (i.e., a dominant thinning); and if d/D = 1 it indicates a removal from throughout the diameter range (i.e., a “perfect geometric thinning”; Smith et al., 1997). We computed 95% confidence intervals for the d/D ratio to provide a wide range of variability in harvest practices and to label the removal method. If the confidence interval for d/D overlapped with the value 1, we labeled the method as a removal from throughout the diameter range. In contrast, if the confidence interval for d/D was entirely above or below the value 1, we labeled the method as trending toward a removal from above or below the diameter range, respectively. This analysis was conducted for each forest type group within a region if a minimum of 10 plots were harvested. If a minimum of 10 plots within a region/forest type group were labeled as being of planted or natural origin (loblolly/shortleaf pine and longleaf/slash pine in the Southern region, white/red/jack pine in the Lake States region) or were privately or publicly owned, harvest removal information was also calculated.
3 Results
The amount of timberland area harvested ranged considerably depending on how timber harvest occurrence was defined. Across all plots in the most recent evaluation period (generally between 5 and 7 years), harvest was determined to occur on as little as 7.8 million ha (5.3% of total timberland area; determined using the RD_RED variable) or as high as 23.4 million ha (16.2% of total timberland area; determined using the TRTCD + BA_RED variable; Table 1; Figure 1). Pearson’s correlation values between calculated state-level harvest areas and values calculated by the FIA program were significant (p ≤ 0.001), with r ranging from 0.92 to 0.98 (Table 1; Figure 2). Percent differences between state-level harvest areas and values calculated by the FIA program ranged from −54.7 to 38.4%. Harvest definitions that included relative density as a variable (e.g., RD_RED and RD_RED_TREE) tended to underestimate harvest areas relative to values determined by the FIA program, while definitions that included basal area as a variable (e.g., BA_RED and TRTCD + BA_RED) tended to overestimate harvest areas. Using the FIA program’s TRTCD variable, the three states with the greatest harvested areas were located in the South (Alabama, Georgia, and Louisiana) and the three states with the lowest harvested areas were located in the Northeast (New Jersey, Rhode Island, and Delaware; Supplementary Figure S2).
Figure 1
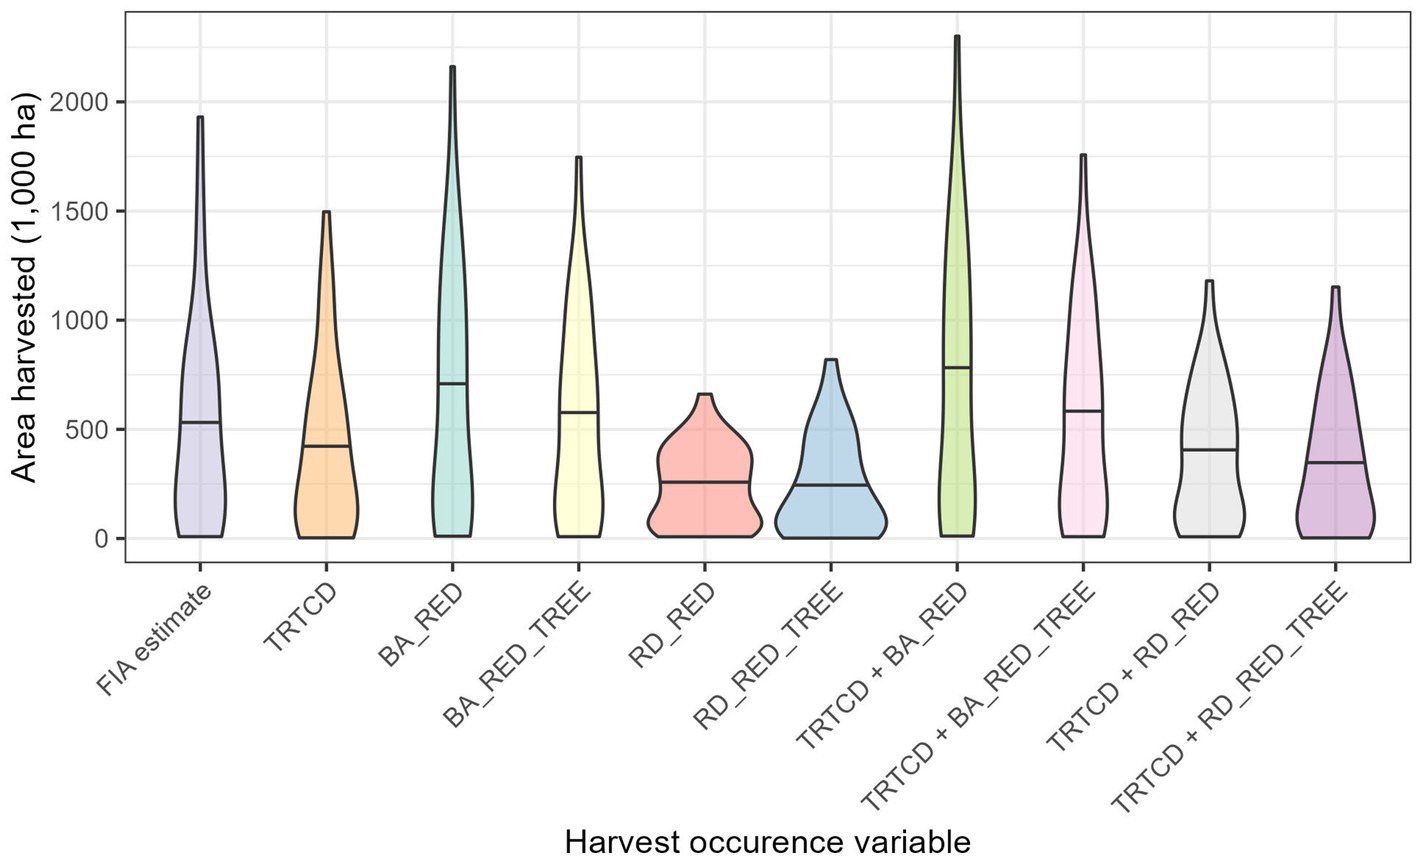
Distribution of timberland area harvested from approximately 2016 through 2022 in 33 eastern US states based on various definitions of timber harvest occurrence, with median values and comparison to Forest Inventory and Analysis estimates. Abbreviations are described in Table 1.
Figure 2
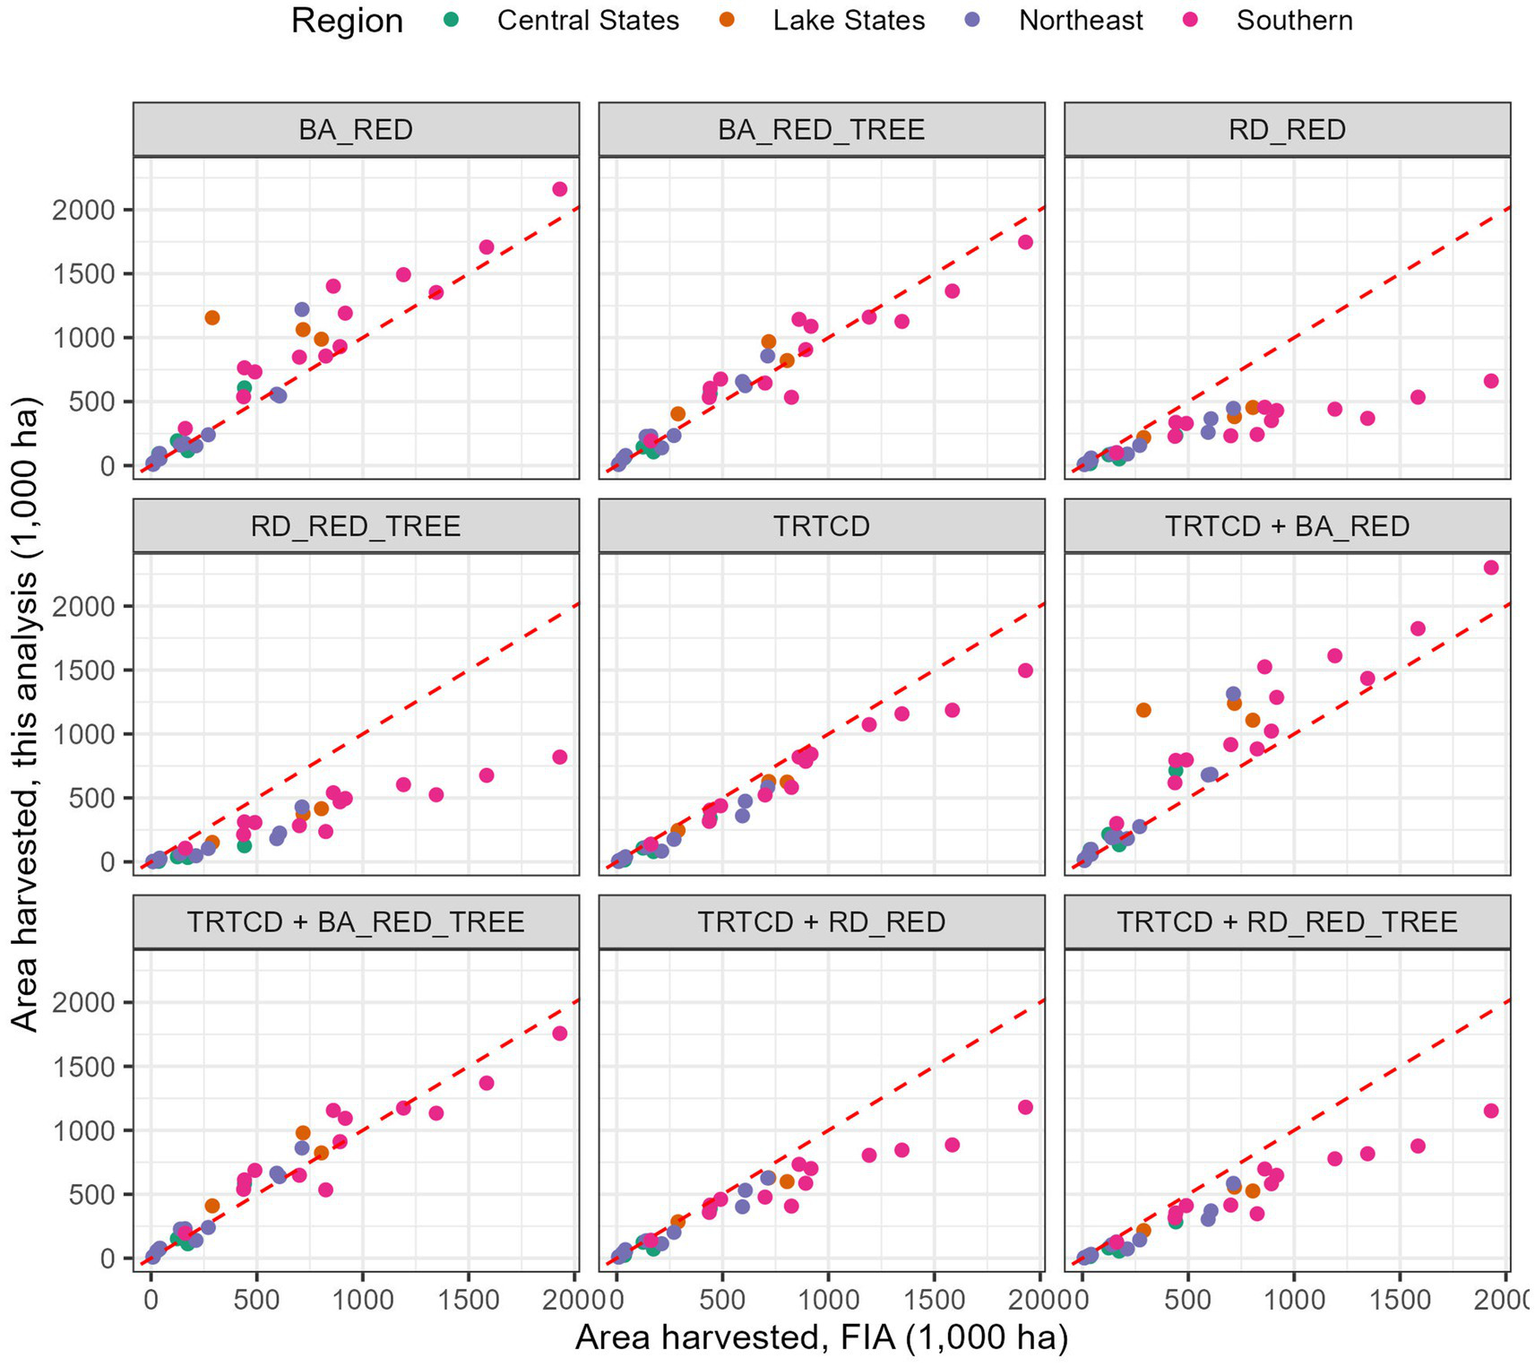
Comparisons of nine definitions determining timberland area harvested for 33 eastern US states from this analysis (described in Table 1) with those calculated from Forest Inventory and Analysis (FIA) data with 1:1 dashed line in red.
Using the FIA estimate, total timberland area harvested was 17.2 million ha across all ownerships from approximately 2016 through 2022. In total, 90% of all harvests occurred on privately-owned forests and in seven states, no harvests occurred on publicly-owned forests. More plot conditions were harvested on private lands for each state, with the exception of Minnesota (Supplementary Table S1). More plot conditions were harvested on private lands for each forest type located within a region, with the exception of aspen/birch forests in the Lake States (Supplementary Table S2). For forest types that had at least 10 FIA plots harvested within each stand origin type, the number of plot conditions harvested on planted stands exceeded natural stands for loblolly/shortleaf pine and longleaf/slash pine in the South and white/red/jack pine in the Lake States (Supplementary Table S3).
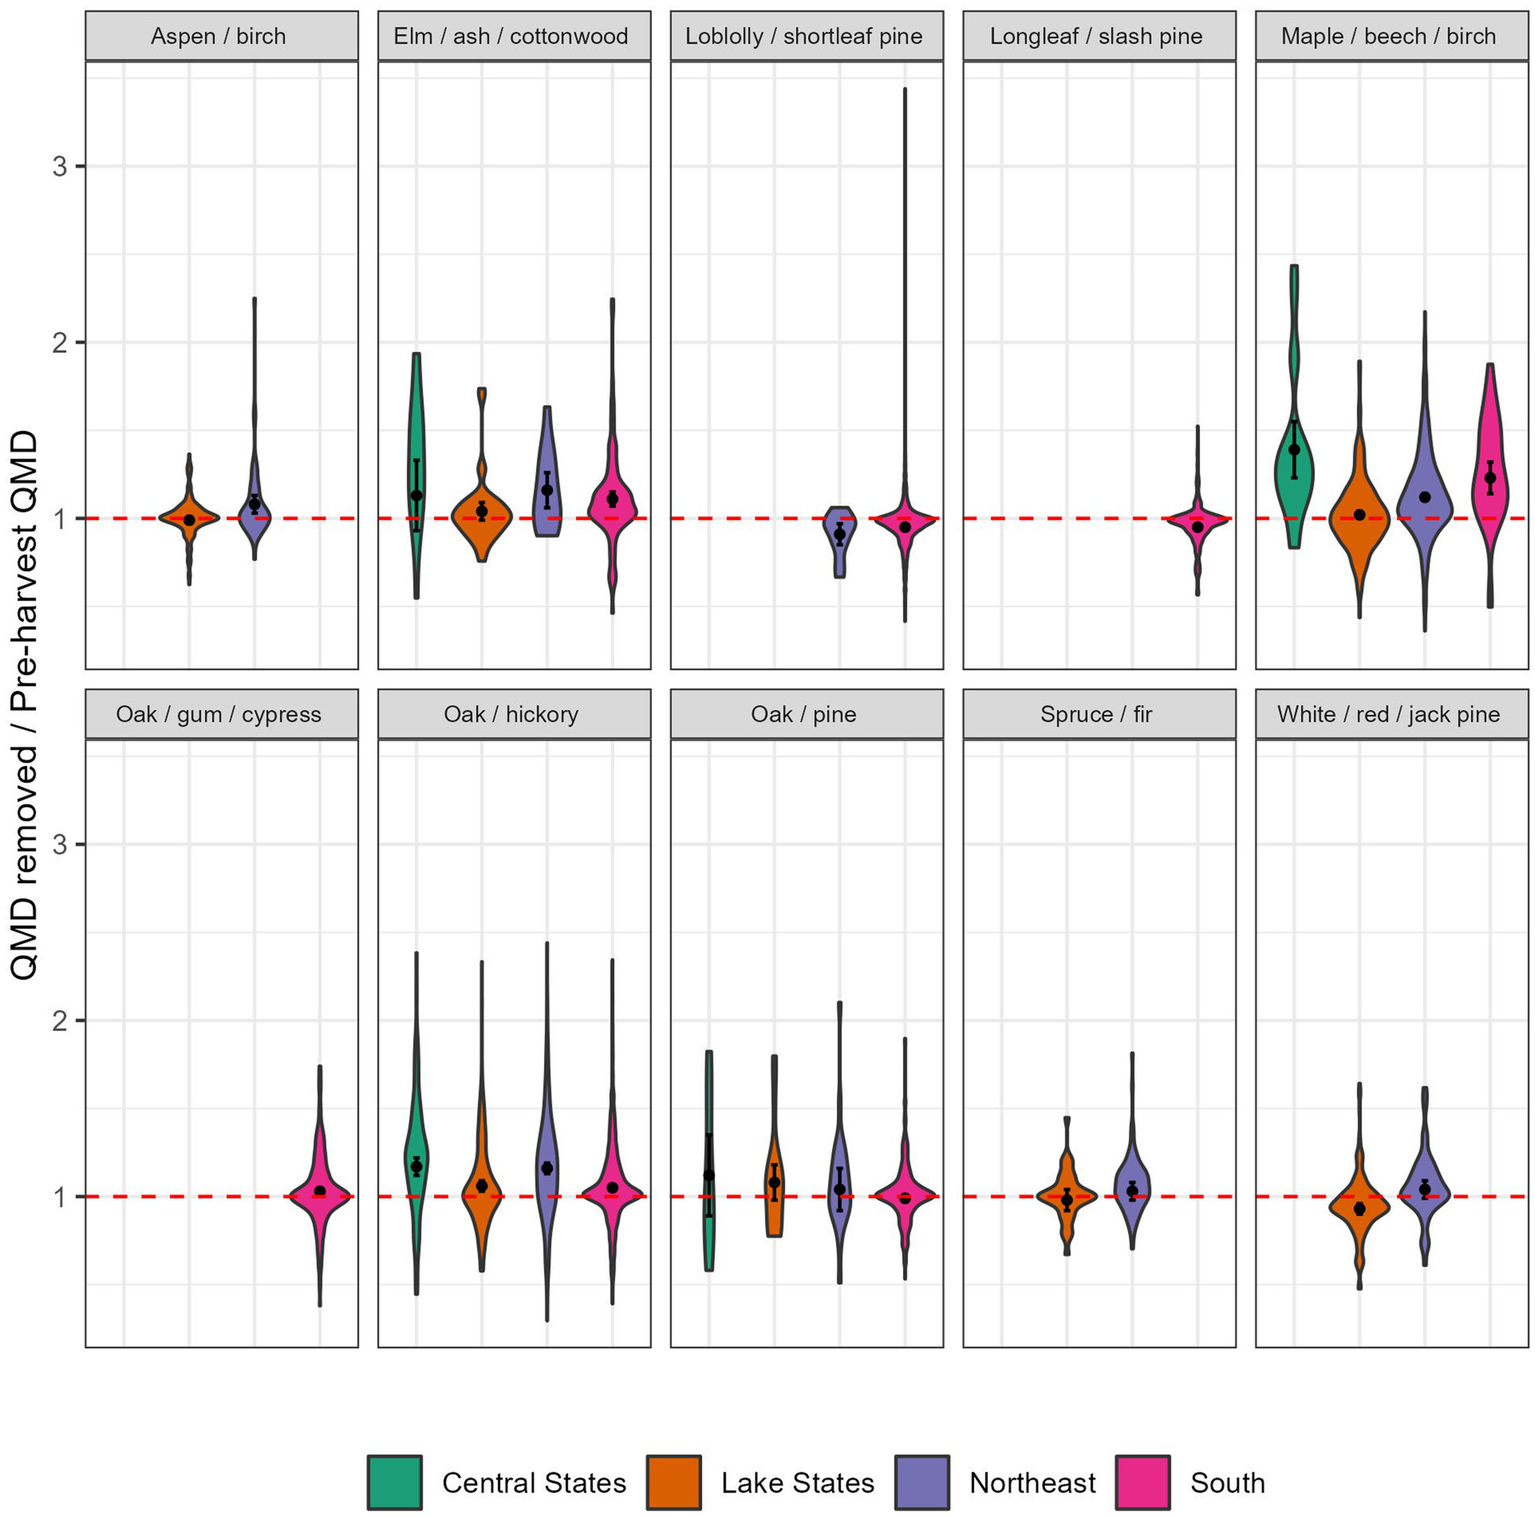
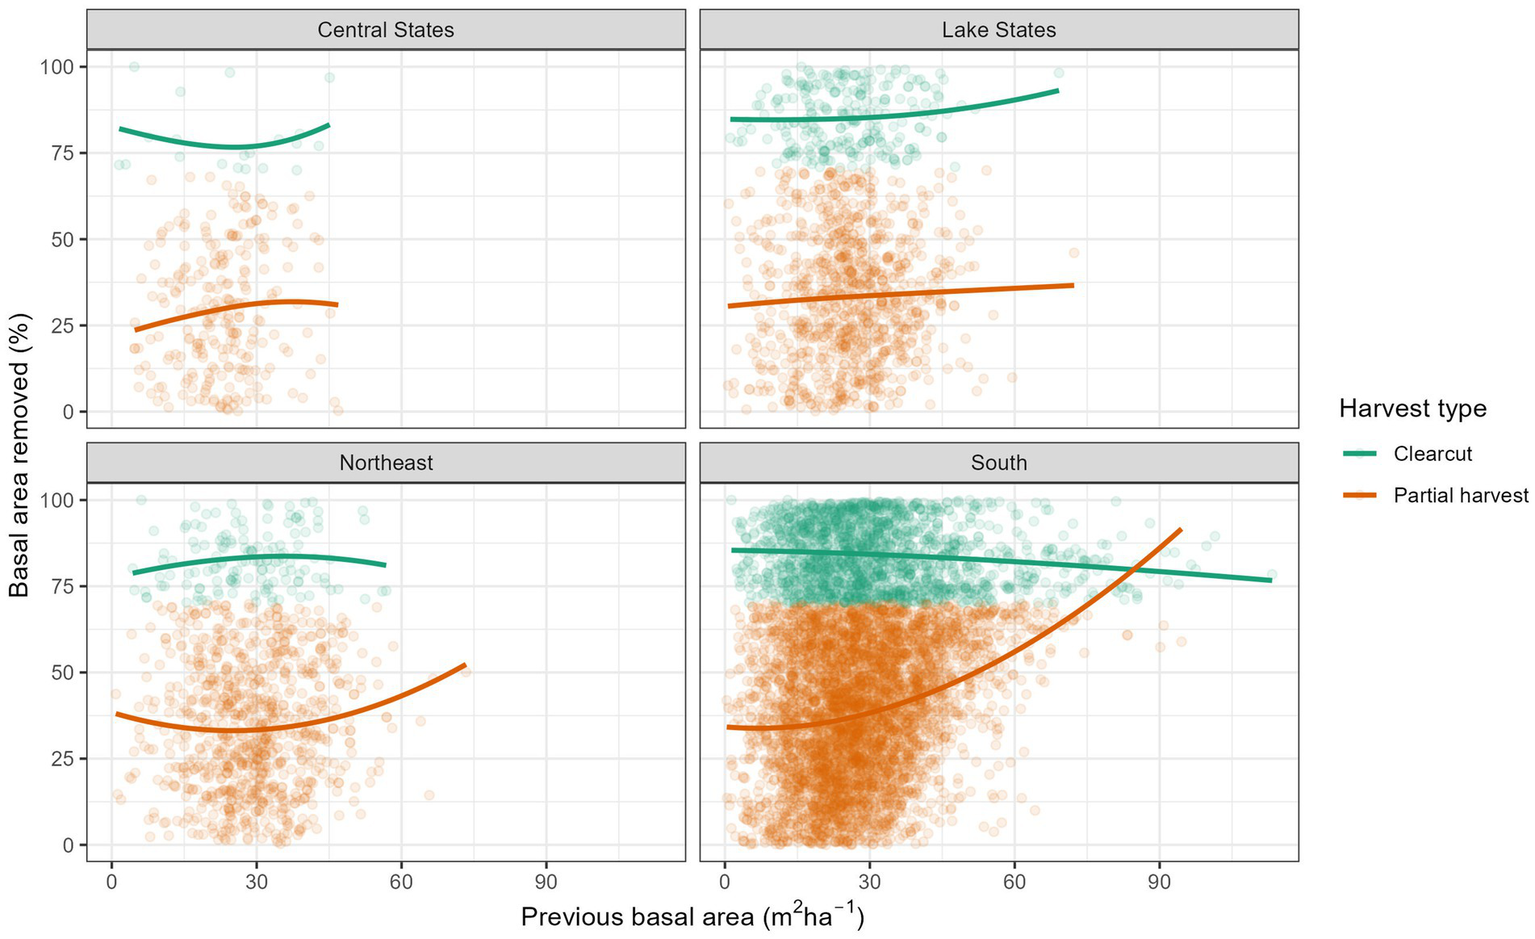
The average percent of basal area removed in all harvests was 44.2% (SD = 29.3), or an average basal area removed of 12.9 m2ha−1 (SD = 11.6). Mean harvest intensity was lowest in the Central States (27.5 ± 23.6%) and highest in the South (46.8 ± 29.6%; Table 2). Similarly, the greatest and lowest proportion of clearcuts were observed in the South and Central States (26.1 and 6.1% of harvested conditions, respectively; Figure 3). Within forest types, harvest intensity was greatest in aspen/birch stands in the Lake States (mean percent of basal area removed of 59.1 ± 31.2%) and lowest in maple/beech/birch stands in the Central States (26.4 ± 18.9%; Table 3). Average harvest intensity was greater on public forests compared to private forest ownerships in 10 out of 21 eastern US states that had a minimum of 10 harvests identified (Supplementary Table S1). After analyzing the d/D ratio of harvests, thinning from above and throughout the diameter range occurred on 42% of forest types each [11 out of 26 forest types_, followed by a removal from below (15%).] The forest types identified as trending towards removals from below included intensively managed conifers, i.e., pine in the South and Lake States regions (Figure 4).
Table 2
| State | Year of first inventory | Year of last inventory | Num conditions | Num conditions harvested | Num conditions not harvested | Mean (SD) basal area removed (m2ha−1) | Mean (SD) percent basal area removed |
|---|---|---|---|---|---|---|---|
| Central States | |||||||
| Illinois | 2016 | 2022 | 1,114 | 55 | 1,059 | 7.7 (8.7) | 29.4 (24.3) |
| Indiana | 2016 | 2022 | 1,087 | 84 | 1,003 | 6.8 (7.1) | 28.1 (25.7) |
| Iowa | 2017 | 2023 | 659 | 19 | 640 | 7.4 (7.5) | 33.4 (30.4) |
| Missouri | 2016 | 2022 | 3,469 | 212 | 3,257 | 6.0 (6.3) | 26.3 (21.9) |
| Lake States | |||||||
| Michigan | 2016 | 2022 | 4,981 | 420 | 4,561 | 11.1 (8.8) | 39.6 (27.6) |
| Minnesota | 2018 | 2022 | 7,475 | 334 | 7,141 | 13.1 (10.6) | 50.0 (30.2) |
| Wisconsin | 2016 | 2022 | 7,742 | 791 | 6,951 | 8.8 (7.9) | 35.7 (28.0) |
| Northeast | |||||||
| Connecticut | 2017 | 2023 | 347 | 11 | 336 | 8.6 (3.6) | 34.6 (18.6) |
| Delaware | 2017 | 2023 | 140 | 10 | 130 | 8.4 (4.6) | 25.8 (16.7) |
| Maine | 2018 | 2022 | 3,512 | 347 | 3,165 | 15.1 (10.4) | 47.7 (25.7) |
| Maryland | 2015 | 2021 | 421 | 23 | 398 | 8.9 (9.9) | 28 (29.3) |
| Massachusetts | 2016 | 2022 | 581 | 17 | 564 | 12.6 (6.5) | 37.4 (18.6) |
| New Hampshire | 2017 | 2023 | 1,063 | 75 | 988 | 12.6 (9.0) | 37.3 (24.5) |
| New Jersey | 2018 | 2022 | 664 | 9 | 655 | 15.1 (7.4) | 48.9 (26.5) |
| New York | 2016 | 2022 | 2,806 | 231 | 2,575 | 8.7 (7.8) | 30.0 (24.6) |
| Ohio | 2016 | 2022 | 1,638 | 96 | 1,542 | 8.9 (7.0) | 36.6 (25.4) |
| Pennsylvania | 2016 | 2022 | 3,147 | 260 | 2,887 | 8.2 (7.5) | 33.2 (26.2) |
| Rhode Island | 2016 | 2022 | 137 | 7 | 130 | 8.0 (9.1) | 26.0 (21.0) |
| Vermont | 2017 | 2023 | 928 | 65 | 863 | 12.1 (9.0) | 38.6 (23.3) |
| West Virginia | 2016 | 2022 | 2,211 | 113 | 2,098 | 9.9 (8.1) | 35.9 (26.1) |
| South | |||||||
| Alabama | 2015 | 2023 | 5,581 | 1,056 | 4,525 | 15.7 (13.7) | 48.8 (29.9) |
| Arkansas | 2019 | 2023 | 4,445 | 467 | 3,978 | 13.4 (11.9) | 43.4 (29.1) |
| Florida | 2014 | 2021 | 3,741 | 446 | 3,295 | 14.5 (12.2) | 53.8 (28.6) |
| Georgia | 2015 | 2022 | 6,309 | 921 | 5,388 | 13.8 (12.2) | 48.5 (29.8) |
| Kentucky | 2014 | 2020 | 3,005 | 246 | 2,759 | 9.2 (7.9) | 35.1 (24.8) |
| Louisiana | 2016 | 2022 | 3,175 | 696 | 2,479 | 17.4 (15.2) | 50.8 (29) |
| Mississippi | 2017 | 2022 | 5,088 | 677 | 4,411 | 12.3 (11.3) | 41.5 (29.6) |
| North Carolina | 2016 | 2023 | 4,518 | 523 | 3,995 | 16.3 (13) | 49.8 (29.6) |
| Oklahoma | 2013 | 2022 | 1,020 | 83 | 937 | 12.7 (8.7) | 54.9 (30) |
| South Carolina | 2017 | 2023 | 3,491 | 532 | 2,939 | 13.3 (12) | 43.1 (31.4) |
| Tennessee | 2012 | 2021 | 3,420 | 270 | 3,150 | 11.0 (8.9) | 40.8 (26.8) |
| Texas | 2007 | 2021 | 2,748 | 369 | 2,379 | 12.5 (10.8) | 45.8 (28.6) |
| Virginia | 2017 | 2023 | 3,983 | 262 | 3,721 | 17.2 (13.5) | 50.2 (30.3) |
Characteristics of Forest Inventory And Analysis Data by state across the eastern United States that contain timber harvest occurrence and removals.
Figure 3
Basal area removals by US region and harvest type in eastern US forests with smoothed regression line.
Table 3
| Forest type group | Num conditions harvested | Conditions partial harvested/clearcut (%) | Mean (SD) basal area removed (m2ha−1) | Mean (SD) percent basal area removed | Mean (95% confidence interval) d/D ratio1 | Removal method2 |
|---|---|---|---|---|---|---|
| Central States | ||||||
| Elm/ash/cottonwood | 32 | 89.7/10.3 | 6.2 (6.9) | 27.4 (27.1) | 1.13 (0.93, 1.33) | Throughout |
| Maple/beech/birch | 26 | 100/0 | 6.8 (6.9) | 26.4 (18.9) | 1.39 (1.23, 1.55) | Above |
| Oak/hickory | 278 | 94.2/5.8 | 6.3 (6.7) | 27.5 (23.6) | 1.17 (1.12, 1.22) | Above |
| Oak/pine | 13 | 100/0 | 6.7 (6.8) | 28.3 (20.4) | 1.12 (0.89, 1.35) | Throughout |
| Lake States | ||||||
| Aspen/birch | 342 | 54.6/45.4 | 15.5 (11.0) | 59.1 (31.2) | 0.99 (0.97, 1.01) | Throughout |
| Elm/ash/cottonwood | 53 | 64.4/35.6 | 13.5 (9.9) | 52.1 (28.3) | 1.04 (0.99, 1.09) | Throughout |
| Maple/beech/birch | 455 | 92.0/8.0 | 8.6 (7.1) | 31.5 (23.5) | 1.02 (1.00, 1.04) | Throughout |
| Oak/hickory | 306 | 82.7/17.3 | 8.7 (7.2) | 38.3 (27.5) | 1.06 (1.03, 1.09) | Above |
| Oak/pine | 35 | 92.0/8.0 | 7.8 (7.2) | 32.2 (23.8) | 1.08 (0.98, 1.18) | Throughout |
| Spruce/fir | 46 | 75.0/25.0 | 14.0 (11.9) | 46.0 (32.1) | 0.98 (0.92, 1.04) | Throughout |
| White/red/jack pine | 245 | 96.5/3.5 | 7.8 (7.4) | 26.8 (22.0) | 0.93 (0.90, 0.96) | Below |
| Northeast | ||||||
| Aspen/birch | 70 | 62.1/37.9 | 18.5 (12.0) | 57.1 (28.6) | 1.08 (1.03, 1.13) | Above |
| Elm/ash/cottonwood | 18 | 86.7/13.3 | 8.3 (4.7) | 43.7 (22.6) | 1.16 (1.06, 1.26) | Above |
| Loblolly/shortleaf pine | 15 | 70.0/30.0 | 9.1 (8.5) | 38.8 (28.7) | 0.91 (0.85, 0.97) | Below |
| Maple/beech/birch | 577 | 87.3/12.7 | 10.7 (8.8) | 37.2 (25.9) | 1.12 (1.10, 1.14) | Above |
| Oak/hickory | 328 | 91.7/8.3 | 8.6 (7.0) | 32.7 (24.0) | 1.16 (1.13, 1.19) | Above |
| Oak/pine | 35 | 86.7/13.3 | 10.7 (9.0) | 35.0 (28.8) | 1.04 (0.92, 1.16) | Throughout |
| Spruce/fir | 102 | 84.5/15.5 | 15.4 (10.8) | 44.5 (23.5) | 1.03 (0.98, 1.08) | Throughout |
| White/red/jack pine | 70 | 92.5/7.5 | 11.8 (9.9) | 32.9 (24.1) | 1.04 (0.99, 1.09) | Throughout |
| South | ||||||
| Elm/ash/cottonwood | 174 | 62.1/37.9 | 13.8 (10.8) | 55.6 (29.8) | 1.11 (1.07, 1.15) | Above |
| Loblolly/shortleaf pine | 4,601 | 80.7/19.3 | 14.4 (13.7) | 42.0 (28.5) | 0.95 (0.94, 0.96) | Below |
| Longleaf/slash pine | 663 | 77.3/22.7 | 12.9 (11.7) | 46.3 (27.6) | 0.95 (0.94, 0.96) | Below |
| Maple/beech/birch | 50 | 91.5/8.5 | 9.5 (8.2) | 35.6 (23.9) | 1.23 (1.14, 1.32) | Above |
| Oak/gum/cypress | 377 | 63.4/36.6 | 15.1 (11.3) | 54.0 (29.9) | 1.03 (1.01, 1.05) | Above |
| Oak/hickory | 2,336 | 66.8/33.2 | 13.3 (10.3) | 51.5 (29.8) | 1.05 (1.04, 1.06) | Above |
| Oak/pine | 858 | 63.6/36.4 | 14.1 (11.1) | 52.9 (30.8) | 0.99 (0.97, 1.01) | Throughout |
Timber harvest and removal characteristics by geographic region and forest type group in the eastern United States.
d is the quadratic mean diameter (QMD) of removed trees and D is the QMD of the plot at the midpoint between first and second measurement.
If d/D < 1.0, data indicate removal from below; if d/D > 1.0, data indicate removal from above; if d/D = 1, data indicate a removal from throughout the diameter range.
Figure 4
Distribution of quadratic mean diameter (QMD) in removed trees and pre-harvest QMD for 10 forest type groups located in four geographic regions in the eastern US. Violin plots show distributions of ratio of removed and pre-harvest QMD, points and error bars show mean and 95% confidence limits of ratio. Dashed red line indicates a “perfect geometric” removal of trees from throughout the diameter range, with values above and below 1 indicating removals from above and below the diameter range, respectively.
4 Discussion
Annual harvest occurrence determined from FIA estimates on eastern US timberlands indicates an annual area-based harvest rate of approximately 1.9%, a value similar to what others have found in eastern US forests. Thompson et al. (2017) observed an annual harvest rate of 2.6% in the northeastern region, yet those rates were gathered from FIA data only through the early- to mid-2010’s and would not reflect the time period we examined since approximately 2016. Belair and Ducey (2018) show annual harvest rates by county in the northeastern US ranging from 0 to 5.0%, with the majority of harvest rates less than 2.0%. Across the 48 conterminous US states, Wear and Coulston (2024) observed a harvest rate of 1.4% per year. Harvesting on public lands has been shown to be half as much compared to private lands in the northeastern US (Thompson et al., 2017), a finding that was similarly observed here. The finding of more harvesting on private lands also aligns with the finding that 88% of harvested wood in the US originates from private forests, including corporate and family forest ownerships (Butler and Sass, 2023). When analyzed by region, our analysis also aligns with other research that has observed elevated timber harvesting in Maine relative to the entire Northeast region (Belair and Ducey, 2018). Similarly, increased harvesting in the southern US reflects increased growth rates and intensive management practices that are implemented across the region (Fox et al., 2007) and the large number of mills that support the forest products industry (e.g., 1,363 mills located in a 12-state area in the southeastern US in 2011; Coulston et al., 2018).
Using data sources other than FIA (e.g., landowner surveys), annual harvest rates determined at a state level compared well with other published values (Table 4). In Minnesota, Windmuller-Campione et al. (2019) observed a 0.92% annual harvest rate (145,000 acres harvested from a total of 15.8 million acres of timberland in 2017; their Table 2), whereas we observed an approximate 0.89% rate using the FIA estimate. In Maine and across 16.7 million acres of timberland, harvest rates ranged from approximately 3.38% in 2000 (based on 567,000 acres harvested; Maine Forest Service, 2001) to 1.76% in 2021 (based on 295,000 acres harvested; Maine Forest Service, 2024), and we observed an approximate 1.98% harvest rate. In the Southern region, harvest rates in Virginia are approximately 1.50% (based on 230,775 acres harvested from a total of 15.4 million acres of timberland; Dangle et al., 2022), whereas we observed an approximate 0.93% annual harvest rate. Hence, FIA estimates of harvested timberland provided similar amounts compared to other assessments which used more local estimates, e.g., surveys of timberland harvested within a state. For the other harvest definitions, the underestimation of harvest areas when using relative density metrics could indicate less preference for using this variable to determine whether or not a timber harvest occurred. The overestimation of timberland harvest area using definitions that included basal area as a variable could be related to the use of the midpoint diameter in the calculation of pre-harvest basal area. This approach would lead to greater pre-harvest basal areas compared to values estimated from the last plot observation which could have occurred up to 7 years prior to the current measurement. Similarly, residual trees may see greater growth immediately following harvest which would increase stocking levels such as basal area, thus not representing an immediate post-harvest measurement considering the median number of years between measurements was 3.5 years. Hence, the temporal aspects of plot measurement cycles should be considered when evaluating timber harvest definitions. In addition, remote sensing products may assist in supplementing stocking estimates if forest growth is vigorous and the number of years between plot measurements is high (e.g., greater than 5 years; Coffield et al., 2022; Tamiminia et al., 2022).
Table 4
| US state | Annual harvest rate | Other study citation | |
|---|---|---|---|
| This study (approximate) | Other study | ||
| Minnesota | 0.89% | 0.92% | Windmuller-Campione et al. (2019) |
| Maine | 1.98% | 1.76–3.38% (year 2000 to 2024) | Maine Forest Service (2001, 2024) |
| Virginia | 0.93% | 1.50% | Dangle et al. (2022) |
Comparison of annual timber harvest rate calculation in three selected US states.
Our finding of an average basal area removal ranging from 26.4 to 59.1% aligns with other published studies, such as Thompson et al.’s (2017) study that observed basal area removals between 20 and 40% depending on ownership class. We did not observe major differences in harvest intensity rates comparing public and private ownerships, likely because of the variability in management regimes across ownerships. For example, Thompson et al. (2017) observed greater harvest intensities in forests owned by state agencies and private corporations and lower removals in forests owned by federal agencies and family forest owners. Additional examination of harvest occurrence and intensity by more specific ownership classes would help in understanding landowner behavior and actions related to harvesting, but would be hindered by fewer observations available when analyzing within states, regions, and forest type groups. Additionally, separating different private landowner classes (e.g., corporate versus family forest owners) is not possible using publicly available FIA data due to landowner confidentiality (Burrill et al., 2024). Hence, a limitation is not being able to quantify timber harvest practices within corporate and family forest owners, as both ownerships were considered private. Under some voluntary improved forest management methodologies, the identification of public and private ownerships may be sufficient for observation-based, matched dynamic baselines [e.g., Verra’s VM0045 methodology (Verra, 2024)] whereas others that utilize dynamic, modeled baselines require private forest ownership sub-categories for financial analysis (e.g., American Carbon Registry’s Methodology for Non-Federal US Forestlands (American Carbon Registry (ACR), 2024) requires use of a discount rate in modeling that ranges from 3% for non-governmental organization ownerships to 6% for private industrial ownerships). Future work could evaluate the influence of sub-ownership type as it relates to dynamic baseline reporting and their associated impacts to carbon project crediting.
The large proportion of plots that were clearcut in aspen/birch stands in the Lake States reflects silvicultural activities practiced in that region, due to aspen being shade intolerant and able to regenerate abundantly from root suckering. For example, 72% of the aspen forest type harvested in Minnesota in 2017 were clearcuts (Windmuller-Campione et al., 2019). Our percentage of plots that were clearcut in the Northeast (between 8.3 and 37.9%) were somewhat lower than reported by Belair and Ducey (2018), likely because our analysis included all harvests whereas their study excluded “incidental” harvests where a silvicultural technique could not have been identified. With more recent applications of ecological silviculture practices (Palik et al., 2020), harvest techniques in the future will be guided by mimicking natural disturbances and small-scale mortality, which will likely impact harvest intensity and its spatial distribution within a stand. Extending the rotation lengths of forests or reducing the frequency of harvest entries can promote greater carbon stocks in forests (McKinley et al., 2011; Ontl et al., 2019). Extending rotation ages may be considered in current and future carbon project practices, for which an accurate depiction of harvest characteristics is required to avoid under- or over-crediting (Elias et al., 2025). This work characterizes timber harvest patterns by region and forest type that can be used to inform forest carbon baselines that depict silvicultural technique (e.g., clearcut or partial harvest), harvest intensity (e.g., proportion of basal area removed), and harvest removal method (e.g., thinning from above). There is currently regional variability in the type of ownerships enrolled in forest carbon programs in the eastern US, with corporate landowner enrollments more common in the Southern region. This analysis by region and forest type can inform harvest practices likely to produce a climate benefit, while many methodologies, particularly ones from voluntary carbon programs (American Carbon Registry (ACR), 2024; Verra, 2024), will likely use more localized data to establish baselines for crediting the impact of those practices.
Analyses that integrate the d/D ratio as a measure of harvest removal method can inform subsequent growth patterns in harvested stands. For example, thinning from below the diameter distribution can result in higher carbon sequestration rates compared to other removal methods (Hoover and Stout, 2007). We observed that several forest types removed trees from above the diameter distribution, where larger trees were selected to be harvested. Forest types that showed removals from smaller trees (i.e., from below) were ones that are intensively managed and likely include thinning treatments that were conducted prior to a final harvest, e.g., pine forests in the Southern and Lakes States regions. The calculation of the d/D ratio also required the use of measurements collected on individual trees, namely the identification of recently harvested trees.
The ability to quantify the d/D ratio is important to inform improved forest carbon practices and baselines. This metric can account for the management interventions that can both increase carbon sequestered without reducing harvested wood products or triggering leakage principles, in which activities that may cause emissions like harvesting are shifted from within a project boundary to outside it. The d/D ratio can also provide an objective approach for specifying the thinning method (e.g., from above or below) in growth and yield models such as the Forest Vegetation Simulator (Crookston and Dixon, 2005). Users can calculate QMD values before and after harvests, then make judgments based on visualizations of distributions (e.g., Figure 4) or determining confidence intervals of the d/D ratio (e.g., Table 3) to identify if removals are conducted from below, throughout, or above the diameter range. A limitation of the d/D metric is the requirement of both pre- and post-harvest forest inventory data, in particular for quantifying the mean diameter of trees removed in a timber harvest. However, nationwide forest inventories will likely have these data available. This approach provides greater resolution about the characteristics of a harvest and makes better use of the complete suite of harvesting and removals data collected from inventories. Furthermore, accurate depiction of harvest occurrence and intensity can refine methodologies supporting forest carbon accounting frameworks, identified as a priority for growth and yield models (Woodall et al., 2025).
5 Conclusion
These results can inform forest carbon baseline projections through understanding the extent and intensity of harvest activities within a region, state, or forest type. The uncertainties surrounding baselines are reduced when integrating historical practices into baseline estimates (Haya et al., 2023). Reducing the uncertainty around ex-ante, dynamic baseline projections, used in tandem with ex-post, dynamic baseline accounting for crediting, is critical to project design and the ability to reliably predict credit production from project interventions that affect harvesting behaviors. Such reliability and de-risking is essential to creating investment-grade forest carbon projects that enable scaling nature-based climate solutions to the level required to achieve global climate mitigation goals (Food and Agriculture Organization of the United Nations (FAO), 2022). Here we report recent harvest patterns since approximately 2016, which should be assessed in addition to predicted harvest patterns to inform deployment of forest carbon projects. This approach to quantifying timber harvesting patterns across public and private ownerships can guide carbon project developers and standards-setting bodies to establish reliable ex-ante credit projections to enable ex-post dynamic baseline project investment, prioritize project deployment and silvicultural practices incentivized to those likely to have the greatest climate impact, and inform policies focused on valuing the natural capital that forests provide.
Statements
Data availability statement
The original contributions presented in the study are included in the article/Supplementary material, further inquiries can be directed to the corresponding author.
Author contributions
MR: Writing – original draft, Conceptualization, Methodology, Writing – review & editing. CC: Writing – review & editing, Conceptualization, Methodology. LR: Conceptualization, Writing – review & editing. NM: Methodology, Conceptualization, Writing – review & editing. JG: Conceptualization, Writing – review & editing. EB: Writing – review & editing, Methodology, Conceptualization. SB: Conceptualization, Methodology, Writing – review & editing.
Funding
The author(s) declare that financial support was received for the research and/or publication of this article. This work was supported in part by funding from the Bezos Earth Fund.
Acknowledgments
We thank Richard Campbell, Maria Huyer, Blake Troxel, and field staff and foresters from the American Forest Foundation and The Nature Conservancy for discussions that improved this work.
Conflict of interest
Author MR was employed by company Arbor Analytics.
The remaining authors declare that the research was conducted in the absence of any commercial or financial relationships that could be construed as a potential conflict of interest.
Generative AI statement
The author(s) declare that no Gen AI was used in the creation of this manuscript.
Publisher’s note
All claims expressed in this article are solely those of the authors and do not necessarily represent those of their affiliated organizations, or those of the publisher, the editors and the reviewers. Any product that may be evaluated in this article, or claim that may be made by its manufacturer, is not guaranteed or endorsed by the publisher.
Supplementary material
The Supplementary material for this article can be found online at: https://www.frontiersin.org/articles/10.3389/ffgc.2025.1594324/full#supplementary-material
References
1
American Carbon Registry (ACR) (2024). Methodology for the quantification, monitoring, reporting and verification of greenhouse gas emission reductions and removals from improved forest management on non-Federal U.S. forestlands, ver. 2.1, July 2024 Available online at: https://acrcarbon.org/methodology/improved-forest-management-ifm-on-non-federal-u-s-forestlands/. (Accessed June 18, 2025).
2
Badgley G. Freeman J. Hamman J. J. Haya B. Trugman A. T. Anderegg W. R. L. et al . (2022). Systematic over-crediting in California's forest carbon offsets program. Glob. Chang. Biol.28, 1433–1445. doi: 10.1111/gcb.15943
3
Belair E. P. Ducey M. J. (2018). Patterns in forest harvesting in New England and New York: using FIA data to evaluate silvicultural outcomes. J. Forestry116, 273–282. doi: 10.1093/jofore/fvx019
4
Bowditch E. Santopuoli G. Binder F. del Río M. La Porta N. Kluvankova T. et al . (2020). What is climate-smart forestry? A definition from a multinational collaborative process focused on mountain regions of Europe. Ecosyst. Serv.43:101113. doi: 10.1016/j.ecoser.2020.101113
5
Brown M. L. Canham C. D. Buchholz T. Gunn J. S. Donovan T. M. (2024). Net carbon sequestration implications of intensified timber harvest in northeastern U.S. forests. Ecosphere15:e4758. doi: 10.1002/ecs2.4758
6
Brown M. L. Canham C. D. Murphy L. Donovan T. M. (2018). Timber harvest as the predominant disturbance regime in northeastern U.S. forests: effects of harvest intensification. Ecosphere9:e02062. doi: 10.1002/ecs2.2062
7
Burrill E.A. DiTommaso A.M. Turner J.A. Pugh S.A. Christensen G. Perry C.J. et al (2024). The forest inventory and analysis database, FIADB user guides, volume database description (version 9.3), nationwide forest inventory (NFI). U.S. Department of Agriculture, Forest Service. p. 1026. Available online at: https://research.fs.usda.gov/understory/forest-inventory-and-analysis-database-user-guide-nfi (Accessed June 18, 2025).
8
Butler B. J. Sass E. M. (2023). Wood supply from family forests of the United States: biophysical, social, and economic factors. For. Sci.69, 629–642. doi: 10.1093/forsci/fxad034
9
Canham C. D. Rogers N. Buchholz T. (2013). Regional variation in forest harvest regimes in the northeastern United States. Ecol. Appl.23, 515–522. doi: 10.1890/12-0180.1
10
Coffield S. R. Vo C. D. Wang J. A. Badgley G. Goulden M. L. Cullenward D. et al . (2022). Using remote sensing to quantify the additional climate benefits of California forest carbon offset projects. Glob. Chang. Biol.28, 6789–6806. doi: 10.1111/gcb.16380
11
Cooper L. MacFarlane D. (2023). Climate-smart forestry: promise and risks for forests, society, and climate. PLoS Clim.2:e0000212. doi: 10.1371/journal.pclm.0000212
12
Coulston J. W. Westfall J. A. Wear D. N. Edgar C. B. Prisley S. P. Treiman T. B. et al . (2018). Annual monitoring of US timber production: rationale and design. For. Sci.64, 533–543. doi: 10.1093/forsci/fxy010
13
Crookston N. L. Dixon G. E. (2005). The forest vegetation simulator: a review of its applications, structure, and content. Comput. Electron. Agric.49, 60–80. doi: 10.1016/j.compag.2005.02.003
14
D’Amato A. W. Jokela E. J. O’Hara K. L. Long J. N. (2017). Silviculture in the United States: an amazing period of change over the past 30 years. J. For.116, 55–67. doi: 10.5849/jof-2016-035
15
D'Amato A. W. Bradford J. B. Fraver S. Palik B. J. (2011). Forest management for mitigation and adaptation to climate change: insights from long-term silviculture experiments. For. Ecol. Manag.262, 803–816. doi: 10.1016/j.foreco.2011.05.014
16
Dangal S. R. S. Felzer B. S. Hurteau M. D. (2014). Effects of agriculture and timber harvest on carbon sequestration in the eastern US forests. J. Geophys. Res. Biogeosci.119, 35–54. doi: 10.1002/2013JG002409
17
Dangle C. Vinson A. Barrett S.M. (2022). Regional forest harvest characteristics across Virginia. Virginia Cooperative Extension publication ANR-264NP. p. 6. Available online at: https://www.pubs.ext.vt.edu/content/dam/pubs_ext_vt_edu/ANR/ANR-264/Regional_forest_harvest_characteristics_across_Virginia-revised.pdf (Accessed June 18, 2025).
18
Domke G.M. Walters B.F. Smith J.E. Greenfield E.J. Giebink C.L. Ogle S.M. et al (2024). Greenhouse gas emissions and removals from forest land, woodlands, urban trees, and harvested wood products in the United States, 1990–2022. U.S. Department of Agriculture, Forest Service.
19
Ducey M. J. Knapp R. A. (2010). A stand density index for complex mixed species forests in the northeastern United States. For. Ecol. Manag.260, 1613–1622. doi: 10.1016/j.foreco.2010.08.014
20
Elias M. Yackulic E. Duffy K. Saksa P. Sanchez D. L. Pevzner N. et al . (2025). Carbon finance for forest resilience in California. Front. For. Glob. Change7. doi: 10.3389/ffgc.2024.1507554
21
Food and Agriculture Organization of the United Nations (FAO) (2022). The state of the world's forests 2022. Forest pathways for green recovery and building inclusive, resilient and sustainable economies. p. 166.
22
Forest Trends’ Ecosystem Marketplace (2024). State of the voluntary carbon market 2024. Washington DC: Forest Trends Association, 36.
23
Fox T. R. Jokela E. J. Allen H. L. (2007). The development of pine plantation silviculture in the southern United States. J. For.105, 337–347. doi: 10.1093/jof/105.7.337
24
Giffen R. A. Ryan C. M. Belair E. P. Pounch M. A. Brown S. (2022). Storing more carbon by improving forest management in the Acadian forest of New England, USA. Forests13:2031. doi: 10.3390/f13122031
25
Griscom B. Shoch D. Stanley B. Cortez R. Virgilio N. (2009). Sensitivity of amounts and distribution of tropical forest carbon credits depending on baseline rules. Environ. Sci. Pol.12, 897–911. doi: 10.1016/j.envsci.2009.07.008
26
Gunn J. S. Buchholz T. (2018). Forest sector greenhouse gas emissions sensitivity to changes in forest management in Maine (USA). Forestry91, 526–538. doi: 10.1093/forestry/cpy013
27
Haya B. K. Evans S. Brown L. Bukoski J. Butsic V. Cabiyo B. et al . (2023). Comprehensive review of carbon quantification by improved forest management offset protocols. Front. For. Glob. Change6. doi: 10.3389/ffgc.2023.958879
28
Hoover C. M. Stout S. L. (2007). The carbon consequences of thinning techniques: stand structure makes a difference. J. For.105, 266–270. doi: 10.1093/jof/105.5.266
29
Integrity Council for the Voluntary Carbon Market (ICVCM) . (2024). Core carbon principles, assessment framework and assessment procedure. p. 133. Available online at: https://icvcm.org/wp-content/uploads/2024/02/CCP-Book-V1.1-FINAL-LowRes-15May24.pdf (Accessed June 18, 2025).
30
Kern C. C. Kenefic L. S. Kuehne C. Weiskittel A. R. Kaschmitter S. J. D'Amato A. W. et al . (2021). Relative influence of stand and site factors on aboveground live-tree carbon sequestration and mortality in managed and unmanaged forests. For. Ecol. Manag.493:119266. doi: 10.1016/j.foreco.2021.119266
31
Legaard K. R. Sader S. A. Simons-Legaard E. M. (2015). Evaluating the impact of abrupt changes in forest policy and management practices on landscape dynamics: analysis of a Landsat image time series in the Atlantic northern Forest. PLoS One10:e0130428. doi: 10.1371/journal.pone.0130428
32
Luppold W. G. Bumgardner M. S. (2018). Timber harvesting patterns for major states in the central, northern, and mid-Atlantic hardwood regions. Wood Fiber Sci.50, 143–153. doi: 10.22382/wfs-2018-016
33
Maine Forest Service (2001). 2000 silvicultural activities report, including annual report on clearcutting. p. 6. Available online at: https://www.maine.gov/tools/whatsnew/attach.php?id=392567&an=1 (Accessed June 18, 2025).
34
Maine Forest Service . (2024). 2021 silvicultural activities report, including annual report on clearcutting and precommercial activities. p. 8. Available online at: https://www.maine.gov/dacf/mfs/publications/annual_reports.html (Accessed June 18, 2025).
35
McKinley D. C. Ryan M. G. Birdsey R. A. Giardina C. P. Harmon M. E. Heath L. S. et al . (2011). A synthesis of current knowledge on forests and carbon storage in the United States. Ecol. Appl.21, 1902–1924. doi: 10.1890/10-0697.1
36
Nunery J. S. Keeton W. S. (2010). Forest carbon storage in the northeastern United States: net effects of harvesting frequency, post-harvest retention, and wood products. For. Ecol. Manag.259, 1363–1375. doi: 10.1016/j.foreco.2009.12.029
37
Ontl T. A. Janowiak M. K. Swanston C. W. Daley J. Handler S. Cornett M. et al . (2019). Forest management for carbon sequestration and climate adaptation. J. For.118, 86–101. doi: 10.1093/jofore/fvz062
38
Oswalt S.N. Smith W.B. Miles P.D. Pugh S.A. . (2019). Forest resources of the United States, 2017: a technical document supporting the Forest Service 2020 RPA assessment. Gen. Tech. Rep. WO-97. Washington, DC: U.S. Department of Agriculture, Forest Service, Washington Office. p. 223.
39
Palik B. J. D'Amato A. D. Franklin J. F. Johnsen K. N. (2020). Ecological silviculture: Foundations and applications: Waveland Press.
40
Papa C. C. DeLyser K. Clay K. Gadoth-Goodman D. Cooper L. Kurz W. A. et al . (2023). Modeling climate-smart forest management and wood use for climate mitigation potential in Maryland and Pennsylvania. Front. For. Glob. Change6. doi: 10.3389/ffgc.2023.1259010
41
Prestemon J. P. Wear D. N. (2000). Linking harvest choices to timber supply. For. Sci.46, 377–389. doi: 10.1093/forestscience/46.3.377
42
Puhlick J. J. Weiskittel A. R. Fernandez I. J. Fraver S. Kenefic L. S. Seymour R. S. et al . (2016). Long-term influence of alternative forest management treatments on total ecosystem and wood product carbon storage. Can. J. For. Res.46, 1404–1412. doi: 10.1139/cjfr-2016-0193
43
Shaw J.D. (2009). Using FIA data in the forest vegetation simulator. In: McWilliams, Will; Moisen, Gretchen; Czaplewski, Ray, comps. Forest inventory and analysis (FIA) symposium 2008; October 21–23, 2008; Park City, UT. Proc. RMRS-P-56CD. Fort Collins, CO: U.S. Department of Agriculture, Forest Service, Rocky Mountain Research Station. p. 16.
44
Silver E. J. Leahy J. E. Weiskittel A. R. Noblet C. L. Kittredge D. B. (2015). An evidence-based review of timber harvesting behavior among private woodland owners. J. Forestry113, 490–499. doi: 10.5849/jof.14-089
45
Smith D. M. Larson B. C. Kelty M. J. Ashton P. M. S. (1997). The practice of silviculture: Applied forest ecology. New York: John Wiley and Sons, 560.
46
Stanturf J. A. Mansuy N. (2021). COVID-19 and forests in Canada and the United States: initial assessment and beyond. Front. For. Glob. Change4. doi: 10.3389/ffgc.2021.666960
47
Tamiminia H. Salehi B. Mahdianpari M. Beier C. M. Johnson L. (2022). Mapping two decades of New York state forest aboveground biomass change using remote sensing. Remote Sens.14:4097. doi: 10.3390/rs14164097
48
Thompson J. R. Canham C. D. Morreale L. Kittredge D. B. Butler B. (2017). Social and biophysical variation in regional timber harvest regimes. Ecol. Appl.27, 942–955. doi: 10.1002/eap.1497
49
USDA Forest Service (2024). Forest inventory and analysis one-click factsheets Available online at: https://public.tableau.com/views/FIA_OneClick_V1_2/StateSelection?%3AshowVizHome=no (Accessed June 18, 2025).
50
Verra (2024). VM0045, improved forest management using dynamic matched baselines from national forest inventories. Version 1.1, 12 march 2024, sectoral scope 14. Avaailable online at: https://verra.org/methodologies/methodology-for-improved-forest-management/ (Accessed June 18, 2025).
51
Wear D.N. Coulston J.W. . (2024). A comparative analysis of forest harvesting, timber supply, and tree planting across regions of the United States. Resources for the Future, Working Paper 24–09. p. 36. Available online at: https://www.rff.org/publications/working-papers/a-comparative-analysis-of-forest-harvesting-timber-supply-and-tree-planting-across-regions-of-the-united-states/ (Accessed June 18, 2025).
52
Westfall J.A. Coulston J.W. Moisen G.G. Andersen H.-E. . (2022). Sampling and estimation documentation for the enhanced forest inventory and analysis program. U.S. Department of Agriculture, Forest Service, Northern Research Station.
53
Windmuller-Campione M. A. Russell M. B. Sagor E. D’Amato A. W. Ek A. R. Puettmann K. J. et al . (2020). The decline of the clearcut: 26 years of change in silvicultural practices and implications in Minnesota. J. Forestry118, 244–259. doi: 10.1093/jofore/fvaa007
54
Windmuller-Campione M.A. Russell M.B. Sagor E.S. Rodman M.G. . (2019). Current status and trends of silvicultural and forest health practices in Minnesota: a 2017 assessment. University of Minnesota Department of Forest Resources Staff Paper Series No. 252. Available online at: https://conservancy.umn.edu/server/api/core/bitstreams/d6a03729-67c2-45f9-9df3-b478d645e43d/content (Accessed May 24, 2024).
55
Woodall C. W. Ince P. J. Skog K. E. Aguilar F. X. Keegan C. E. Sorensen C. B. et al . (2011). An overview of the forest products sector downturn in the United States. For. Prod. J.61, 595–603. doi: 10.13073/0015-7473-61.8.595
56
Woodall C. W. Munro H. L. Atkins J. W. Bullock B. P. Fox T. R. Hoover C. M. et al . (2025). Prioritizing opportunities to empower forest carbon decisions through strategic investment in forest modeling capacity. J. For.123, 241–262. doi: 10.1007/s44392-025-00012-5
57
Zhao J. Daigneault A. Weiskittel A. (2020). Forest landowner harvest decisions in a new era of conservation stewardship and changing markets in Maine, USA. Forest Policy Econ.118:102251. doi: 10.1016/j.forpol.2020.102251
Summary
Keywords
timber removals, forest inventory and analysis, forest ownership, carbon baselines, carbon accounting
Citation
Russell MB, Chamberlain CJ, Riley L, Mushegian NA, Gunn JS, Belair EP and Busby SU (2025) Characterizing timber harvest occurrence and intensity to inform forest carbon management across the eastern United States. Front. For. Glob. Change 8:1594324. doi: 10.3389/ffgc.2025.1594324
Received
15 March 2025
Accepted
06 June 2025
Published
26 June 2025
Volume
8 - 2025
Edited by
Ana Cristina Gonçalves, University of Evora, Portugal
Reviewed by
Tatyana B. Ruseva, Appalachian State University, United States
Libin Thaikkattil Louis, University of Maine at Fort Kent, United States
Updates
Copyright
© 2025 Russell, Chamberlain, Riley, Mushegian, Gunn, Belair and Busby.
This is an open-access article distributed under the terms of the Creative Commons Attribution License (CC BY). The use, distribution or reproduction in other forums is permitted, provided the original author(s) and the copyright owner(s) are credited and that the original publication in this journal is cited, in accordance with accepted academic practice. No use, distribution or reproduction is permitted which does not comply with these terms.
*Correspondence: Matthew B. Russell, matt@arbor-analytics.com
Disclaimer
All claims expressed in this article are solely those of the authors and do not necessarily represent those of their affiliated organizations, or those of the publisher, the editors and the reviewers. Any product that may be evaluated in this article or claim that may be made by its manufacturer is not guaranteed or endorsed by the publisher.