 Ui-Jae Lee
 Dan-Bi Kim2
 Myeong-Ju Kim
 Sang-Deok Lee
- 1Department of Integrated Particulate Matter Management, Kangwon National University, National University, Chuncheon, Republic of Korea
- 2Wonju Regional Environment Agency, Ministry of Environment, Wonju, Republic of Korea
- 3Department of Forest Environment System, Kangwon National University, Chuncheon, Republic of Korea
- 4Gangwon Particle Pollution Research and Management Center, Kangwon National University, Chuncheon, South Korea
Understanding the interactions between air pollutants and vegetation is essential for developing effective air quality management strategies, particularly in forest-rich regions. This study investigates the spatial and temporal characteristics of air pollution in Gangwon Province, South Korea, from 2019 to 2023, focusing on pollutant concentrations, emissions, and their relationships with vegetation. We utilized data from the national air quality monitoring network, including PM10, PM2.5, and O3 concentrations, along with emissions data from the Clean Air Policy Support System (2019–2021) and NDVI data derived from MODIS satellite observations. Our analysis revealed that PM concentrations were highest in inland cities such as Chuncheon, Hongcheon, and Wonju, largely due to atmospheric stagnation and topographical confinement, while coastal areas exhibited lower levels owing to maritime dispersion. O? levels were elevated in coastal and mountainous regions, influenced by land-sea breeze circulation. Emissions varied regionally, with traffic and fugitive dust dominating in urban inland areas, biomass burning in Gangneung, and industrial emissions in Donghae. Seasonal patterns showed PM peaking in spring and winter, while O3 peaked in summer. NDVI exhibited a consistent negative correlation with PM, particularly PM2.5, indicating the potential mitigating effect of vegetation. In contrast, O3-NDVI correlations varied regionally, showing positive associations in some western areas. These findings emphasize the importance of region-specific air quality policies, including green space expansion for PM control and precursor emission management for O3, along with continued monitoring of external pollutant inflows and meteorological stagnation.
1 Introduction
Air pollutants have adverse effects on public health, contributing to cardiovascular and respiratory diseases and increasing cancer incidence (Brunekreef and Holgate, 2002; Xing et al., 2016; Landrigan, 2017). Air pollutants can be broadly categorized into Particulate Matter (PM) and gaseous pollutants, with PM and Ozone (O3) being representative examples. PM10 and PM2.5 refer to particulate matter with diameters of 10 and 2.5 μm or less, respectively. These pollutants originate from fuel combustion, industrial processes, and vehicle emissions, as well as natural sources such as volcanic activity and Asian dust storms (Park and Kim, 2005; Altindag et al., 2017). In South Korea, a significant proportion of PM10 and PM2.5 is reported to originate from external sources, prompting the government to implement environmental policies aimed at gradually reducing their concentrations (Ho et al., 2021; Liu et al., 2022). The Comprehensive Plan for Secondary Fine Particulate Matter Management (2025–2029) has set a target to reduce the annual average concentration of PM2.5 to 13 μg/m3, necessitating additional management strategies.
O3 is formed in the troposphere through photochemical reactions involving NOx and VOCs and acts as a strong oxidant, posing health risks (Zhang et al., 2019). In South Korea, surface-level O3 concentrations increased from 0.020 in 1998 to 0.032 ppm in 2022, leading to intensified management efforts to mitigate high O3 levels, particularly in summer (NIER, 2022). As of December 2023, South Korea operates 525 urban air quality monitoring stations that provide pollutant concentration data, with 25 of these stations located in Gangwon Province. The average PM2.5 concentration in Gangwon Province in 2022 was similar to that in Seoul (18 μg/m3). However, due to the lower number of monitoring stations compared to the capital region, there are limitations in fully capturing regional air quality variations (NIER, 2022). Additionally, in 2022, the average O3 concentration was higher in Gangwon Province (0.032 ppm) than in the capital region (0.030 ppm) (NIER, 2022). In Chuncheon, PM2.5 is characterized by higher OC (Organic Carbon) concentrations compared to EC (Elemental Carbon), distinguishing it from other cities (Cho et al., 2016).
Since the division of the Korean Peninsula, South Korea’s forested area has gradually declined from approximately 6.68 million hectares in 1964 to around 6.29 million hectares in 2022, covering about 62.6% of the national territory (KFS, 2023). However, forest stock volume has increased nearly 30-fold from approximately 36 million m3 in 1953 to 1.08 billion m3 in 2022. Among all provinces, Gangwon Province had the highest forest stock in 2022, with an average of 191.1 m3 per hectare (KFS, 2023).
Vegetation interacts with air pollutants in various ways (Grantz et al., 2003; Janhäll, 2015). Plants adsorb PM and emit biogenic volatile organic compounds (BVOCs), which are precursors to O3 formation (Calfapietra et al., 2013; Kim, 2017; Lu et al., 2018). Moreover, O3 can cause plant cell death and accelerate leaf aging (Pell et al., 1997). Given the role of forests in modulating air pollution, research is needed to observe regional variations in both forests and air pollutants and to elucidate their correlations.
Therefore, this study aims to analyze the spatial and temporal variations of air pollutants and vegetation in Gangwon Province by utilizing monitoring and satellite data, with a focus on understanding their interrelationships.
2 Materials and methods
2.1 Study area
The study area is Gangwon Province, South Korea, located between 37°2′–38°37′ N latitude and 127°5′–128°22′ E longitude (Figure 1). Gangwon Province has a total area of 16,875 km2, accounting for approximately 17% of South Korea’s land area. Of this, about 81% consists of mountainous terrain, while 9% is agricultural land. The province’s major mountain ranges extend from north to south, resulting in distinct climatic differences between the western and eastern regions. The eastern region, which borders the sea, is influenced by a maritime climate but can experience relatively dry conditions due to the foehn wind from the mountains. In contrast, the western region, adjacent to the capital area, is characterized as a leeward zone, where air pollutant concentrations tend to be higher. Additionally, the eastern part of Gangwon Province has a high concentration of power plants and industrial complexes, leading to relatively higher emissions of air pollutants.
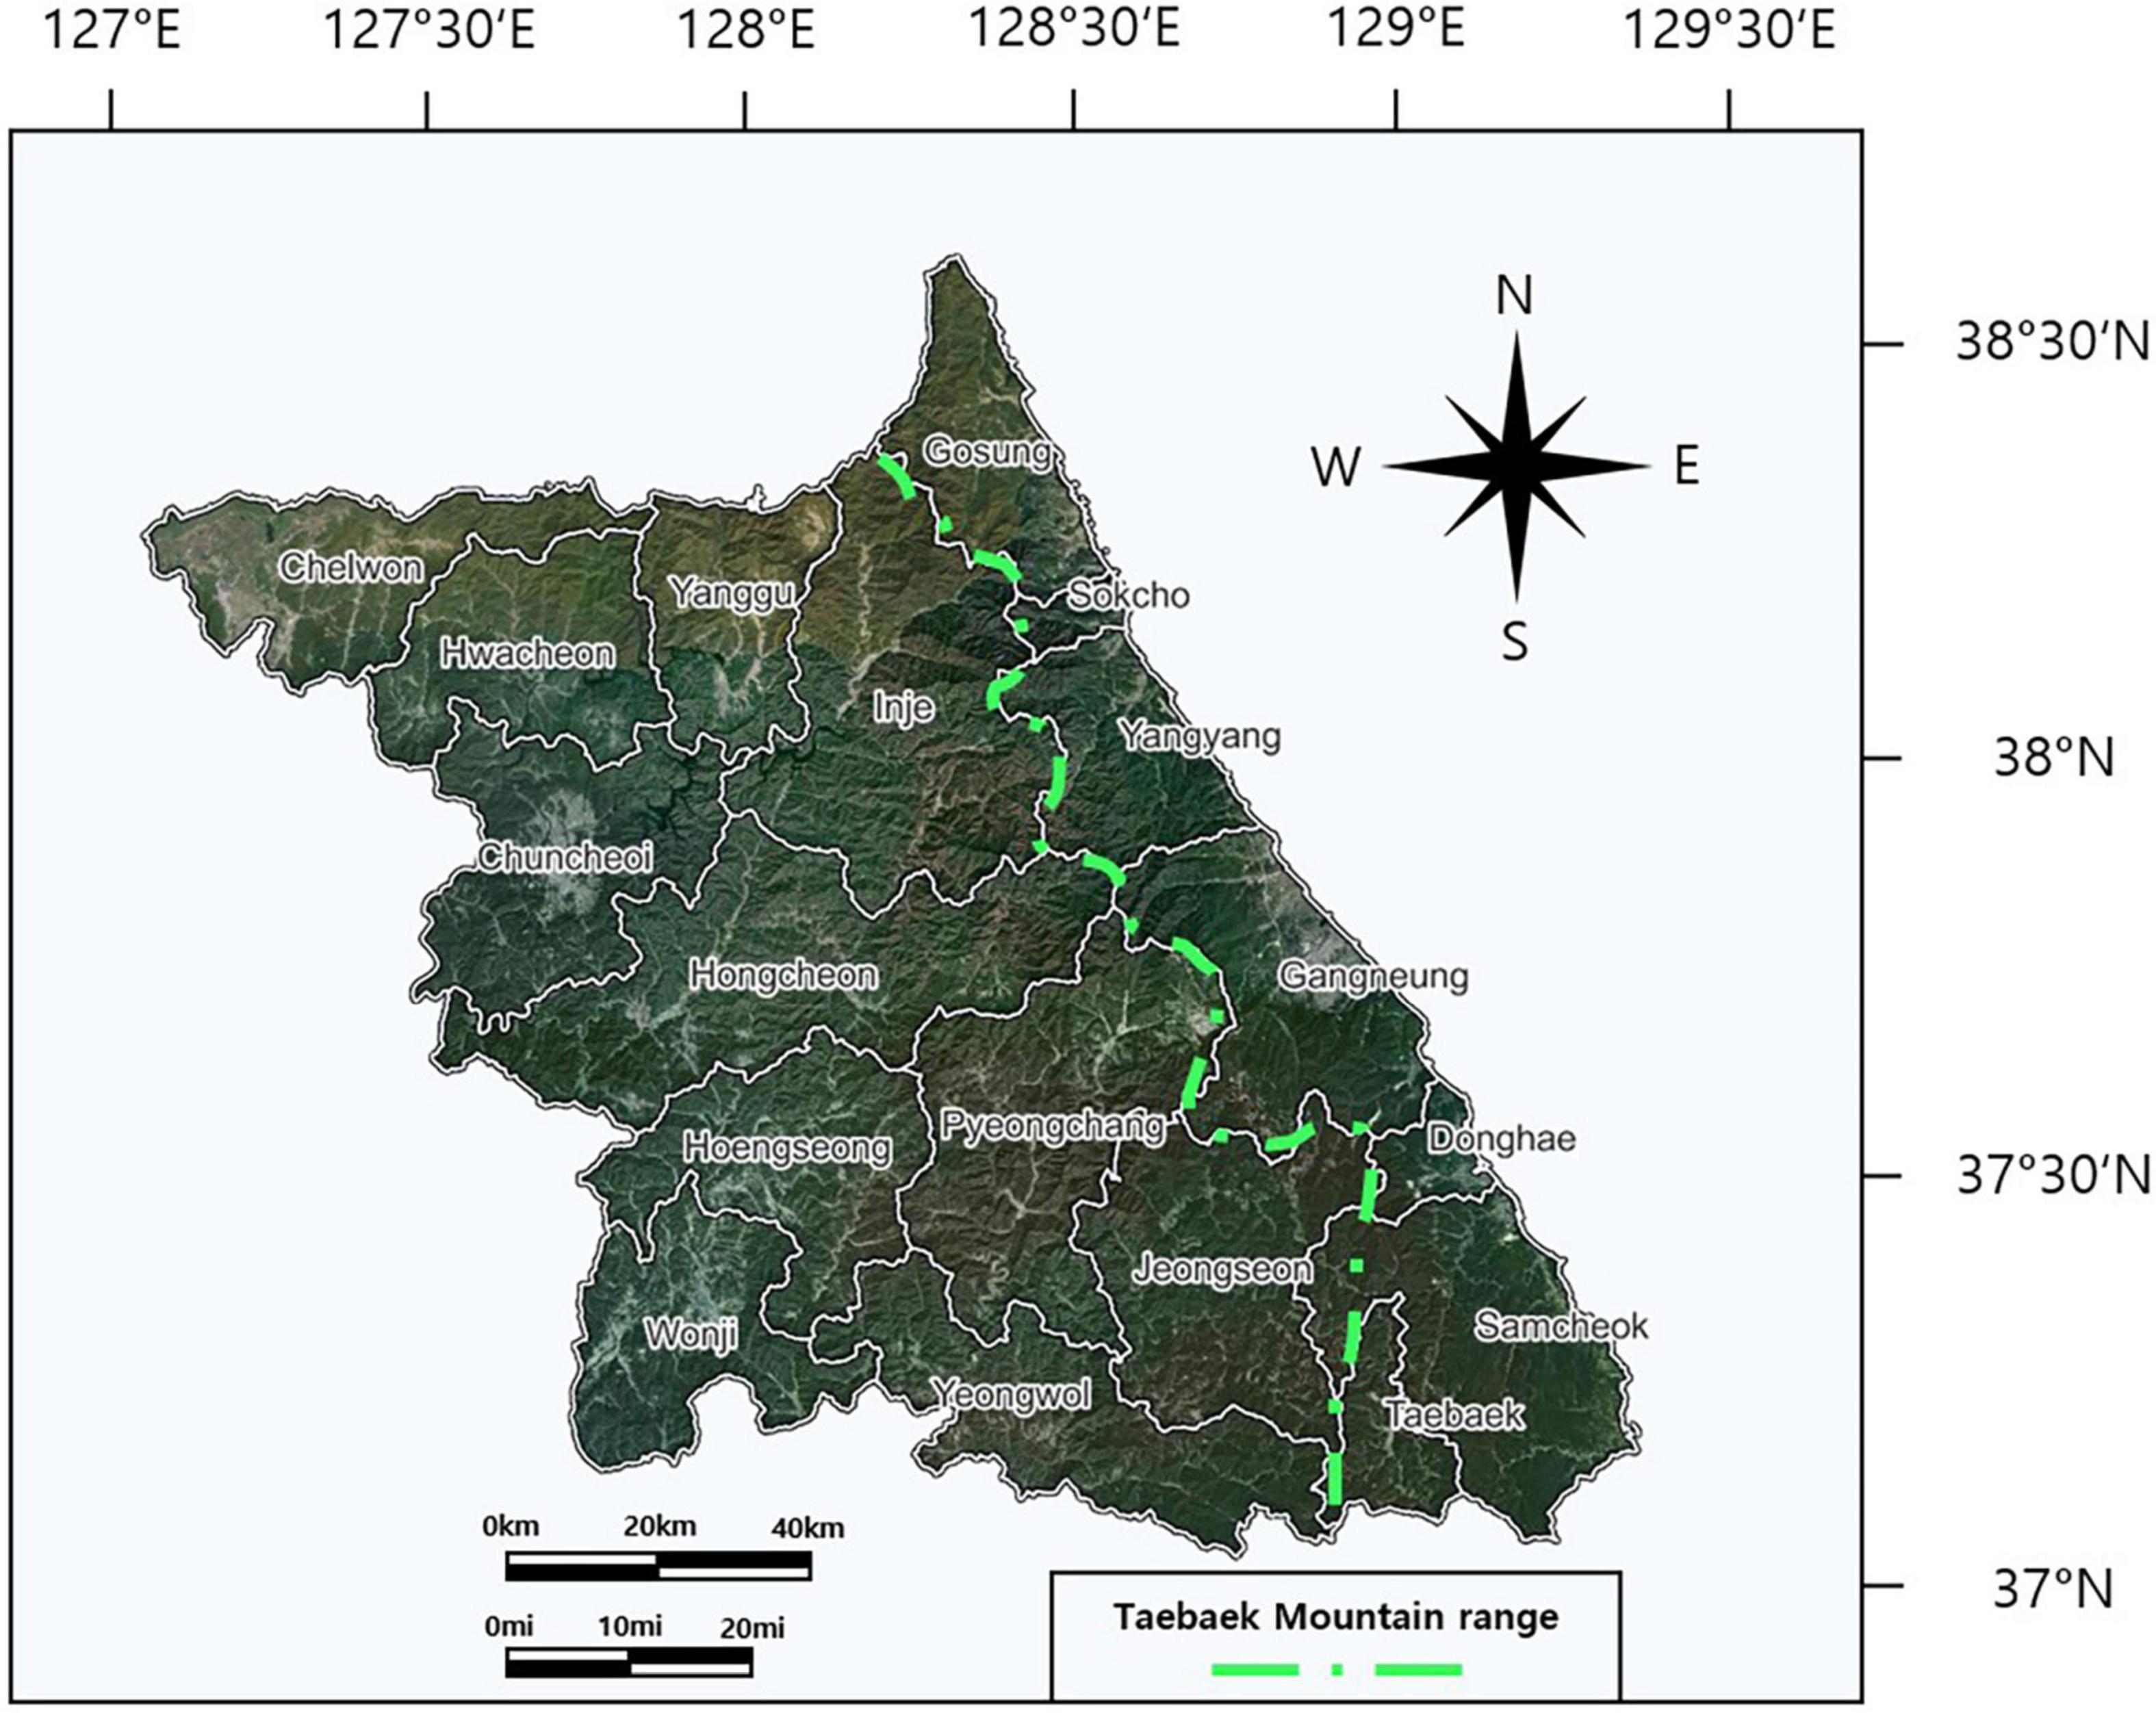
Figure 1. Location and regional name of Gangwon Province as the study site.
2.2 Air pollution data
Air pollutant data were obtained from Air Korea’s finalized dataset and monthly statistical reports, including PM10, PM2.5, and O3 concentration data. The data were sourced from urban air quality monitoring stations in Gangwon Province. Particulate matter concentrations were measured using the beta-ray attenuation method and the gravimetric method, while O3 concentrations were measured using the ultraviolet absorption method. Additionally, all data underwent quality assurance and quality control (QA/QC) procedures in accordance with South Korea’s official air pollution testing standards. The data period spans a total of 5 years, from 2019, when PM2.5 urban air quality monitoring stations were established across all cities and counties of Gangwon Province, to 2023. The air pollutant data can be accessed as open data on the Air Korea website (accessed on 1 August 2024, operating agency: Korea Environment Corporation, Incheon, Republic of Korea1).
2.3 Emission data
South Korea’s Clean Air Policy Support System (CAPSS) is a system for estimating pollutant emissions in the Air Pollutants Emission Inventory. Emissions are calculated annually and reported for nine air pollutants: total suspended particles (TSP), PM2.5, PM10, sulfur oxides (SOx), nitrogen oxides (NOx), volatile organic compounds (VOCs), ammonia (NH3), carbon monoxide (CO), and black carbon (BC). The system provides emission data categorized by pollutant type, emission source, and region. Fuel combustion sources are classified into 13 categories: Energy production, Non-industry, Manufacturing industry, Industrial process, Energy transport and storage, Solvent use, Road transport, Non-road transport, Waste disposal, Agriculture, Other surface-pollutant source, Fugitive dust, and Biomass burning. The Emissions data can be accessed as open data on the National Air Emission Inventory and Research Center website (accessed on 1 August 2024, operating agency: National Air Emission Inventory and Research Center, Cheongju, Republic of Korea2).
2.4 Vegetation data
The Normalized Difference Vegetation Index (NDVI) is an index used to assess vegetation vitality and density. NDVI is calculated using red and near-infrared wavelengths. It is widely utilized in agriculture and forestry and enables vegetation monitoring in specific areas using remote sensors such as satellites or drones. NDVI values typically range from −1 to 1, where values below 0.1 indicate barren areas such as deserts and snow-covered regions, values between 0.2 and 0.3 correspond to shrublands and grasslands with low vegetation density, and values between 0.6 and 0.8 represent healthy forests (Xie et al., 2010). The dataset used in this study is the MODIS/Terra Vegetation Indices 16-Day L3 Global 250 m SIN Grid v006. The NDVI data can be accessed as open data on the EARTHDATA SEARCH website (accessed on 1 August 2024, operating agency: NASA, Washington, DC, Unired States3).
2.5 Data status
While air pollutant concentration data and NDVI data used for the period from 2019 to 2023, mission data only available up to 2021, as no more responsible data exist (Table 1). Therefore, emissions can be compared for the 3 years from 2019 to 2021. Additionally, in the cases of Hongcheon, Hwacheon, Inje, and Taebaek, the establishment of urban air quality monitoring stations was delayed, resulting in fewer data points compared to other regions.
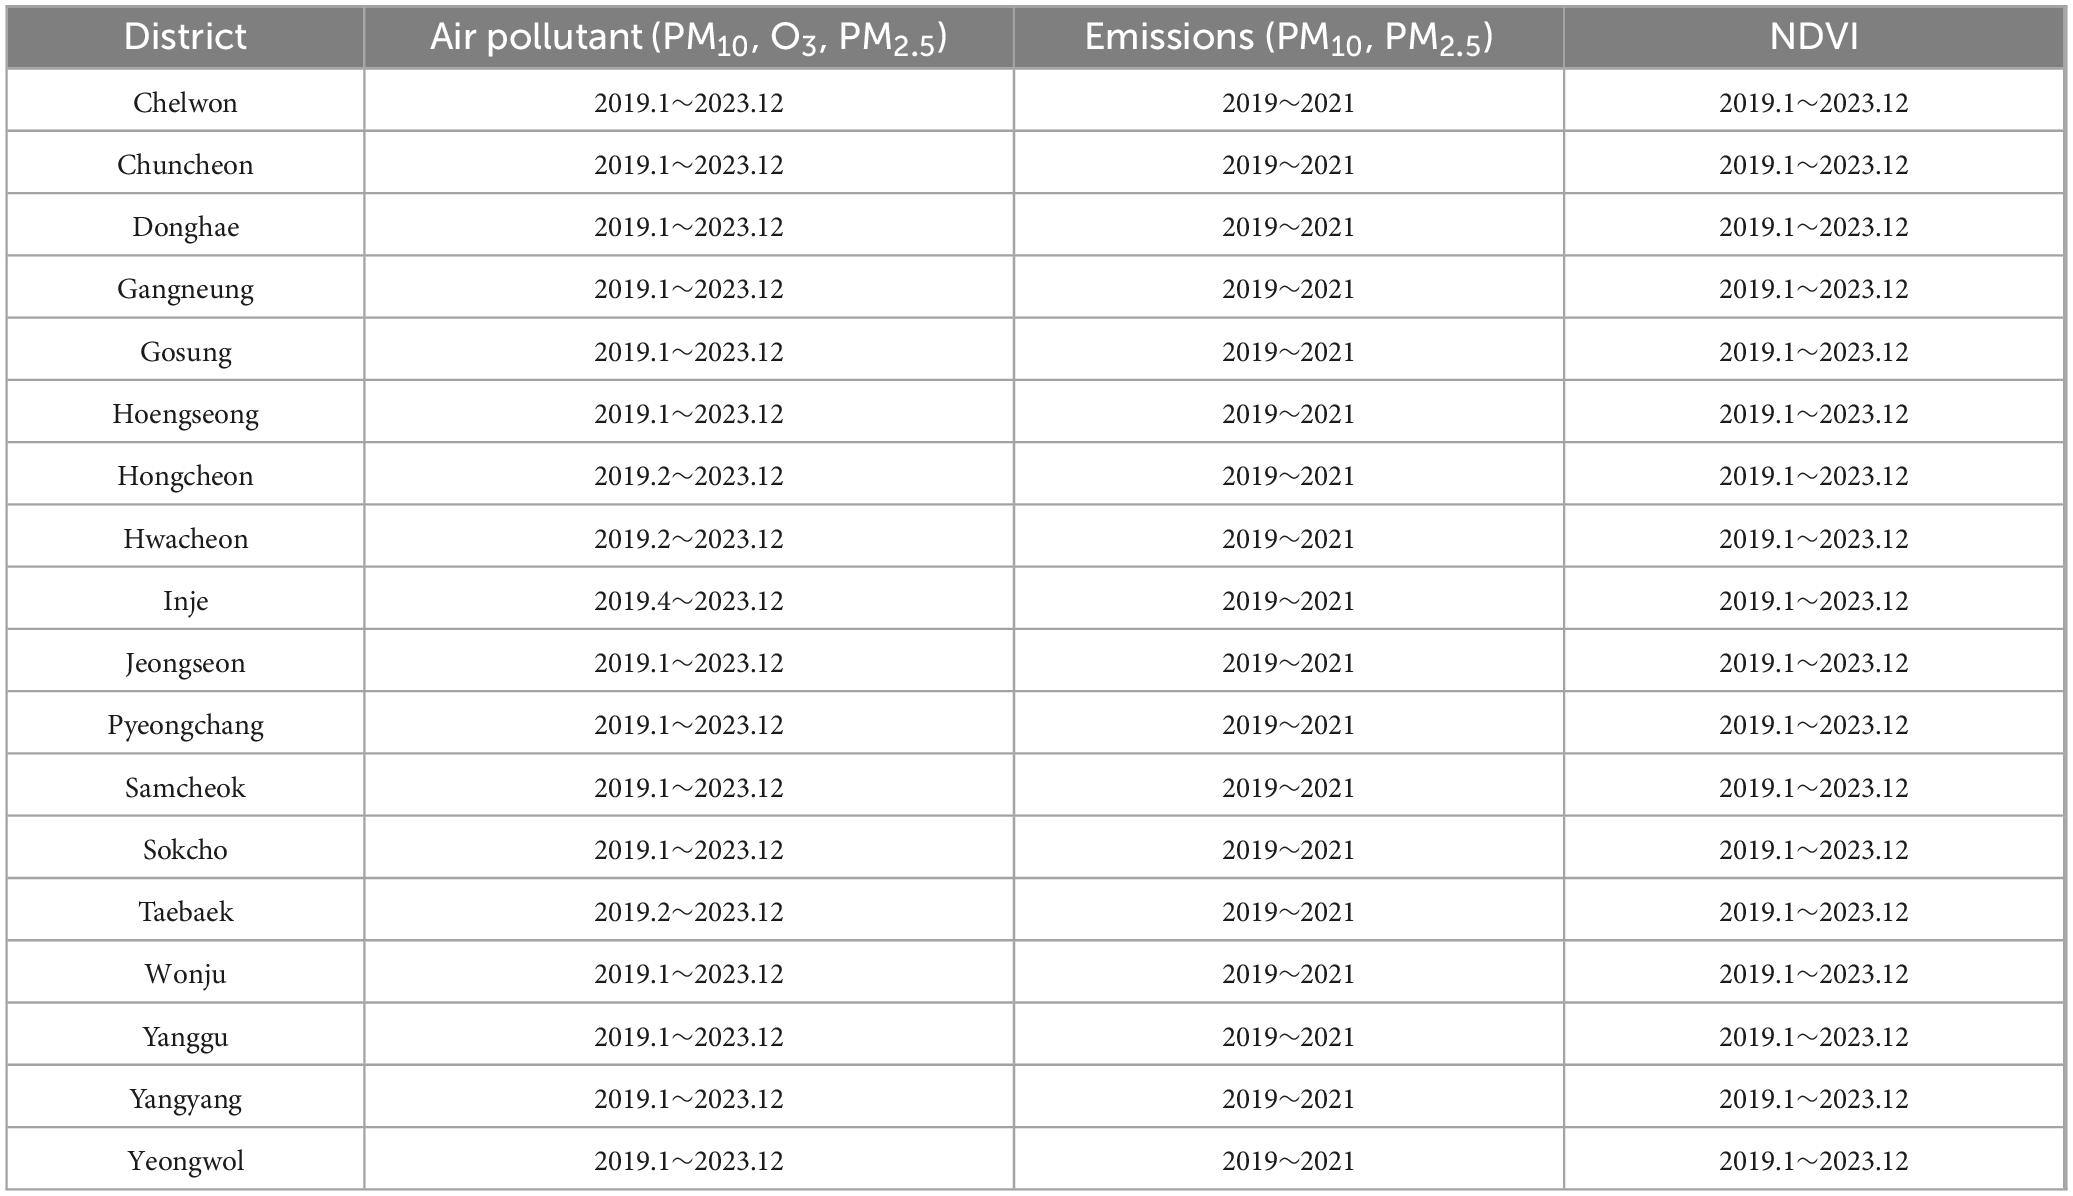
Table 1. Status of data used in the study.
3 Results and discussion
3.1 Characteristics of air pollutant concentration and vegetation distribution in Gangwon Province
The concentrations of air pollutants (PM and O3) in Gangwon Province exhibited regional variations (Figure 2 and Table 2), which are presumed to be influenced by factors such as topographical characteristics, atmospheric stagnation, and industrial and traffic emissions. Figure 2 illustrates the arithmetic average values of the four variables—PM10, PM2.5, O3, and NDVI—calculated across the 5 years period. The 5 years (2019–2023) arithmetic mean concentration of PM10 ranged from 26 to 34 μg/m3, with relatively high concentrations observed in inland areas such as Chuncheon (34.4 ± 29.4 μg/m3), Cheorwon (34.4 ± 28.4 μg/m3), and Hongcheon (34 ± 27.2 μg/m3). In contrast, coastal areas of Gangwon Province, such as Donghae (28.8 ± 26.1 μg/m3) and Samcheok (28.5 ± 20.9 μg/m3), exhibited slightly lower concentrations, likely due to favorable atmospheric dispersion conditions or relatively fewer emission sources compared to the western regions.
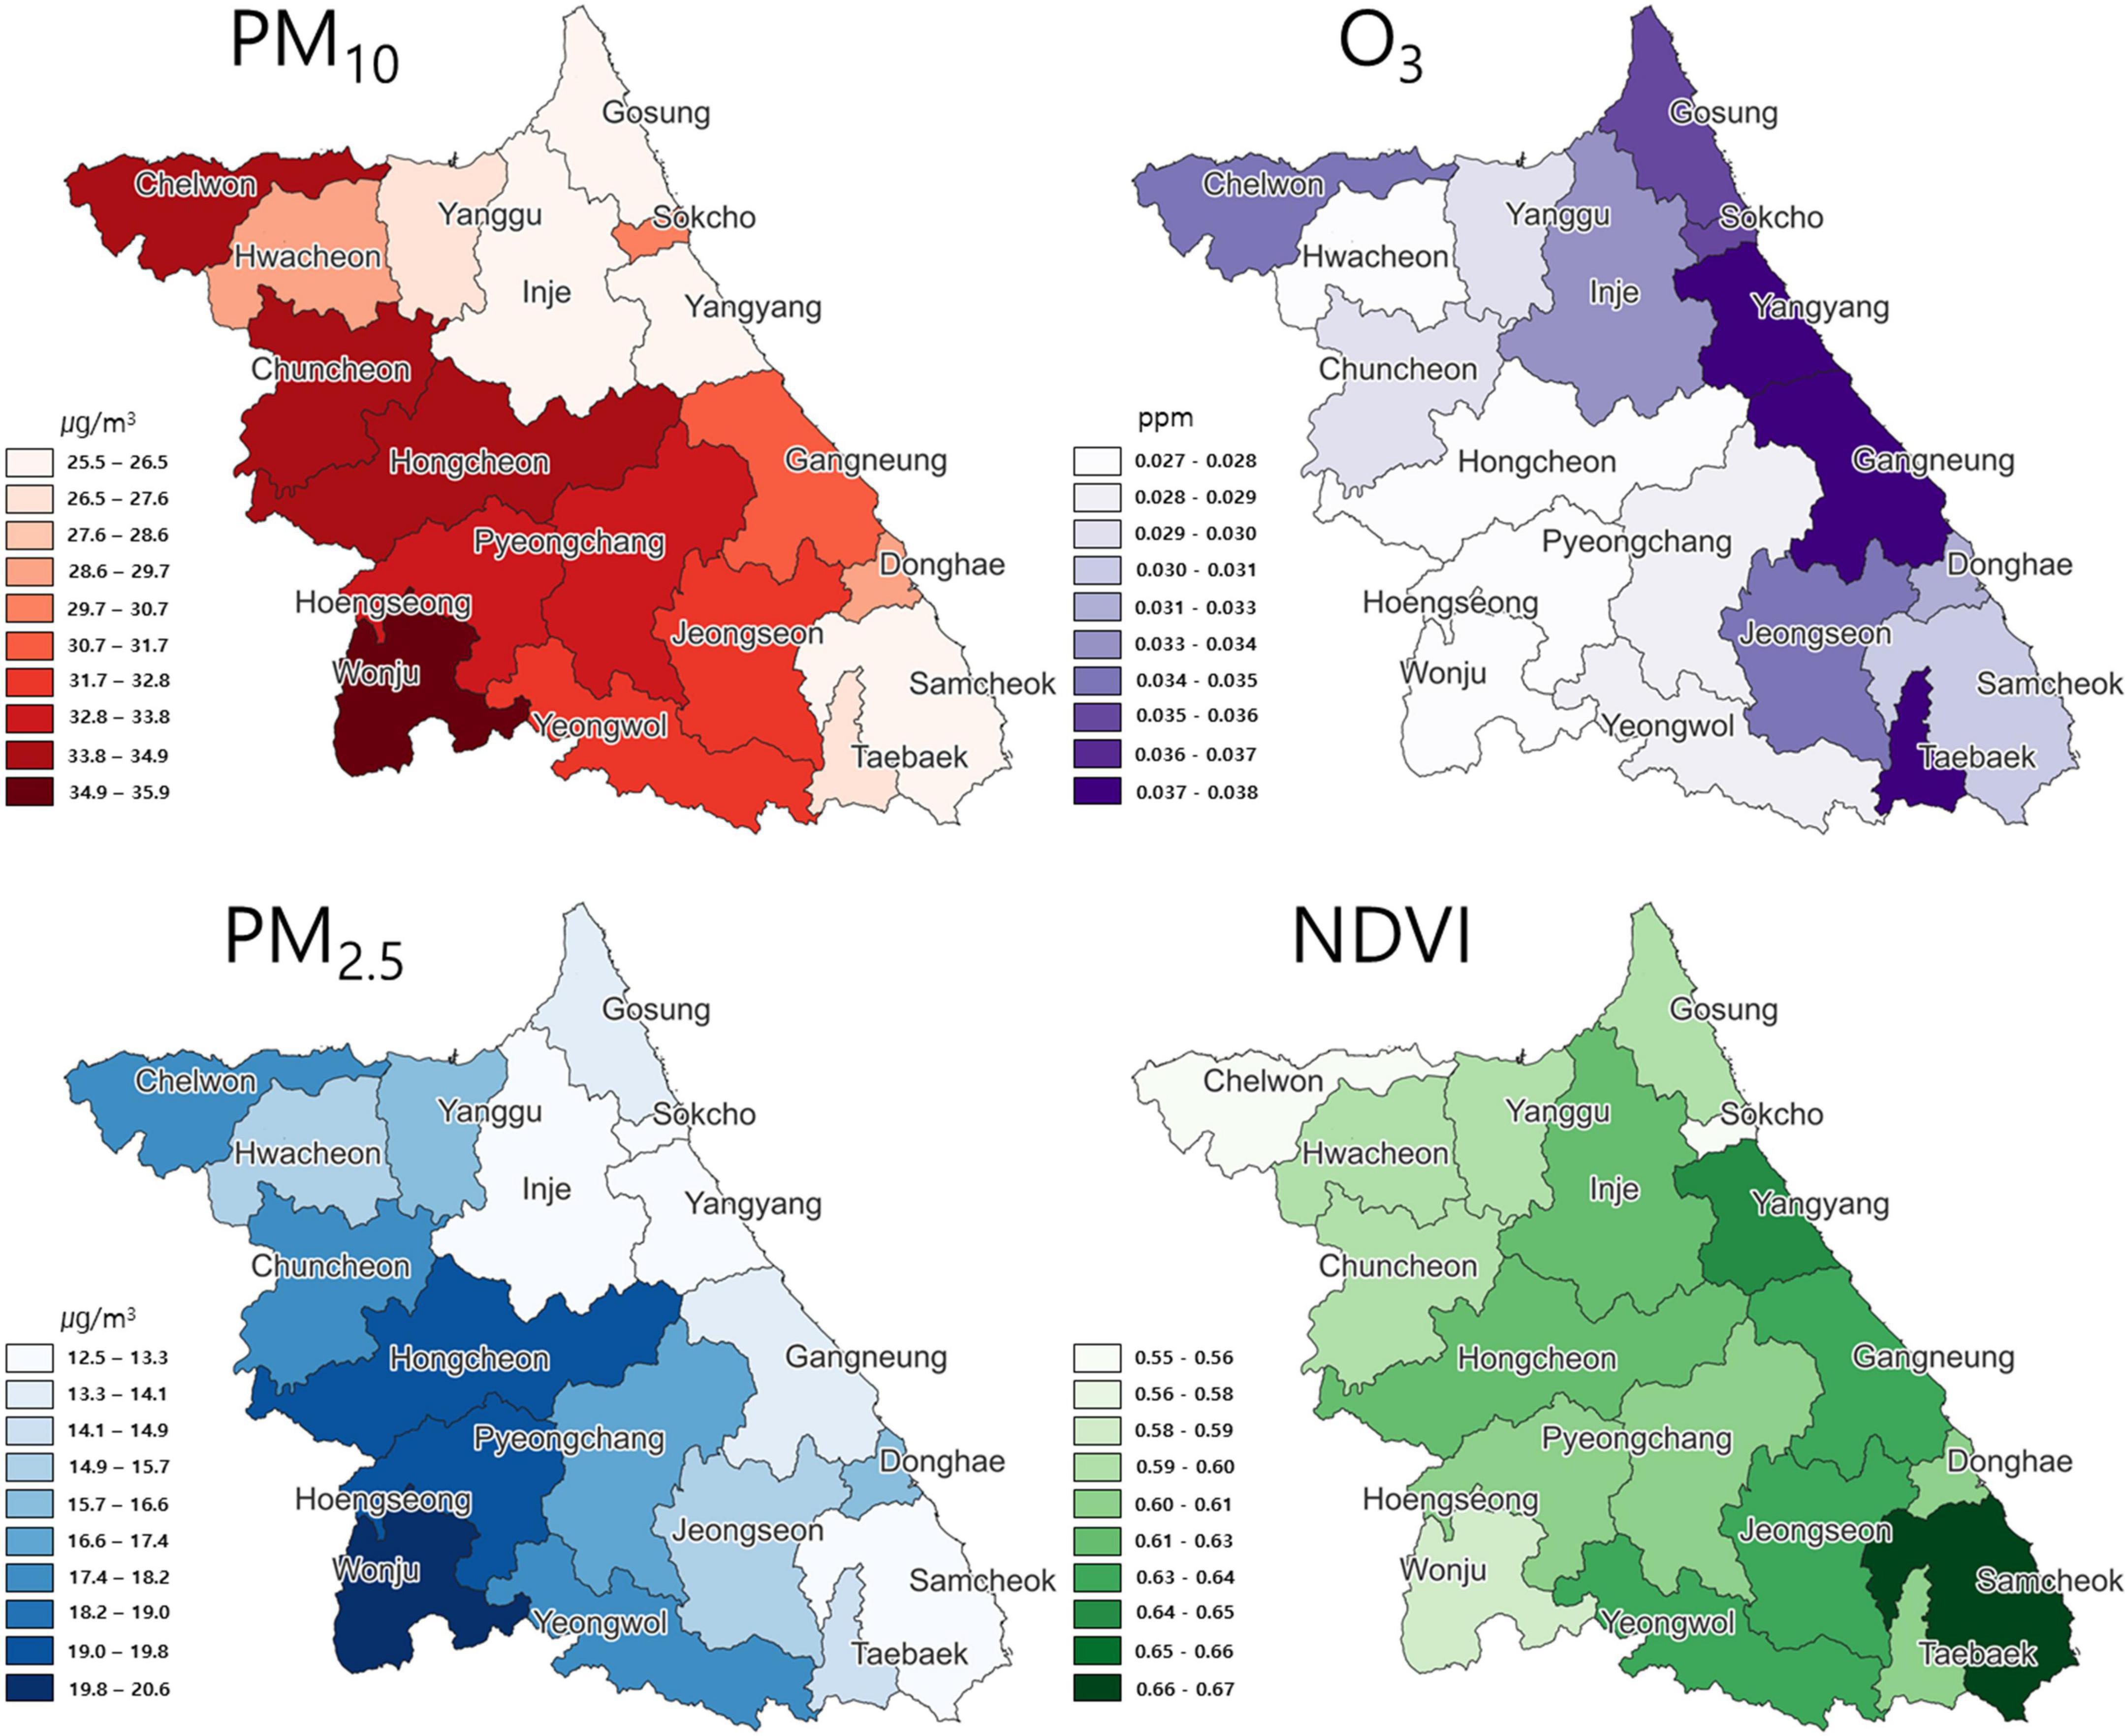
Figure 2. Spatial distribution of PM10, O3, PM2.5, Normalized Difference Vegetation Index (NDVI) in Gangwon Province from 2019 to 2023.
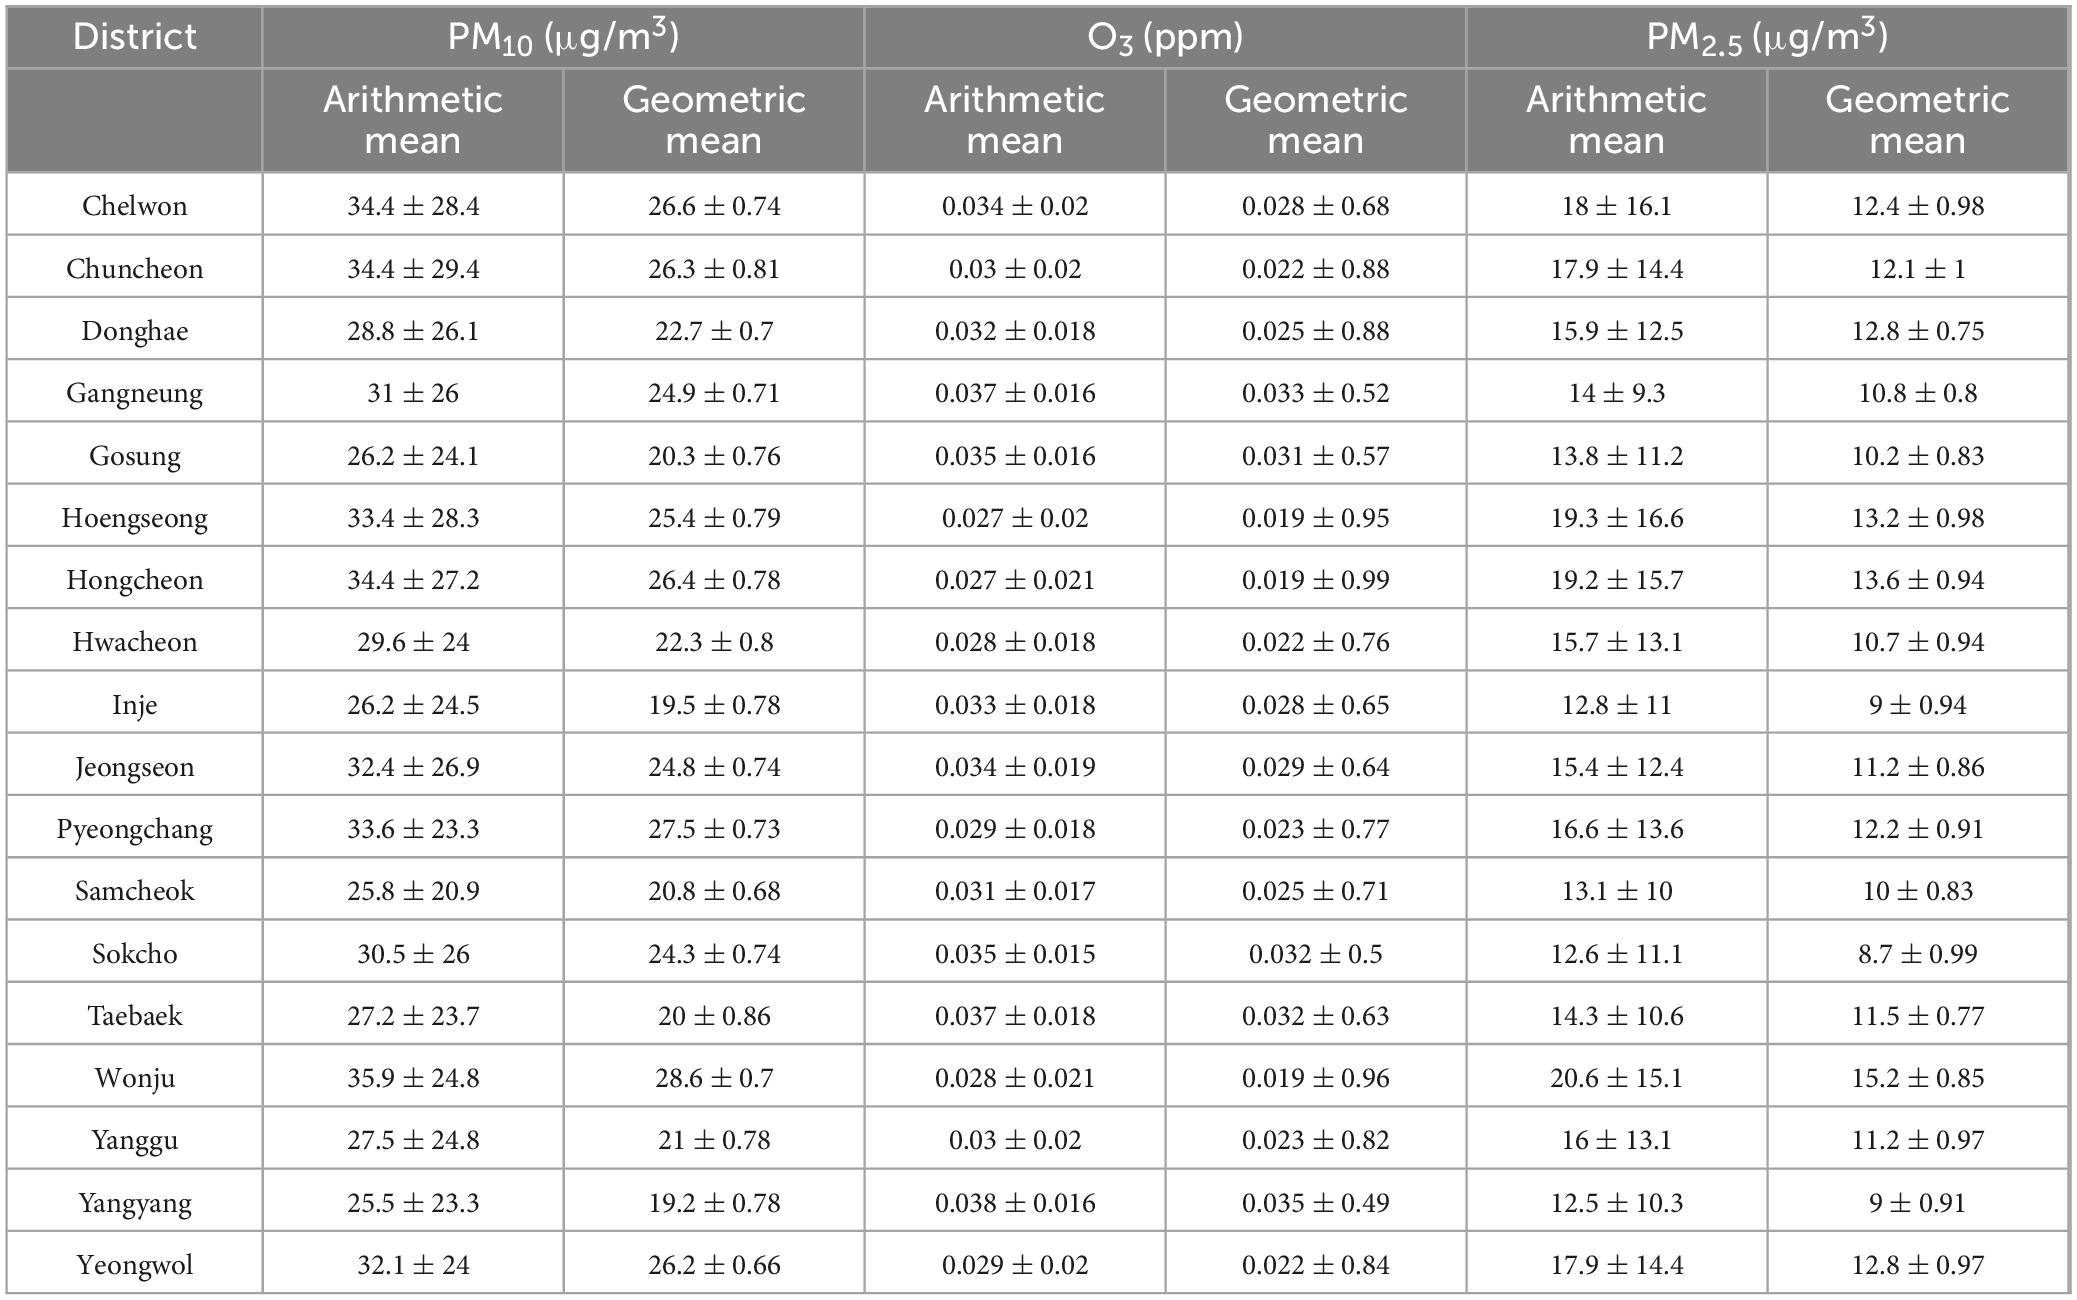
Table 2. Mean and standard deviation of PM10, O3, and PM2.5 in Gangwon Province from 2019 to 2023.
Regarding O3 concentrations, higher levels were observed in coastal and mountainous areas such as Gangneung (0.037 ± 0.016 ppm) and Goseong (0.035 ± 0.016 ppm). This trend is associated with the topographical characteristics of Gangwon Province, where atmospheric stagnation and meteorological conditions conducive to photochemical reactions contribute to increased air pollutant levels (Allabakash et al., 2022). In particular, in coastal regions like Gangneung, the circulation of sea and land breezes is likely to influence O3 concentrations, necessitating air quality management measures that take this factor into account.
PM2.5 concentration in Gangwon Province ranged from 12 to 18 μg/m3, with relatively high concentrations measured in Hongcheon (19.3 ± 16.6 μg/m3) and Wonju (19.3 ± 16.6 μg/m3). These areas have a relatively high density of industrial facilities and traffic, suggesting a significant influence of local emission sources. In contrast, some coastal areas, such as Sokcho (12.6 ± 11.1 μg/m3) and Samcheok (13.1 ± 10 μg/m3), showed lower PM2.5 concentrations, likely due to marine influences or efficient atmospheric circulation (Martilli, 2003). NDVI was highest in Samcheok, indicating that this area had the densest vegetation coverage in Gangwon Province (Figure 2). NDVI showed an inverse relationship with PM concentrations, whereas no significant correlation was observed between NDVI and O3 concentrations across different regions.
3.2 Characteristics of air pollutant concentration and vegetation distribution in Gangwon Province
South Korea’s Clean Air Policy Support System (CAPSS) is an integrated emissions information system that provides air pollutant emissions data. Using emissions data from CAPSS, it is possible to assess the emissions of PM and O3 precursors in Gangwon Province. visualized VOCs emissions by city from 2019 to 2021 (Figure 3).
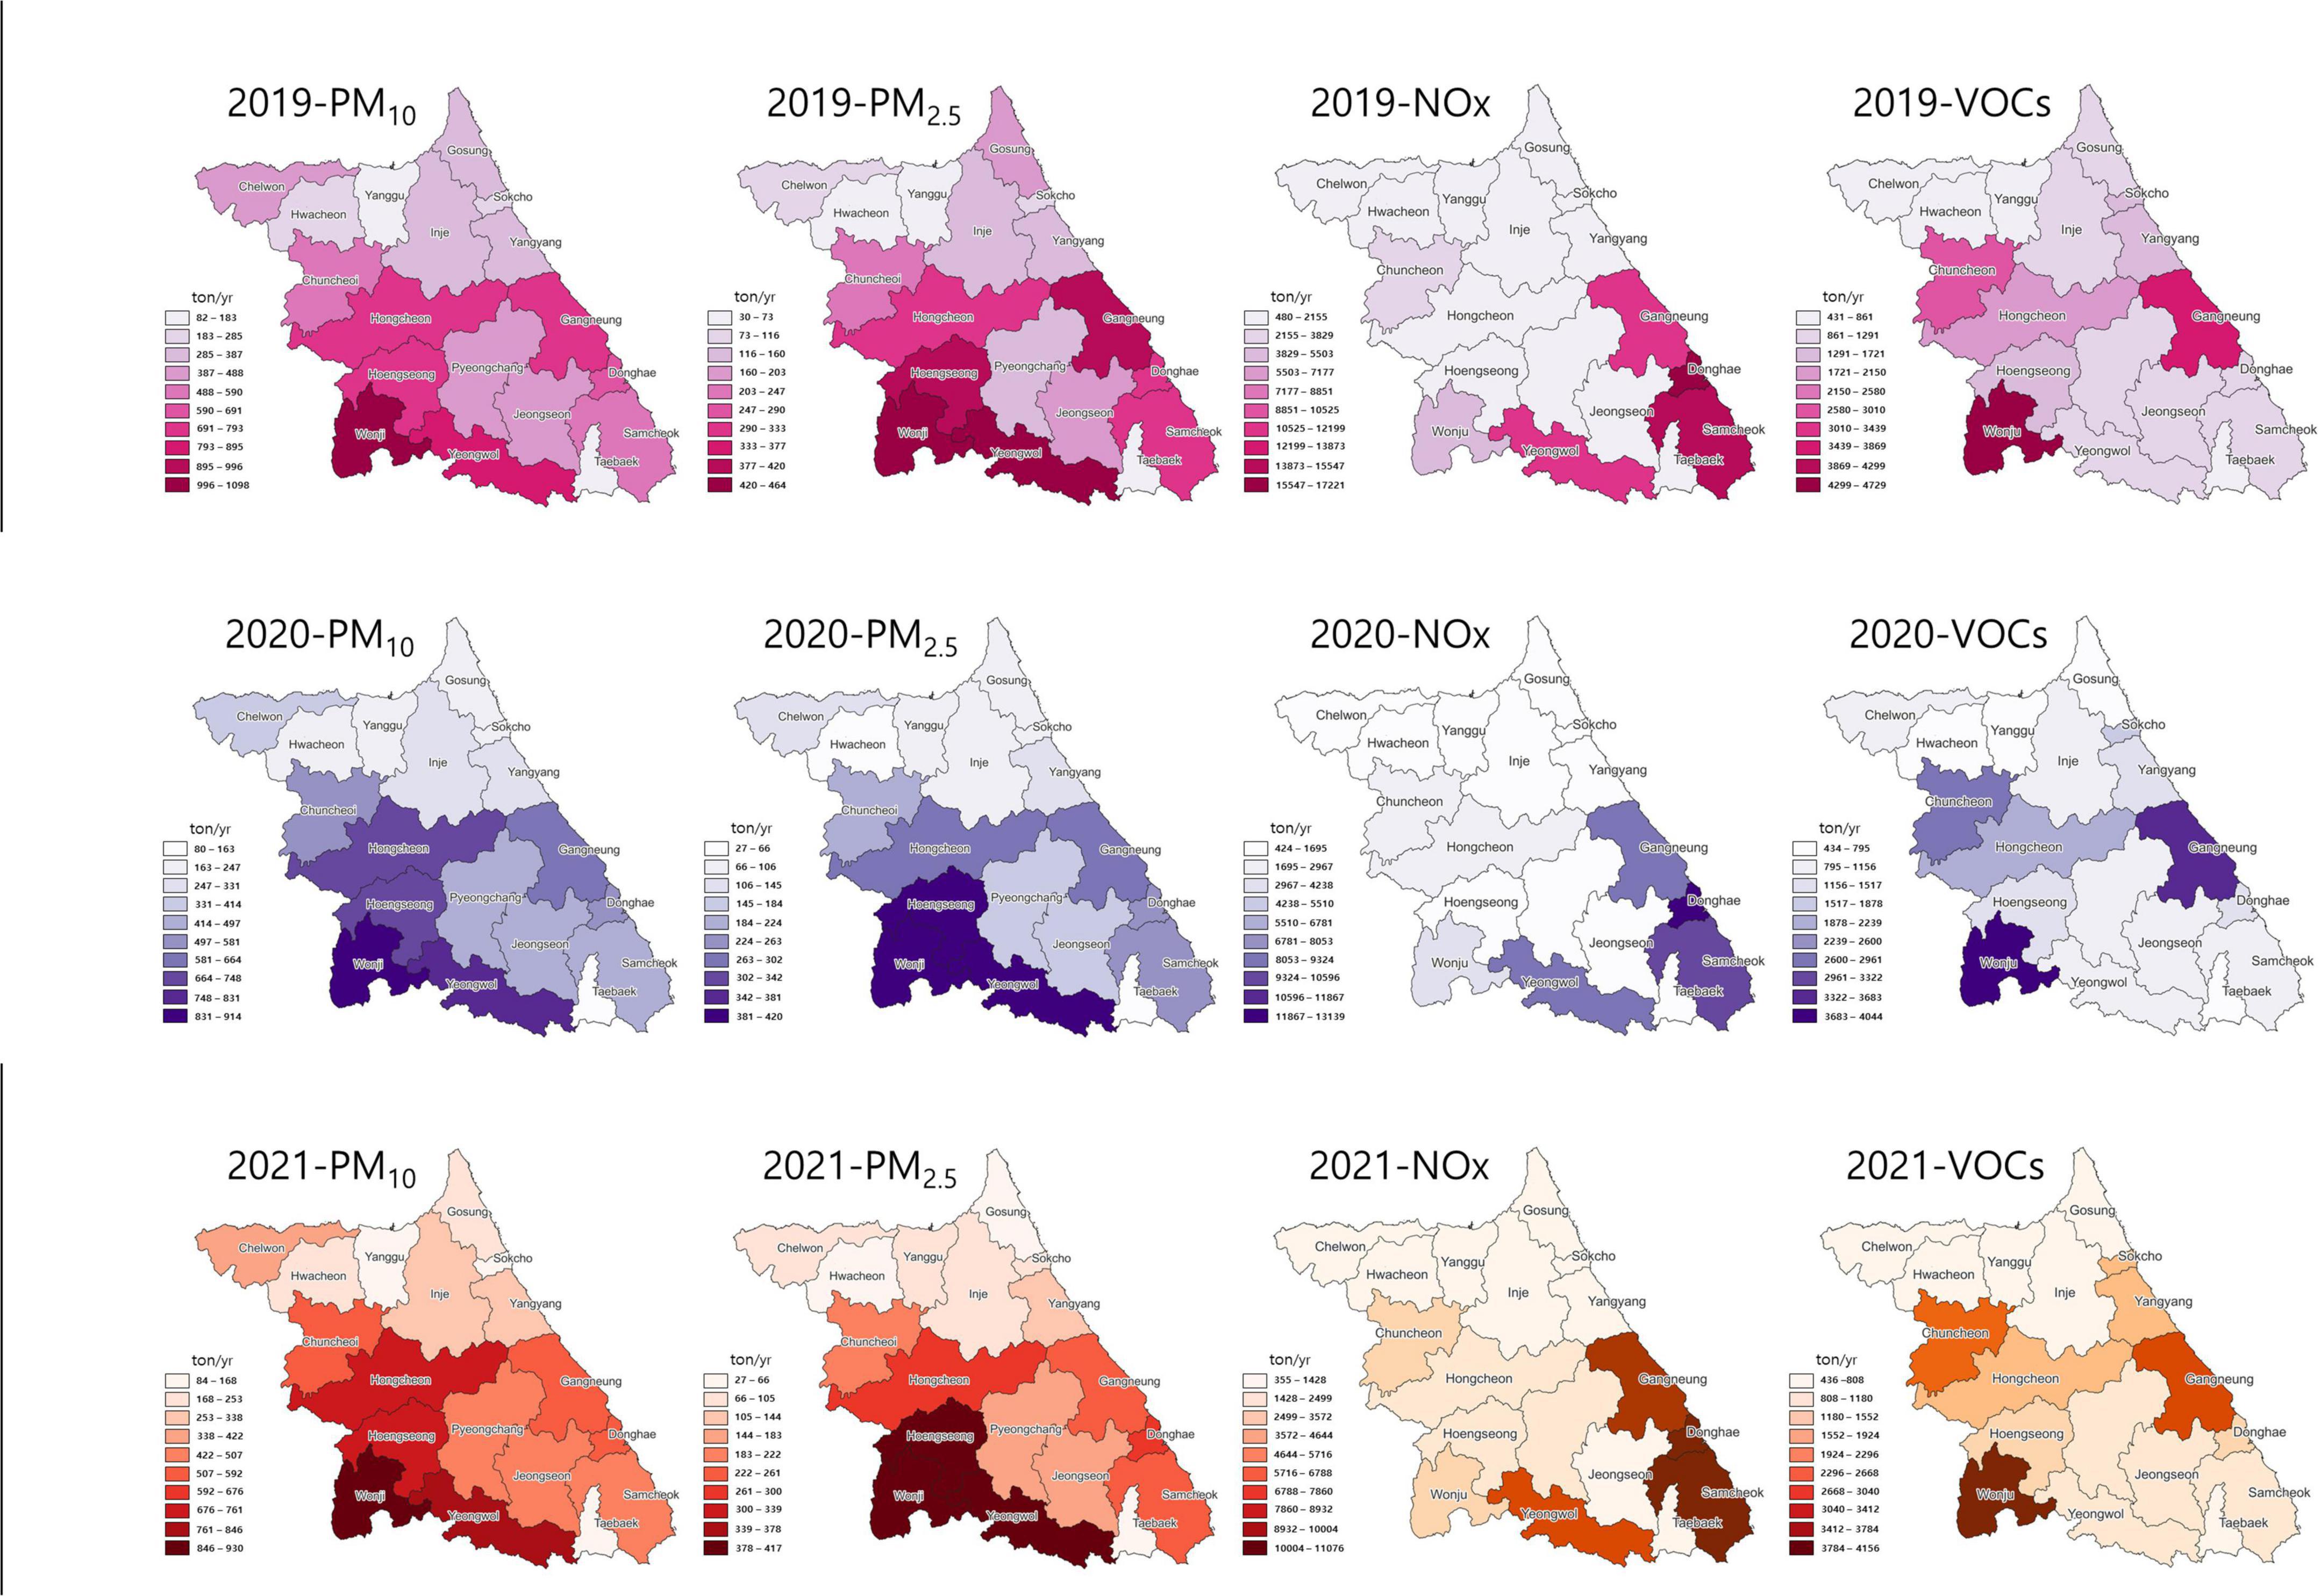
Figure 3. Spatial distribution of PM10, PM2.5, NOx, and volatile organic compounds (VOCs) emissions in Gangwon Province from 2019 to 2021.
In 2019, PM10 and PM2.5 emissions were relatively high in Wonju, Chuncheon, Hongcheon, Pyeongchang, and Gangneung, likely due to various emission sources such as industrial activities, traffic, and heating emissions. Notably, Wonju and Hongcheon consistently exhibited high emissions, indicating that these areas should be prioritized for air quality management.
In 2020, PM10 and PM2.5 emissions generally showed a decreasing trend, which is presumed to be influenced by reduced industrial and traffic activities due to the COVID-19 pandemic, as well as the effects of air quality improvement policies. However, emissions remained high in some areas, including Wonju, Hongcheon, Pyeongchang, and Gangneung, necessitating further analysis of emission sources and additional mitigation measures.
In 2021, emissions showed an increasing trend again, with PM10 and PM2.5 emissions in major urban areas such as Wonju, Chuncheon, and Hongcheon recovering to levels similar to those in 2019. This rebound is likely due to the resumption of economic activities and increases in industrial and traffic emissions. Although emissions remained relatively low in coastal areas, PM2.5 emissions remained high in Pyeongchang and Gangneung, requiring closer monitoring and management of air pollution contributions in the eastern coastal region.
In 2019, NOx emissions were high in urban and industrial areas such as Wonju, Chuncheon, Gangneung, and Donghae. This is likely due to the characteristics of NOx emissions from vehicle exhaust and industrial processes. While NOx emissions showed a slight decrease in 2020, they increased again in 2021. In particular, NOx emissions remained consistently high in Wonju, Chuncheon, and Gangneung, which is presumed to be closely related to increased traffic volumes and industrial facility operations in these areas. Since NOx serves as a key precursor for O3 and PM2.5 formation through photochemical reactions, strengthening emission reduction measures in these regions is essential.
In 2019, VOCs emissions were relatively high in Wonju, Chuncheon, Gangneung, and Hongcheon. VOCs emissions are influenced by various factors, including fossil fuel combustion, solvent use, industrial processes, and biogenic emissions (Wang et al., 2013; Piccot et al., 1992). While VOCs emissions showed a slight decrease in 2020, they increased again in Wonju and Gangneung in 2021. Since VOCs play a critical role in the formation of O3 and secondary organic aerosols (SOA), effective VOC management is essential for reducing both O3 and fine particulate matter concentrations.
Analysis of PM2.5 emission sources in major cities in Gangwon Province showed distinct characteristics(Figure 4). In Chuncheon, biomass burning accounted for the highest proportion (38%), followed by fugitive dust (30%) and non-road transport (12%). This indicates that heating fuel use and urban vehicle movement significantly impact air quality, highlighting the need for improvements in fuel combustion methods and measures to reduce emissions from on-road sources.
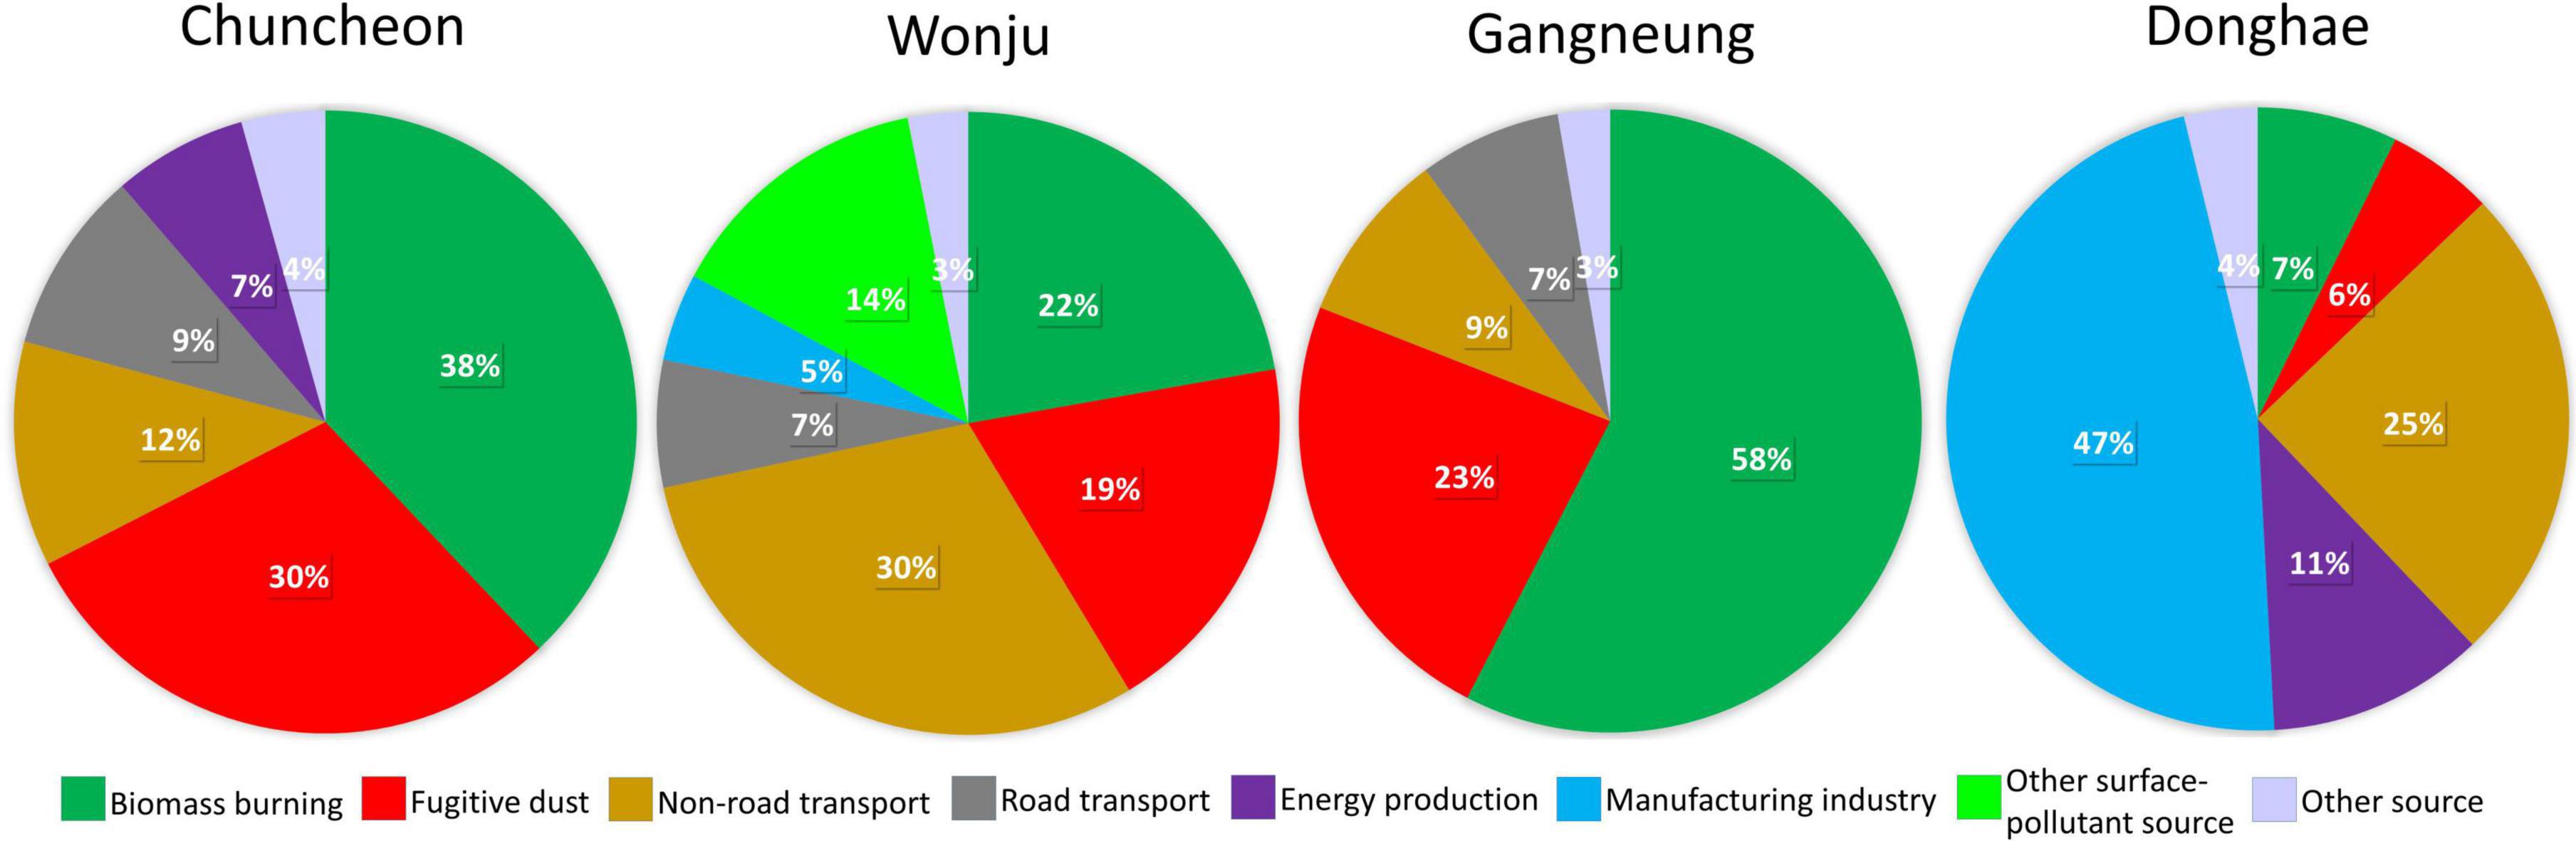
Figure 4. PM2.5 emissions by source category in Chuncheon, Wonju, Gangneung and Donghae.
In Wonju, non-road transport was the dominant source (30%), suggesting that dust emissions from roads and construction sites require stricter management. Additionally, fugitive dust (19%) and biomass burning (22%) also had significant shares, necessitating mitigation strategies for traffic and heating emissions.
In Gangneung, biomass burning accounted for a notably high proportion (58%), followed by fugitive dust (23%) and Non-road transport (9%). This suggests that fuel combustion in agricultural and forested areas is a major emission source, emphasizing the importance of controlling wood combustion and promoting alternative fuels.
In Donghae, reflecting its status as an industrial hub, industrial activities were the dominant emission sources, with manufacturing industry (47%) and non-road transport (25%) contributing the highest shares. energy production (11%) and biomass burning (7%) also had notable impacts, indicating the need for emissions reduction in the industrial, transportation, and energy sectors.
These findings suggest that each city in Gangwon Province has distinct emission characteristics, necessitating tailored air pollution mitigation policies. Chuncheon and Wonju should focus on managing traffic and fugitive dust, Gangneung requires measures to reduce biomass burning, and Donghae needs targeted strategies for industrial emissions control. Establishing a systematic management plan based on regional emission characteristics is essential for implementing effective air quality improvement strategies.
3.3 Changes in the time series of air pollutants in Gangwon Province
According to the time series graph analyzing air pollutant concentration changes in Gangwon Province from 2019 to 2023 (Figure 5), PM10, PM2.5, and O3 all exhibit seasonal variability, with concentrations tending to increase during specific periods.
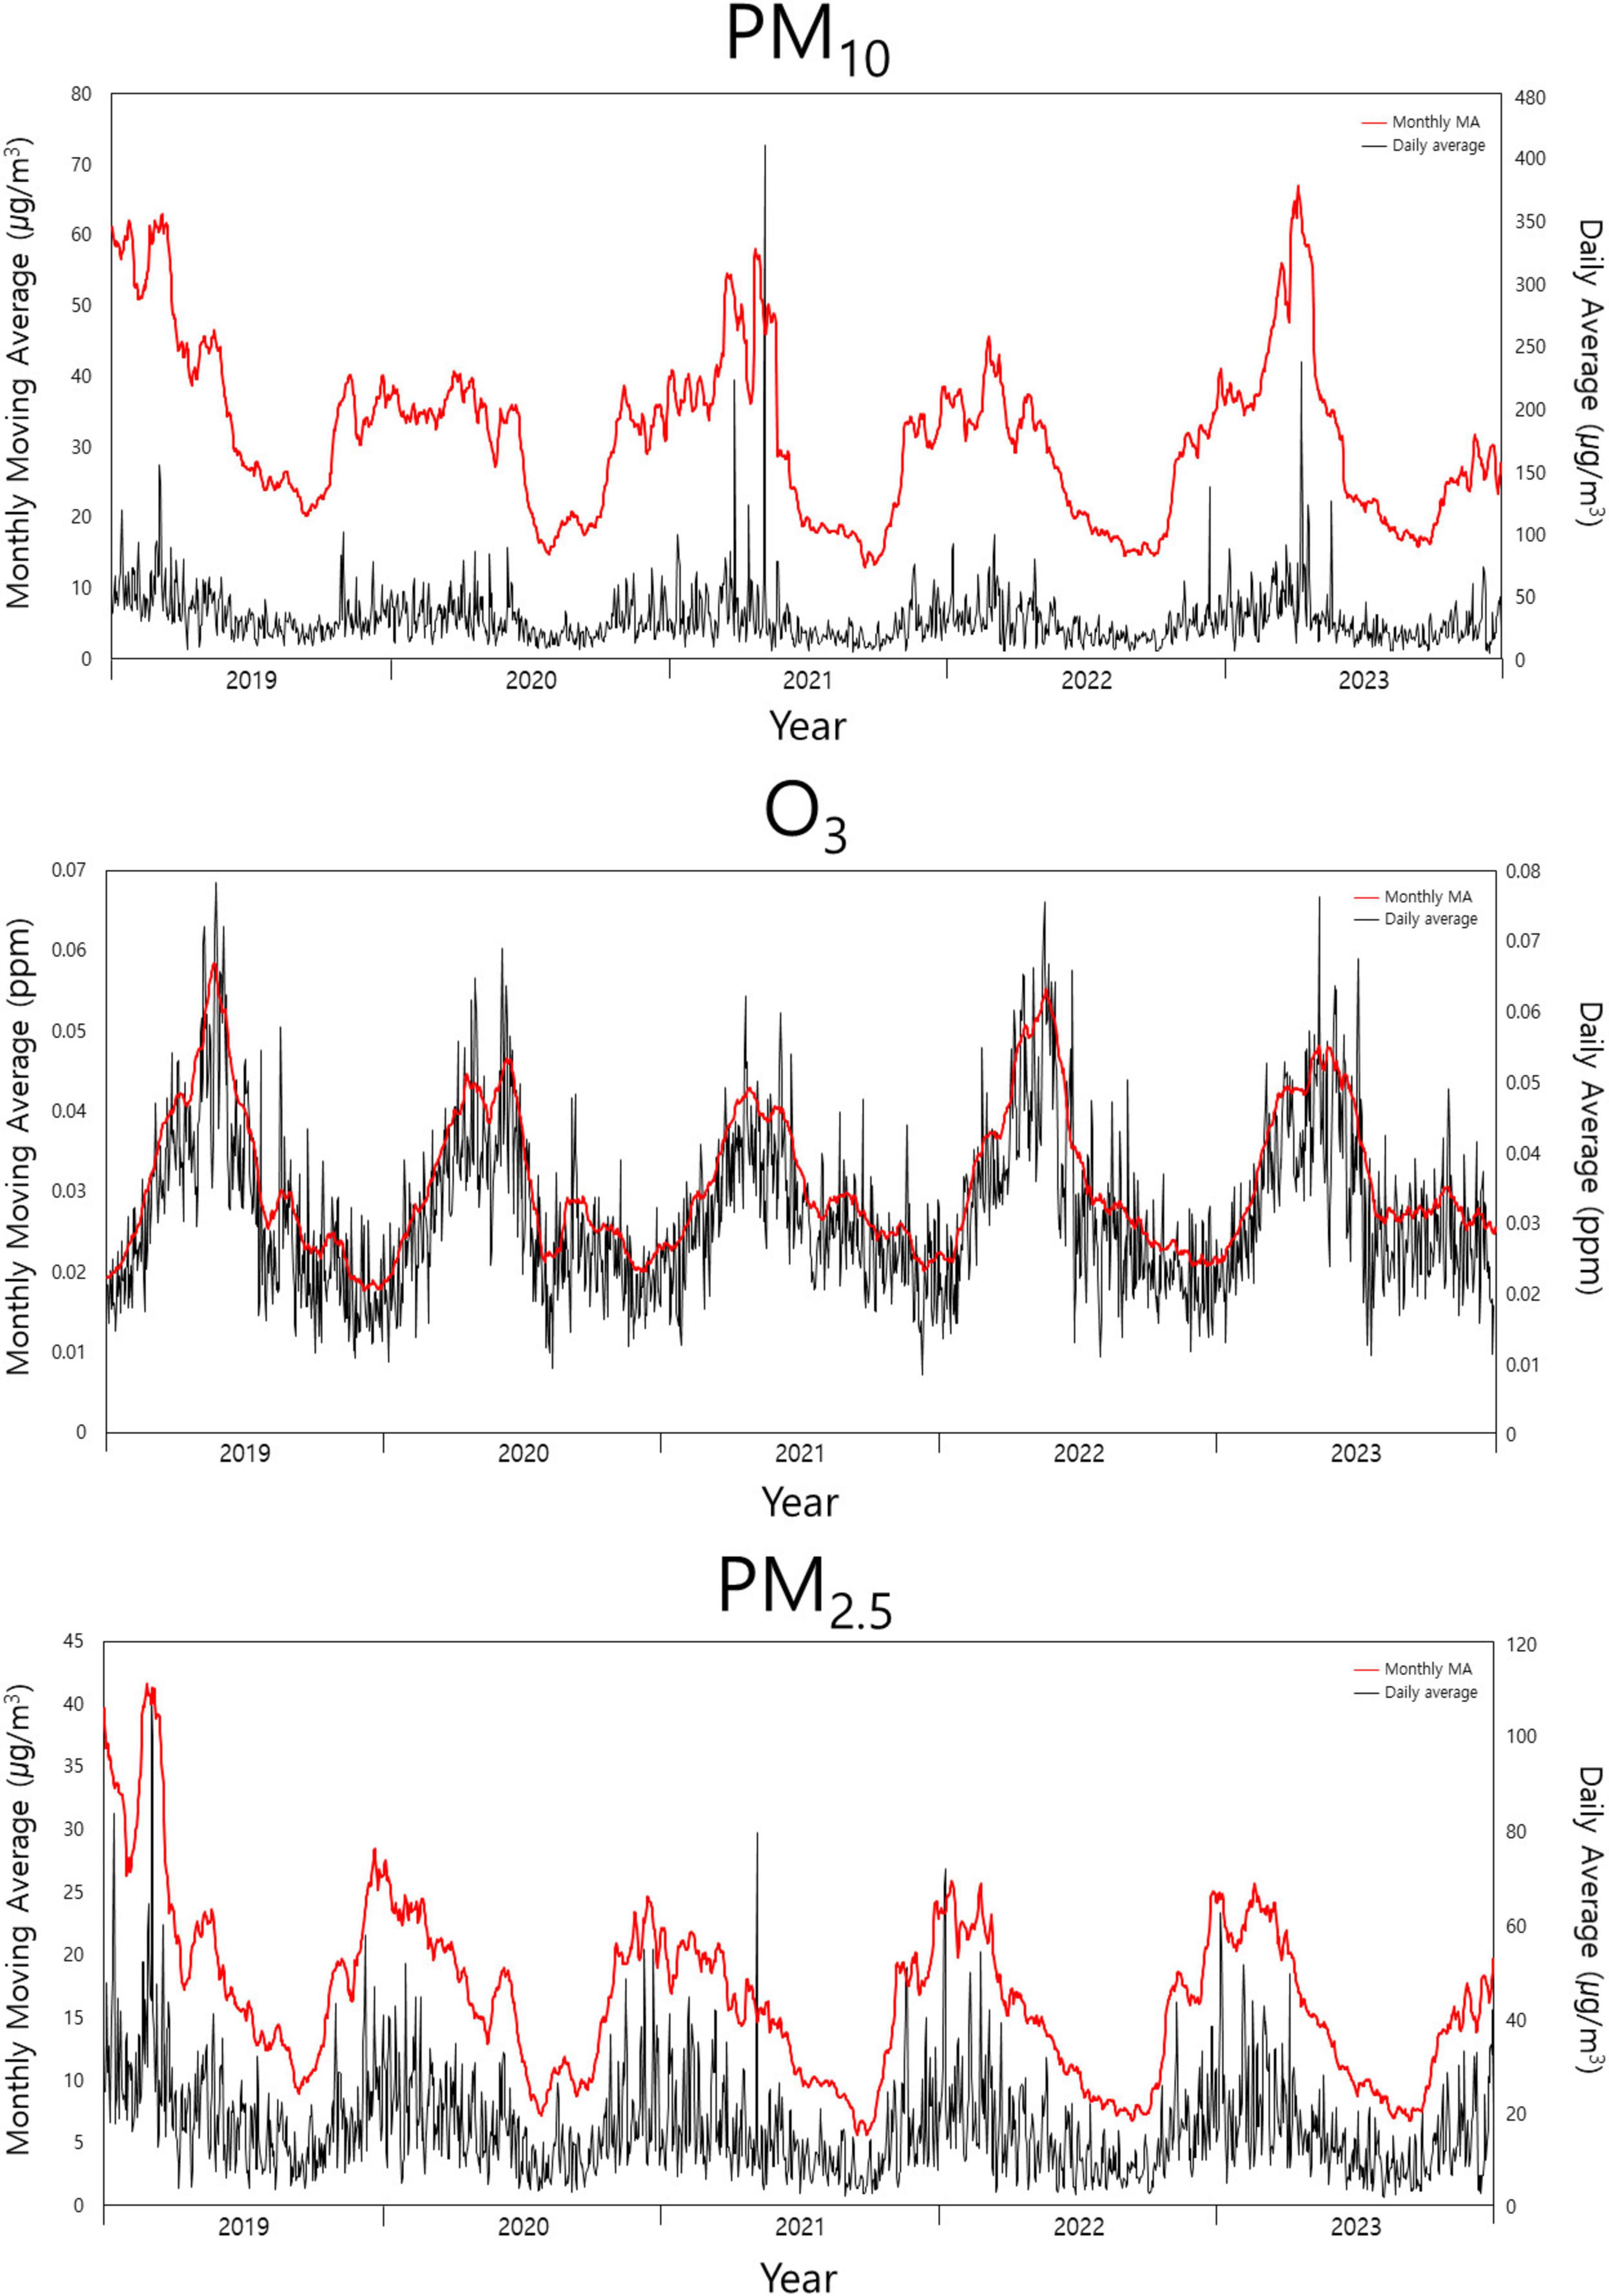
Figure 5. From 2019 to 2021 time series graph of air pollutant concentration in Gangwon Province.
For PM10, the moving monthly average (red line) shows higher values during spring and winter, which is likely related to factors such as yellow dust events, atmospheric stagnation, and increased use of heating fuels. Additionally, sudden spikes in concentration were observed at certain points, which may have been influenced by external inflows, large-scale fires, or changes in meteorological conditions.
Compared to PM10, PM2.5 exhibits relatively stable concentration variations, suggesting that while larger PM10 particles fluctuate due to multiple factors, PM2.5 concentrations are less affected by changes in weather conditions and external inflows on an annual basis. A slight decrease in PM2.5 concentrations was observed in 2020–2021, which appears to be linked to the economic downturn and rising costs during the COVID-19 pandemic, leading to a temporary decline in industrial activities and, consequently, lower pollutant concentrations.
PM2.5 also shows a tendency to peak in spring and winter, similar to PM10, with relatively high variability in concentration. Notably, short-term high-concentration events were observed in 2021 and 2023, likely caused by a combination of factors such as external inflows and changes in meteorological conditions.
The high-concentration fine particulate matter events that occurred from May 7 to 9, 2021, and April 11 to 15, 2023, were attributed to yellow dust originating from the Gobi Desert, leading to elevated particulate matter levels nationwide. Yellow dust from the Gobi Desert is known as a major contributor to high PM concentrations in South Korea during spring (Pi et al., 2009; Lee and Chung, 2012). Furthermore, global climate change has resulted in rising temperatures near the Gobi Desert, causing rapid snowmelt and creating an environment conducive to more frequent yellow dust events, which further contribute to high particulate matter concentrations (Hao et al., 2024; Park et al., 2024).
O3 concentrations also exhibit seasonal variation, showing higher levels in summer and lower levels in winter. This trend aligns with the typical pattern in which O3 formation increases during summer due to intensified photochemical reactions driven by strong solar radiation, whereas lower solar radiation and decreased temperatures in winter lead to reduced O3 concentrations.
The concentrations of air pollutants in Gangwon Province are influenced by seasonal and environmental factors, reflecting the characteristic air pollution patterns in South Korea, where high PM concentrations occur in spring and winter, while O3 levels increase in summer. Consequently, season-specific air quality management strategies are required to improve air quality in Gangwon Province. Strengthening domestic and international measures to reduce fine particulate matter during spring and winter, along with the continuous implementation of O3 control policies in summer, is essential for effective air quality management.
3.4 Correlation coefficients of air pollutants and vegetation by region
Table 3 presents the correlation coefficients between regional air pollutants and NDVI for the year 2019. NDVI showed a negative correlation with particulate matter in all regions at the 95% confidence level, and the correlation was significant at the 99% confidence level, except for the correlation between PM10 and NDVI in Sokcho. The highest negative correlations between PM10 and NDVI were observed in Hongcheon (r = −0.745, p < 0.01), Pyeongchang (r = −0.715, p < 0.01), and Hoengseong (r = −0.680, p < 0.01). For PM2.5 and NDVI, the strongest negative correlations were found in Hwacheon (r = −0.802, p < 0.01), Chuncheon (r = −0.784, p < 0.01), and Hongcheon (r = −0.784, p < 0.01). Overall, particulate matter concentrations tended to decrease as vegetation cover increased.
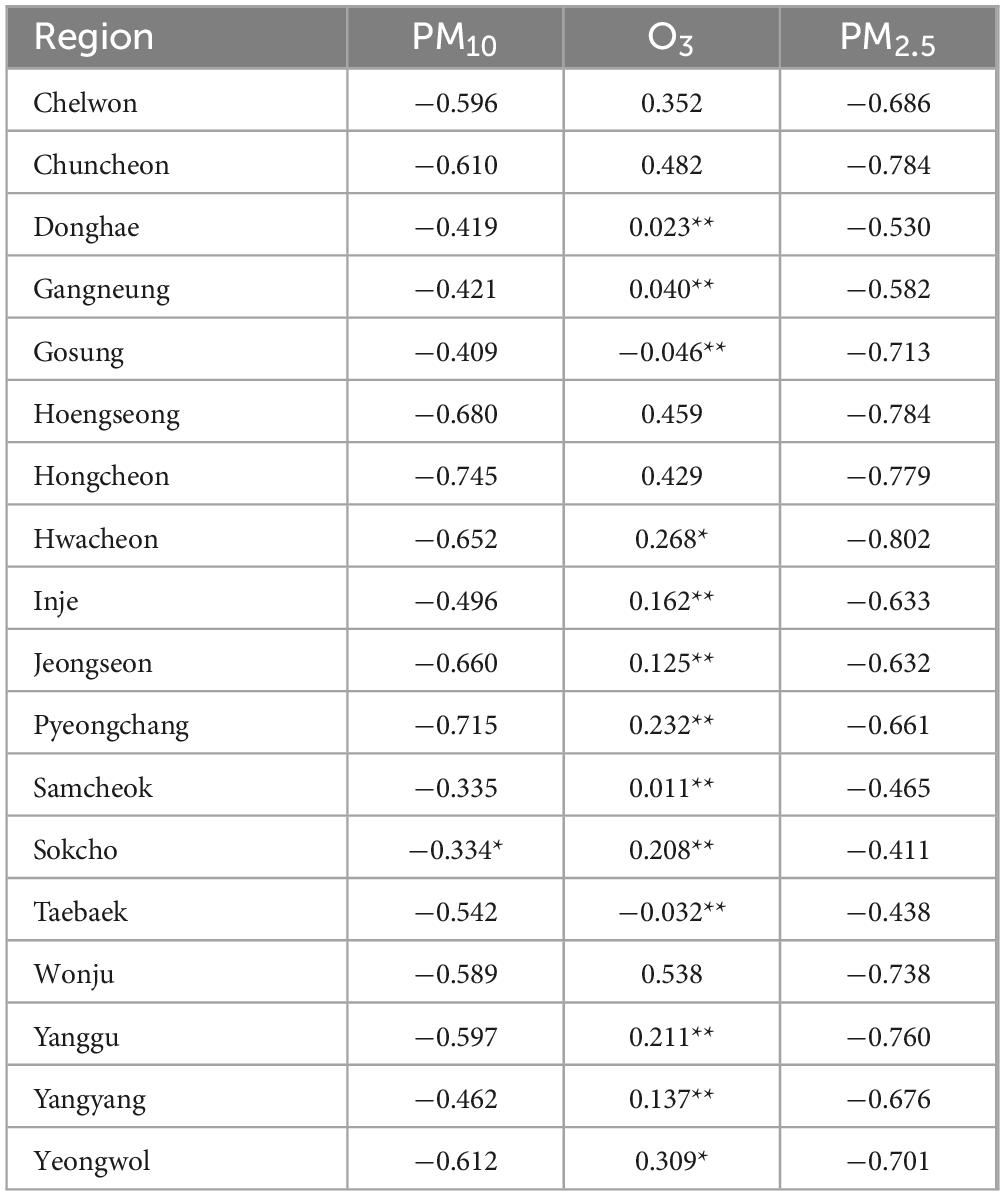
Table 3. Mean and standard deviation of PM10, O3, and PM2.5 in Gangwon Province from 2019 to 2023.
The inverse relationship between monthly vegetation changes and particulate matter concentrations was evident. The negative correlation between PM concentrations and NDVI was stronger for PM2.5 than for PM10, suggesting that smaller particulate matter is more sensitive to vegetation changes.
For O3 and NDVI, correlation coefficients were not statistically significant at the 95% confidence level in many regions. However, in cities located in the the western part of Gangwon Province, including Cheorwon, Chuncheon, Hoengseong, Hongcheon, and Wonju, a positive correlation was observed at the 99% confidence level. This positive correlation indicates that O3 and NDVI exhibit similar variation trends in these areas. These cities share the characteristic of being adjacent to the Seoul metropolitan area. Additionally, Cheorwon, Chuncheon, and Wonju have relatively low NDVI values compared to other regions in Gangwon Province.
Among other regions, particularly in the eastern part of Gangwon Province, the correlation between O3 and NDVI was not significant at the 95% confidence level, with correlation values close to zero, indicating no clear relationship.
In general, both vegetation and O3 levels are influenced by solar radiation, leading to similar trends. However, in South Korea, the summer monsoon season plays a significant meteorological role, allowing vegetation to remain stable while O3 concentrations tend to decrease from spring to early summer, resulting in low correlation coefficients between the two variables.
3.5 Changes in air pollutants and vegetation by month
Figure 6 illustrates the monthly variations of air pollutants and NDVI in Gangwon Province. The NDVI employed the vegetation index data provided by MODIS/Terra. NDVI in Gangwon Province fluctuated in response to South Korea’s seasonal changes. The decrease in NDVI observed in July–August of 2019 and 2021 could indicate actual forest degradation, but the primary cause is likely noise in satellite observation data due to cloud cover during the monsoon season. Although this summer-induced noise makes it difficult to accurately track vegetation changes in Gangwon Province, the NDVI remained around 0.8 during summer over the 5 years period, suggesting that the province maintains healthy vegetation.
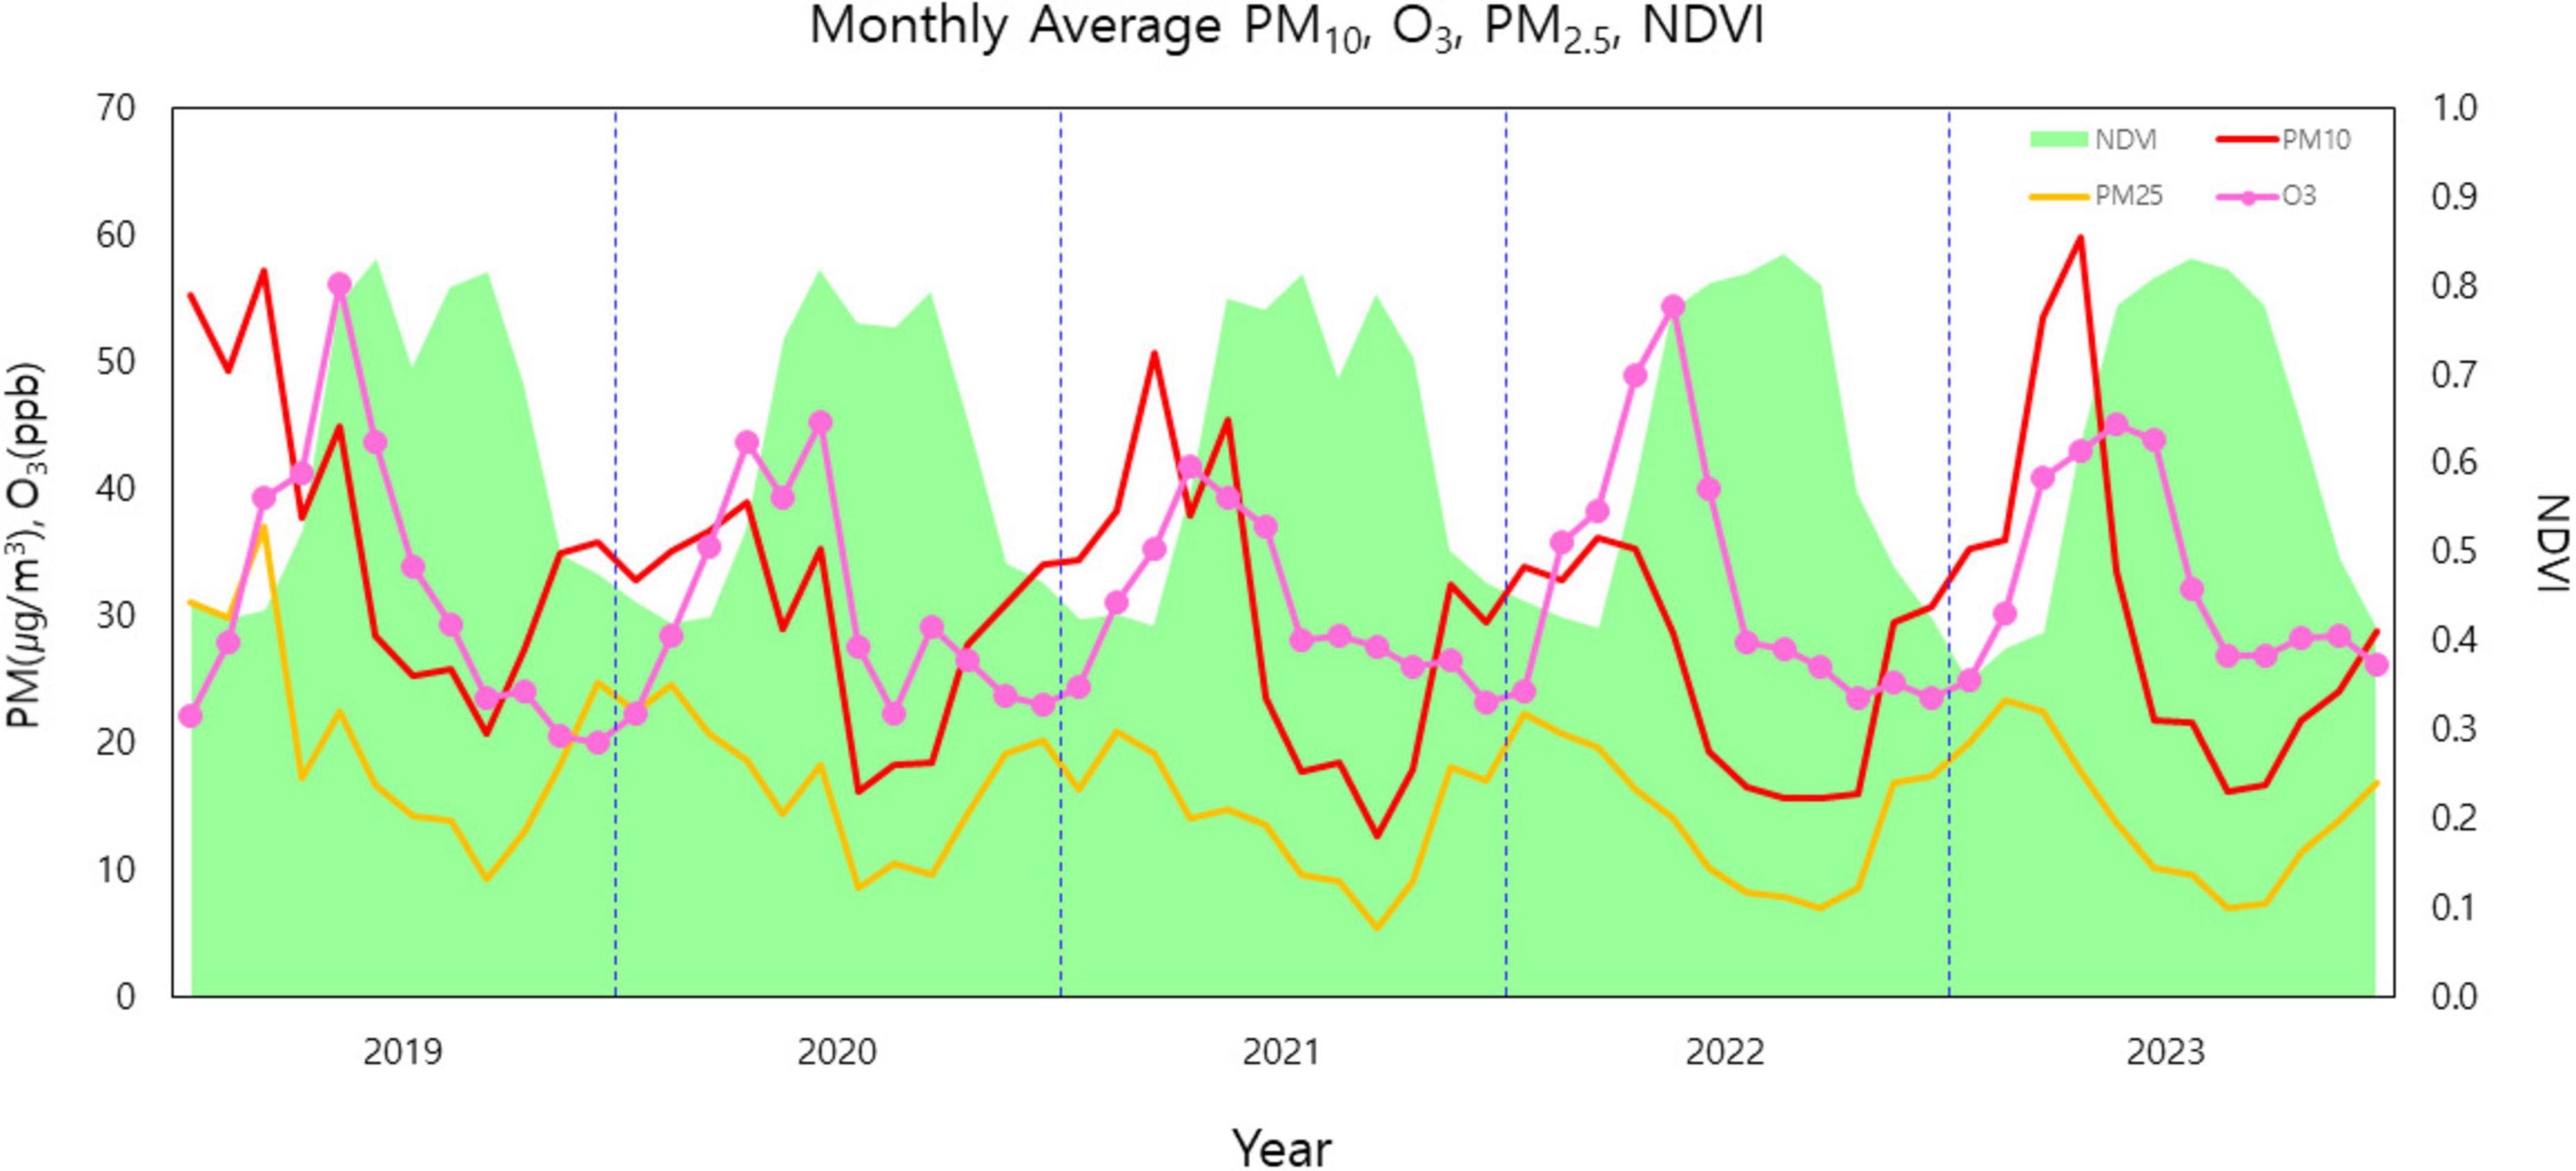
Figure 6. PM10, O3, PM2.5 concentrations and Normalized Difference Vegetation Index (NDVI) monthly changes in Gangwon Province from 2019 to 2023.
For PM10, concentrations were relatively high in 2019, 2021, and 2023, whereas they were lower in 2020 and 2022. Following the COVID-19 pandemic in 2020, overall fine particulate matter concentrations decreased, but PM10 levels rebounded in April 2023, reaching an average of 60 μg/m3, which was higher than the March 2019 average of 57 μg/m3. PM2.5 concentrations showed a pattern similar to PM10, but while PM10 peaked in March–April, PM2.5 peaked in January–February, indicating a difference in seasonal concentration trends. PM10 concentrations in Gangwon Province have returned to pre-pandemic levels, while PM2.5 concentrations remain below the 2019 peak of 37 μg/m3.
Air pollutant concentrations decreased in June and July, coinciding with the peak NDVI values. O3 concentrations were highest in April–May, with a monthly average of 56–42 ppb, and then began to decline. From September to October, O3 remained at lower levels (20–30 ppb), before rising again to 40–60 ppb around February of the following year. PM10 and PM2.5 concentrations were highest from January to April, then decreased in May–June, showing a pattern similar to O3, before increasing again around November.
In South Korea, monsoon rains inhibit photochemical reactions, preventing O3 from reaching high concentrations in July–August. In contrast, in Northern Hemisphere regions with little or no monsoon influence, O3 concentrations typically peak in July–August (Logan, 1985). If South Korea experiences less summer rainfall or a shorter monsoon period due to climate change, O3 concentrations are expected to rise sharply, potentially following a pattern similar to NDVI fluctuations.
Furthermore, increased O3 levels may threaten vegetation in Gangwon Province. O3 can penetrate plant cells through cell membranes and cell walls, causing cellular damage and accelerating leaf aging (Pell et al., 1997). While current summer O3 levels in Gangwon Province remain relatively low, limiting its impact on vegetation, future increases in O3 concentrations could pose a significant risk to plant health.
4 Conclusion
This study analyzed air pollutant concentrations and emission characteristics in Gangwon Province over a 5 years period from 2019 to 2023 and examined their relationship with vegetation distribution. PM10 and PM2.5 concentrations varied by region due to topographical factors, atmospheric stagnation, and emission sources, with relatively high concentrations observed in Chuncheon, Hongcheon, and Wonju, which are located inland. In contrast, coastal areas tended to have lower concentrations due to efficient atmospheric dispersion influenced by maritime effects.
O3 concentrations were relatively higher in coastal and mountainous regions, likely due to topographical features and the influence of land-sea breeze circulation. Air pollutant emissions in Gangwon Province were closely associated with industrial and transportation activities, with PM and O3 precursor emissions being particularly high in Wonju, Chuncheon, and Hongcheon. During the COVID-19 pandemic, emissions generally decreased; however, they rebounded as economic activities resumed. An analysis of major emission sources revealed that transportation and fugitive dust were the primary contributors in Chuncheon and Wonju, biomass burning in Gangneung, and industrial emissions in Donghae, highlighting the need for region-specific air pollution control policies.
Through time series analysis, the seasonal variations in air pollutants in Gangwon Province were identified, with particulate matter concentrations peaking in spring and winter, while O3 concentrations were highest in summer. These patterns were closely linked to factors such as yellow dust events, heating emissions, and photochemical reactions. In particular, large-scale yellow dust events coincided with spikes in particulate matter concentrations, indicating that external inflows significantly impact air quality in Gangwon Province. As climate change progresses, high-concentration pollution events are expected to become more frequent in the future.
The relationship with vegetation revealed that NDVI exhibited a negative correlation with particulate matter concentrations, with a stronger correlation observed for PM2.5 suggesting that vegetation contributes to reduction particulate matter. This finding implies that vegetation conservation and green space expansion could contribute to air quality improvement. Conversely, the correlation between O3 and NDVI varied by region, with some areas in the the western part of Gangwon Province showing a significant positive correlation.
Effective air quality management in Gangwon Province requires customized strategies that account for regional emission characteristics and seasonal variations. Measures should include green space expansion to reduce particulate matter concentrations and precursor emission reduction strategies to manage O3 levels. Additionally, continuous monitoring of external particulate matter inflows and pollutant accumulation during atmospheric stagnation events is essential. Based on these findings, the development of long-term air quality improvement policies is crucial.
Data availability statement
Publicly available datasets were analyzed in this study. This data can be found here: https://www.airkorea.or.kr/web/, https://www.air.go.kr/main.do, https://www.earthdata.nasa.gov.
Author contributions
U-JL: Data curation, Formal Analysis, Investigation, Methodology, Software, Writing – original draft. D-BK: Conceptualization, Formal Analysis, Validation, Visualization, Writing – review and editing. D-WL: Formal Analysis, Investigation, Software, Writing – original draft. M-JK: Formal Analysis, Project administration, Validation, Writing – original draft. S-DL: Conceptualization, Funding acquisition, Resources, Supervision, Writing – review and editing.
Funding
The author(s) declare that financial support was received for the research and/or publication of this article. This study was supported by a grant from the National Institute of Environment Research (NIER), funded by the Ministry of Environment (MOE) of the Republic of Korea (Grant Number NIER-2021-03-03-007), and the Particulate Matter Management Specialized Graduate Program through the Korea Environmental Industry & Technology Institute (KEITI) funded by the Ministry of Environment (MOE).
Conflict of interest
The authors declare that the research was conducted in the absence of any commercial or financial relationships that could be construed as a potential conflict of interest.
Generative AI statement
The author(s) verify and take full responsibility for the use of generative AI in the preparation of this manuscript. Generative AI was used We use CHAT GPT, one of the AIs, to translate papers written in Korean into English. Other than that, we didn’t use AI.
Publisher’s note
All claims expressed in this article are solely those of the authors and do not necessarily represent those of their affiliated organizations, or those of the publisher, the editors and the reviewers. Any product that may be evaluated in this article, or claim that may be made by its manufacturer, is not guaranteed or endorsed by the publisher.
Footnotes
References
Allabakash, S., Lim, S., Chong, K.-S., and Yamada, T. J. (2022). Particulate matter concentrations over South Korea: Impact of meteorology and other pollutants. Remote Sens. 14:4849. doi: 10.3390/rs14194849
Altindag, D. T., Baek, D., and Mocan, N. (2017). Chinese yellow dust and Korean infant health. Soc. Sci. Med. 186, 78–86. doi: 10.1016/j.socscimed.2017.05.031
Brunekreef, B., and Holgate, S. T. (2002). Air pollution and health. Lancet 360, 1233–1242. doi: 10.1016/S0140-6736(02)11274-8
Calfapietra, C., Fares, S., Manes, F., Morani, A., Sgrigna, G., and Loreto, F. (2013). Role of biogenic volatile organic compounds (BVOC) emitted by urban trees on ozone concentration in cities: A review. Environ. Pollut. 183, 71–80. doi: 10.1016/j.envpol.2013.03.012
Cho, S. H., Kim, P. R., Han, Y. J., Kim, H. W., and Yi, S. M. (2016). Characteristics of ionic and carbonaceous compounds in PM2.5 and high concentration events in Chuncheon, Korea. J. Korean Soc. Atmosph. Environ. 32, 435–447. doi: 10.5572/KOSAE.2016.32.4.435
Grantz, D., Garner, J., and Johnson, D. (2003). Ecological effects of particulate matter. Environ. Int. 29, 213–239. doi: 10.1016/S0160-4120(02)00181-2
Hao, Y., Wang, Z., Xue, L., Lou, S., Ding, K., Qin, Y., et al. (2024). Modeling the effects of vegetation and snow on dust storm over the Gobi Desert. J. Geophys. Res. Atmosph. 129, e2024JD041407. doi: 10.1029/2024jd041407
Ho, C.-H., Heo, J.-W., Chang, M., Choi, W., Kim, J., Kim, S.-W., et al. (2021). Regulatory measures significantly reduced air-pollutant concentrations in Seoul, Korea. Atmosph. Pollut. Res. 12:101098. doi: 10.1016/j.apr.2021.101098
Janhäll, S. (2015). Review on urban vegetation and particulate air pollution-Deposition and dispersion. Atmosph. Environ. 105, 130–137. doi: 10.1016/j.atmosenv.2015.01.052
Kim, D. B. (2017). The analysis of correlation between BVOCs and ozone at Taehwa Research Forest. Seoul: University of Seoul.
Landrigan, P. J. (2017). Air pollution and health. Lancet Public Health 2, e4–e5. doi: 10.1016/S2468-2667(16)30023-8
Lee, M. S., and Chung, J. D. (2012). Impact of yellow dust transport from gobi desert on fractional ratio and correlations of temporal PM10, PM2.5, PM1 at Gangneung City in fall. Korean Environ. Sci. Soc. 21, 217–231. doi: 10.5322/JES.2012.21.2.217
Liu, J., Li, J., and Yao, F. (2022). Source-receptor relationship of transboundary particulate matter pollution between China, South Korea and Japan: Approaches, current understanding and limitations. Crit. Rev. Environ. Sci. Technol. 52, 3896–3920. doi: 10.1080/10643389.2021.1964308
Logan, J. A. (1985). Tropospheric ozone: Seasonal behavior, trends, and anthropogenic influence. J. Geophys. Res. Atmosph. 90, 10463–10482. doi: 10.1029/JD090iD06p10463
Lu, S., Yang, X., Li, S., Chen, B., Jiang, Y., Wang, D., et al. (2018). Effects of plant leaf surface and different pollution levels on PM2.5 adsorption capacity. Urban For. Urban Green. 34, 64–70. doi: 10.1016/j.ufug.2018.05.006
Martilli, A. (2003). A two-dimensional numerical study of the impact of a city on atmospheric circulation and pollutant dispersion in a coastal environment. Bound. Layer Meteorol. 108, 91–119. doi: 10.1023/A:1023044100064
NIER (2022). Annual report of air quality in Korea 2022. Incheon: National Institute of Environmental Research.
Park, S. S., and Kim, Y. J. (2005). Source contributions to fine particulate matter in an urban atmosphere. Chemosphere 59, 217–226. doi: 10.1016/j.chemosphere.2004.11.001
Park, Y., Kim, S.-W., Yang, Y.-M., Kim, K.-M., Sung, M.-K., and An, S.-I. (2024). Possible impact of North Atlantic sea surface temperature on decadal variability of dust activity in Gobi Desert. Environ. Res. Commun. 6:011003. doi: 10.1088/2515-7620/ad19f3
Pell, E. J., Schlagnhaufer, C. D., and Arteca, R. N. (1997). Ozone-induced oxidative stress: Mechanisms of action and reaction. Physiol. Plant. 100, 264–273. doi: 10.1111/j.1399-3054.1997.tb04782.x
Pi, K. J., Han, K. S., and Park, S. J. (2009). A comparative analysis of land cover changes among different source regions of dust emission in East Asia: Gobi desert and Manchuria. Korean J. Remote Sens. 25, 175–184. doi: 10.7780/kjrs.2009.25.2.175
Piccot, S. D., Watson, J. J., and Jones, J. W. (1992). A global inventory of volatile organic compound emissions from anthropogenic sources. J. Geophys. Res. Atmosph. 97, 9897–9912. doi: 10.1029/92JD00682
Wang, H., Nie, L., Li, J., Wang, Y., Wang, G., Wang, J., et al. (2013). Characterization and assessment of volatile organic compounds (VOCs) emissions from typical industries. Chin. Sci. Bull. 58, 724–730. doi: 10.1016/j.apr.2018.10.010
Xie, Y., Zhao, X., Li, L., and Wang, H. (2010). “Calculating NDVI for landsat7-ETM data after atmospheric correction using 6S model: A case study in Zhangye city, China,” in Proceedings of the 2010 18th international conference on geoinformatics, (Beijing).
Xing, Y.-F., Xu, Y.-H., Shi, M.-H., and Lian, Y.-X. (2016). The impact of PM2.5 on the human respiratory system. J. Thorac. Dis. 8:E69. doi: 10.3978/j.issn.2072-1439.2016.01.19
Keywords: air pollution, NDVI, emission sources, seasonal variation, climate change air pollution, climate change
Citation: Lee U-J, Kim D-B, Lee D-W, Kim M-J and Lee S-D (2025) Spatiotemporal analysis of air pollutants and forest vegetation characteristics in Gangwon Province, South Korea. Front. For. Glob. Change 8:1600248. doi: 10.3389/ffgc.2025.1600248
Received: 26 March 2025; Accepted: 13 May 2025;
Published: 11 June 2025.
Edited by:
Jianhuai Ye, Southern University of Science and Technology, ChinaReviewed by:
Hasim Altan, Prince Mohammad Bin Fahd University, Saudi ArabiaMuhammad Shahid, Brunel University of London, United Kingdom
Copyright © 2025 Lee, Kim, Lee, Kim and Lee. This is an open-access article distributed under the terms of the Creative Commons Attribution License (CC BY). The use, distribution or reproduction in other forums is permitted, provided the original author(s) and the copyright owner(s) are credited and that the original publication in this journal is cited, in accordance with accepted academic practice. No use, distribution or reproduction is permitted which does not comply with these terms.
*Correspondence: Sang-Deok Lee, c2RsZWVAa2FuZ3dvbi5hYy5rcg==