Abstract
Introduction:
Climate change is driving unprecedented shifts in ecosystems, altering species distributions, abundance, and richness. This study aims to predict the potential distribution of the alpine endemic species Piptanthus nepalensis in China under current and future climate scenarios and assess its response to climate change.
Methods:
We employed the Maximum Entropy (MaxEnt) model, rigorously optimized using ENMeval, to predict distribution patterns. Key environmental variables were selected for model calibration. Model performance was evaluated using the Area Under the Receiver Operating Characteristic Curve (AUC).
Results:
The optimized MaxEnt model demonstrated excellent predictive performance (AUC = 0.985). Key findings are: (1) The current total suitable habitat area is 25.78 × 10⁴ km2, with high-suitability zones (6.90 × 10⁴ km2) concentrated along the Sichuan-Yunnan-Tibet border; (2) Under future climate scenarios, low-suitability areas expand (peaking at 31.29 × 10⁴ km2 under SSP370-2050s), while high-suitability areas contract substantially (declining to 3.92 × 10⁴ km2 under SSP585-2050s); (3) Habitat quality is negatively correlated with climate emission intensity. High-suitability zones show relative stability under SSP126 (core retention rate: 0.71%–0.83%) but exhibit pronounced “expansion-contraction oscillations” under SSP585.
Discussion:
These results highlight the significant threat climate change poses to P. nepalensis, particularly under high-emission scenarios. Conservation efforts should prioritize the core Sichuan-Yunnan-Tibet regions and closely monitor ecological risks associated with expanding low-suitability habitats. This study provides critical scientific insights for the climate-adaptive management of alpine endemic species.
1 Introduction
P. nepalensis D. Don (syn. P. nepalensis auct. non-Hook.), a species within the class Magnoliopsida and genus Piptanthus, is an evergreen shrub endemic to the Tibetan Plateau. This species is characterized by its dense inflorescences, extended flowering period, and high adaptability to alpine environments. It exhibits notable drought resistance, resilience to nutrient-poor soils, and minimal susceptibility to pests and diseases, making it an ecologically valuable species for ecosystem restoration and afforestation efforts (Cun and Wang et al., 2010; Wang et al., 2015). Beyond its ecological role, P. nepalensis holds economic significance, serving as an ornamental plant, livestock forage, and a key component in soil and water conservation strategies across high-altitude landscapes. Given its multiple ecosystem services, understanding its spatial distribution and responses to climate change is critical for promoting sustainable land management and biodiversity conservation for the harsh habitats in the alpine ecosystems (Wilson et al., 2004).
Climate change has profoundly transformed ecosystems, leading to significant shifts in species distributions, population dynamics, and biodiversity across multiple taxa and spatial scales (Chen et al., 2011). The Intergovernmental Panel on Climate Change (IPCC) projects global temperature increases ranging from 0.3–1.7 (minimum) to 2.6–4.8°C (maximum) by 2100, potentially driving bioclimatic zones upward by 500–700 m (Hickling et al., 2006; Hiddink and Ter Hofstede, 2007). These changes pose severe threats to alpine plant species, particularly those with narrow ecological niches, as habitat fragmentation and loss accelerate their extinction risks (Guisan and Thuiller, 2005). Understanding the ecological responses of such species under changing climatic conditions is essential for biodiversity conservation and ecosystem stability (Hutchinson, 1957).
Species distribution models (SDMs) serve as pivotal analytical tools in contemporary biogeography, enabling quantitative assessments of habitat suitability and niche dynamics across environmental gradients. Globally and within China, SDMs have been extensively applied to predict climate change impacts on species distributions, including alpine flora on the Tibetan Plateau. For instance, studies have documented significant range shifts in endemic species like Larix species (Guo et al., 2023) and Sophora moorcroftiana (Yang et al., 2021), highlighting the vulnerability of high-altitude ecosystems. Nationally, research on the Qinghai-Tibet Plateau’s flora using SDMs has grown substantially, focusing on genetic diversity, niche modeling, and conservation prioritization (Guo et al., 2023; Yang et al., 2021; Wang et al., 2015). Diverse algorithmic frameworks address this challenge through distinct ecological assumptions: Climate-envelope models such as BIOCLIM delineate species’ climatic tolerances using percentile thresholds of environmental variables, yet oversimplify biotic interactions (Guisan and Zimmermann, 2000). Distance-based approaches exemplified by DOMAIN calculate habitat similarity through environmental space metrics, proving effective in insular ecosystems but sensitive to variable selection (Elith and Leathwick, 2009). Machine learning paradigms, including Random Forests (RF), leverage ensemble decision trees to manage high-dimensional data structures, though requiring extensive occurrence records for model stability (Xu et al., 2019). Contrastingly, parametric techniques like Generalized Linear/Additive Models (GLMs/GAMs) offer transparent ecological interpretations but constrain non-linear response modeling (Phillips et al., 2006).The Maximum Entropy (MaxEnt) framework addresses these limitations through a presence-background learning algorithm that maximizes entropy under environmental constraints, demonstrating exceptional performance specifically with sparse occurrence data (a common challenge for endemic alpine species like P. nepalensis) and in capturing complex covariate interactions (Liu et al., 2013). Its proven capacity to mitigate spatial autocorrelation artifacts while maintaining ecological interpretability (Phillips et al., 2017), and its widespread and successful application in predicting distributions for Himalayan-Tibetan flora under climate change scenarios (Li et al., 2022), make it particularly suitable for our objectives. Our study employs MaxEnt 3.4.1 to predict habitat suitability, capitalizing on its proven capacity to mitigate spatial autocorrelation artifacts while maintaining ecological interpretability (Phillips et al., 2017). Model outputs (0–1 probability surfaces) enabled precise identification of conservation priority zones within fragmented landscapes, underscoring its utility in spatial biodiversity planning (Valavi et al., 2022).
Climate change has significantly altered the distribution patterns of alpine species on the Tibetan Plateau, such as Larix spp. and Sophora moorcroftiana (Guo et al., 2023; Yang et al., 2021). Larch populations have shifted upward in elevation in response to rising temperatures, while S. moorcroftiana faces habitat contraction due to increased aridity and soil degradation. These changes highlight the vulnerability of species with similar ecological niches, including P. nepalensis, which is primarily distributed in high-altitude regions of the Himalayas. These habitats are particularly susceptible to climate change impacts, including rising temperatures, altered precipitation regimes, and increased frequency of extreme weather events, which can lead to habitat fragmentation, reduced genetic diversity, and range shifts. Despite its ecological importance, the impacts of climate change on P. nepalensis remain poorly understood, particularly its potential range shifts, habitat stability, and adaptive capacity under future climatic scenarios. Empirical data on its ecological thresholds and responses to environmental changes are scarce, underscoring the need for comprehensive studies to assess its spatial and temporal habitat dynamics. Such research is critical for informing conservation strategies and mitigating climate-induced biodiversity losses in high-altitude ecosystems.
This study aims to: (1) map the current spatial distribution and identify key environmental drivers; (2) project future distribution shifts under varying emission scenarios (SSP1-2.6, SSP2-4.5, SSP3-7.0, SSP5-8.5); and (3) characterize habitat stability and contraction-expansion patterns.
2 Materials and methods
2.1 Species occurrence data
To construct a robust species distribution model (SDM) for Piptanthus nepalensis, occurrence records were compiled from two authoritative biodiversity databases: the Chinese Virtual Herbarium (CVH) (visited on 20 April 2024)1 and the Global Biodiversity Information Facility (GBIF) (visited on 20 April 2024).2 Given the potential for spatial clustering, taxonomic inconsistencies, and georeferencing errors in raw biodiversity data, a rigorous data preprocessing pipeline was implemented. First, duplicate records and erroneous occurrences (e.g., those falling outside the known ecological range of P. nepalensis) were identified and removed. Ecological range validation was conducted through a three-step process: (1) Geographically filtering records beyond the species’ documented elevational limits (3,200–4,500 m) (Wink, 2013); (2) Excluding points exhibiting bioclimatic extremes exceeding the 99th percentile of occurrence-based climate envelopes for Bio6 (minimum temperature of coldest month: > –8.5°C) and Bio12 (annual precipitation: < 800 mm) (Owens et al., 2013); (3) Removing localities in ecoregions with no prior field confirmation of P. nepalensis presence according to the Chinese Vegetation Atlas (Editorial Committee of Vegetation Map of China., 2001). These criteria ensure alignment with the species’ realized niche while maintaining conservatism in range delineation. To minimize sampling bias and ensure spatial independence, occurrence thinning was conducted using ENMTools at a spatial resolution of 30 arcseconds (∼1 km2), retaining only one occurrence point per grid cell. This resolution aligns with the native grain of the bioclimatic and elevation variables (WorldClim/HWSD) and mitigates overrepresentation of densely sampled regions while preserving ecologically meaningful habitat heterogeneity. Following quality control and validation procedures, a final dataset comprising 72 georeferenced occurrence points was obtained. These refined records were systematically formatted in CSV format, with standardized columns for species name, longitude, and latitude, serving as the foundation for subsequent modeling and analysis (Figure 1). This article is based on the standard map with review number GS (2024) 0650 downloaded from the standard map service website of the Ministry of Natural Resources, with no modifications to the base map.
FIGURE 1
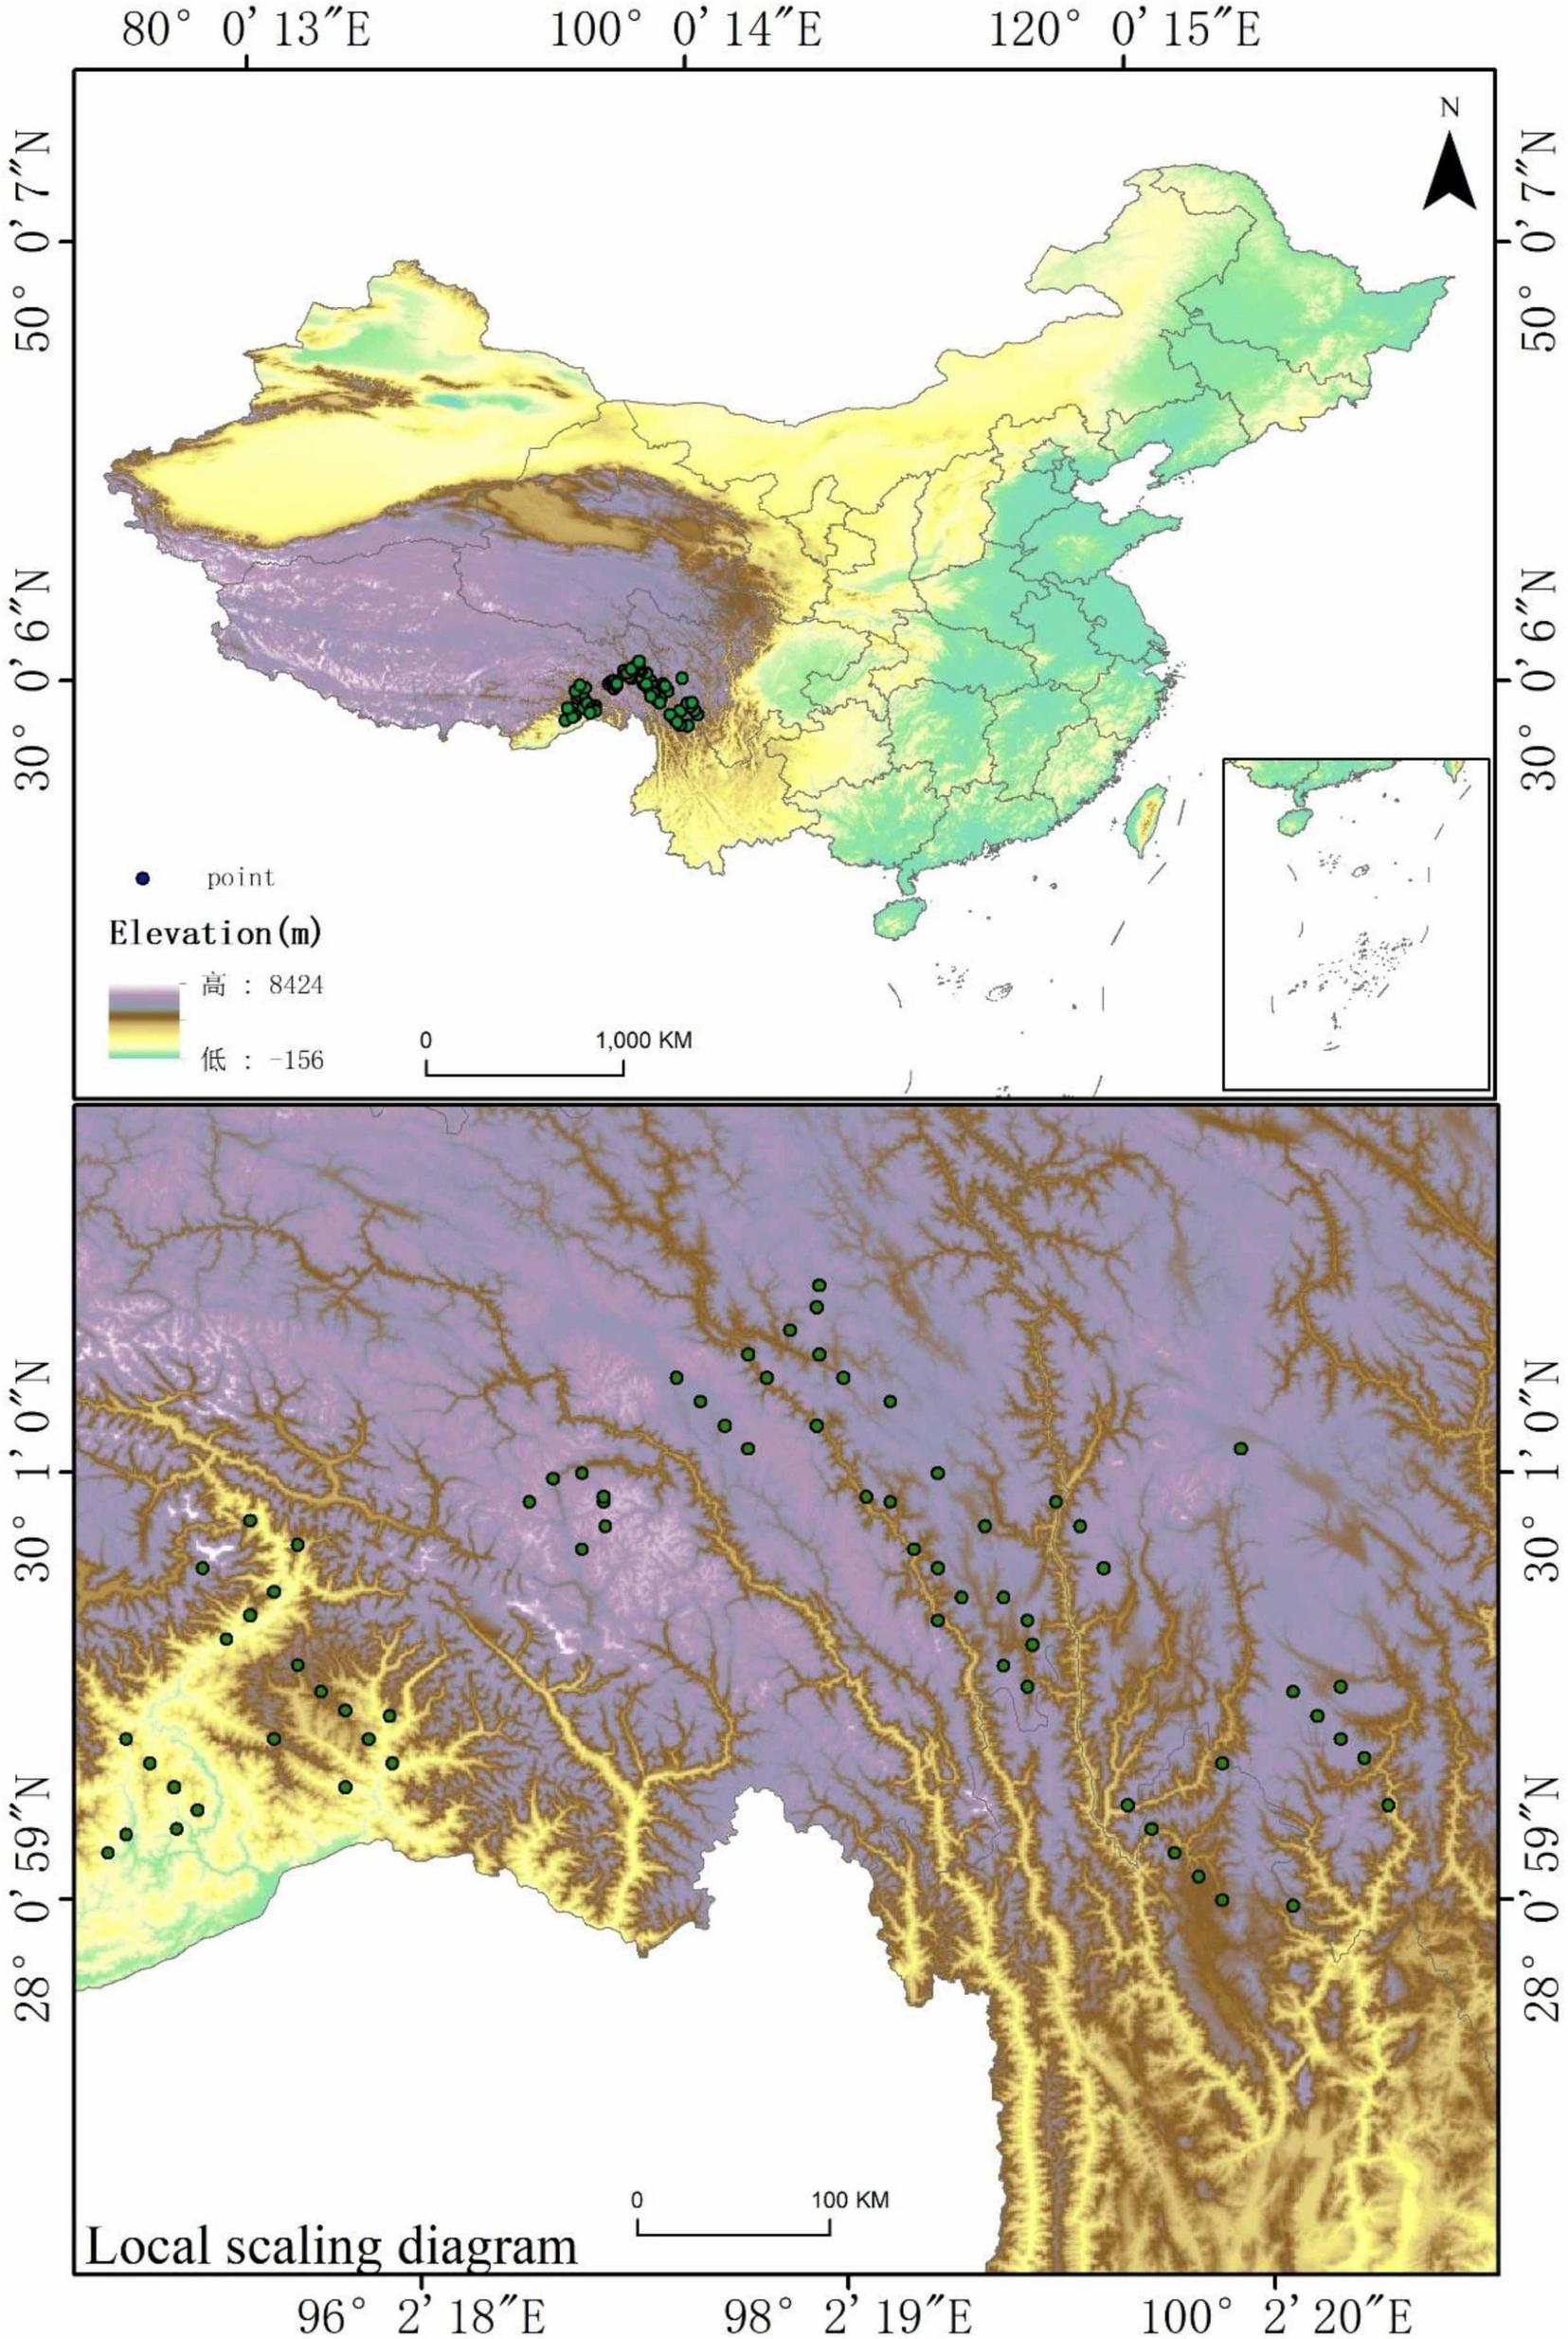
Current occurrence records of Piptanthus nepalensis across its native range.
2.2 Environmental variables
A total of 56 environmental variables were initially considered for modeling, encompassing 19 bioclimatic variables (Bio1–Bio19), three topographic factors (aspect, elevation, and slope), and 34 soil parameters. Bioclimatic and elevation data, with a spatial resolution of 30 arcseconds (∼1 km), were obtained from the WorldClim database (visited on 20 April 2024) (Hijmans et al., 2005), while soil attributes were extracted from the FAO Harmonized World Soil Database (HWSD). To assess the potential impact of climate change on the distribution of P. nepalensis, future climatic projections were incorporated using the EC-Earth3-Veg model under the Coupled Model Intercomparison Project Phase 6 (CMIP6). This model was selected based on its demonstrated skill in simulating temperature and precipitation extremes in high-elevation Asian ecosystems (Wang et al., 2021), a dynamic vegetation module capable of capturing critical feedbacks between plant functional types and microclimate (Wyser et al., 2020), along with its widespread application in prior species distribution modeling studies specifically investigating alpine flora across the Himalayan-Tibetan ecoregion (Li et al., 2022). Four distinct Shared Socioeconomic Pathways (SSPs) were considered: SSP126 (sustainable development, limiting warming to approximately 2°C), SSP245 (intermediate emissions scenario with warming below 3°C), SSP370 (regional rivalry scenario with temperature increases up to 4°C), and SSP585 (a fossil-fuel-intensive trajectory leading to warming of nearly 5°C). Aspect and slope were derived from elevation data using ArcGIS 10.8 to enhance topographic characterization.
Given the potential confounding effects of multicollinearity among environmental variables, a rigorous variable selection process was employed to ensure robust and ecologically meaningful model predictions. Correlation analysis was performed on the 56 environmental variables using ENMTools (Warren et al., 2010), with a threshold correlation coefficient (r) of 0.8 to identify redundant variables (Dormann et al., 2013). The final eight predictors (Bio4, slope, elevation, Bio18, S_CACO3, Bio11, aspect, and soil pH) exhibited pairwise correlations below the threshold (Figure 2), ensuring model stability. High collinearity among predictor variables can lead to overfitting in the MaxEnt model, distorting both the relative importance of environmental factors and the accuracy of predicted species distributions (Merow et al., 2013). Initially, all environmental variables and species occurrence records were imported into MaxEnt for preliminary modeling, during which variables contributing 0% to model performance were excluded (Phillips et al., 2017). Subsequently, correlation analysis was conducted using ENMTools, and for highly correlated variables (r ≥ 0.8), the one with the greater contribution to model performance was retained. Through this iterative refinement process, eight key environmental predictors were ultimately selected for final modeling, ensuring the model’s interpretability and predictive reliability. To address potential confounding effects of elevation as a proxy variable (Zurell et al., 2009), an alternative model excluding elevation was evaluated, which retained seven predictors for comparative analysis. Given that topographic and soil characteristics are relatively stable over ecological timescales, they were assumed to remain constant in future climate projections. This allowed the model to focus on climatic influences when assessing potential habitat shifts of Piptanthus nepalensis while controlling for static environmental factors.
FIGURE 2
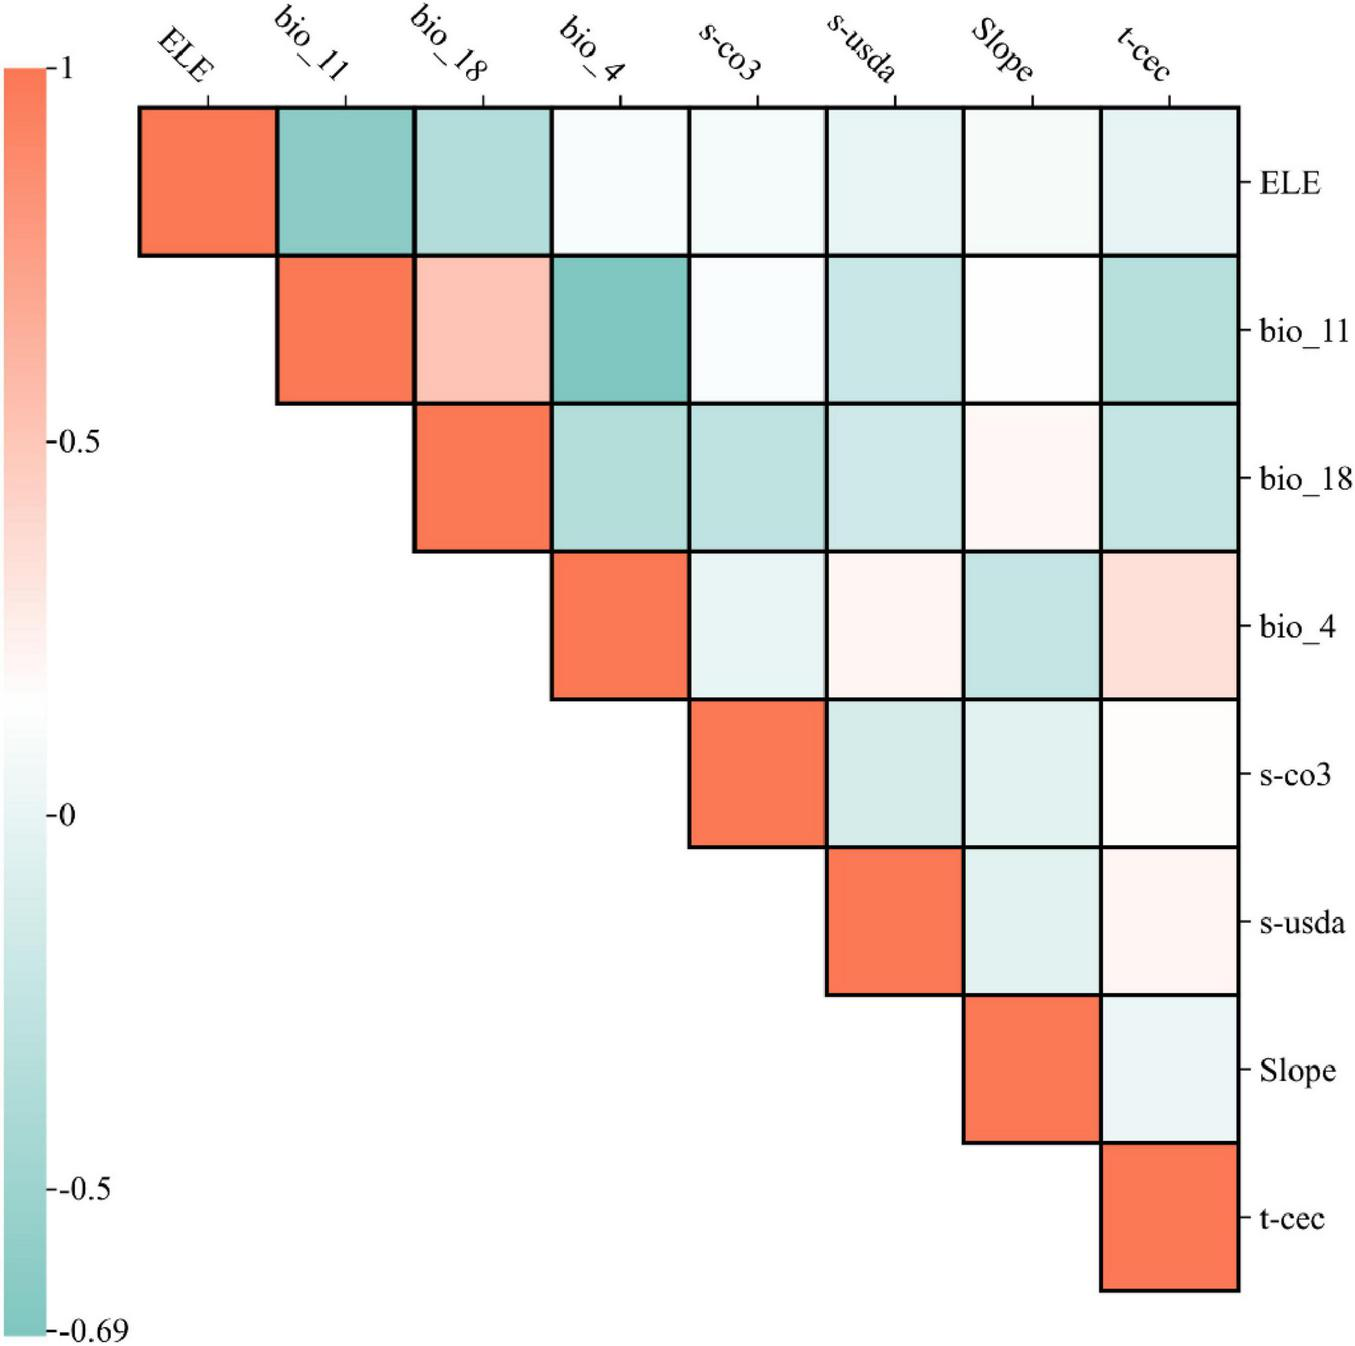
Correlation matrix of the eight retained environmental predictors.
To address potential collinearity between elevation and bioclimatic variables, we evaluated an alternative model excluding elevation. However, the primary model was retained due to its higher predictive accuracy and ecological interpretability.
2.3 Model optimization, construction, and validation
MaxEnt’s sensitivity to sampling bias and model complexity, governed by feature class selection (FC: linear, quadratic, product, threshold, and hinge [LQPTH]) and regularization multipliers (RM: 0–4), necessitated systematic optimization to enhance model performance and minimize overfitting (Zhu and Qiao, 2016). To achieve this, the “kuenm” package in R 4.4.1 was employed to evaluate 1,240 parameter combinations through cross-validation, ensuring optimal model calibration. The selection of the best-performing configuration was guided by two primary criteria: omission rates below 5% and minimal delta Akaike Information Criterion corrected (AICc) values, ensuring both ecological realism and statistical robustness (Cobos et al., 2019). Based on these criteria, the optimal model settings were determined as RM = 1.8 with a linear feature class (FC = L), balancing predictive accuracy and generalizability.
Additional modeling parameters were carefully configured to enhance reliability. The output format was set to logistic, enabling probability-based predictions of habitat suitability. To mitigate ordering bias, occurrence records were randomly shuffled before partitioning into a 75% training and 25% testing dataset. A random seed was enabled to ensure reproducibility of the shuffled data split. Model robustness was further ensured through 10 bootstrap replicates, and a maximum of 5,000 iterations was allowed to facilitate convergence. All other hyperparameters were maintained at their default settings to preserve consistency with previous studies (Dormann, 2007; Li et al., 2020).
Post-modeling, habitat suitability was classified in ArcGIS 10.8 into four categories to facilitate ecological interpretation: non-suitable (0–0.2), low suitability (0.2–0.4), moderate suitability (0.4–0.6), and high suitability (0.6–1.0), reflecting the likelihood of P. nepalensis presence across the landscape (Yang et al., 2013). Model accuracy was rigorously evaluated using the Area Under the Receiver Operating Characteristic Curve (AUC), a widely accepted metric for Species Distribution Model (SDM) performance assessment. AUC quantifies the model’s ability to discriminate between presence and background locations, with values ranging from 0 (random prediction) to 1 (perfect prediction). AUC values exceeding 0.9 indicate excellent predictive performance, while values between 0.7 and 0.9 denote good accuracy, and those below 0.7 suggest limited reliability (Xu et al., 2019). The combination of rigorous parameter tuning, robust classification schemes, and objective validation metrics ensures that the final distribution model provides a high-confidence assessment of P. nepalensis habitat dynamics under current and future climatic conditions.
To quantify habitat change under future climate scenarios, we analyzed current and projected habitat suitability maps with spatial overlays, and regions were categorized as: stable zones (no change in suitability category or ≤ 10% change in continuous value), expanding zones (current unsuitable to suitable), andcontracting zones (current suitable to unsuitable).
3 Results
3.1 Model optimization results and validation
After cross-validating 1,240 hyperparameter combinations of feature classes (FC) and regularization multipliers (RM), two combinations met the omission rate threshold (< 5%). The optimal hyperparameters (RM = 1.8, FC = L) were selected based on minimal delta AICc values (Santini et al., 2021). The model achieved an average test AUC of 0.985 across all scenarios, indicating exceptional predictive accuracy (Peterson, 2003; Figure 3).
FIGURE 3
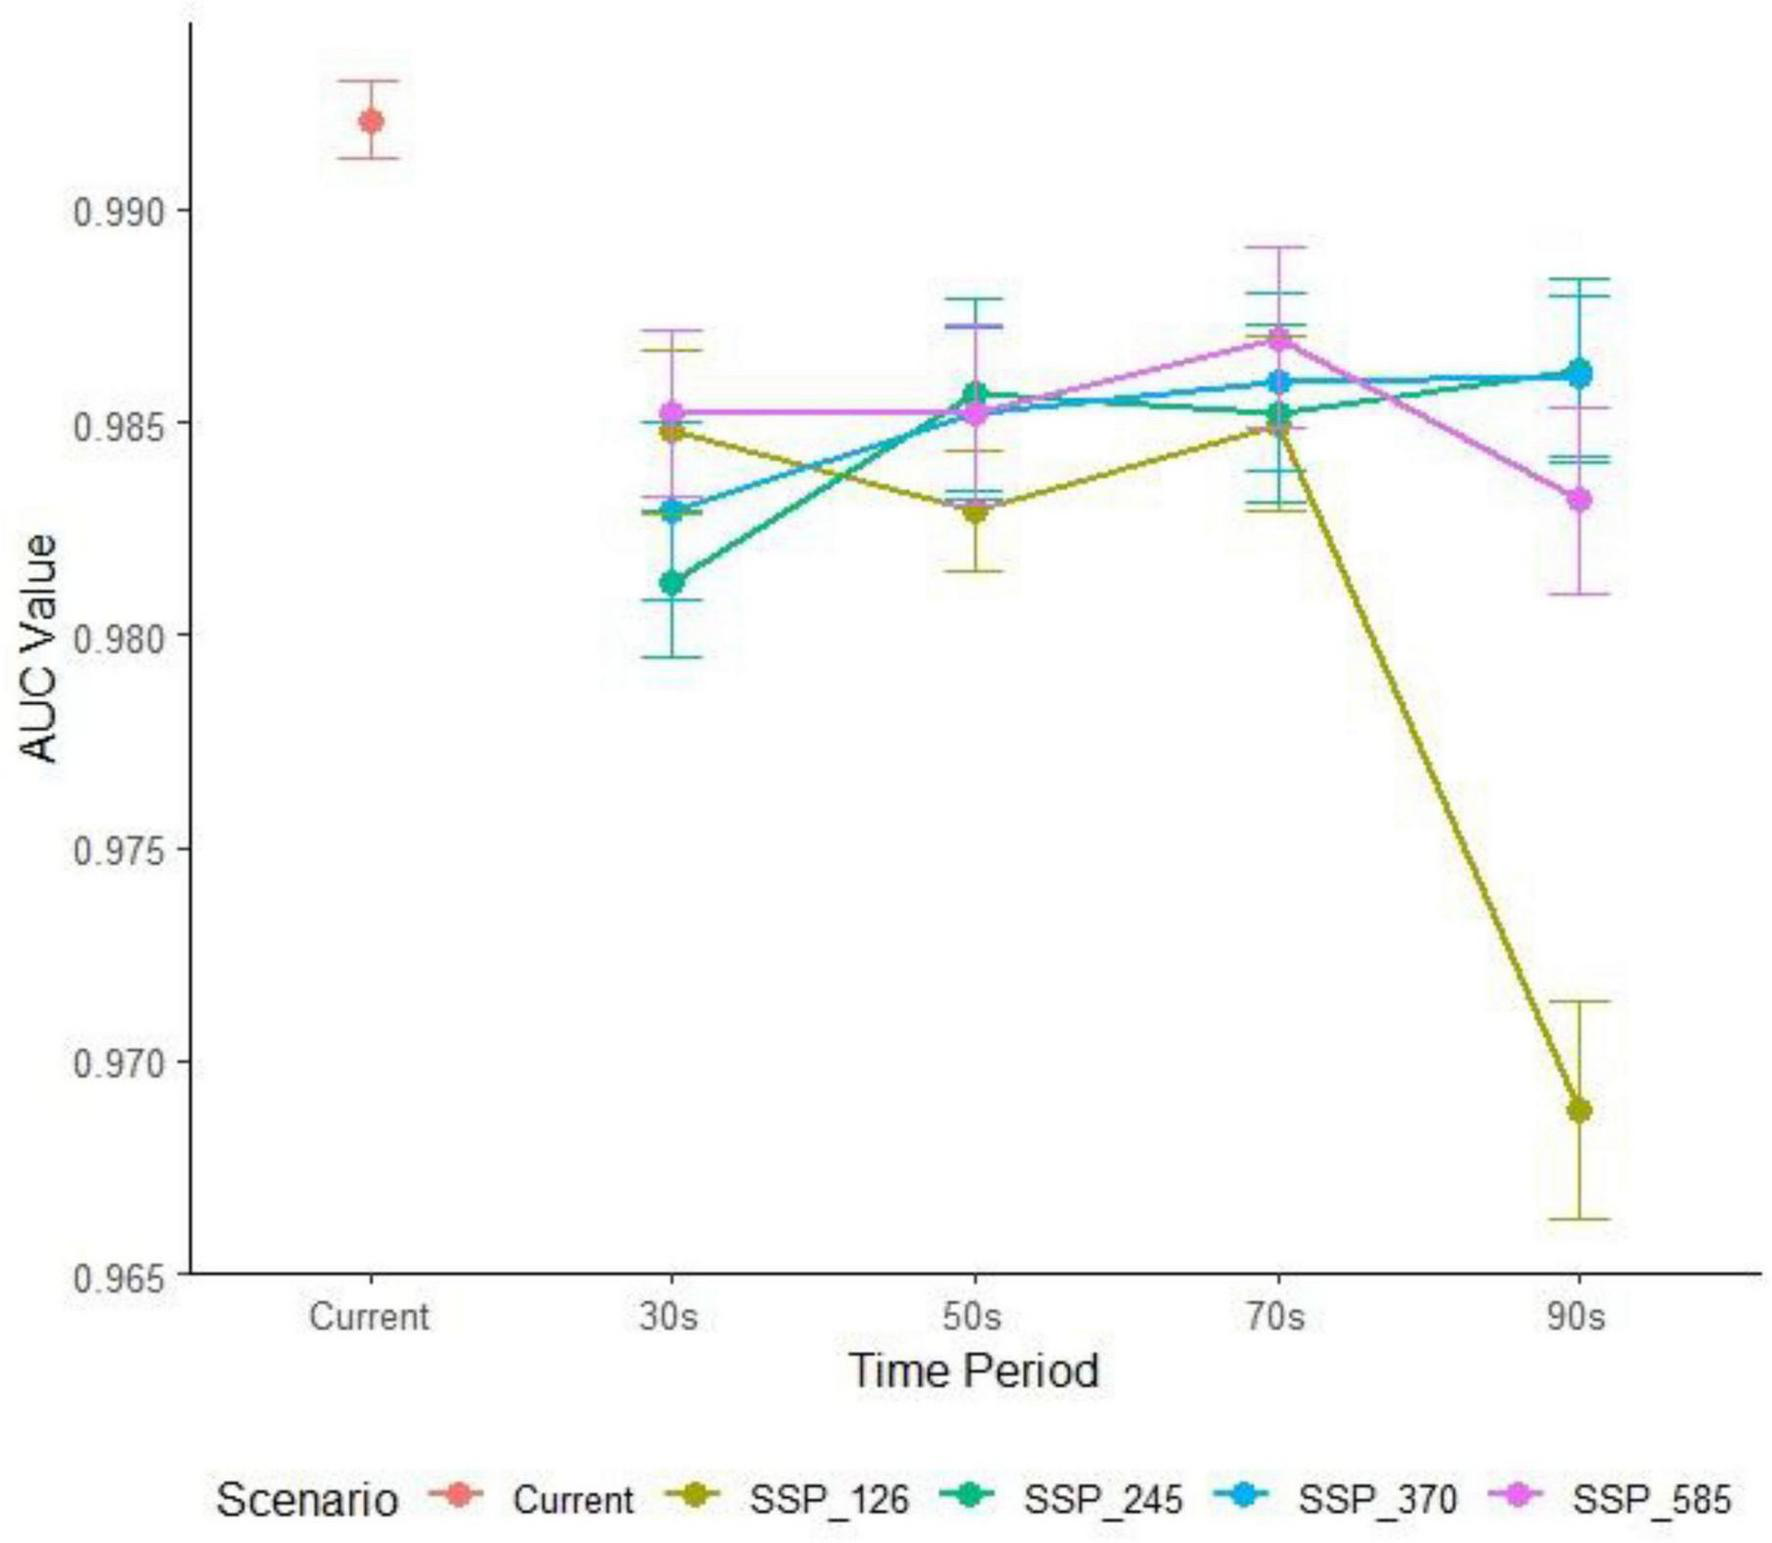
Consistently high predictive accuracy (AUC > 0.98) of the MaxEnt model across all climate scenarios (Time period abbreviations: current, 2021–2040_30s, 2041–2060_50s, 2061–2080_70s, 2081–2100_90s).
3.2 Key environmental drivers
Jackknife analysis identified elevation (37% contribution), slope (26.3%), and temperature seasonality (Bio4: 18.2%) as the dominant factors shaping P. nepalensis distribution (Figure 4). Soil variables (e.g., subsoil calcium carbonate) collectively contributed 10.3%, while climatic extremes (Bio11: coldest quarter temperature; Bio18: warmest quarter precipitation) showed minor but critical roles (Table 1). Its response curve further reveals the effect of changes in environmental variables on the fitness of Figure 5.
FIGURE 4
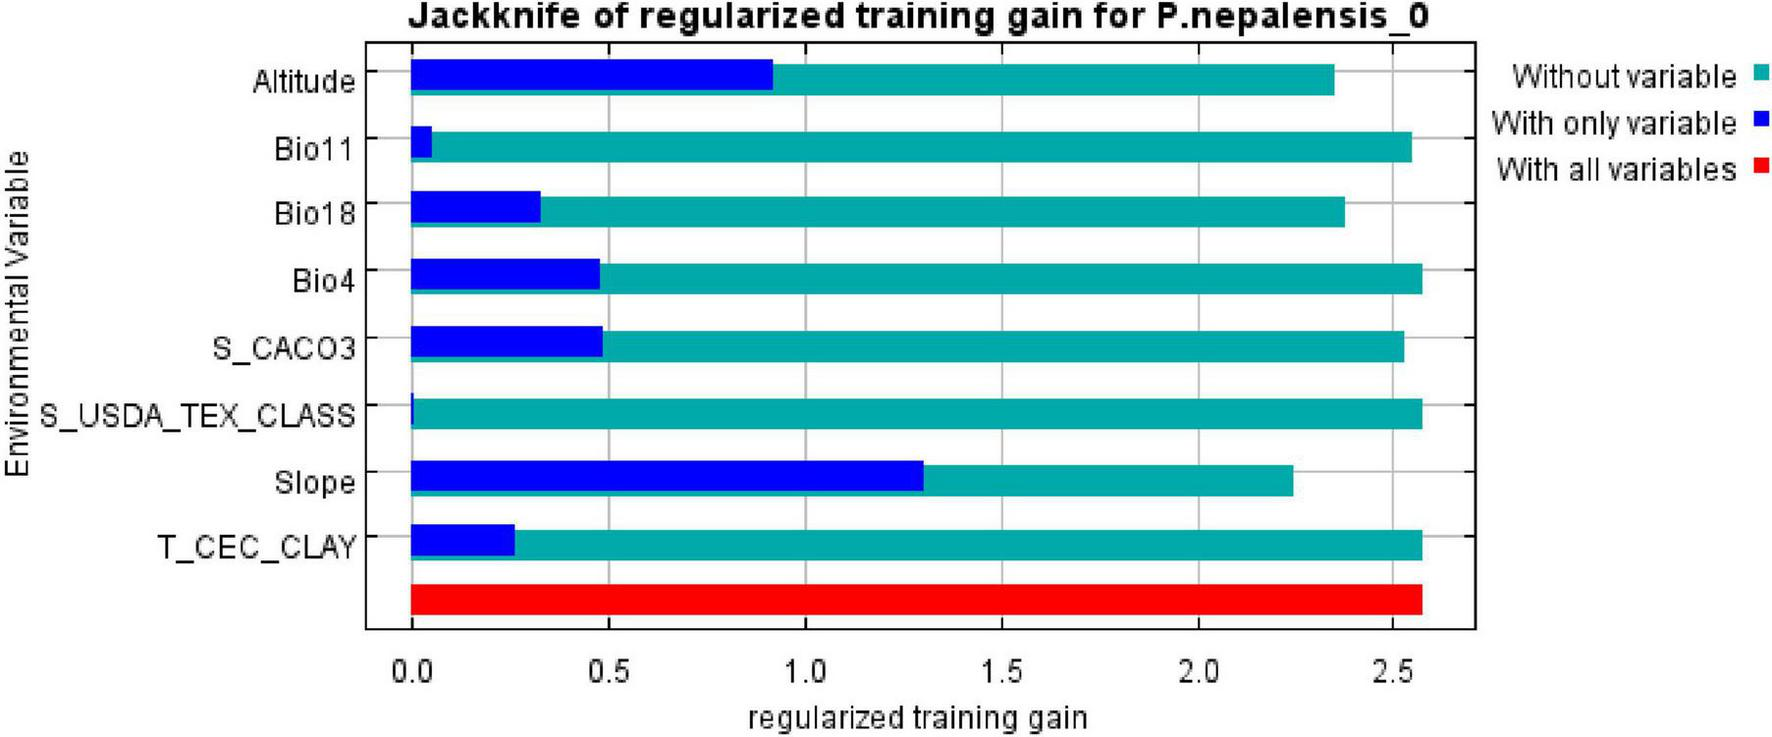
Regularization training chart.
TABLE 1
| Code | Percent contribution/% | Note |
| ELE | 37 | Altitude |
| Slope | 26.3 | |
| Bio_4 | 18.2 | Temperature seasonality (SD × 100) |
| S_CO3 | 8.9 | Subsoil calcium carbonate |
| Bio_18 | 7.9 | Precipitation of warmest quarter |
| t_cec | 1 | Topsoil CEC (clay) |
| S_usda | 0.4 | Subsoil USDA texture classification |
| Bio_11 | 0.3 | Mean temperature of coldest quarter |
Full name of the variable and its contribution.
FIGURE 5
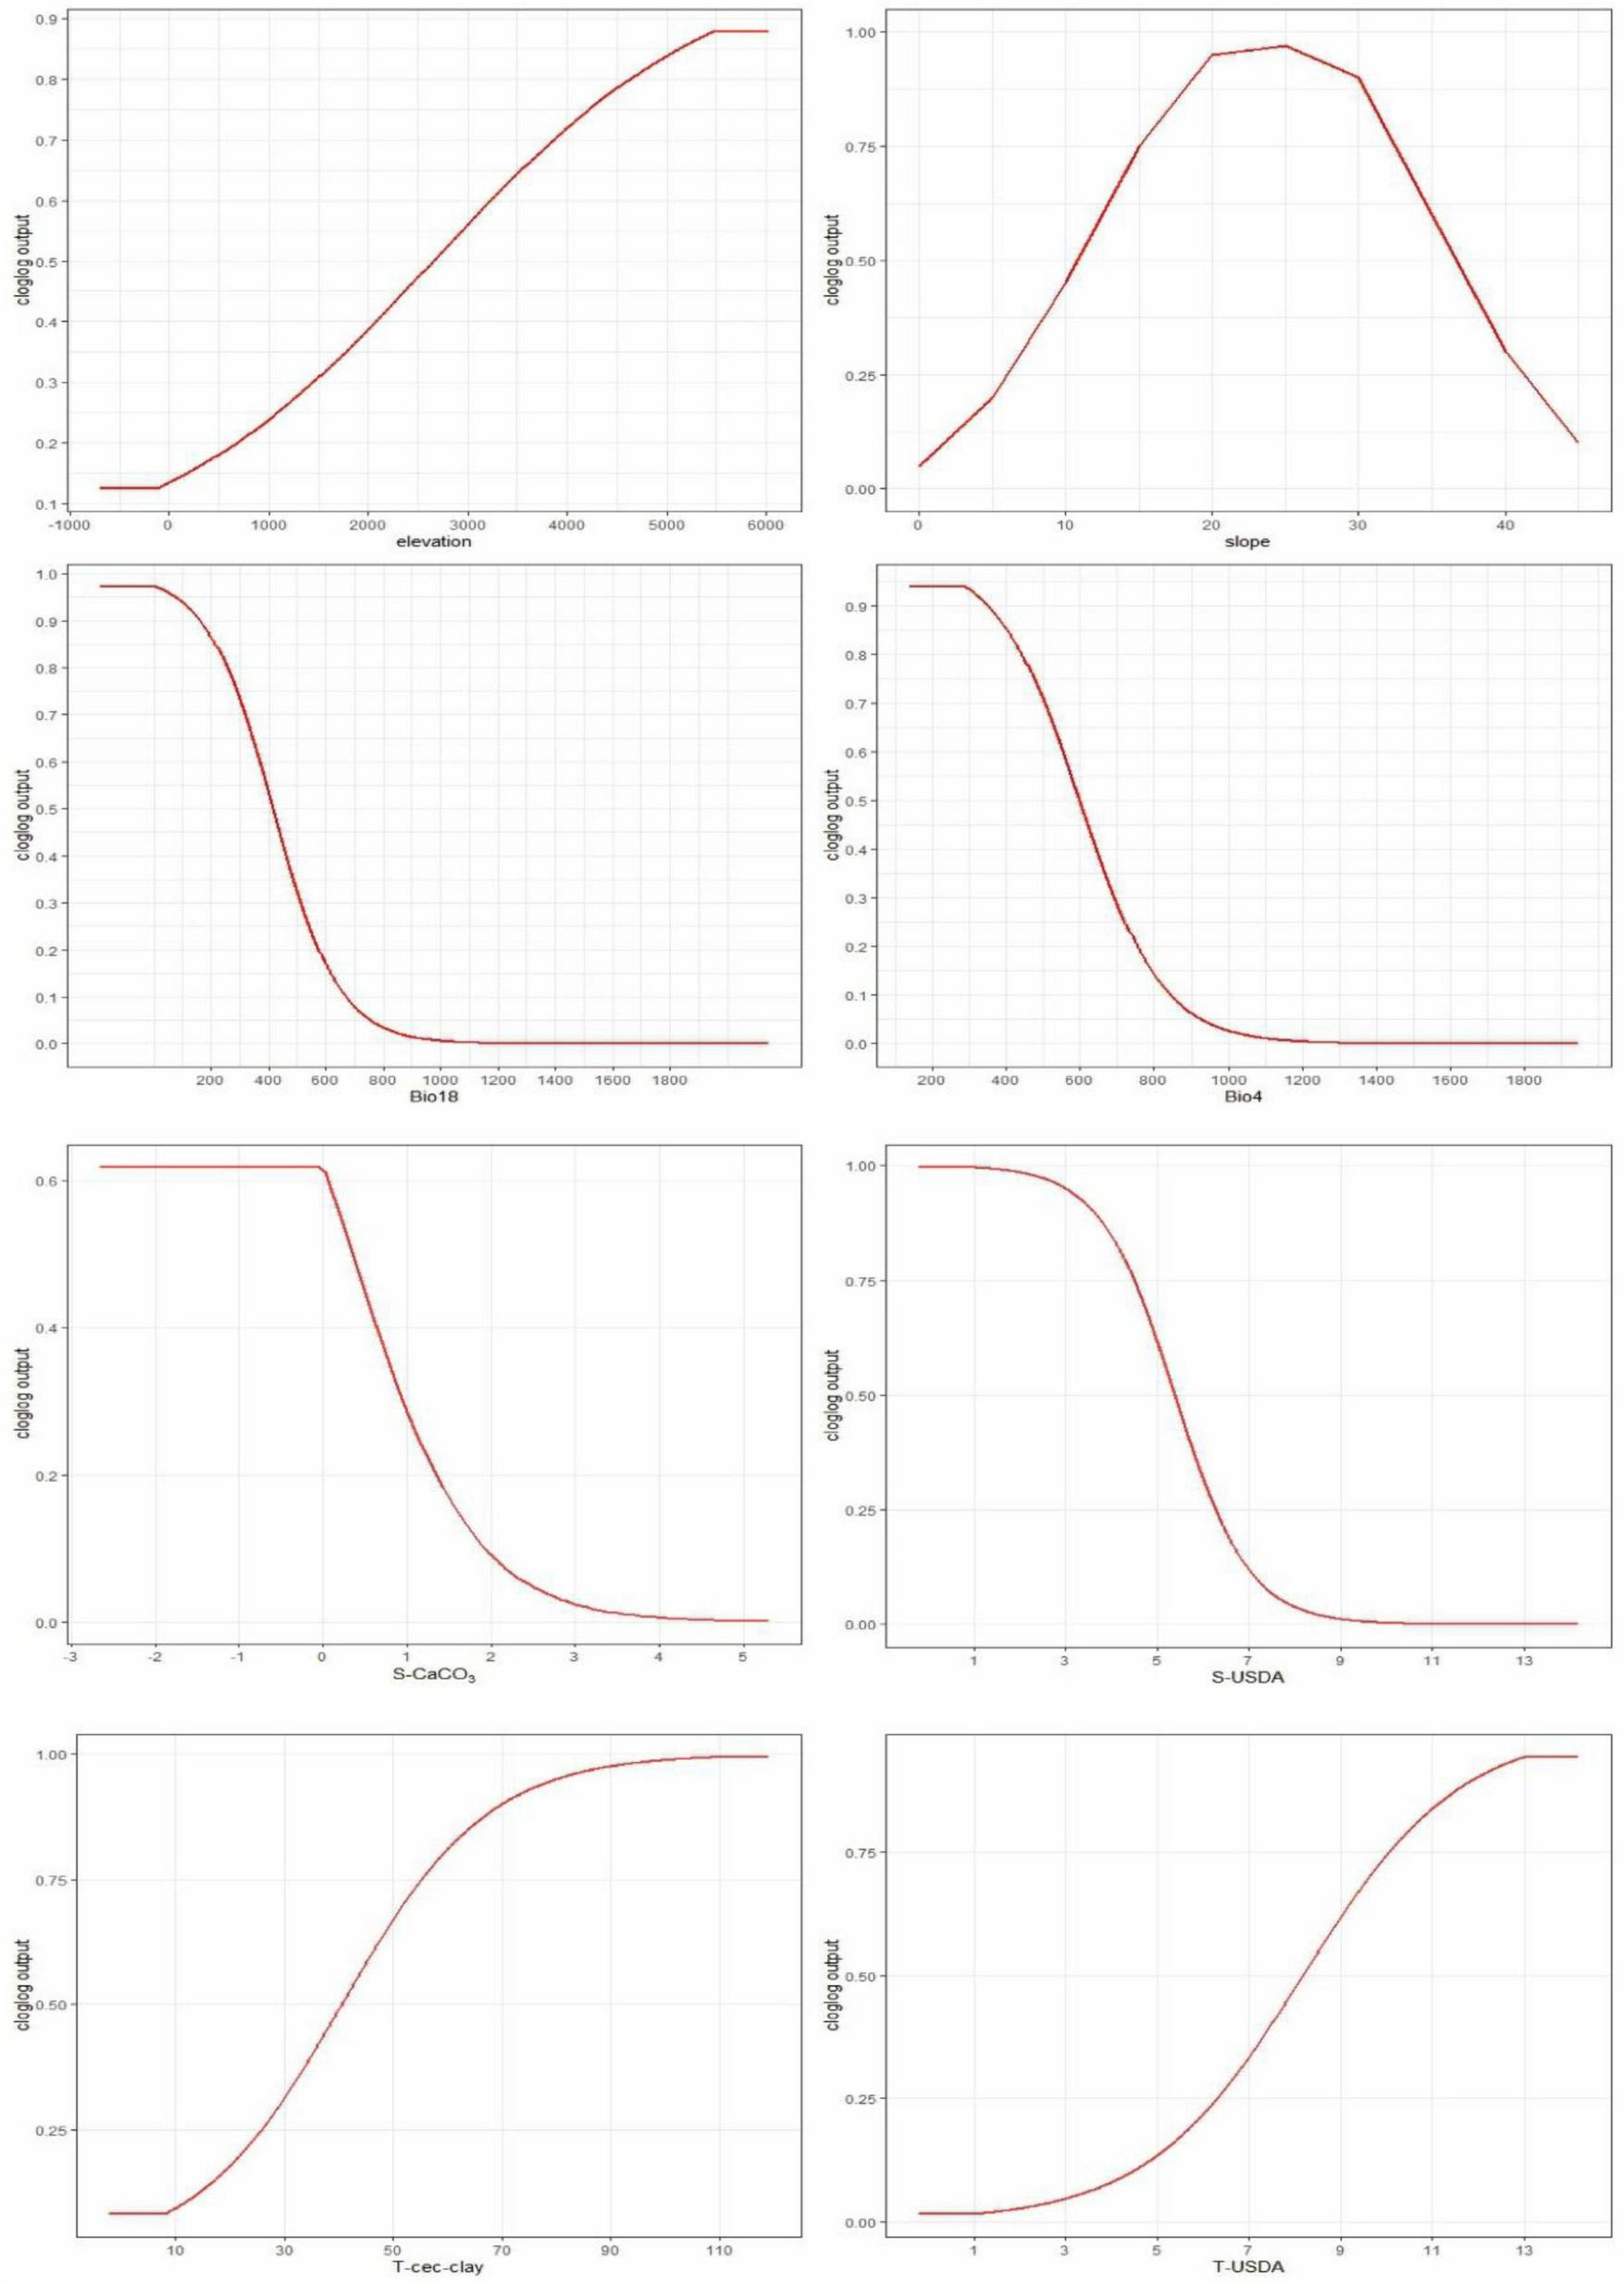
Non-linear responses of habitat suitability to critical bioclimatic thresholds.
3.3 Current potential distribution
Under contemporary climatic conditions, the total suitable habitat for P. nepalensis spans approximately 25.78 × 10⁴ km2 (2.69% of the total study area), reflecting the species’ extensive distribution across high-altitude regions. Within this range, areas classified as highly suitable (suitability index: 0.6–1.0) cover 6.90 × 10⁴ km2 (0.72%), primarily concentrated in the Hengduan Mountains, which encompass regions of Sichuan, Yunnan, and Tibet. These core habitats represent the most ecologically favorable zones, where environmental conditions align optimally with the species’ physiological and ecological requirements. The moderately suitable habitat, defined by a suitability index of 0.4–0.6, extends over 11.32 × 10⁴ km2 (1.18%), predominantly along the eastern Tibetan Plateau, where the species maintains stable populations under slightly less favorable climatic and edaphic conditions. Additionally, marginally suitable areas, with a suitability index ranging from 0.2 to 0.4, account for 7.56 × 10⁴ km2 (0.79%), largely distributed across the Himalayan foothills and the Yunnan-Guizhou Plateau. These regions, while offering suboptimal conditions, may still support fragmented populations or serve as potential buffer zones under shifting climatic regimes. The spatial distribution patterns underscore the species’ strong affinity for mountainous terrains and high-altitude ecosystems, highlighting its ecological resilience and potential vulnerability to climate-induced habitat shifts (Figure 6).
FIGURE 6
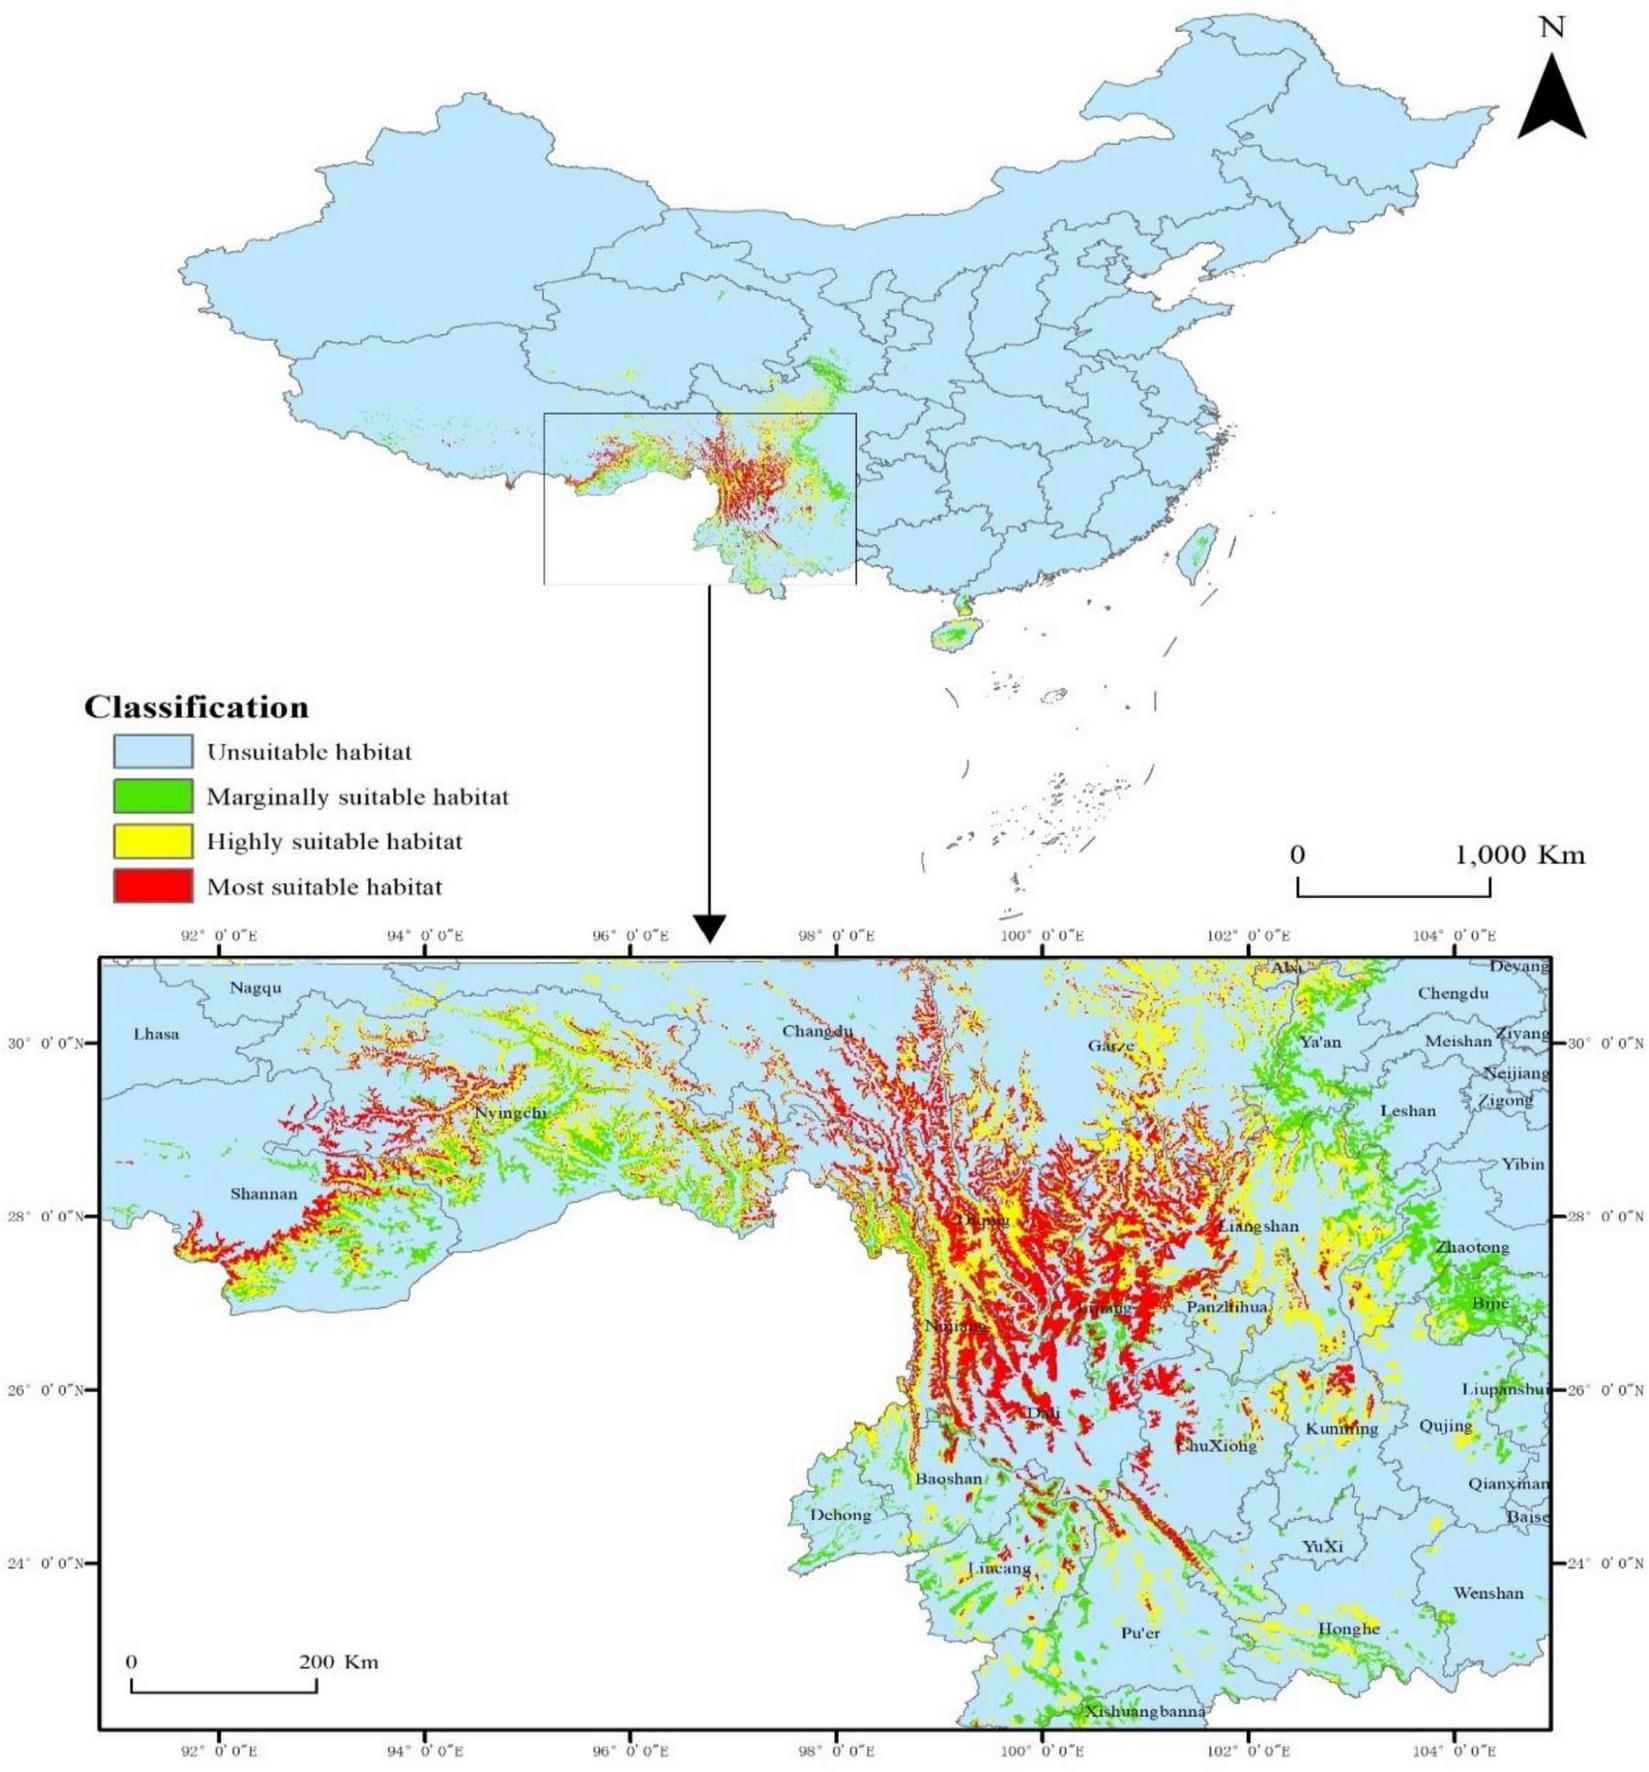
Concentration of high-suitability habitats in the Hengduan Mountains under current climate.
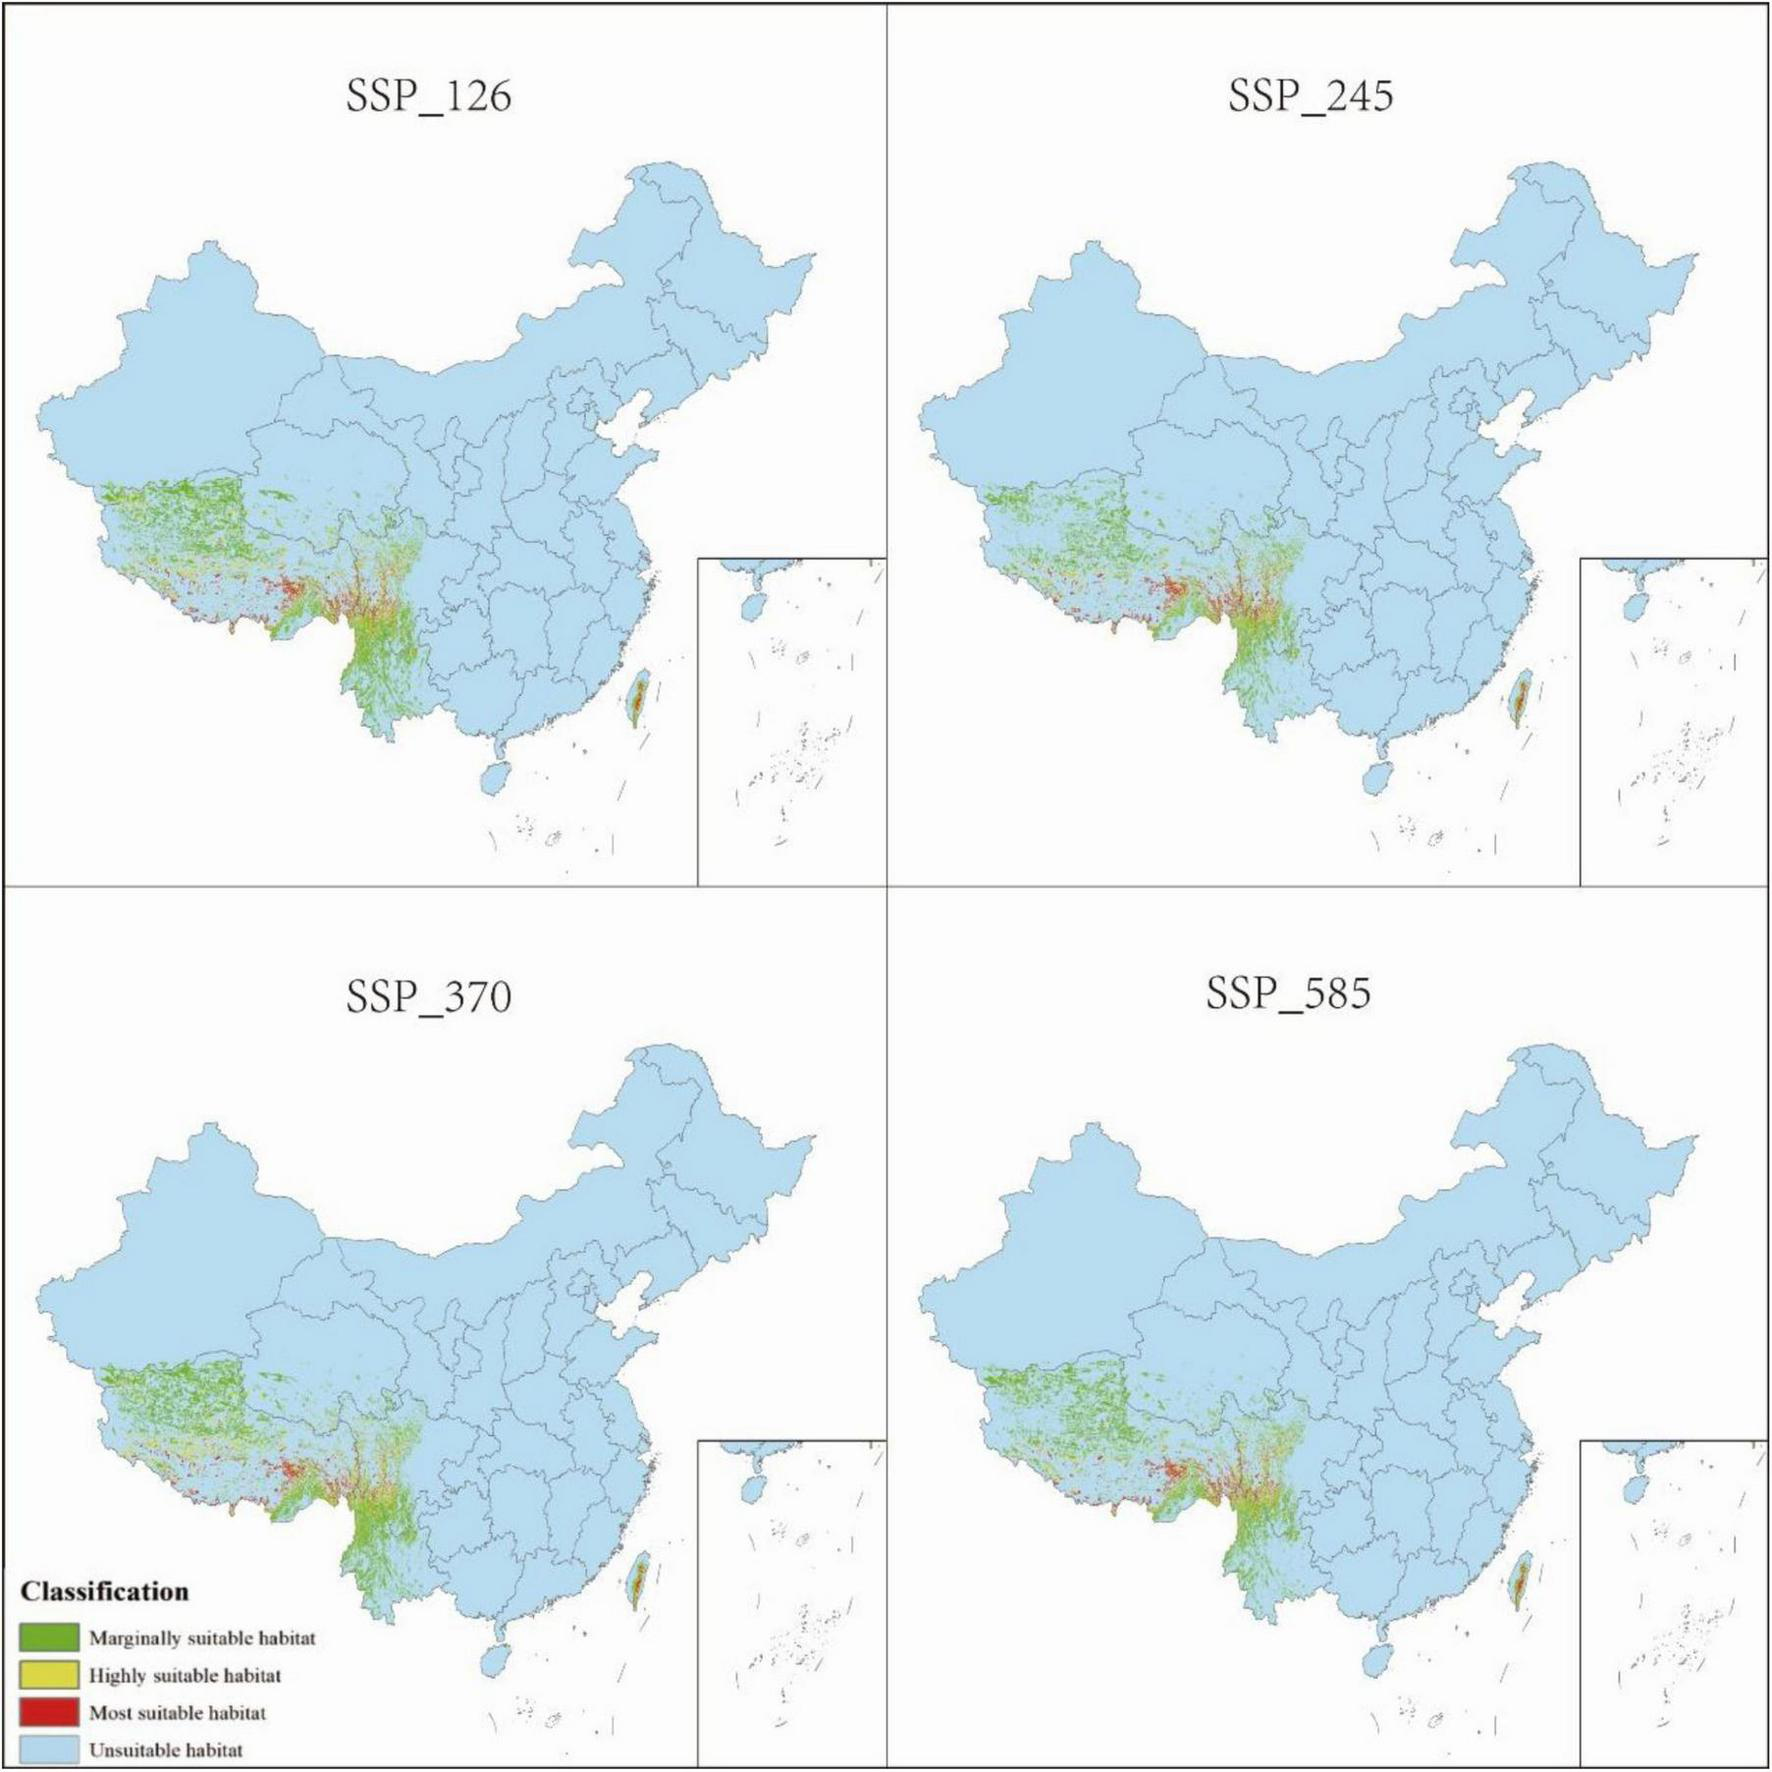
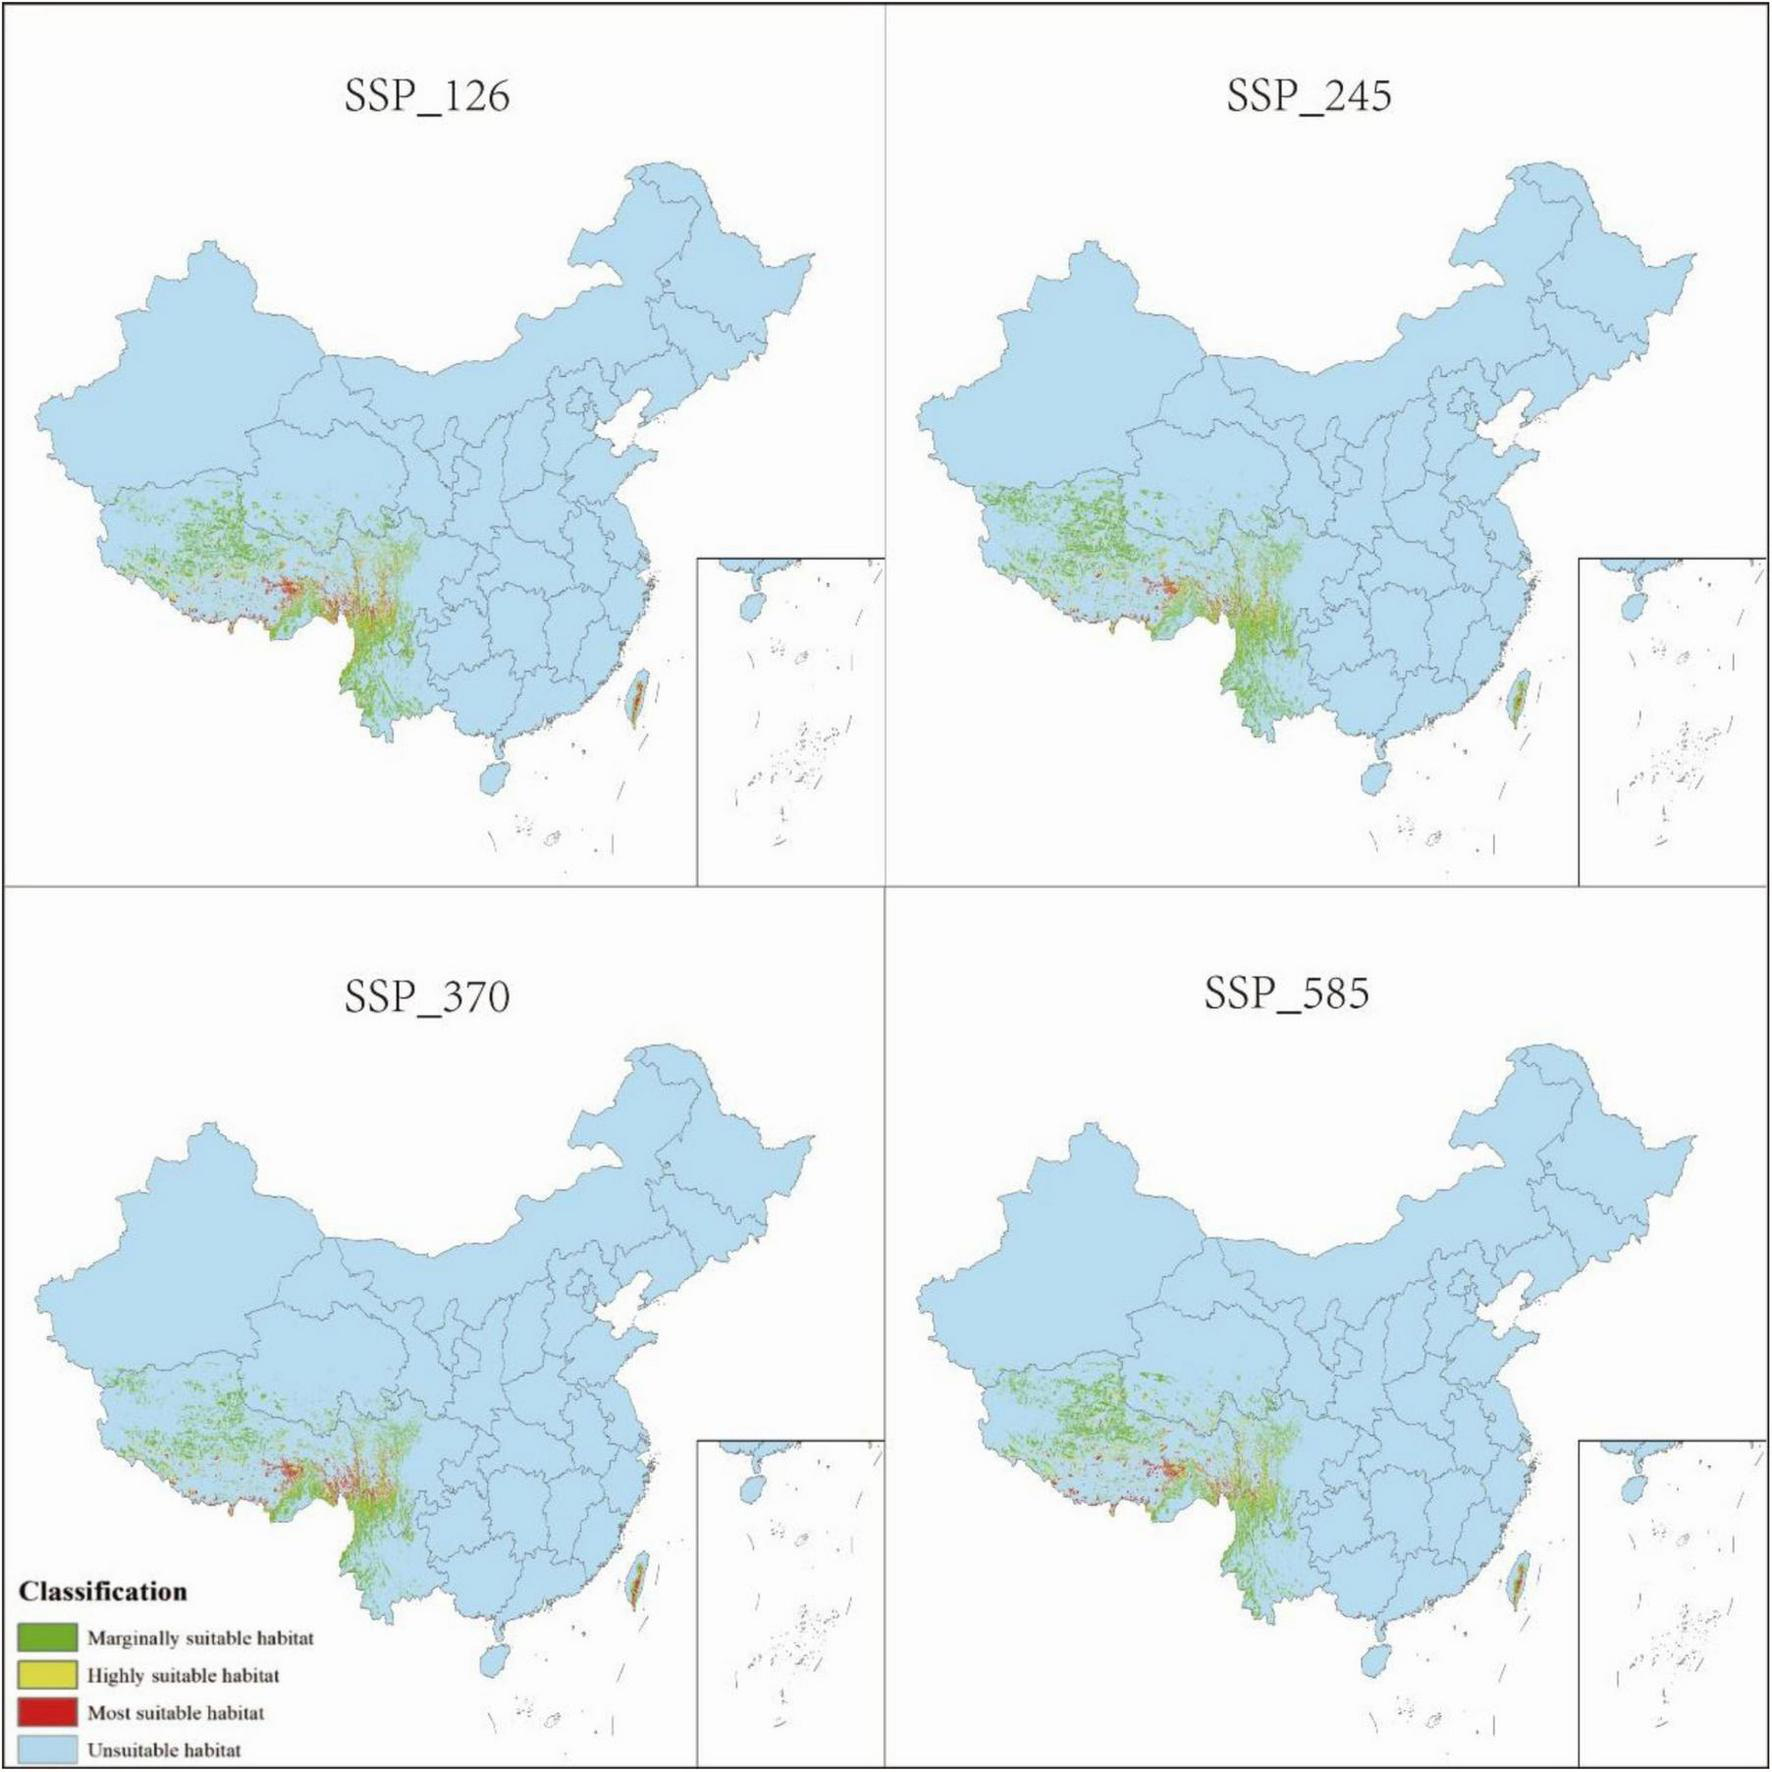
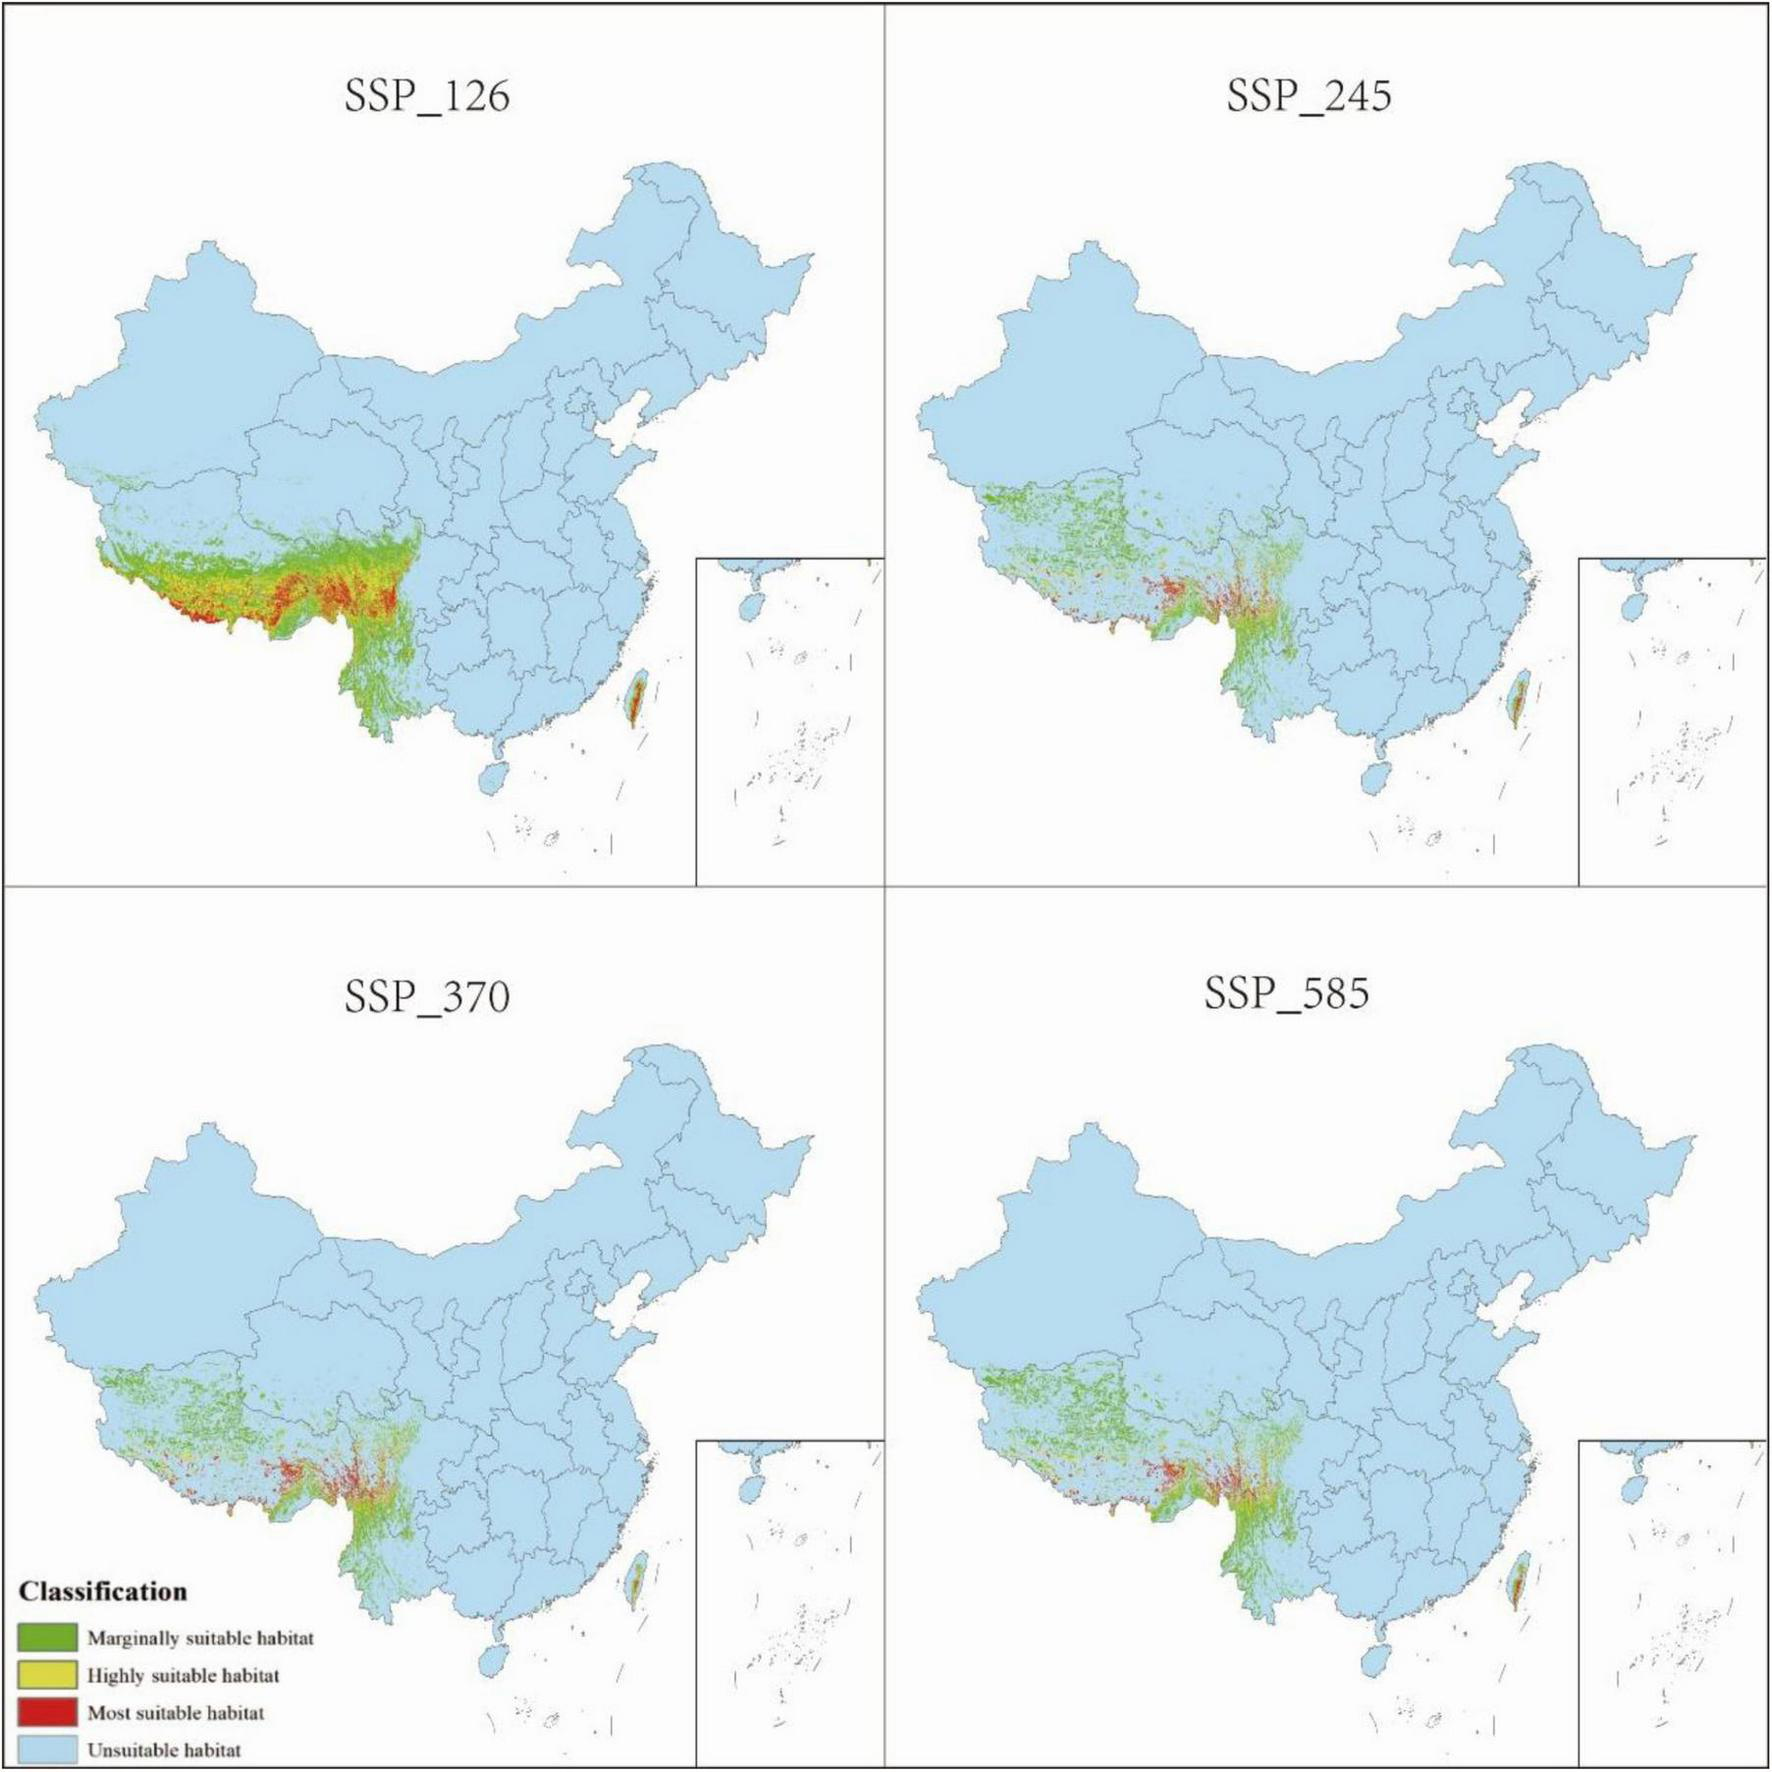
3.4 Future habitat projections
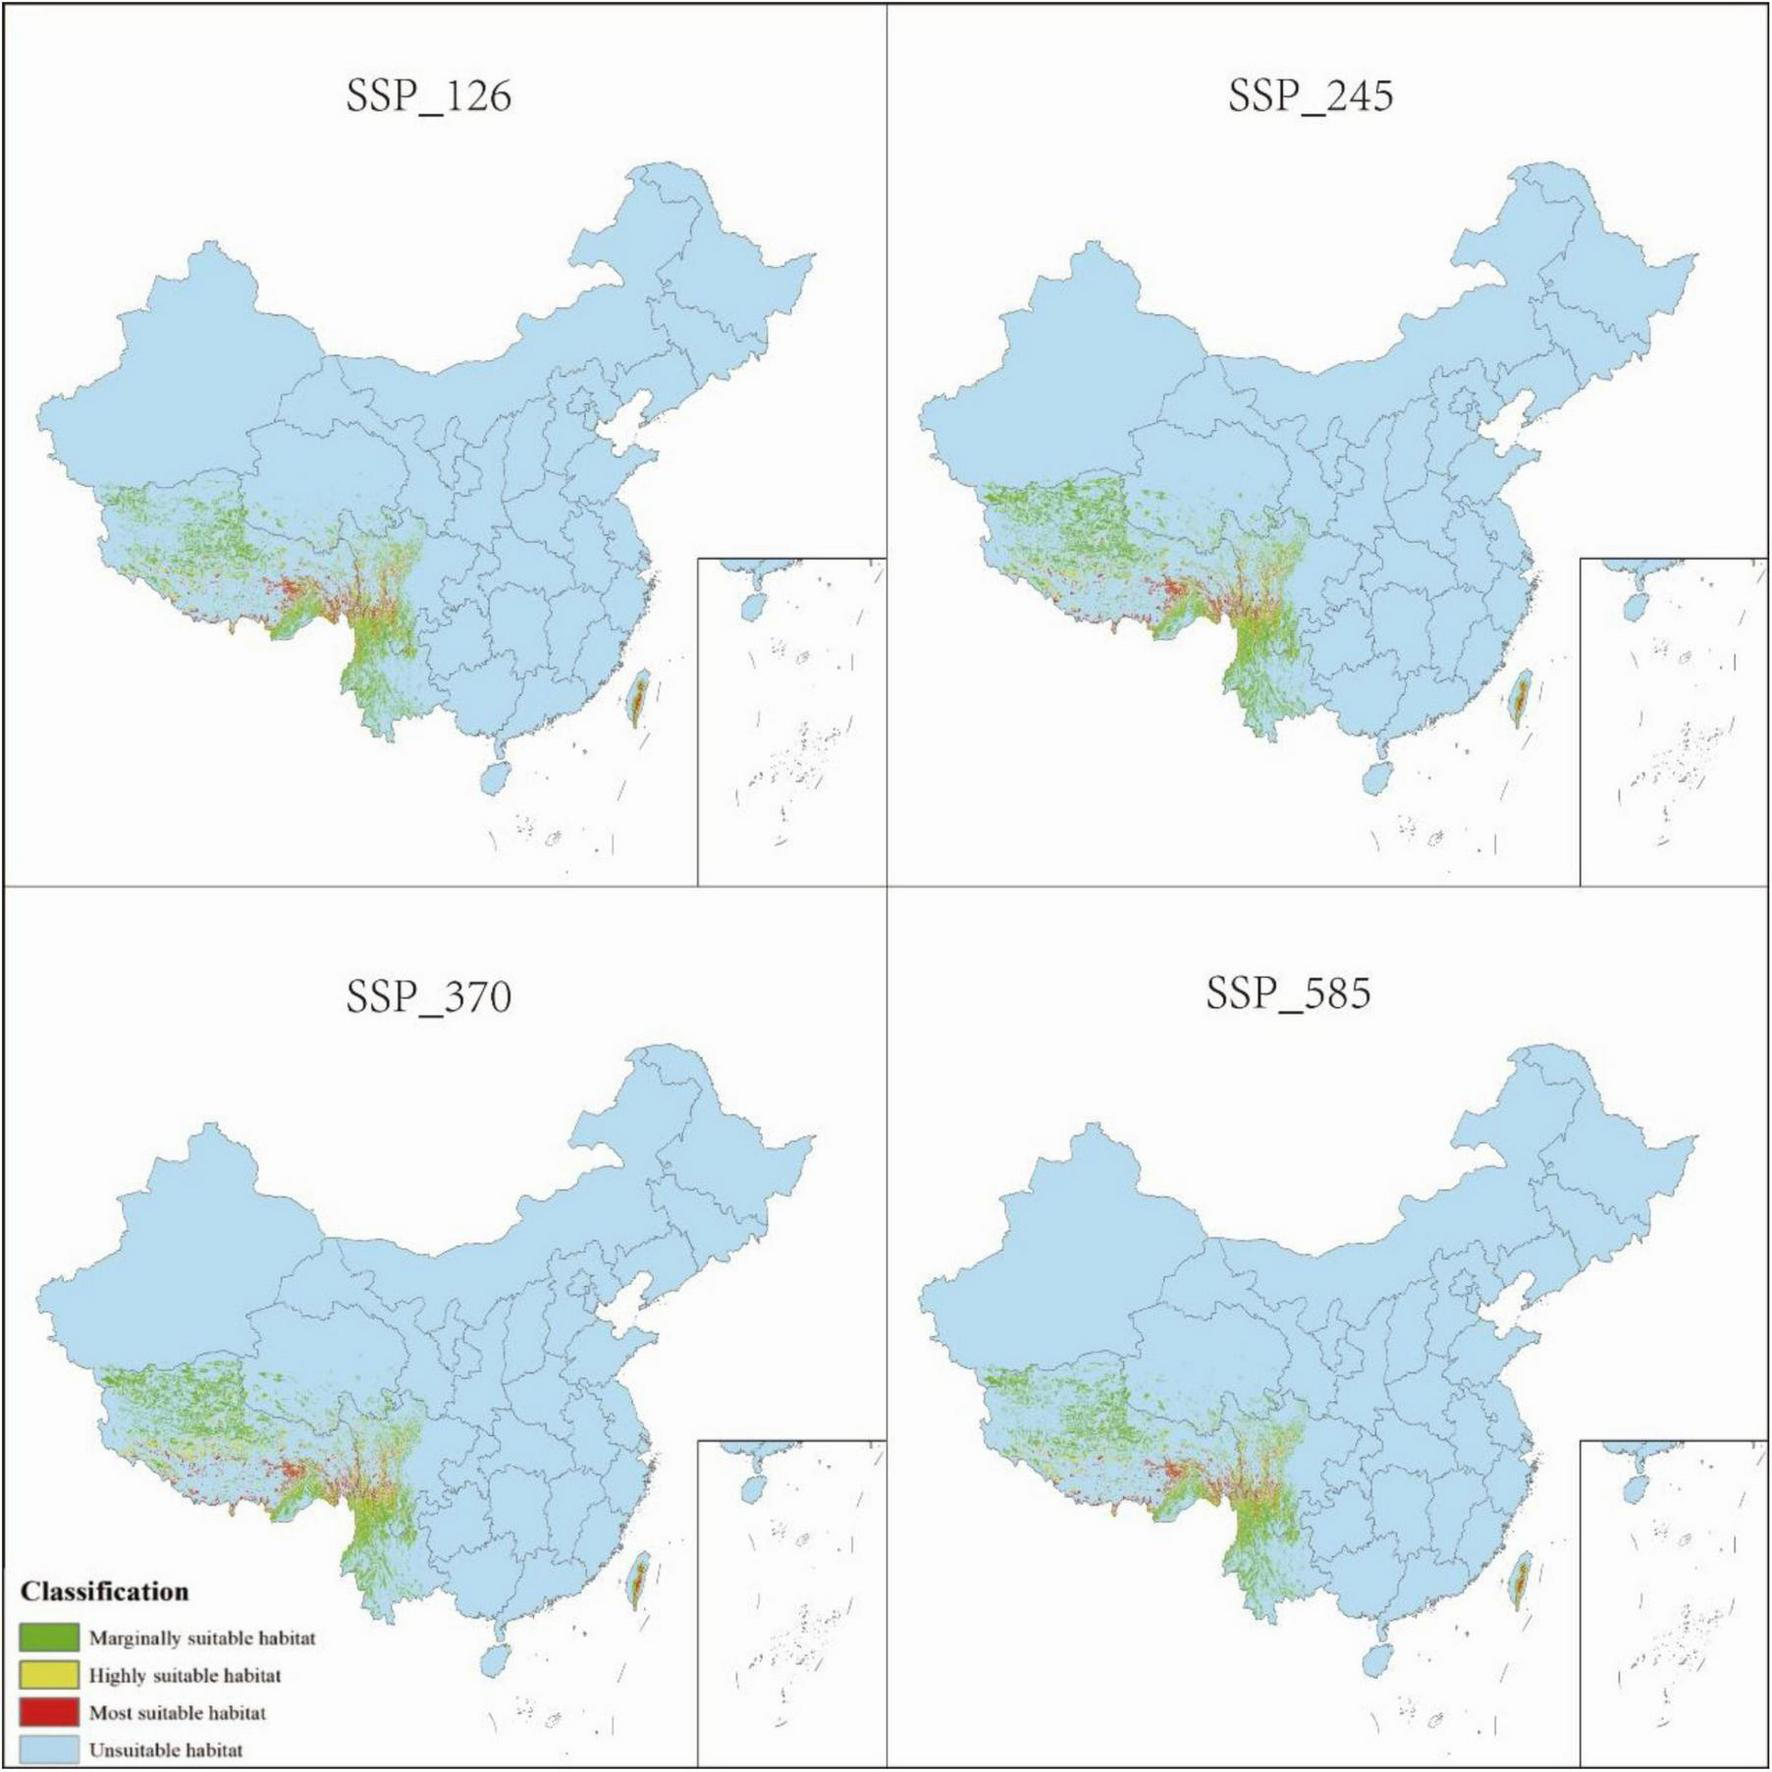
The total suitable habitat area expands across all future climate scenarios; however, the extent of high- and moderate-suitability zones declines. Under SSP585, the most extreme warming scenario, high-suitability habitats undergo the most pronounced contraction, shrinking from 0.68 to 0.52% of the total area. The overall suitable habitat for P. nepalensis is projected to expand under all future climate scenarios; however, this increase is accompanied by a reduction in the extent of high- and moderate-suitability zones. Notably, under SSP585—the most extreme warming trajectory—high-suitability habitats experience the most significant contraction, decreasing from 0.68 to 0.52% of the total area (Figures 7–11).
FIGURE 7
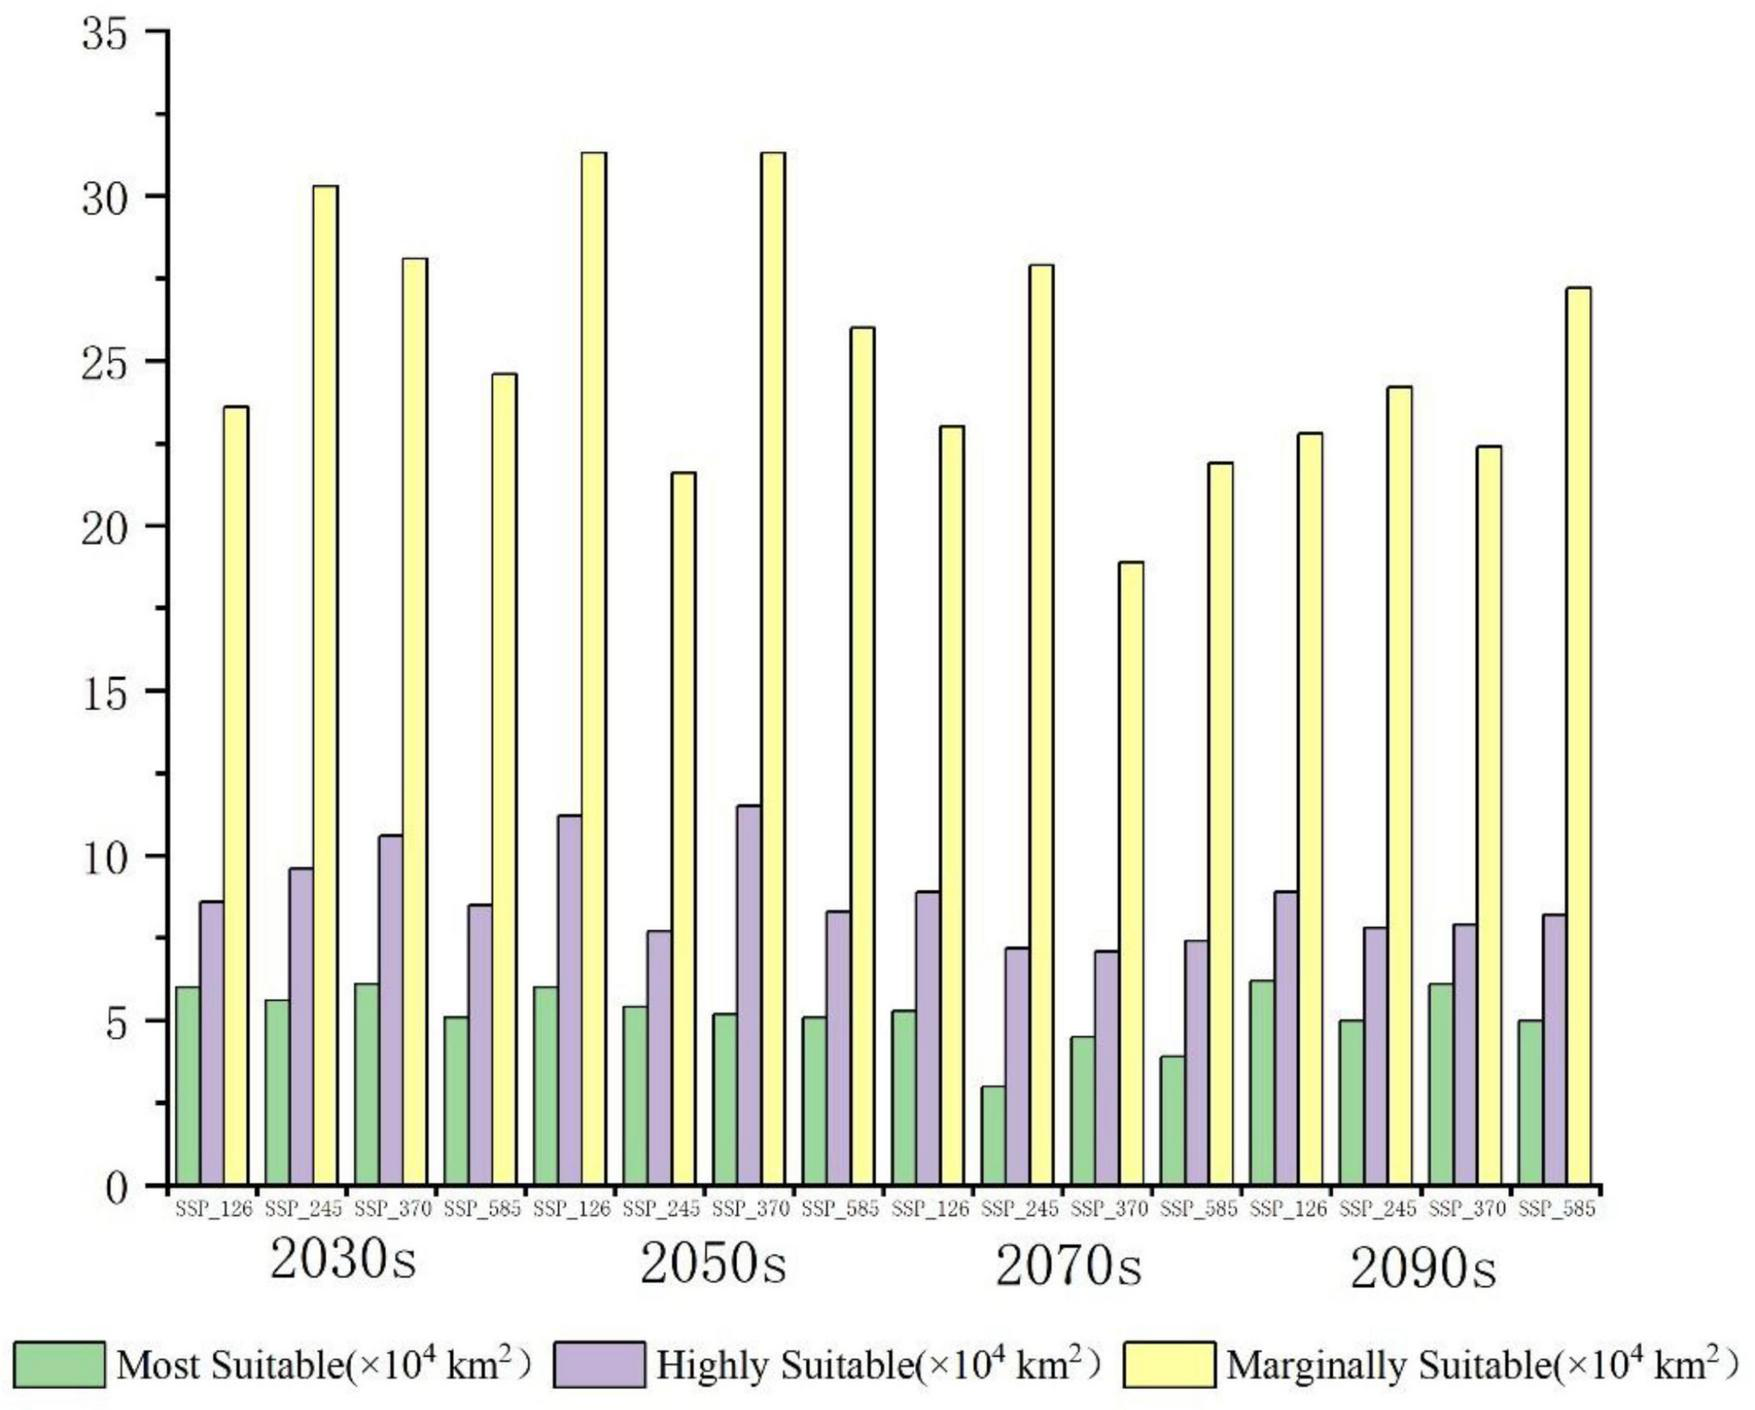
Divergent trends in habitat suitability classes across future climate scenarios (Future period abbreviations: 2021–2040_2030s, 2041–2060_2050s, 2061–2080_2070s, 2081–2100_2090s).
FIGURE 8
Distribution of P. nepalensis, 2021–2040.
FIGURE 9
Distribution of P. nepalensis, 2041–2060.
FIGURE 10
Distribution of P. nepalensis, 2061–2080.
FIGURE 11
Distribution of P. nepalensis, 2081–2100.
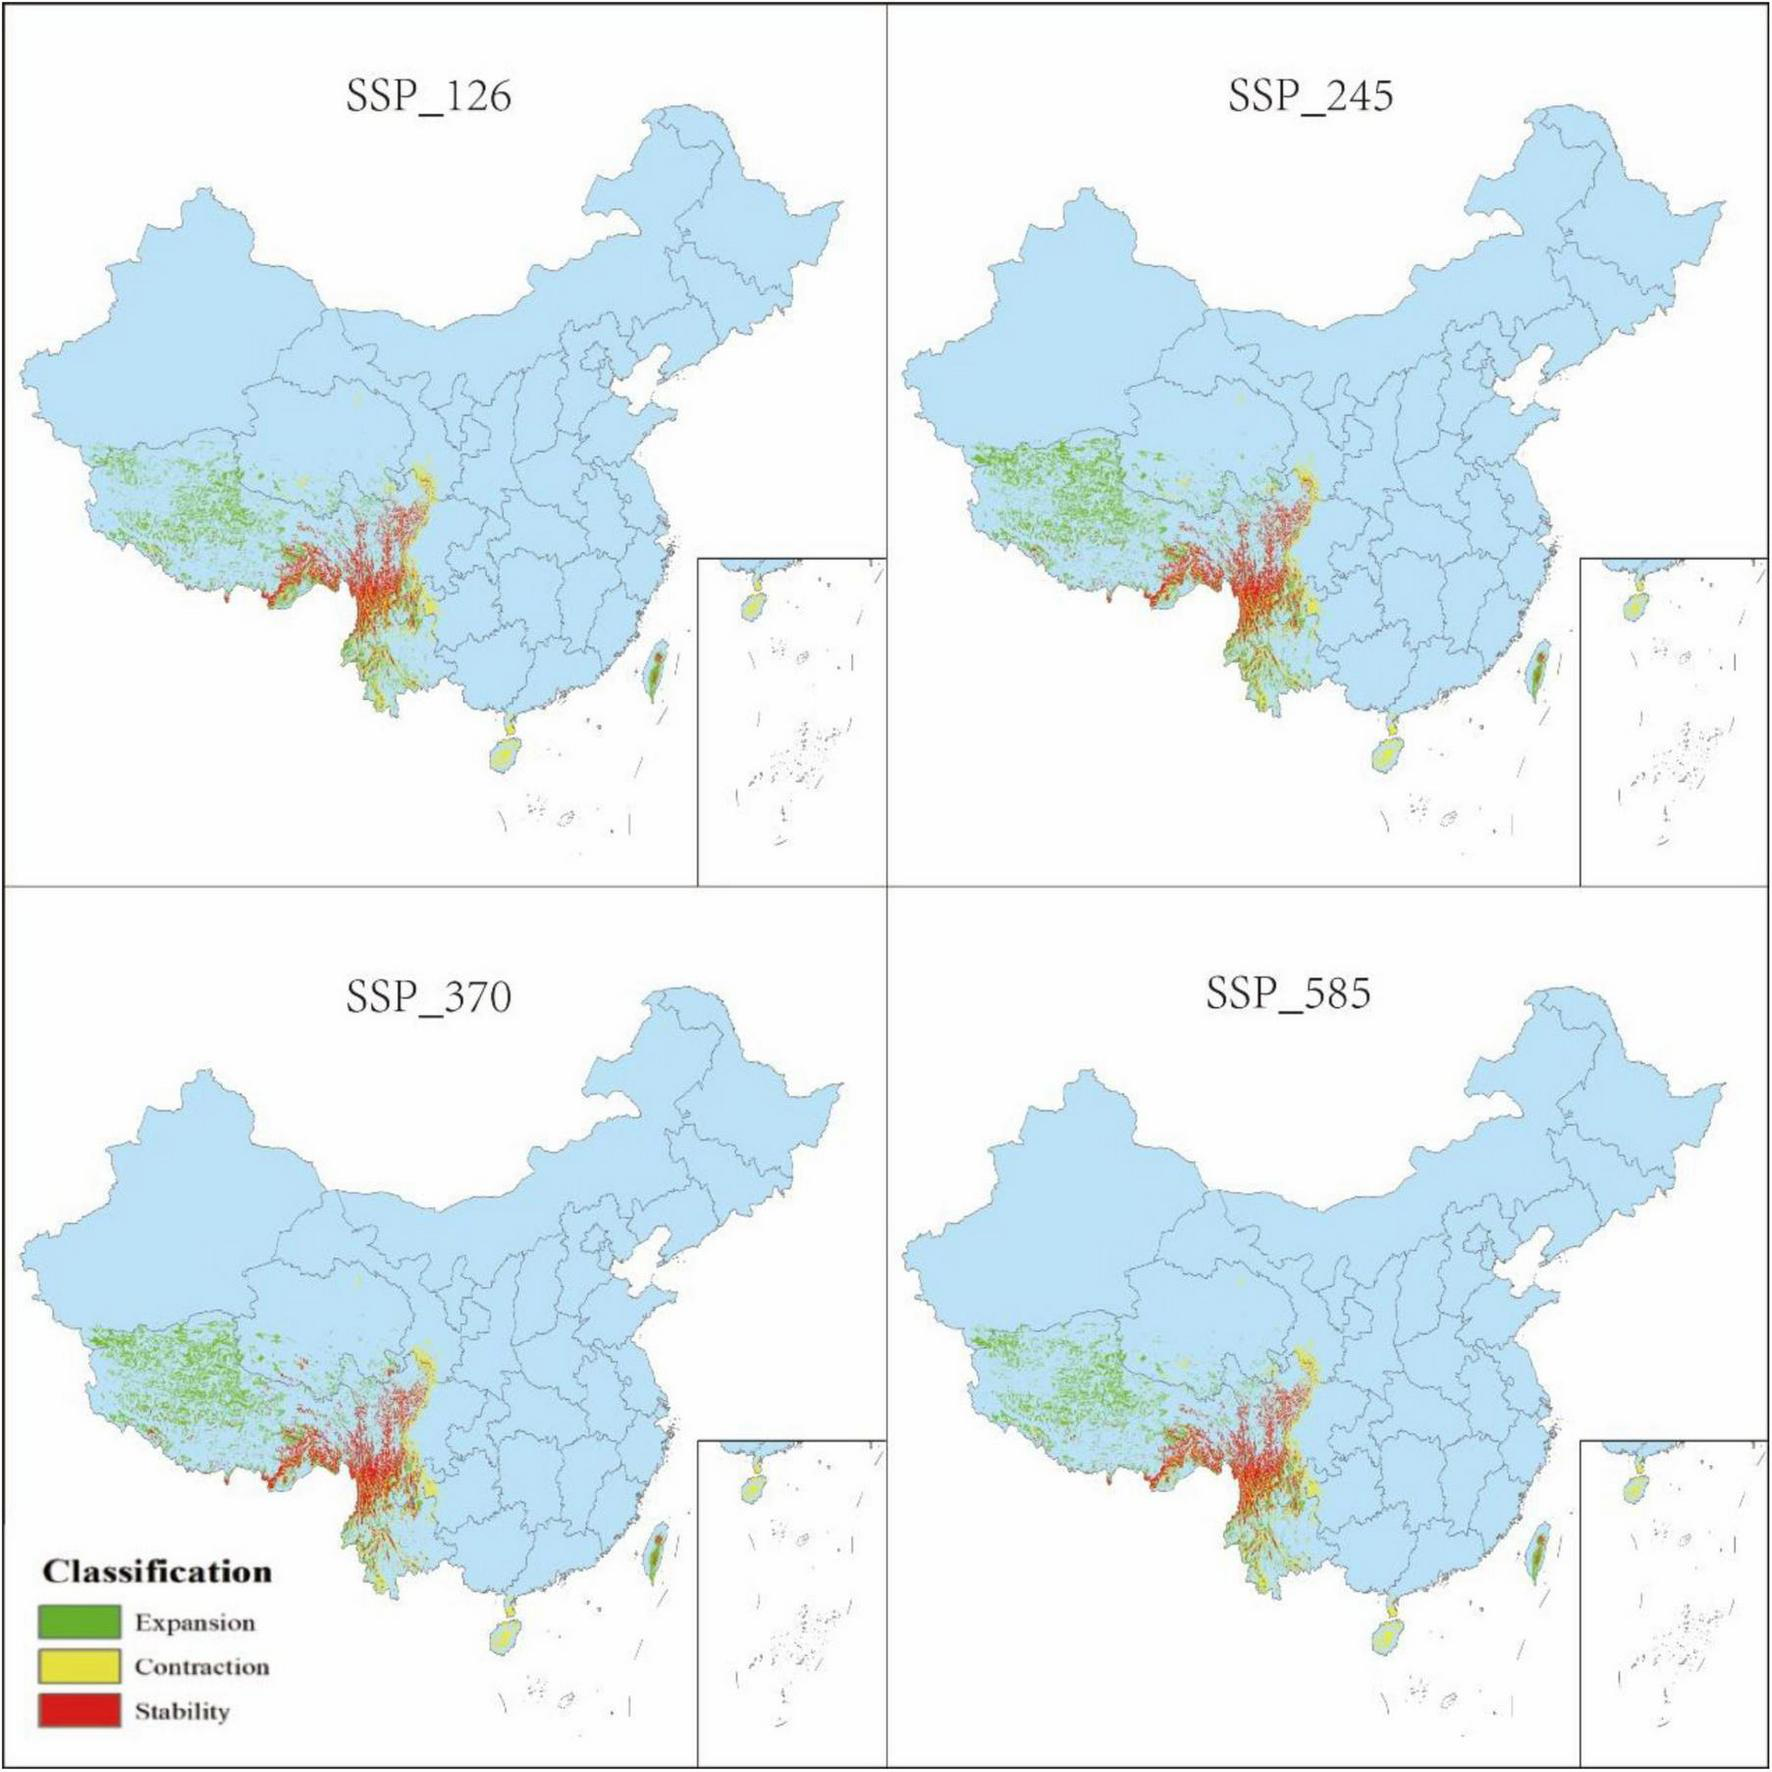
3.5 Spatial pattern dynamics
The classification of habitat stability, expansion, and contraction was based on overlap analysis between current and future suitability categories. Spatial dynamics compared to current total habitat (Figures 12–16) revealed divergent trends across scenarios: Under SSP126, stability peaked at 4.68% (2041–2060) but declined to 3.41% by 2100, with contraction areas surging to 1.53% by the end-century; SSP245 showed steady stability increases from 2.20 to 4.43%, coupled with abrupt expansion declines from 3.80 to 0.04% linked to mid-century climate variability; SSP370 exhibited maximum stability at 5.74% (2041–2060) before collapsing to 3.90% by 2100 due to extreme heat and rainfall shifts; SSP585 displayed high volatility in stability (4.15 to 2.09 to 4.10%), with persistent contraction exceeding 1.09% throughout the projection period.
FIGURE 12
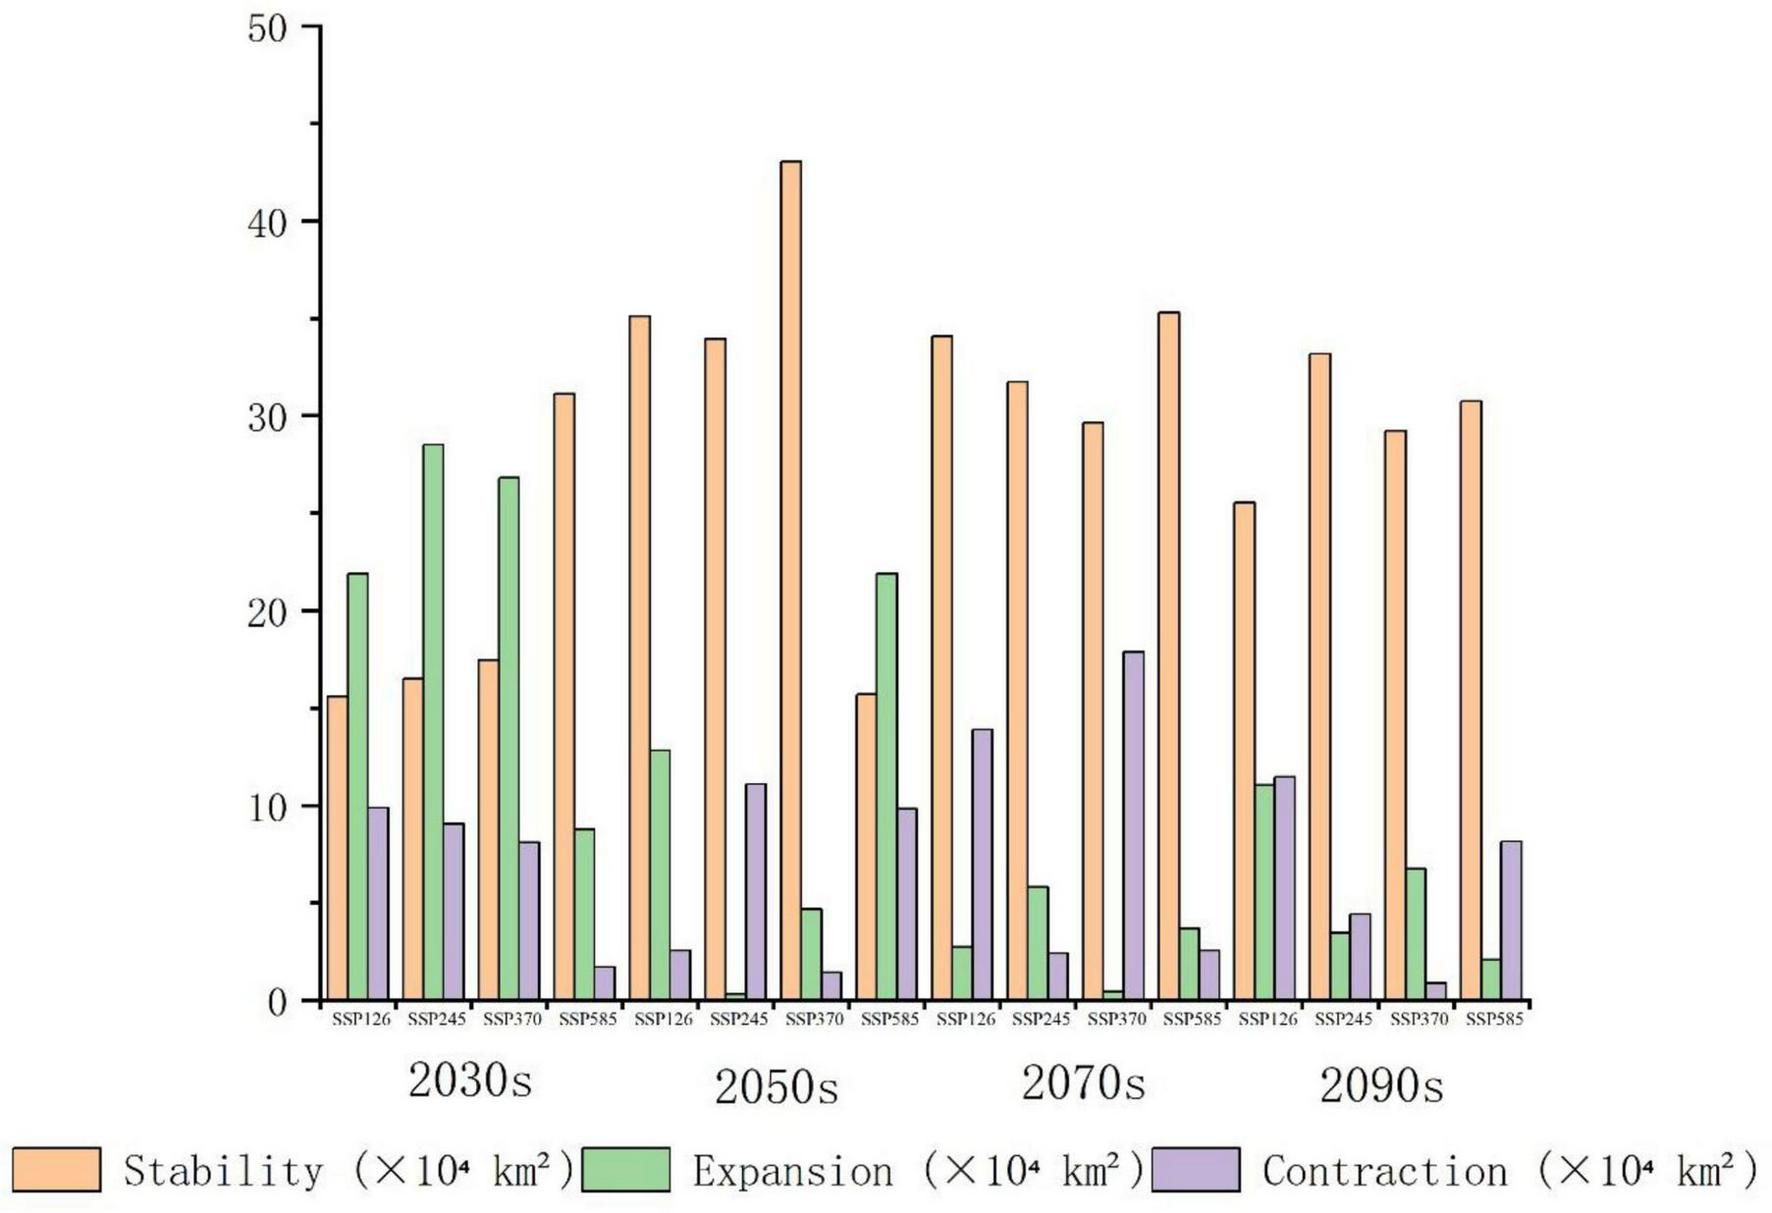
Spatial changes in habitat for P. nepalensis across time periods (Future period abbreviations: 2021–2040_2030s, 2041–2060_2050s, 2061–2080_2070s, 2081–2100_2090s).
FIGURE 13
Changes in distribution of P. nepalensis, Current–2030s.
FIGURE 14
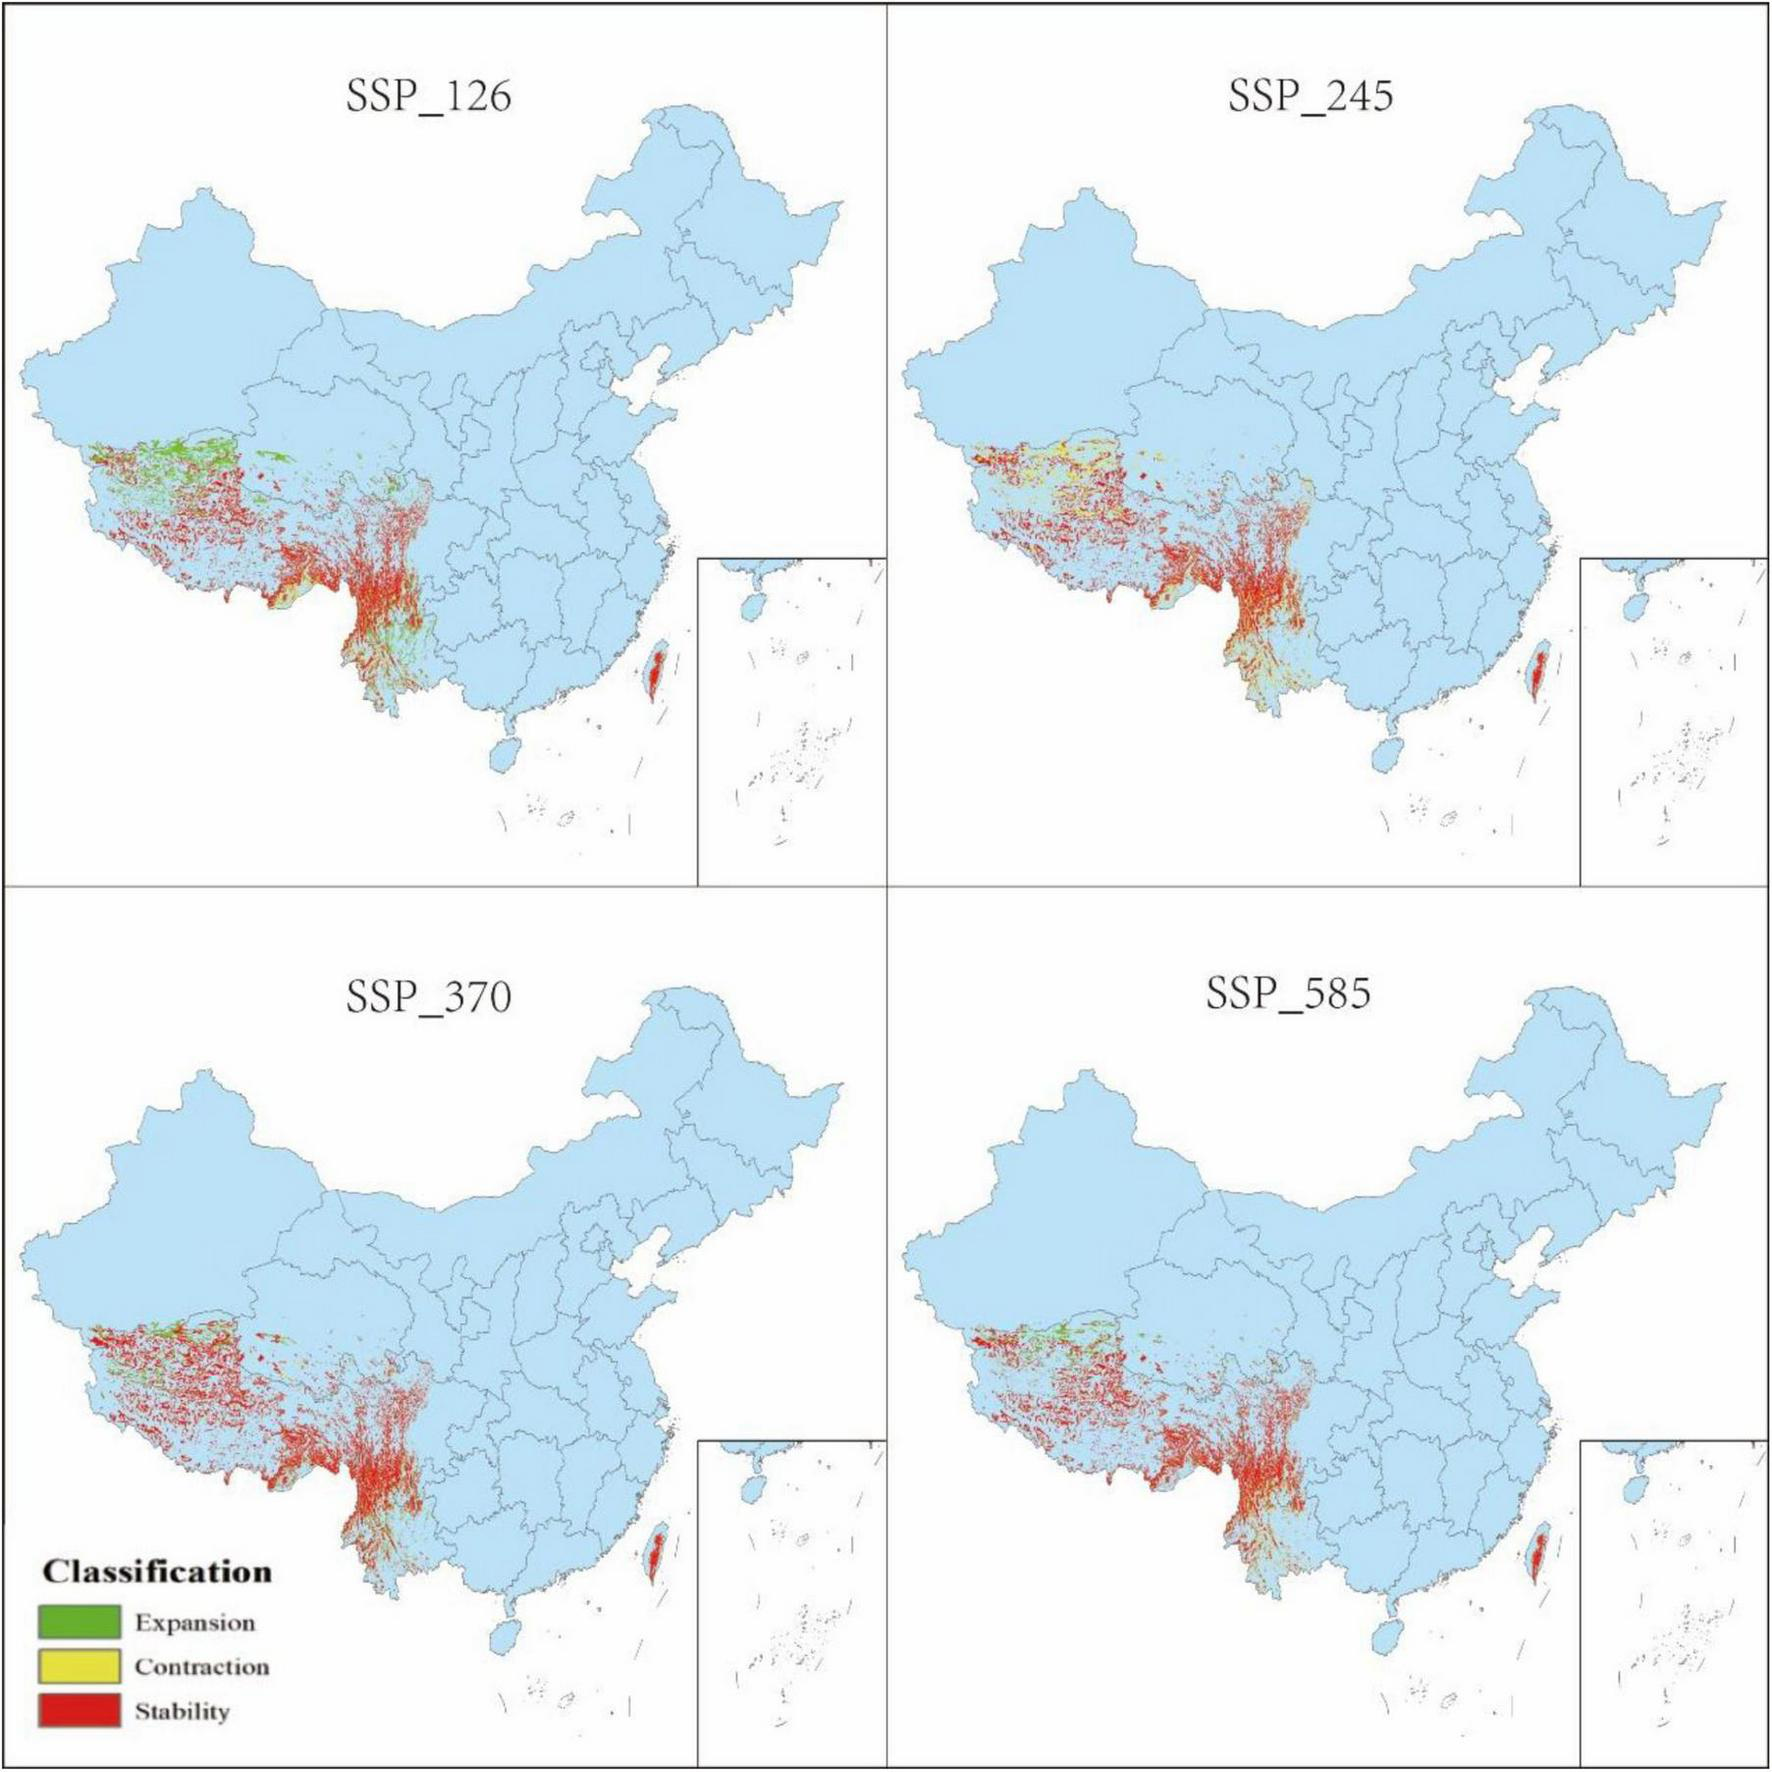
Changes in distribution of P. nepalensis, 2030s–2050s.
FIGURE 15
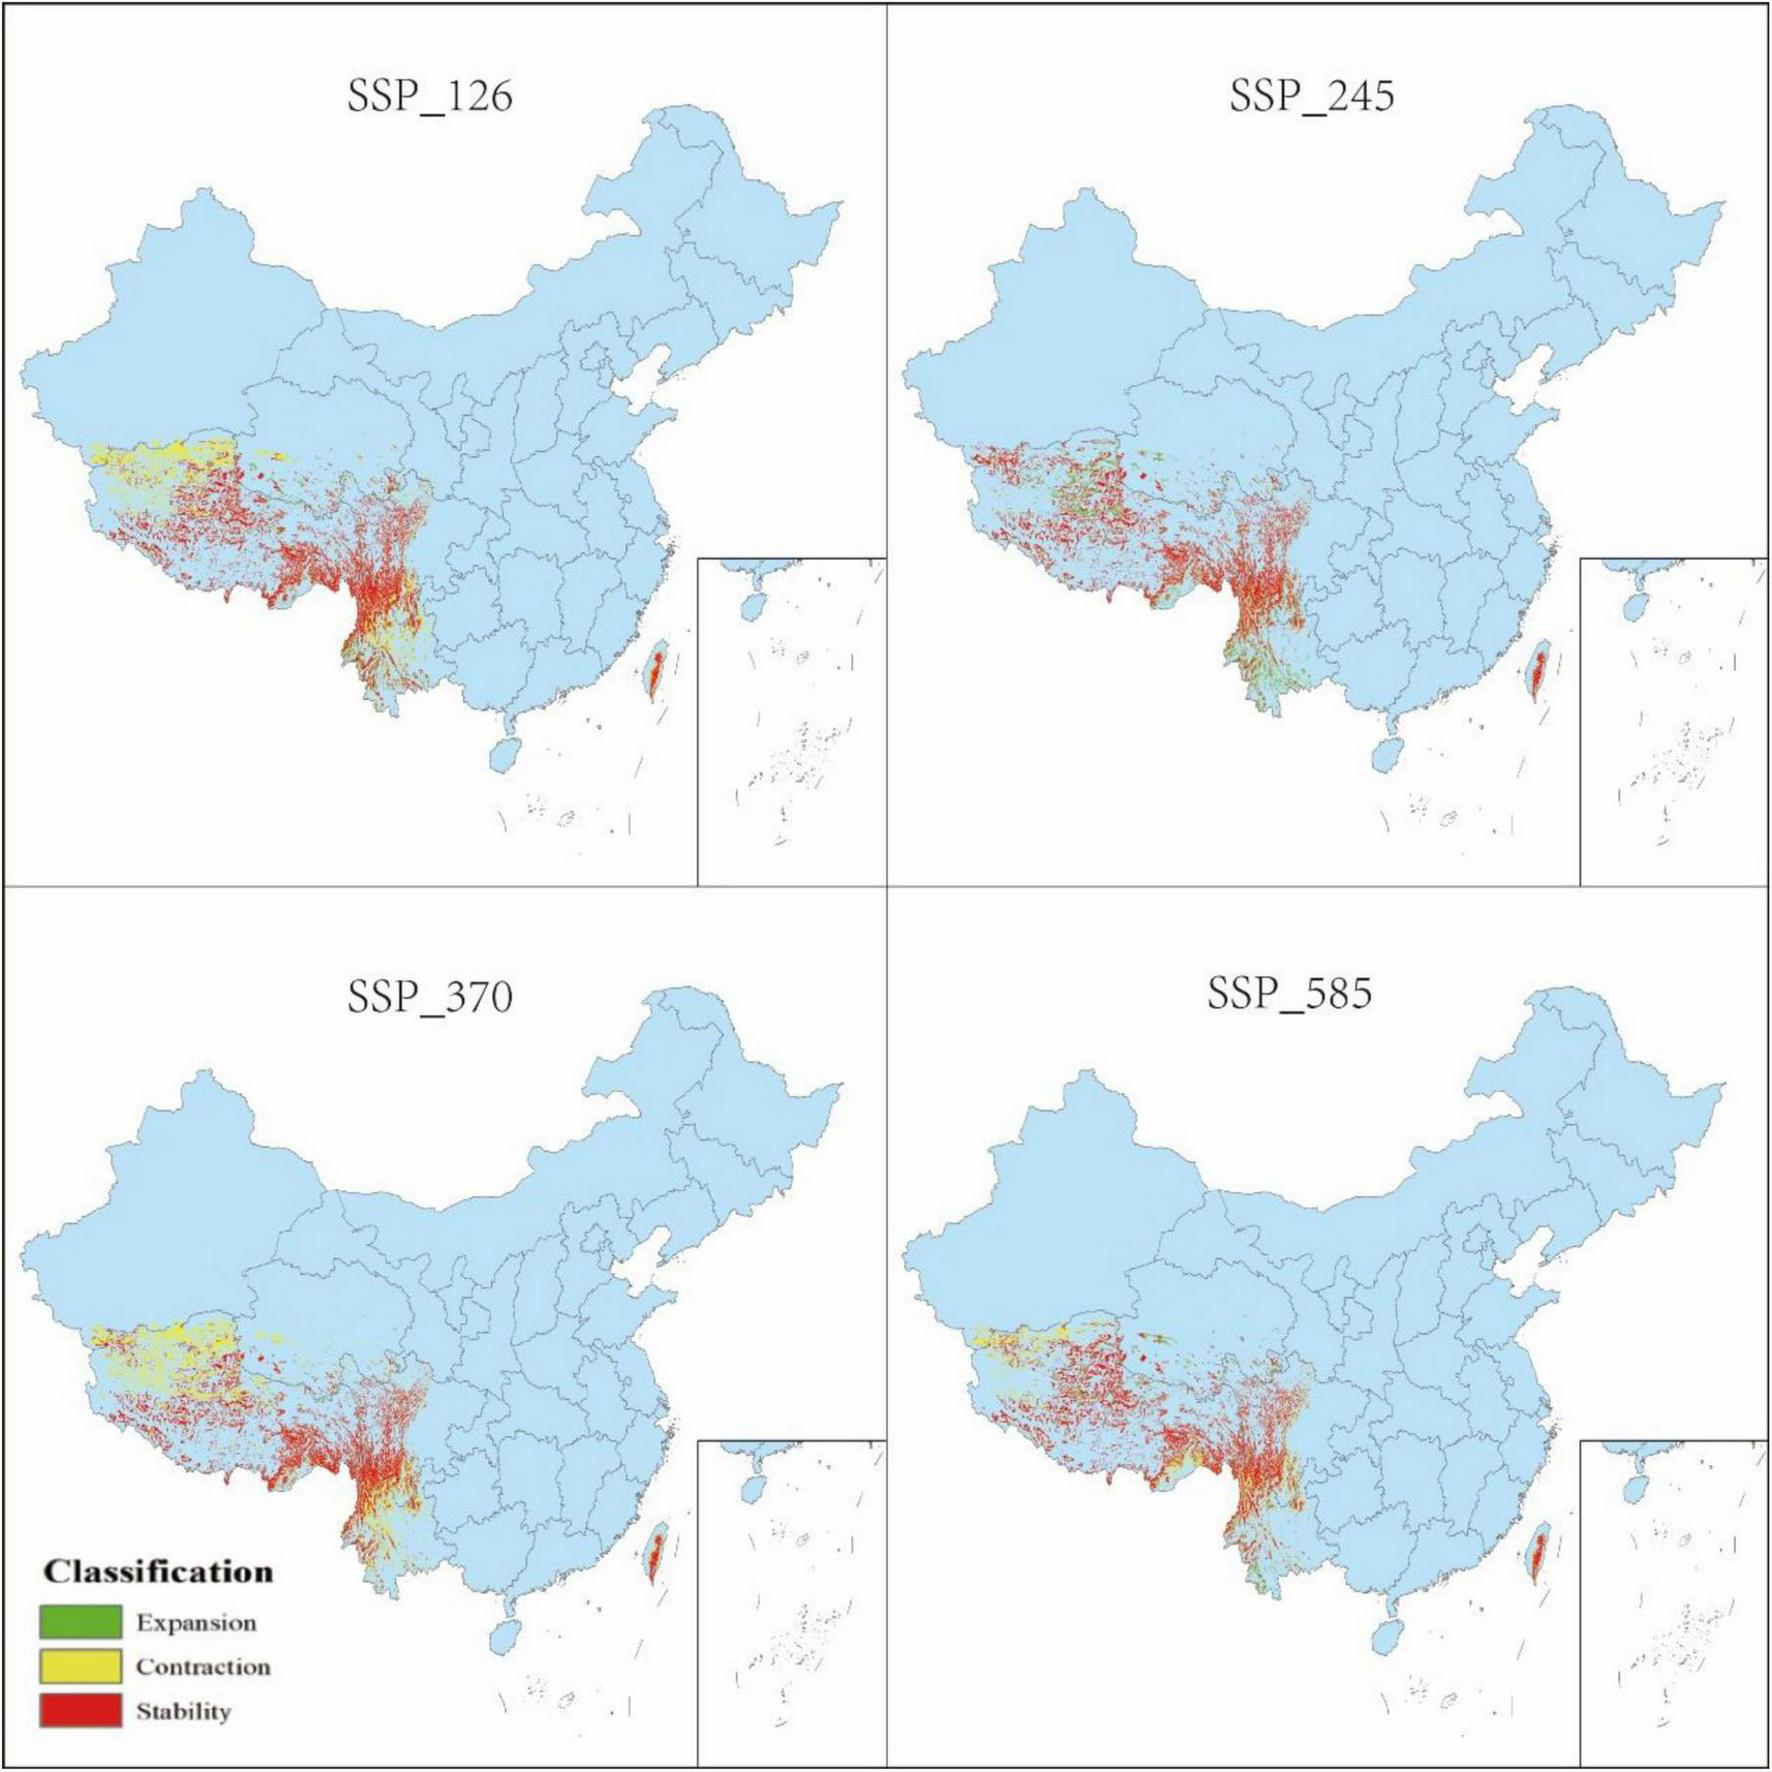
Changes in distribution of P. nepalensis, 2050s–2070s.
FIGURE 16
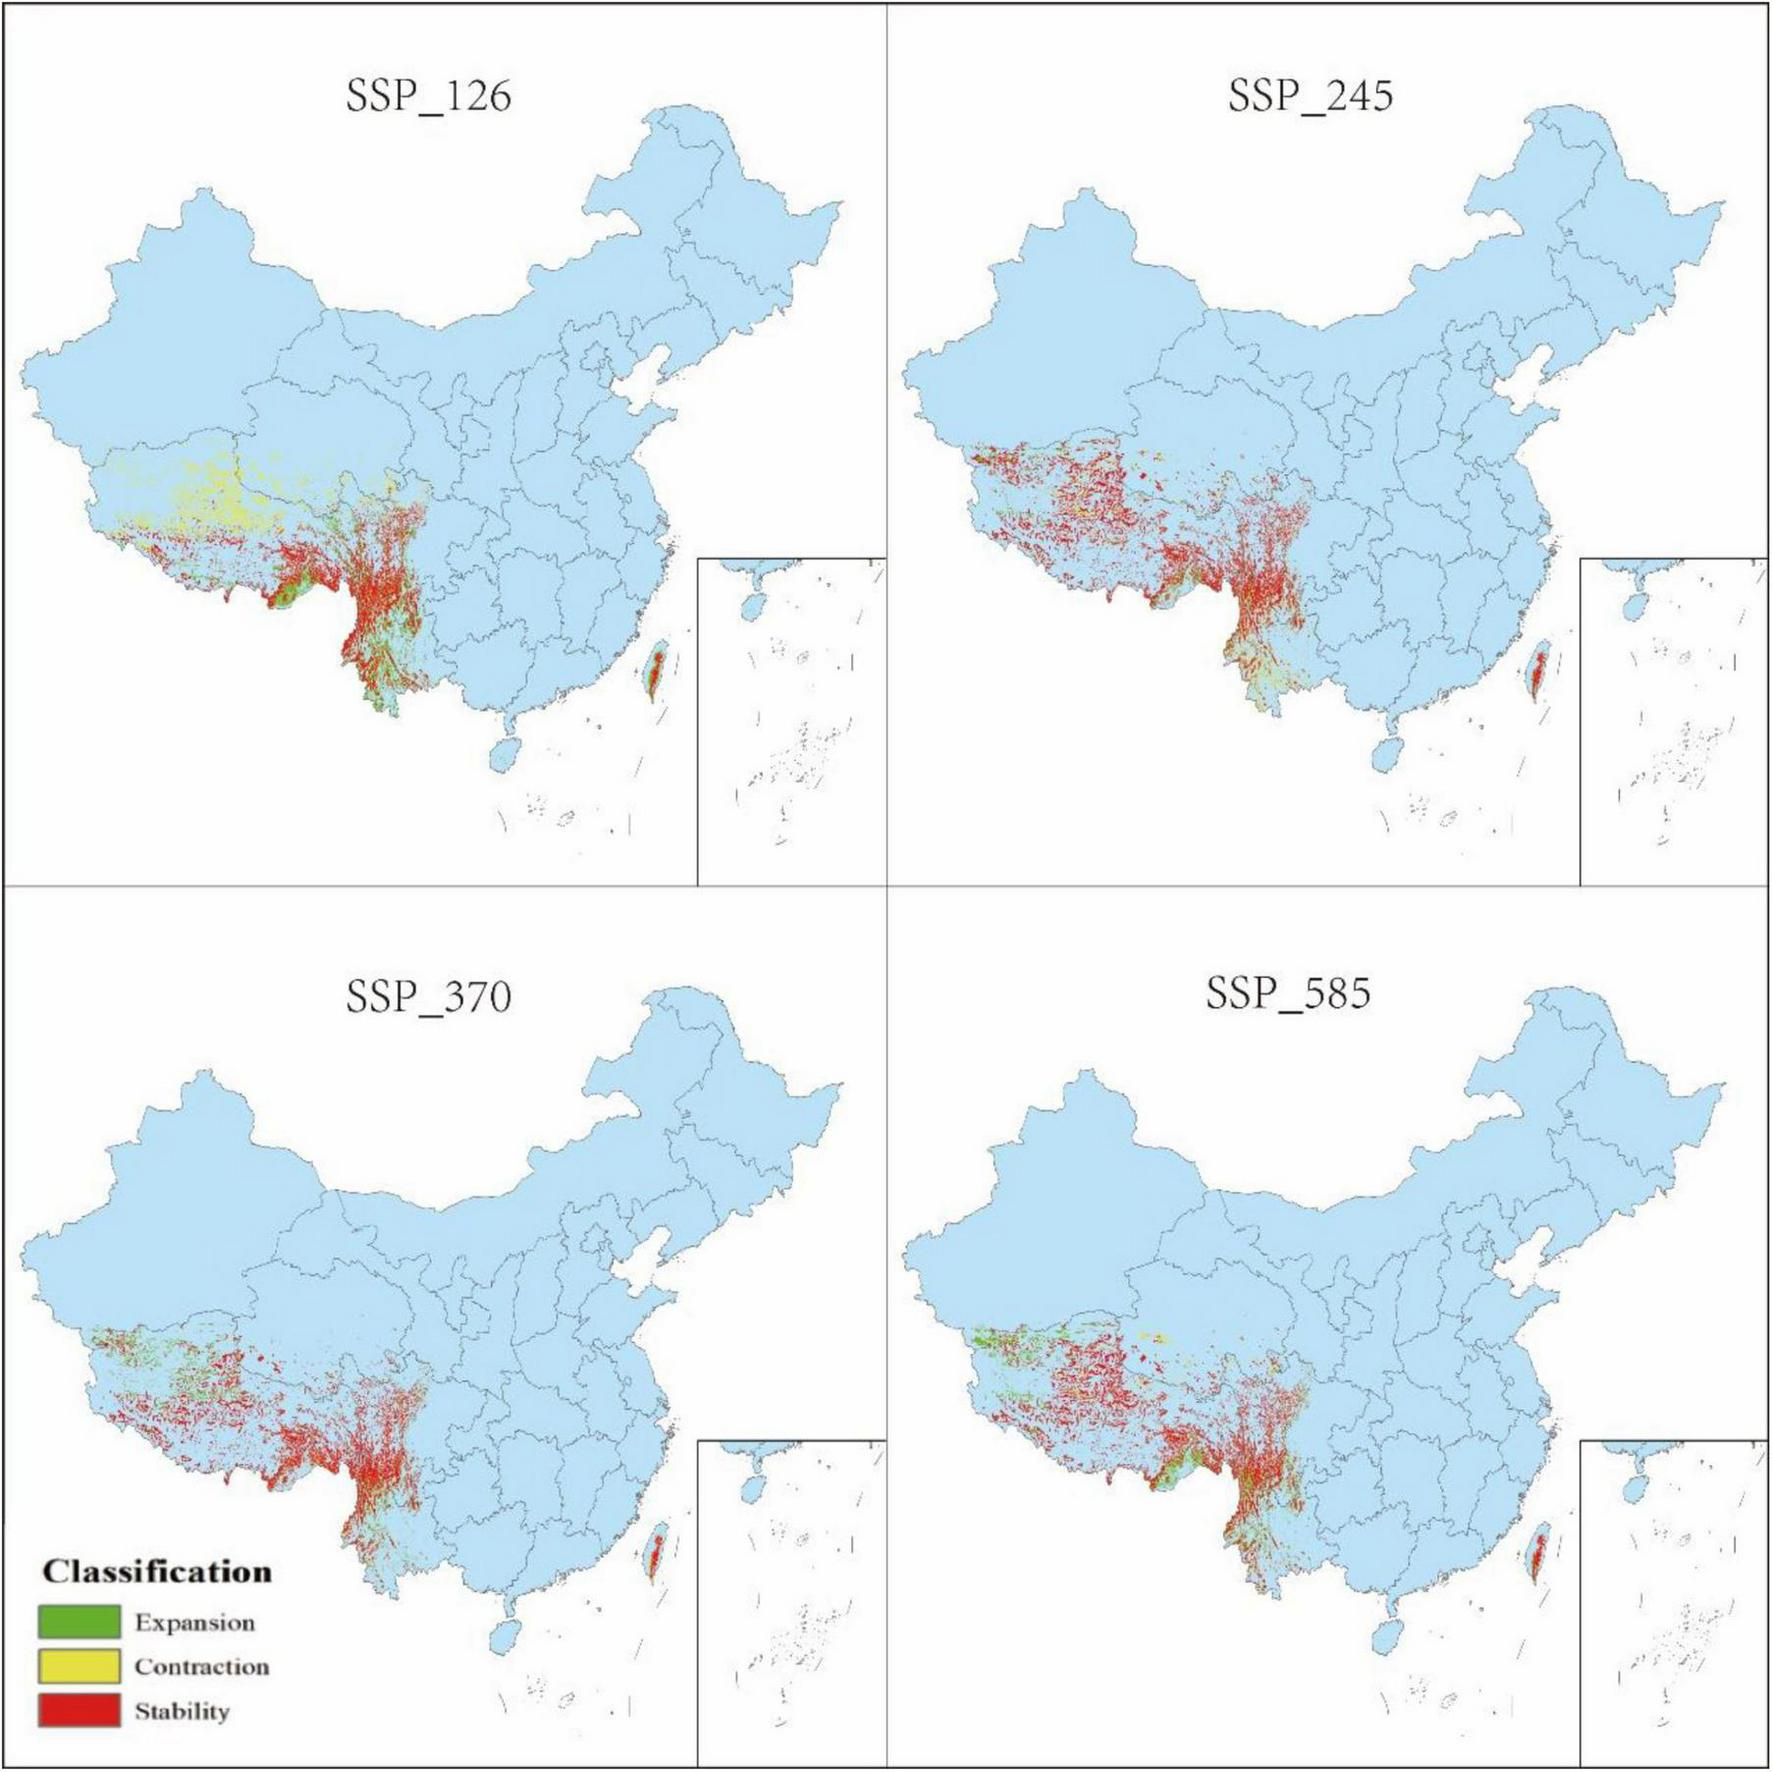
Changes in distribution of P. nepalensis, 2070s–2090s.
4 Discussion
4.1 Key environmental constraints on distribution
The MaxEnt model identified eight key environmental drivers shaping the distribution of P. nepalensis, with elevation (37% contribution), slope (26.3%), and temperature seasonality (Bio4: 18.2%) emerging as the most influential factors. These findings are consistent with previous studies emphasizing the dominant role of topographic and climatic variables in determining the distribution of alpine species (Xu et al., 2019). While elevation exhibited high contribution in the primary model, its role likely reflects indirect mediation of bioclimatic gradients rather than direct physiological tolerance. Supporting this, the alternative model excluding elevation retained strong predictive power (AUC = 0.972) (Xu et al., 2019), with temperature seasonality and slope compensating for elevational effects. This interpretation corroborates prior studies conceptualizing elevation as a composite variable integrating abiotic filters rather than a direct niche axis (Zurell et al., 2009).Slope influences local hydrology and soil stability, thereby affecting nutrient retention and water availability. Temperature seasonality (Bio4) captures annual thermal fluctuations, which are critical for phenological cycles, while precipitation during the warmest quarter (Bio18) highlights the importance of moisture availability during the growing season.
Although soil variables contributed a modest cumulative influence (10.3%), the specificity of subsoil calcium carbonate (S_CACO3) underscores its ecological significance. The presence of calcareous substrates suggests that conservation and restoration efforts should prioritize limestone-rich soils while avoiding acidification through inappropriate fertilization practices. However, the model’s reliance on a relatively small occurrence dataset (72 points) may introduce spatial biases, particularly in high-elevation regions where sampling efforts remain limited (Komori et al., 2020). Our occurrence records exhibit clustering in mid-elevation zones (3,200–4,000 m), with limited representation above 4,200 m—a critical elevation under future warming. This uneven coverage risks underestimating P. nepalensis’s upper elevational limits and thermal tolerances, as high-altitude refugia remain undersampled. Such bias could artificially inflate the importance of elevation while obscuring microclimatic adaptations. Future studies should prioritize stratified surveys across the full elevational gradient (3,200–4,500 m).
A critical limitation of the current model is its exclusion of biotic interactions, particularly plant-pollinator dynamics. P. nepalensis relies on Bombus pollinators, and habitat contraction under climate change may disrupt these mutualistic networks, potentially threatening reproductive success and genetic connectivity (Schweiger et al., 2010). Future research should integrate species distribution models (SDMs) with individual-based models (IBMs) to better capture demographic processes, dispersal limitations, and gene flow, offering a more comprehensive understanding of the species’ adaptive potential under changing environmental conditions (Zurell et al., 2018).
4.2 Habitat suitability and spatial dynamics
The current core distribution of P. nepalensis is centered in Déqên County, Yunnan (98°12’14.48”E, 28°19’4.75”N), a region characterized by a cold-temperate montane monsoon climate with a mean annual temperature of 4.7°C, average precipitation of 633.7 mm, and extreme temperature fluctuations ranging from –27.4 to 25.1°C. The pronounced vertical climatic zonation and distinct seasonal hydrological patterns in this region create highly favorable ecological conditions for the species, supporting its growth and persistence in montane habitats.
Our analysis reveals a distinct “quality-space decoupling” (Dullinger et al., 2012) in the response of P. nepalensis to climate change, wherein total habitat availability expands while high-quality habitats contract. This pattern arises from species-specific responses to key climatic variables. Rising temperature seasonality (Bio4), projected to increase by 12% under SSP5-8.5 by 2100, disrupts phenological synchrony in mid-elevation zones (3,200–4,200 m). Populations in these regions face heightened frost risk during flowering (April–June) and heat stress during seed maturation (September–October), driving upward migration to thermally stable refugia above 4,200 m where Bio4 remains below 850 (coefficient of variation × 100) (Dormann et al., 2013). Concurrently, declining precipitation in the warmest quarter (Bio18), which drops by 18% under SSP5-8.5, reduces soil moisture during critical growth periods (July–August), particularly in arid valleys such as the upper Yarlung Tsangpo. In contrast, moderate Bio18 increases (+ 5% under SSP1-2.6) enhance establishment in humid microhabitats along eastern Himalayan slopes.
Under low-emission scenarios (SSP126), high-suitability areas (0.71–0.83%) largely coincide with stable zones (3.41–4.68%), suggesting that local adaptation mechanisms may buffer against moderate climatic shifts. The species’ potential for vertical migration, facilitated by the observed lapse rate of 0.6°C cooling per 100 m elevation gain, could mitigate thermal stress, aligning with established altitudinal adaptation strategies observed in Himalayan flora (Chettri et al., 2010). The interplay between thermal and hydrological shifts further modulates range dynamics. Warming winter temperatures (Bio11 increases of + 2.3°C under SSP5-8.5) lower mortality at high elevations (> 4,500 m), enabling expansion into previously uninhabitable areas. However, this potential is counteracted by Bio4-driven instability, resulting in ephemeral “ghost habitats” with low establishment success.
In contrast, high-emission scenarios (SSP585) project a severe contraction of high-suitability habitats from 0.68 to 0.52%, with contraction zones expanding drastically to 8.15 × 10⁴ km2 (1.09%), indicative of irreversible habitat degradation driven by intensified heat extremes and altered precipitation regimes. While low-suitability “ghost habitats” emerge transiently–such as the expansion to 31.29 × 10⁴ km2 under SSP370–they lack ecological functionality, raising concerns about the persistence of viable populations. The expansion of total habitat alongside the contraction of high-suitability areas reflects both ecological constraints and methodological limitations, with P. nepalensis’ narrow thermal tolerance (Bio6/Bio18) and edaphic specialization on calcareous soils driving core habitat loss at intermediate elevations (3,200–4,200 m), and methodological factors like collinearity between elevation and bioclimatic variables inflating topographic importance (Dormann et al., 2013), neglect of dispersal limitations in novel climates (Elith et al., 2010), and logistic thresholds exaggerating marginal habitat gains (Liu et al., 2013) potentially amplifying this pattern.
The pathway–specific dynamics further illustrate the differential impacts of climate trajectories. Under SSP126, stable suitable habitats remain relatively consistent, accounting for 4.55–4.68% of the study area between 2041 and 2080, with minimal fluctuation (± 0.12%) in highly suitable regions. This relative stability suggests that the species may counteract climate-driven pressures through altitudinal shifts, mirroring the adaptive strategies of other alpine taxa. Under SSP245, stability gains from 2.20 to 4.43% mask a simultaneous decline in high-suitability habitats (0.75–0.40%), likely a result of hydrothermal imbalances, including a projected + 1.5°C increase in the coldest quarter temperature (Bio11) (Thuiller et al., 2005). The SSP370 scenario presents a mid-century peak in stability (5.74%) before a sharp post-2060 collapse, with contraction zones increasing to 2.38%, possibly linked to CO2-induced photosynthetic inhibition (Wang et al., 2014). Under SSP585, oscillating stability levels (4.15 to 2.09 to 4.10%) and persistent contraction (> 1.09%) reflect the compounding impacts of extreme climatic events under high-emission trajectories.
Horizontal expansion into northeastern valleys (e.g., Salween-Mekong divide) is further constrained by Bio18 thresholds (> 250 mm warmest quarter precipitation) and dispersal limitations imposed by gravity-dependent seeds (Xu et al., 2017). Compared to Himalayan endemic species such as Meconopsis horridula (Wang et al., 2021), P. nepalensis exhibits greater low-suitability habitat expansion (3.62% vs. 1.8%) but demonstrates weaker resilience in high-suitability zones, contracting 1.3 times more severely. This discrepancy may be attributed to its shallow root system and gravity-dispersed seed traits, which limit its capacity for long-distance colonization and physiological tolerance to shifting environmental conditions (Xu et al., 2017). These findings underscore the importance of targeted conservation strategies that consider not only projected habitat shifts but also species-specific dispersal limitations and adaptive potential in response to climate change.
These mechanisms align with observed shifts in Himalayan congeners like Meconopsis horridula (Wang et al., 2021), but P. nepalensis exhibits heightened sensitivity to Bio4 variability due to its shallow root system and prolonged flowering period.
4.3 Conservation strategies
The identification of climate refugia is crucial for safeguarding alpine biodiversity and ensuring the long-term persistence of species under changing environmental conditions (Baumgartner et al., 2018). Our projections highlight stable habitat zones, including Lijiang, Diqing, Liangshan, Aba, and Nyingchi, as critical conservation priorities for P. nepalensis. To address the divergent migration trends observed across SSP scenarios (2041–2100), integrated strategies must account for both vertical and horizontal habitat shifts. Under low-emission pathways (SSP1-2.6), core populations are projected to migrate upward to 3,800–4,500 m, maintaining 62% overlap with current habitats, whereas high-emission trajectories (SSP5-8.5) drive fragmentation, reducing overlap to 28%. Simultaneously, low-suitability habitats expand northeastward along valley corridors (e.g., Salween-Mekong divide), though natural dispersal may lag due to gravity-dependent seed limitations (Xu et al., 2017).
The primary conservation focus should prioritize in situ protection of stable refugia (e.g., Diqing and Nyingchi) through grazing bans and tourism regulations, ensuring the preservation of calcareous substrates (S_CACO3 > 15%) and optimal slope conditions (15–30°). Another key direction involves restoring connectivity across fragmented habitats by establishing ecological corridors along the Yarlung Tsangpo and Salween River basins, where assisted colonization and soil pH management (7.0–8.5) could mitigate SSP3-7.0-induced isolation. Furthermore, community-based agroforestry initiatives in expansion zones (e.g., western Sichuan Plateau) could enhance socioeconomic resilience while safeguarding pollinator networks (Bombus spp.), whose collapse threatens reproductive success under intensified warming (Schweiger et al., 2010).
Despite these measures, critical uncertainties remain. The model does not fully resolve dispersal constraints imposed by seed traits, necessitating individual-based models (IBMs) to quantify colonization thresholds. Soil-microbe interactions, particularly arbuscular mycorrhizal fungi mediating calcareous adaptation, require experimental validation. Additionally, extreme climate heterogeneity (e.g., drought pulses) warrants integration with dynamic vegetation models to refine habitat forecasts.
5 Conclusion
This study robustly demonstrates that climate change will fundamentally reshape the distribution of Piptanthus nepalensis, with critical implications for conservation planning in Himalayan ecosystems. Integrated modeling reveals three key conclusions: while total suitable habitat may expand by 12–22% under different scenarios, high-quality habitats will decline by 16–40%, creating an “ecological illusion” where quantity masks deteriorating quality. Five critical counties (Lijiang, Diqing, Liangshan, Aba, Nyingchi) emerge as persistent climate refugia, maintaining > 55% habitat stability across all emission scenarios and serving as biodiversity arks. Given the species’ limited dispersal capacity and specialized calcareous soil requirements, immediate protection of core areas and proactive corridor development are imperative. Proposed conservation pathways include establishing altitudinal connectivity corridors (3,200–4,500 m), genotype banking in contraction zones (Yarlung Tsangpo valleys), community-led microrefugia management in Diqing and Nyingchi, and real-time soil moisture monitoring in expansion zones. Limitations include gravity-dependent seed dispersal constraints, unmodeled pollinator network disruptions, 1-km resolution overlooking microrefugia, and simplified soil carbonate dynamics. Protecting P. nepalensis safeguards a keystone ecological engineer for high-altitude soil stabilization, water regulation, and pastoral communities. Implementing a three-tier strategy (core protection, connectivity enhancement, climate-adaptive management) by 2040 can transform projected habitat contraction into resilience. Future research should prioritize integrating genomic adaptation signatures with distribution models to identify evolutionarily significant units for persistence under climate change.
Statements
Data availability statement
The datasets presented in this study can be found in online repositories. The names of the repository/repositories and accession number(s) can be found in the article/Supplementary material.
Author contributions
YY: Writing – review & editing, Project administration, Validation, Funding acquisition, Resources. JA: Supervision, Conceptualization, Writing – review & editing, Methodology, Data curation, Software, Writing – original draft, Investigation, Visualization. HY: Funding acquisition, Validation, Writing – review & editing, Resources, Project administration.
Funding
The author(s) declare that financial support was received for the research and/or publication of this article. This research was funded by Xizang Agriculture and Animal Husbandry University Doctoral Program in Forestry (Phase I) funded by Grant 533325001, 2024 Central Finance Special Fund for Local University Development and Reform: Construction of Highland Characteristic Agriculture and Animal Husbandry Technology “Xiaoyuan” and Comprehensive Service Capacity Improvement (XY2004-03, XK2024-04), the Graduate Education Innovation Program of Tibet Agriculture and Animal Husbandry University (YJS2024-26; YJS2024-28; YJS2024-31), and the Key Laboratory of Forestry Ecological Engineering.
Acknowledgments
We extend my profound gratitude to Gu Jiqi for his invaluable expertise and meticulous guidance that were pivotal in refining and enhancing the quality of my thesis.
Conflict of interest
The authors declare that the research was conducted in the absence of any commercial or financial relationships that could be construed as a potential conflict of interest.
Generative AI statement
The authors declare that no Generative AI was used in the creation of this manuscript.
Publisher’s note
All claims expressed in this article are solely those of the authors and do not necessarily represent those of their affiliated organizations, or those of the publisher, the editors and the reviewers. Any product that may be evaluated in this article, or claim that may be made by its manufacturer, is not guaranteed or endorsed by the publisher.
Supplementary material
The Supplementary Material for this article can be found online at: https://www.frontiersin.org/articles/10.3389/ffgc.2025.1601085/full#supplementary-material
References
1
Baumgartner J. B. Esperón-Rodríguez M. Beaumont L. J. (2018). Identifying in situ climate refugia for plant species. Ecography41, 1850–1863. 10.1111/ecog.03431
2
Chen I. C. Hill J. K. Ohlemüller R. Roy D. B. Thomas C. D. (2011). Rapid range shifts of species associated with high levels of climate warming.Science3331024–1026. 10.1126/science.1206432
3
Chettri N. Sharma E. Shakya B. (2010). Biodiversity Conservation in the Kangchenjunga Landscape.Kathmandu: International Centre for Integrated Mountain Development (ICIMOD).
4
Cobos M. E. Peterson A. T. Barve N. Osorio-Olvera L. (2019). kuenm: An R package for detailed development of ecological niche models using MaxEnt.PeerJ7:e6281. 10.7717/peerj.6281
5
Cun Y. Z. Wang X. Q. (2010). Plant recolonization in the Himalaya from the southeastern Qinghai-Tibetan Plateau: Geographical isolation contributed to high population differentiation. Mol. Phylogenet. Evol.56, 972–982. 10.1016/j.ympev.2010.05.007
6
Dormann C. F. (2007). Effects of incorporating spatial autocorrelation into the analysis of species distribution data.Glob. Ecol. Biogeogr.16129–138. 10.1111/j.1466-8238.2006.00279.x
7
Dormann C. F. Elith J. Bacher S. Buchmann C. Carl G. Carré G. et al (2013). Collinearity: A review of methods to deal with it and a simulation study evaluating their performance.Ecography3627–46. 10.1111/j.1600-0587.2012.07348.x
8
Dullinger S. Gattringer A. Thuiller W. Moser D. Zimmermann N. E. Guisan A. et al (2012). Extinction debt of high-mountain plants under twenty-first-century climate change.Nat. Clim. Change2619–622. 10.1038/nclimate1514
9
Editorial Committee of Vegetation Map of China. (2001). Vegetation Atlas of China (1:1,000,000).Beijing: Science Press.
10
Elith J. Leathwick J. R. (2009). Species distribution models: Ecological explanation and prediction across space and time.Annu. Rev. Ecol. Evol. Syst.40677–697. 10.1146/annurev.ecolsys.110308.120159
11
Elith J. Kearney M. Phillips S. (2010). The art of modelling range-shifting species.Methods Ecol. Evol.1330–342. 10.1111/j.2041-210X.2010.00036.x
12
Guisan A. Thuiller W. (2005). Predicting species distribution: Offering more than simple habitat models.Ecol. Lett.8993–1009. 10.1111/j.1461-0248.2005.00792.x
13
Guisan A. Zimmermann N. E. (2000). Predictive habitat distribution models in ecology.Ecol. Model.135147–186. 10.1016/S0304-3800(00)00354-9
14
Guo Q. Li H. Zheng W. Pan J. Lu J. Li J. et al (2023). Analysis of genetic diversity and prediction of Larix species distribution in the Qinghai–Tibet Plateau.China. J. For. Res.34705–715. 10.1007/s11676-022-01513-1
15
Hickling R. Roy D. B. Hill J. K. Fox R. Thomas D. (2006). The distributions of a wide range of taxonomic groups are expanding polewards.Glob. Change Biol.12450–455. 10.1111/j.1365-2486.2006.01116.x
16
Hiddink J. G. Ter Hofstede R. (2007). Climate induced increases in species richness of marine fishes.Glob. Change Biol.14453–460. 10.1111/j.1365-2486.2007.01518.x
17
Hijmans R. J. Cameron S. E. Parra J. L. Jones G. Jarvis A. (2005). Very high resolution interpolated climate surfaces for global land areas.Int. J. Climatol.251965–1978. 10.1002/joc.1276
18
Hutchinson G. E. (1957). Concluding remarks.Cold Spring Harb. Symp. Quant. Biol.22415–427. 10.1101/SQB.1957.022.01.039
19
Komori O. Eguchi S. Saigusa Y. Kusumoto B. Kubota Y. (2020). Sampling bias correction in species distribution models by quasi-linear Poisson point process. Ecol. Inform.55:101015. 10.1016/j.ecoinf.2019.101015
20
Li H. Chen J. Xu J. (2022). Projecting range shifts of endemic alpine plants under climate change: A comparative study using EC-Earth3-veg and MIROC6.Ecol. Model.471:110058. 10.1016/j.ecolmodel.2022.110058
21
Li Y. Li M. Li C. Liu Z. (2020). Optimized maxent model predictions of climate change impacts on the suitable distribution of cunninghamia lanceolata in China. Forests11:302. 10.3390/f11030302
22
Liu C. White M. Newell G. (2013). Selecting thresholds for the prediction of species occurrence with presence-only data.J. Biogeogr.40778–78910.1111/jbi.12058
23
Merow C. Smith M. J. Silander J. A. A. (2013). practical guide to MaxEnt for modeling species’ distributions: What it does, and why inputs and settings matter.Ecography361058–1069. 10.1111/j.1600-0587.2013.07872.x
24
Owens H. L. Campbell L. P. Dornak L. L. (2013). Climatic niche shifts between species’ native and naturalized ranges expose phenotypic plasticity.J. Biogeogr.402398–2404. 10.1111/geb.12208
25
Peterson A. T. (2003). Predicting the geography of species’ invasions via ecological niche modeling.Q. Rev. Biol.78419–433. 10.1086/378926
26
Phillips S. J. Anderson R. P. Dudík M. (2017). Opening the black box: An open-source release of MaxEnt.Ecography40887–893. 10.1111/ecog.03049
27
Phillips S. J. Anderson R. P. Schapire R. E. (2006). Maximum entropy modeling of species geographic distributions.Ecol. Model.190231–259. 10.1016/j.ecolmodel.2005.03.026
28
Santini L. Benítez-López A. Maiorano L. Čengić M. Huijbregts M. A. (2021). Assessing the reliability of species distribution projections in climate change research. Divers. Distrib.27, 1035–1050. 10.1111/ddi.13252
29
Schweiger O. Biesmeijer J. C. Bommarco R. Hickler T. Hulme P. Klotz S. et al (2010). Multiple stressors on biotic interactions: How climate change and alien species interact to affect pollination.Biol. Rev.85777–795. 10.1111/j.1469-185X.2010.00125.x
30
Thuiller W. Lavorel S. Araújo M. B. Sykes M. T. Prentice I. C. (2005). Climate change threats to plant diversity in Europe.Proc. Natl. Acad. Sci. U S A.1028245–8250. 10.1073/pnas.04099021
31
Valavi R. Guillera-Arroita G. Lahoz-Monfort J. J. (2022). Predictive performance of presence-only species distribution models: A benchmark study with reproducible code.Ecol. Monogr.92:e01486. 10.1002/ecm.1486
32
Wang D. Heckathorn S. A. Hamilton E. W. Frantz J. (2014). Effects of CO2 on the tolerance of photosynthesis to heat stress can be affected by photosynthetic pathway and nitrogen. Am. J. Bot., 101, 34–44. 10.3732/ajb.1300267
33
Wang H. Wu W. Pan G. Pei D. (2015). Analysis of genetic diversity and relationships among 86 Persian walnut (Juglans regia L.) genotypes in Tibet using morphological traits and SSR markers.J. Hortic. Sci. Biotech.90, 563–570. 10.1080/14620316.2015.11668715
34
Wang Y. Zhang X. Li Q. (2021). Evaluating CMIP6 model performance in simulating extreme climate events over the tibetan plateau.J. Geophys. Res. Atmos.126:e2021JD034567. 10.1029/2021JD034567
35
Wang W. T. Guo W. Y. Jarvie S. Svenning J. C. (2021). The fate of Meconopsis species in the Tibeto-Himalayan region under future climate change. Ecol. Evol.11, 887–89910.1002/ece3.7096
36
Warren D. L. Glor R. E. Turelli M. (2010). ENMTools: A toolbox for comparative studies of environmental niche models.Ecography33607–611. 10.1111/j.1600-0587.2009.06142.x
37
Wilson R. J. Thomas C. D. Fox R. Roy D. B. Kunin W. E. (2004). Spatial patterns in species distributions reveal biodiversity change.Nat.432393–396. 10.1038/nature03031
38
Wink M. (2013). Evolution of secondary metabolites in legumes (Fabaceae). S. Afr. J. Bot.89, 164–175. 10.1016/j.sajb.2013.06.006
39
Wyser K. van Noije T. Yang S. (2020). Dynamic vegetation-climate feedbacks in the EC-earth3-veg model: Implications for alpine ecosystems.Geosci. Model Dev.133129–3148. 10.5194/gmd-13-3129-2020
40
Xu J. Li W. Zhang C. Liu W. Du G. (2017). The determinants of seed germination in an alpine/subalpine community on the Eastern Qinghai-Tibetan Plateau. Ecol. Eng. 98, 114–122. 10.1016/j.ecoleng.2016.10.070
41
Xu W. B. Svenning J. C. Chen G. K. Zhang M. G. Huang J. H. Chen B. et al (2019). Human activities have opposing effects on distributions of narrow-ranged and widespread plant species in China.Proc. Natl. Acad. Sci.116:26674–26681. 10.1073/pnas.1911851116
42
Yang L. Li H. Li Q. Guo Q. Li J. (2021). Genetic diversity analysis and potential distribution prediction of Sophora moorcroftiana endemic to Qinghai–Tibet Plateau.China. Forests12:1106. 10.3390/f12081106
43
Yang X. Q. Kushwaha S. P. Saran S. Xu J. Roy P. S. (2013). Maxent modeling for predicting the potential distribution of medicinal plant, Justicia adhatoda L. in Lesser Himalayan foothills.Ecol. Eng.5183–87. 10.1016/j.ecoleng.2012.12.004
44
Zhu G. P. Qiao H. J. (2016). Effect of the MaxEnt model’s complexity on the prediction of species potential distributions.Biodivers. Sci.241189–1196. 10.17520/biods.2016265
45
Zurell D. Graham C. H. Gallien L. Thuiller W. Zimmermann N. E. (2018). Long-distance migratory birds threatened by multiple independent risks from global change.Nat. Clim. Change8992–996. 10.1038/s41558-018-0312-9
46
Zurell D. Jeltsch F. Dormann C. F. Schröder B. (2009). Static species distribution models in dynamically changing systems: How good can predictions really be?Ecography32, 733–744. 10.1111/j.1600-0587.2009.05810.x
Summary
Keywords
climate change, species adaptation, distribution prediction, Piptanthus nepalensis , MaxEnt
Citation
Yanhui Y, Aohang J and Yanying H (2025) Prediction of the potential distribution of Piptanthus nepalensis in China under future climate scenarios. Front. For. Glob. Change 8:1601085. doi: 10.3389/ffgc.2025.1601085
Received
27 March 2025
Accepted
21 July 2025
Published
19 August 2025
Volume
8 - 2025
Edited by
Henry D. Adams, Washington State University, United States
Reviewed by
Prashant Sharma, Indian Council of Agricultural Research-Indian Veterinary Research Institute, India
Hairui Liu, Qinghai University, China
Salwan Hussein, University of Tikrit, Iraq
Yingfang Zhu, Central South University Forestry and Technology, China
Bo Mao, Anhui University of Science and Technology, China
Updates
Copyright
© 2025 Yanhui, Aohang and Yanying.
This is an open-access article distributed under the terms of the Creative Commons Attribution License (CC BY). The use, distribution or reproduction in other forums is permitted, provided the original author(s) and the copyright owner(s) are credited and that the original publication in this journal is cited, in accordance with accepted academic practice. No use, distribution or reproduction is permitted which does not comply with these terms.
*Correspondence: Han Yanying, hanyanying@xza.edu.cn
†These authors share first authorship
Disclaimer
All claims expressed in this article are solely those of the authors and do not necessarily represent those of their affiliated organizations, or those of the publisher, the editors and the reviewers. Any product that may be evaluated in this article or claim that may be made by its manufacturer is not guaranteed or endorsed by the publisher.