1 Introduction
Soil temperature is a vital indicator for forest ecosystems in the context of a changing climate. It can affect plant growth both directly—through its effect on physiological activity—and indirectly—through its effect on soil nutrient availability—which is crucial for the sustainable development of forest ecosystems (Paul et al., 2004). Moreover, soil temperature plays an essential role in understanding carbon and nutrient cycling in forest ecosystems under warming climate scenarios (Allison et al., 2010) due to the fact that both nighttime and daytime soil temperatures drive germination, blooming, and fruiting processes in forests (Hood, 2001; Schimel et al., 2014; Hu et al., 2016; Yan et al., 2018). Incorporating soil temperature data into climate and ecosystem models may improve the accuracy of numerical weather forecasts and long-term climate projections (Dirmeyer et al., 2006). Therefore, the importance of soil temperature data transcends disciplinary boundaries, addressing pressing environmental, ecological, and societal challenges, making it a valuable tool for advancing knowledge across various fields.
Bangladesh is a tropical country in South Asia and a transitional point for flora and fauna between the Indo-Himalayan and Indo-Chinese sub-regions. It has four major forest types: mixed-evergreen forests, deciduous forests, mangrove forests, and freshwater swamp forests. Forest systems in Bangladesh are extremely vulnerable to future climate change (Rahman and Rahman, 2018), especially in coping with monsoon flooding and dry periods. Soil temperature data in Bangladesh can offer novel insights into how changing temperatures impact flora and fauna, helping to design effective ecological conservation strategies, especially for sensitive and endangered species. Moreover, accurate soil temperature data in Bangladesh can aid in optimizing water use, reducing water wastage, and preventing over-irrigation in agricultural practices (Brammer, 2014).
Unfortunately, observed soil temperature data in Bangladesh are affected by various limitations, including missing values, inaccuracies, and irrelevant data points. These issues reduce the data's accessibility and utility for researchers, policymakers, and the public. At present, soil temperature data in Bangladesh are incomplete. Of the 34 meteorological stations operated by the Bangladesh Meteorological Department (BMD) (Figure 1), soil temperature was regularly measured at only 13 stations, at depths of 10 cm, 30 cm, and 50 cm, during the period from 2001 to 2022. The 13 stations include Bogra, Barisal, Comilla, Dhaka, Dinajpur, Faridpur, Khulna, Mymensingh, Rajshahi, Rangamati, Rangpur, Srimongal, and Tangail (marked in green in Figure 1). However, observed soil temperature data for the following periods at these 13 stations are still missing: Bogra: July–Dec 2009, Sep–Dec 2010, Oct–Dec 2017, and May–Dec 2018; Barisal: July–Dec 2009, 2010, Nov–Dec 2017, and May–Dec 2018; Comilla: July–Dec 2009, Aug–Dec 2010, Sep–Dec 2017, and May–Dec 2018, 2021; Dhaka: July–Dec 2009, Aug–Dec 2010, and May–Dec 2018; Dinajpur: July–Dec 2009, Aug–Dec 2010, and May–Dec 2018, 2021; Faridpur: July–Dec 2009, Aug-Dec 2010, Nov–Dec 2017, and May–Dec 2018; Khulna: July–Dec 2009, Sep–Dec 2010, Sep–Dec 2017, and May–Dec 2018, 2021; Mymensingh: July–Dec 2009, Aug–Dec 2010, and May–Dec 2018, 2021; Rajshahi: July–Dec 2009, Aug-Dec 2010, and May-Dec 2018, 2021; Rangamati: July–Dec 2009, Aug–Dec 2010, and May–Dec 2018, 2021; Rangpur: July–Dec 2009, Aug–Dec 2010, and May–Dec 2018, 2021; Srimongal: July–Dec 2009, Aug–Dec 2010, and May–Dec 2018; and Tangail: July–Dec 2009, Sep–Dec 2010, Nov–Dec 2017, and May–Dec 2018.
Figure 1
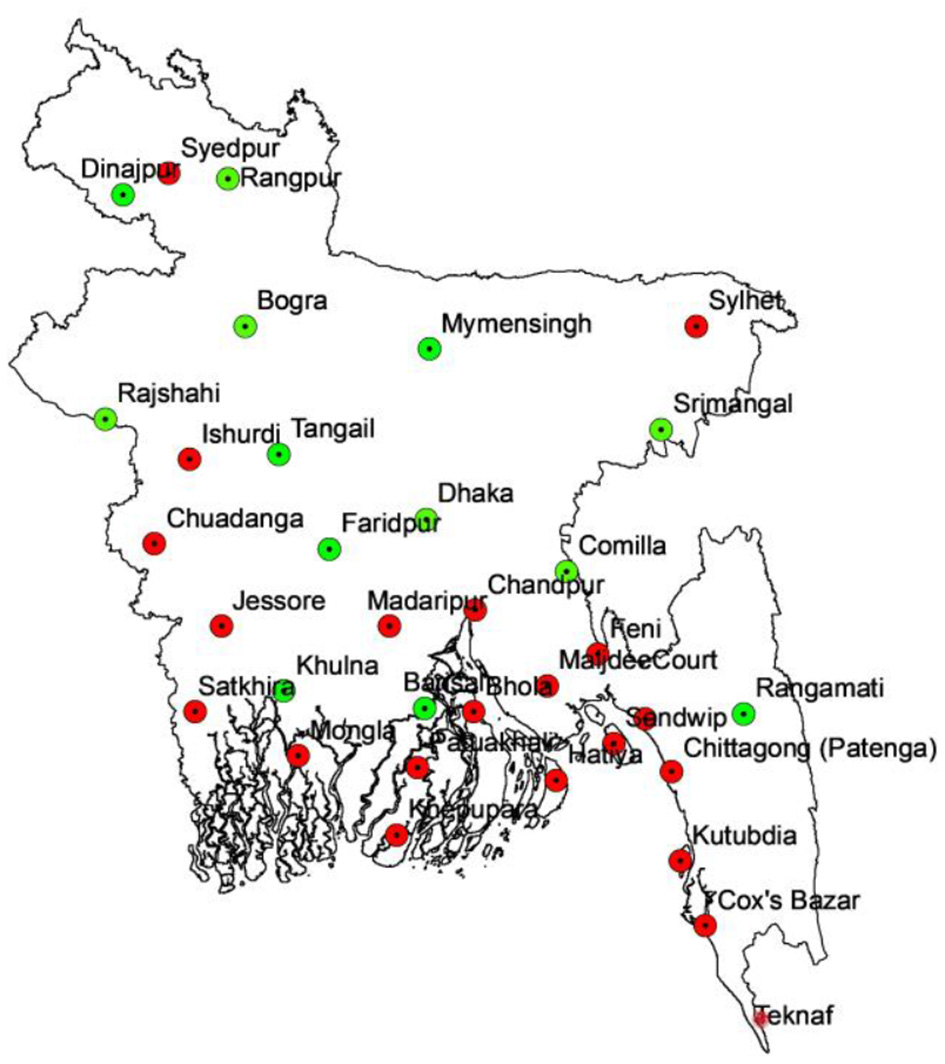
Location of the 34 meteorological stations in Bangladesh; green represents the stations with some observed soil data, while red indicates the stations without observed soil data.
In this data report, we used ensemble learning techniques to identify strong links between observed meteorological factors and soil temperature data from the 13 stations, and subsequently developed an optimal soil temperature forecasting model. Then, by inputting the observed data from the 34 meteorological stations into this optimal soil temperature model, we can not only produce the soil temperature dataset for the remaining 21 stations without observed soil data but can also fill in the missing soil temperature data at the 13 stations with a lot of missing soil data.
2 Methods
To generate soil temperatures at different depths in Bangladesh, we considered the following four ensemble models (Li et al., 2022). Random forest (RF): This model aggregates decision trees through bootstrapped sampling, addressing overfitting and handling missing values using user-defined parameters. Since RF offers averaged estimations across several aggregations, it fundamentally differs from individual decision trees (Sun et al., 2016). Gradient boosting tree (GBT): This model sequentially combines decision trees, efficiently correcting errors. The difference between GBT and RF is that RF builds all decision trees in parallel and its output is the average of prediction results from all decision trees, while GBT builds decision trees sequentially, and its output is the sum of forecast results from all decision trees (Wu et al., 2022). Hybrid DT-GBT: This model employs voting to combine a decision tree and a gradient boosting tree for forecasting tasks. It calculates the average of the forecasts produced by both learners. Hybrid RF-GBT: This model combines the strengths of both RF and GBT, boosting forecast accuracy and stability. It employs stacking and averaging techniques to enhance performance, outperforming individual models and effectively handling diverse data patterns, complex relationships, and unseen data.
Different time windows and different input scenarios can affect the performance of ensemble learning (Sattari et al., 2020). We considered five time window sizes: 1-day, 2-day, 3-day, 4-day, and 5-day. We considered different combinations of key meteorological factors, including daily minimum temperature (MIN), daily maximum temperature (MAX), daily mean temperature (MEAN), daily sunshine duration (SUN), daily rainfall (RAIN), and daily humidity (HUM). The eight input scenarios used were as follows: MEAN, MEAN-SUN, MEAN-MAX-MIN, MEAN-HUM-RAIN, MEAN-MAX-MIN-SUN, MEAN-MAX-MIN-SUN-RAIN, MEAN-MAX-MIN-SUN-HUM, and MEAN-MAX-MIN-SUN-HUM-RAIN.
From 1 January 2001 to 31 December 2022, all meteorological factors in the eight input scenarios were measured at the 34 meteorological stations across Bangladesh (Figure 1). However, soil temperature was only measured at 13 meteorological stations, and many missing values existed. Our method for generating a soil temperature dataset in Bangladesh can be divided into the following three steps:
-
Step 1. Establishment of the optimal soil temperature forecast model. We focused on the 13 meteorological stations in Bangladesh where both meteorological factors and soil temperature were measured at the same time. We deleted the time period with missing data and divided the remaining data into two parts: the data covering the period from 1 January 2001 to 31 December 2015 were used as the training dataset, while the data covering the period from 1 January 2016 to 31 December 2022 were used as the testing dataset. We used four ensemble learning models (RF, GBT, hybrid DT-GBT, and hybrid RF-GBT) to establish the soil temperature forecast model. Its output was the forecast of soil temperature for day t, and its input was one of eight input scenarios within a time window of size k (k = 1,2,3,4,5). By comparing the forecasting performance on the testing dataset, we obtained the optimal combination of the ensemble learning model, input scenario, and time window for forecasting soil temperature at different depths across the 13 meteorological stations in Bangladesh.
-
Step 2. Filling in missing soil temperature data at the 13 meteorological stations. In Step 1, we established the optimal soil forecast model for the 13 meteorological stations in Bangladesh, where soil temperature was only partially measured. During the time period when soil temperature was not measured, all other meteorological factors were measured. Therefore, we input the observed meteorological factors into the optimal soil temperature forecast model and then obtained estimates of soil temperature for the periods when soil temperature was not measured.
-
Step 3. Generation of soil temperature data at 21 meteorological stations. At these stations, meteorological factors were measured, but soil temperature was not measured. When two meteorological stations are located close to each other, the relationship between meteorological factors and soil temperature tends to be similar at both stations. Therefore, we could generate soil temperature data at the 21 stations using the following approach: For any station (e.g., Station A) among the 21 meteorological stations, we chose Station B from the 13 stations with measured soil temperature, ensuring that Station B was the nearest to Station A among all 13 stations. In step 2, we established the optimal soil forecast model for Station B. We input the observed meteorological factors from Station A into the optimal soil temperature forecast model for Station B, and then, we obtained soil temperature data for Station A.
2.1 Daily soil temperature data
Based on the Pearson correlation coefficient (R) between the observed and forecasted soil temperature at the 13 meteorological stations, we evaluated the forecasting performance of the combination of the four ensemble learning models, eight input scenarios, and 5-day time windows. Due to the limitation on the number of figures and tables in the data report, the detailed comparison results for the models with different inputs and time windows are provided in the Supplementary Files. For a 10 cm depth, the highest average R value was 0.9419 and the lowest RMSE value was 1.597, achieved by the GBT model with the 8th input scenario and a 5-day time window. For a 30 cm depth, the highest average R value was 0.9606 and the lowest RMSE value was 1.1959, achieved by the hybrid RF-GBT model with the 8th input scenario and a five-day time window. Similarly, for a 50 cm depth, the highest average R value (1.9005) and the lowest RMSE value (0.9397) were achieved by the same model and input conditions. These combinations of the models and input scenarios, which achieved the highest R value and the lowest RMSE value, were used to generate the daily soil temperature dataset in Bangladesh.
Using the method described in Step 2, we filled in the missing daily soil temperature data at 10 cm, 30 cm, and 50 cm depths for the 13 meteorological stations. The details for each station are as follows: Bogra: July–Dec 2009, Sep–Dec 2010, Oct–Dec 2017, and May–Dec 2018; Barisal: July–Dec 2009, 2010, Nov–Dec 2017, and May–Dec 2018; Comilla: July–Dec 2009, Aug–Dec 2010, Sep–Dec 2017, and May–Dec 2018, 2021; Dhaka: July–Dec 2009, Aug–Dec 2010, and May–Dec 2018; Dinajpur: July–Dec 2009, Aug–Dec 2010, and May–Dec 2018, 2021; Faridpur: July–Dec 2009, Aug–Dec 2010, Nov–Dec 2017, and May–Dec 2018; Khulna: July–Dec 2009, Sep–Dec 2010, Sep–Dec 2017, and May–Dec 2018, 2021; Mymensingh: July–Dec 2009, Aug–Dec 2010, and May–Dec 2018, 2021; Rajshahi: July–Dec 2009, Aug–Dec 2010, and May–Dec 2018, 2021; Rangamati: July–Dec 2009, Aug–Dec 2010, and May–Dec 2018, 2021; Rangpur: July–Dec 2009, Aug–Dec 2010, and May–Dec 2018, 2021; Srimongal: July–Dec 2009, Aug–Dec 2010, and May–Dec 2018; and Tangail: July–Dec 2009, Sep–Dec 2010, Nov–Dec 2017, and May–Dec 2018.
Using the method described in Step 3 above, we generated daily soil temperature data for the 21 meteorological stations. Figure 2 illustrates the variations in daily soil temperature at 10 cm, 30 cm, and 50 cm depths across 10 stations for the 00:00 h and the 12:00 h. The daily average soil temperature at the 10 cm depth (ST10) ranged from 13.7°C (Sydpur station) to 36.6°C (Patuakhali station) at 00:00 h and from 16.6°C (Sydpur station) to 39°C (Kutubdia station) at 12:00 h. Soil temperature at the 30 cm depth (ST30) ranged from 15.4°C (Sydpur station) to 36.4°C (Kutubdia station) at 00:00 h and from 16.2°C (Sydpur station) to 36.7°C (Chandpur station) at 12:00 h. Soil temperature at the 50 cm depth (ST50) ranged from 15.5°C (Sydpur station) to 33.1°C (Sylhet station) at 00:00 h and from 16.8°C (Sydpur station) to 36.9°C (Chandpur station) at 12:00 h. The highest soil temperature across the stations was 39°C, while the lowest was 13.7°C for ST10 at both 00:00 h and 12:00 h. ST10 exhibited greater variability due to its proximity to the surface and limited thermal mass, influenced by air temperature oscillations. ST30 and ST50, being deeper, displayed more stable temperature trends. All stations exhibited the lowest and highest temperatures at the 10 cm depth, except for Kutubdia and Mongla. Unique geographical features and local climate variations near the coast, including wind patterns and topography, contributed to the distinct soil temperature patterns at these locations. The temperature variations aligned with seasonal changes, increasing from January to April and decreasing from September to December. May to August saw the highest temperatures, correlating with the summer season, influenced by solar insolation, daylight duration, and soil thermal inertia.
Figure 2
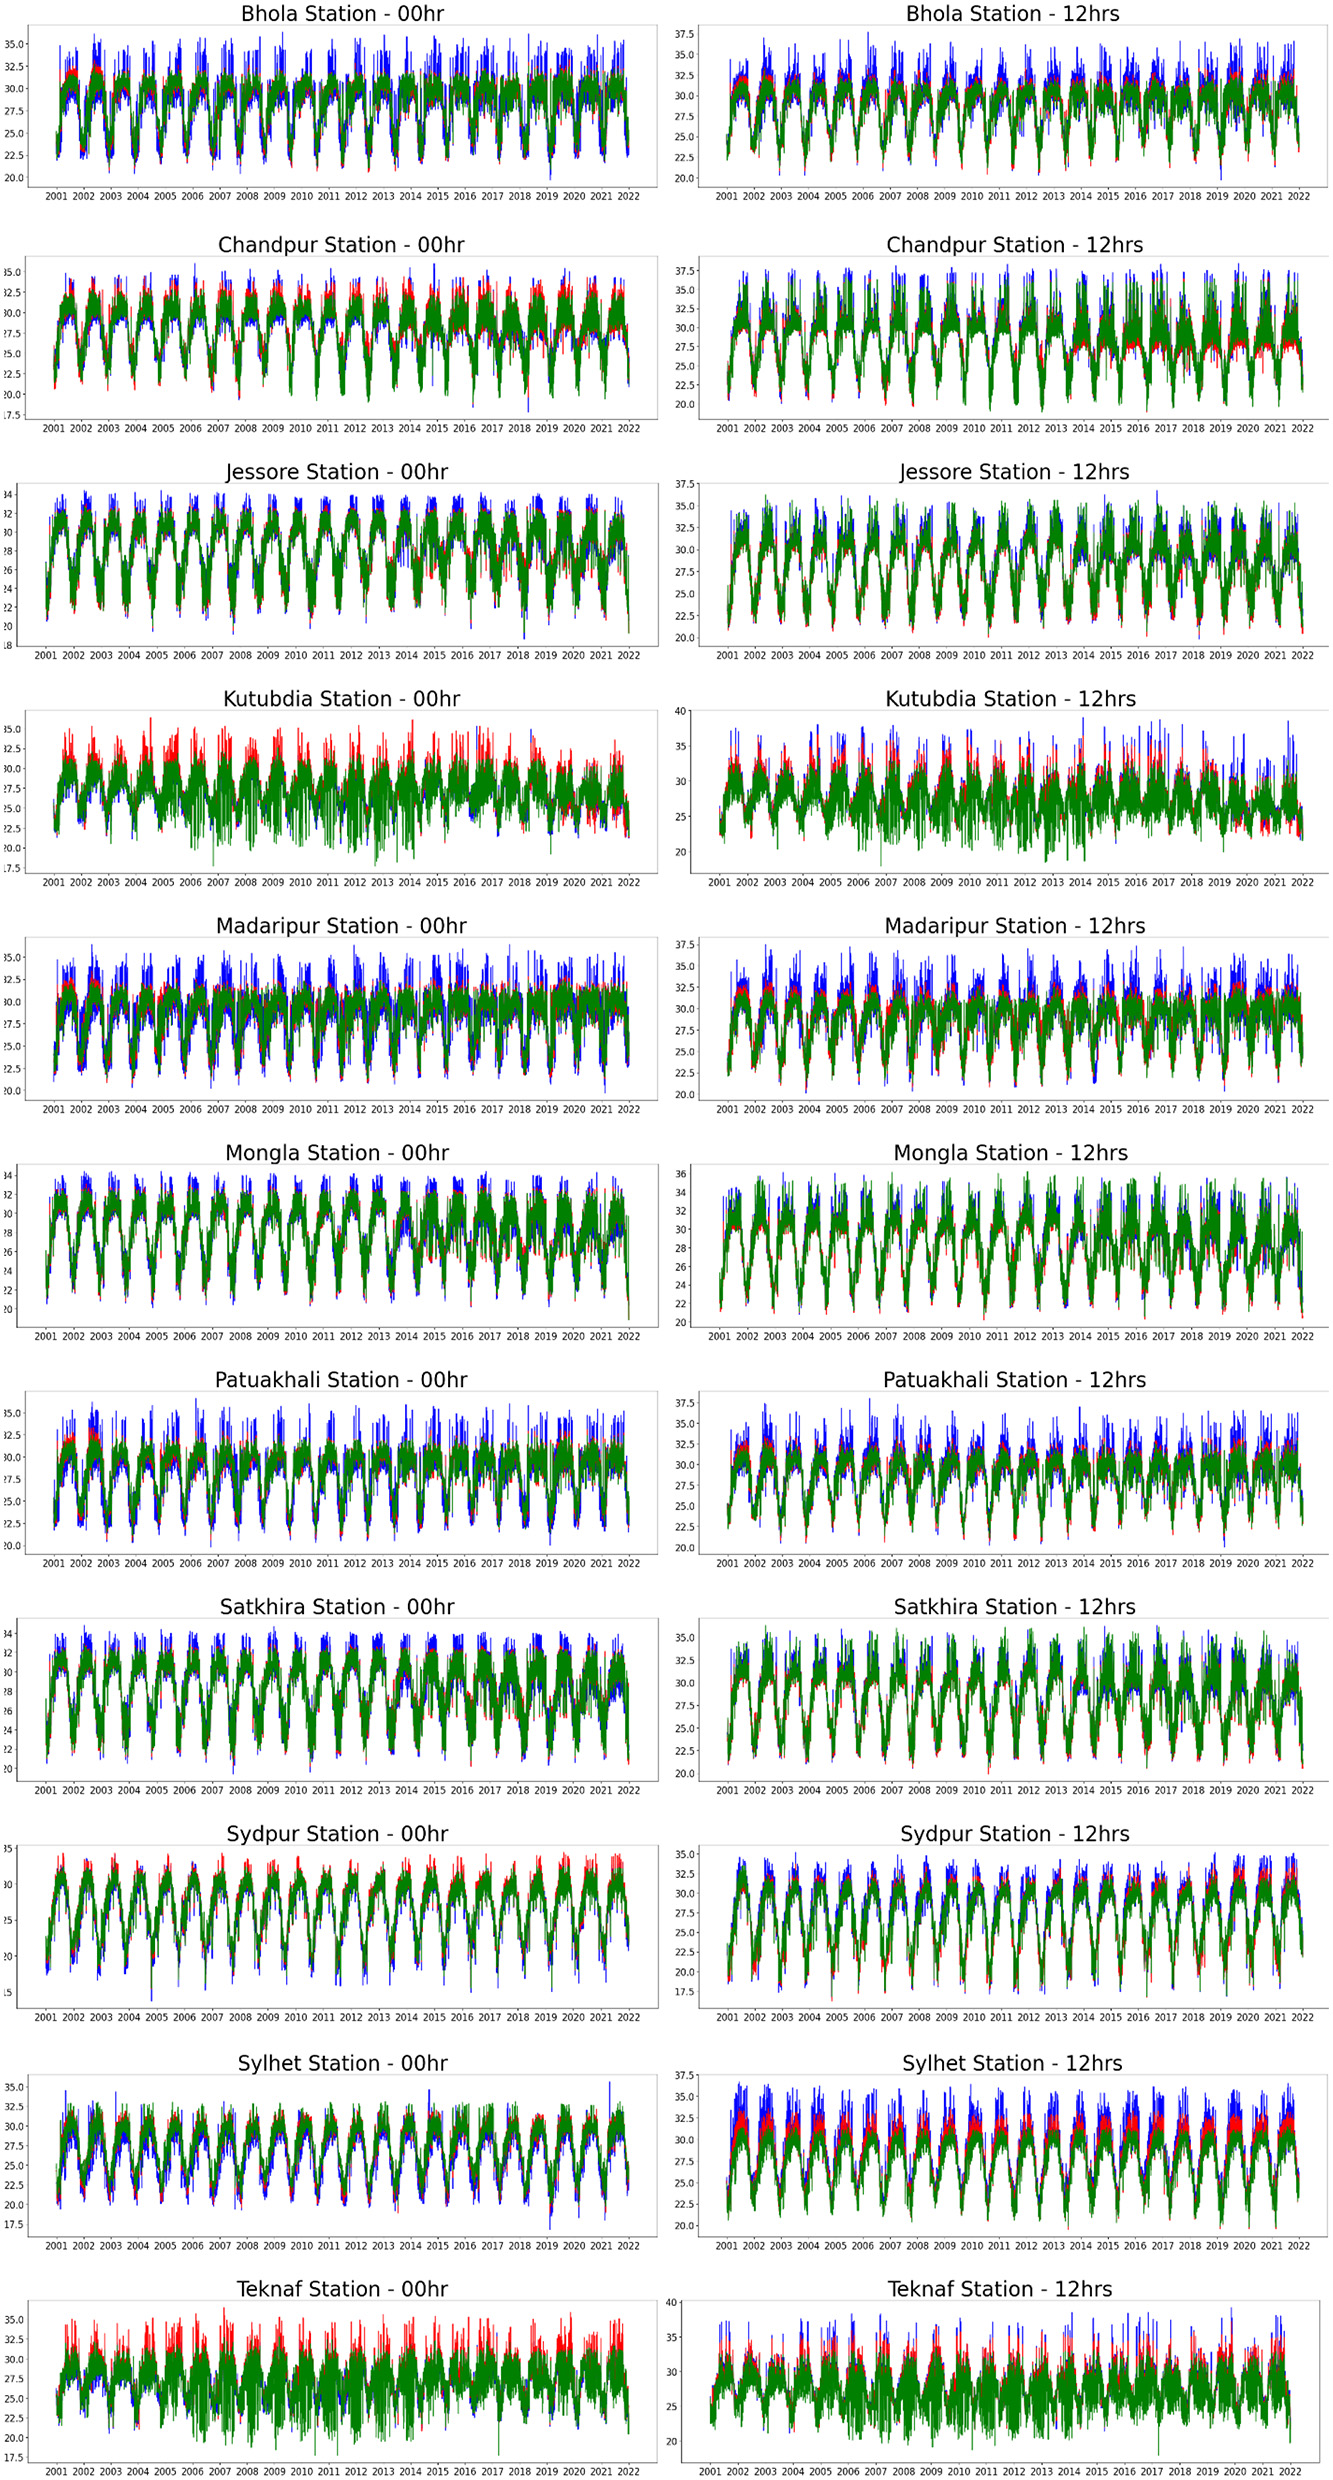
Variations in average soil temperature at depths of 10 cm (blue), 30 cm (red), and 50 cm (green).
3 Implications
We applied ensemble learning techniques to establish a daily soil temperature dataset at depths of 10 cm, 30 cm, and 50 cm across all 34 meteorological stations in Bangladesh. Our dataset showed high accuracy, with the Pearson correlation coefficient (R) between the observed and forecasted soil temperatures exceeding 0.96. The use of our soil temperature datasets allows for a holistic understanding of soil temperature evolution patterns across different regions of Bangladesh. These insights will be crucial for addressing challenges related to forest conservation and climate resilience, making the dataset valuable for research and informed decision-making in Bangladesh.
Statements
Data availability statement
The datasets presented in this study can be found in online repositories. The names of the repository/repositories and accession number(s) can be found below: https://github.com/Lipon-20055/.
Author contributions
LCD: Software, Investigation, Data curation, Writing – original draft, Resources. ZZ: Writing – original draft, Writing – review & editing, Formal analysis, Methodology, Conceptualization. MJCC: Formal analysis, Writing – review & editing. MWA: Writing – review & editing, Formal analysis.
Funding
The author(s) declare that no financial support was received for the research and/or publication of this article.
Conflict of interest
The authors declare that the research was conducted in the absence of any commercial or financial relationships that could be construed as a potential conflict of interest.
Generative AI statement
The author(s) declare that no Gen AI was used in the creation of this manuscript.
Publisher’s note
All claims expressed in this article are solely those of the authors and do not necessarily represent those of their affiliated organizations, or those of the publisher, the editors and the reviewers. Any product that may be evaluated in this article, or claim that may be made by its manufacturer, is not guaranteed or endorsed by the publisher.
Supplementary material
The Supplementary Material for this article can be found online at: https://www.frontiersin.org/articles/10.3389/ffgc.2025.1615261/full#supplementary-material
References
1
Allison S. Wallenstein M. Bradford M. (2010). Soil-carbon response to warming dependent on microbial physiology. Nat. Geosci.3, 336–340. 10.1038/ngeo846
2
Brammer H. (2014). Bangladesh's dynamic coastal regions and sea-level rise. Clim. Risk Manag.1, 51–6210.1016/j.crm.2013.10.001
3
Dirmeyer P. A. Gao X. Zhao M. Guo Z. Oki T. Hanasaki N. (2006). GSWP-2: Multimodel analysis and implications for our perception of the land surface. Bull. Am. Meteorol. Soc.87, 1381–1398. 10.1175/BAMS-87-10-1381
4
Hood R. C. (2001). The effect of soil temperature and moisture on organic matter decomposition and plant growth. Isotopes Environ. Health Stud.37, 25–41. 10.1080/10256010108033279
5
Hu G. Lin Z. Wu X. Ren L. Wu T Xie C. et al . (2016). An analytical model for estimating soil temperature profiles on the Qinghai-Tibet plateau of China. J. Arid Land8, 232–240. 10.1007/s40333-015-0058-4
6
Li H. Wu Y. Liu S Xiao W. Zhao W. Chen J. et al . (2022). Decipher soil organic carbon dynamics and driving forces across China using machine learning. Global Change Biol.28, 3394–3410. 10.1111/gcb.16154
7
Paul K. I. Polglase P. J. Smethurst P. J. O'Connell A. M. Carlyle C. J. Khanna P. K. (2004). Soil temperature under forests: a simple model for predicting soil temperature under a range of forest types. Agric. Forest Meteorol.121, 167–182. 10.1016/j.agrformet.2003.08.030
8
Rahman M. A. Rahman M. S. (2018). Impacts of climate change on crop production in bangladesh: a review. J. Agric. Crops5, 6–14. 10.5281/zenodo.4296562
9
Sattari M. T. Avram A. Apaydin H. Matei O. (2020). Soil temperature estimation with meteorological parameters by using tree-based hybrid data mining models. Mathematics8:1407. 10.3390/math8091407
10
Schimel D. Pavlick R. Fisher J. B. Asner G. P. Saatchi S. Townsend P. et al . (2014). Observing terrestrial ecosystems and the carbon cycle from space. Glob. Chang. Biol.13, 2418–2434. 10.1111/gcb.12822
11
Sun H. Gui D. Yan B. Liu Y. Liao W. Zhu Y. et al . (2016). Assessing the potential of random forest method for estimating solar radiation using air pollution index. Energy Conv. Manage.119, 121–129. 10.1016/j.enconman.2016.04.051
12
Wu Y. Zhang Z. Crabbe M. J. C. Das L. C. (2022). Statistical learning-based spatial downscaling models for precipitation distribution. Adv. Meteorol.2022:3140872. 10.1155/2022/3140872
13
Yan Y. Yan R. Chen J. Xin X. et al . (2018). Grazing modulates soil temperature and moisture in a Eurasian steppe. Agric. Forest Meteorol.262, 157–165. 10.1016/j.agrformet.2018.07.011
Summary
Keywords
forest soil, soil temperature, varying depth, climate change, Bangladesh
Citation
Das LC, Zhang Z, Crabbe MJC and Alam MW (2025) Daily soil temperatures at varying depths in Bangladesh during 2001–2022. Front. For. Glob. Change 8:1615261. doi: 10.3389/ffgc.2025.1615261
Received
21 April 2025
Accepted
16 May 2025
Published
03 June 2025
Volume
8 - 2025
Edited by
Ziliang Zhang, Northwestern Polytechnical University, China
Reviewed by
Yuanshuang Yuan, Guizhou Minzu University, China
Huiwen Li, Northwestern Polytechnical University, China
Updates
Copyright
© 2025 Das, Zhang, Crabbe and Alam.
This is an open-access article distributed under the terms of the Creative Commons Attribution License (CC BY). The use, distribution or reproduction in other forums is permitted, provided the original author(s) and the copyright owner(s) are credited and that the original publication in this journal is cited, in accordance with accepted academic practice. No use, distribution or reproduction is permitted which does not comply with these terms.
*Correspondence: Zhihua Zhang zhangzhihua@sdu.edu.cn
Disclaimer
All claims expressed in this article are solely those of the authors and do not necessarily represent those of their affiliated organizations, or those of the publisher, the editors and the reviewers. Any product that may be evaluated in this article or claim that may be made by its manufacturer is not guaranteed or endorsed by the publisher.