Abstract
Forests play a crucial role in maintaining the ecological balance of the Earth. While existing publicly available datasets typically offer high accuracy in identifying large-scale forest concentrations, discrepancies arise in forest extraction within smaller regions. This variation complicates the selection of appropriate forest cover datasets for specific areas. This study focuses on the southern and northern regions of China, represented by Hunan Province and Heilongjiang Province, respectively. It systematically evaluates the performance of eight forest cover datasets from 2020 in terms of forest area estimation, spatial consistency, and classification accuracy. Through confusion analysis of classification in low-consistency areas, the study identifies the confusion patterns between forests and other land cover types in different regions. Additionally, the study explores the causes of discrepancies between datasets by considering topographic factors and human activities. The results show that the CRLC 2020 outperforms others in terms of both area estimation and classification accuracy, achieving classification accuracies of 90.88% in Hunan Province and 91.69% in Heilongjiang Province. High-consistency areas (levels 6–8) in Hunan account for 69.4%, lower than Heilongjiang’s 77%. This comprehensive analysis provides valuable insights for forestry practitioners in selecting appropriate forest cover datasets in areas with complex land cover, offering reliable recommendations for forest cover mapping and the formulation of sound mapping strategies.
1 Introduction
Forests, as a key component of terrestrial ecosystems, provide vital services such as biodiversity habitats, carbon storage, soil protection, and water conservation (Oldekop et al., 2020; Sudmeier-Rieux et al., 2021). Their role is critical for climate regulation, ecological balance, and sustainable human development (Keenan et al., 2015). Forest cover area is a core input for biomass estimation and achieving the goals of “carbon peak” and “carbon neutrality.” Currently, deforestation and forest degradation driven by human activities continue to result in significant declines in forest cover and the loss of biodiversity (Fagan et al., 2022; Jiang et al., 2022). Real-time forest cover monitoring allows for the accurate acquisition of forest distribution information, facilitating sustainable forest resource management. In recent years, significant advancements have been made in forest monitoring techniques. Due to cost and timeliness considerations, remote sensing technologies have been widely employed in forest surveys and monitoring, significantly enhancing the efficiency of forest mapping (Reiner et al., 2023; Liu Y. et al., 2024; Ma et al., 2023). Many official agencies, universities, research institutes, and relevant companies provide a wealth of land cover datasets and forest-specific datasets (Liang and Gamarra, 2020). These datasets have offered high precision reports, and have better accessibility and timeliness than national forest survey data, and have played an important role in large-scale forest survey applications and research (Potapov et al., 2011).
However, these datasets often adopt varying definitions of forests, rely on different remote sensing data sources, and employ diverse classification algorithms, inevitably leading to inconsistencies (Wang et al., 2023; Li et al., 2024; Pitkänen et al., 2024). The study of inconsistencies in forest cover datasets is of significant importance for improving the accuracy of forest dynamic monitoring. It enables more effective identification and response to threats such as illegal logging and forest fires, thereby reducing forest resource losses (Blickensdörfer et al., 2024; Cheng et al., 2024). Furthermore, the carbon sequestration capacity of forest ecosystems largely depends on the accurate assessment of forest cover area. Consistent forest cover datasets provide reliable data support for evaluating forest carbon sink potential and scientifically planning afforestation activities, while also promoting the coordinated implementation of regional forestry policies. This contributes to the achievement of sustainable forest management and global climate goals (Nesha et al., 2021; Estoque et al., 2022). At present, several scholars have conducted studies on the consistency and accuracy of datasets in different regions (Kang et al., 2020). Cui et al. (2023) conducted a study in Northeast China using high-resolution imagery for visual interpretation to collect sample points for accuracy and consistency assessments of the cropland cate-gory across multiple land cover datasets. The results showed that the 2020 CLCD exhibited the highest classification accuracy for cropland in the region, while the 100 m resolution dataset performed the worst. Liu S. et al. (2023) studied the consistency and accuracy of five land cover datasets across eight land cover types in the arid region of Xinjiang, China. Their results indicated that GlobaLand30 had the highest overall accuracy in the study area, with inconsistencies primarily occurring in areas with non-homogeneous landscapes. Zhao et al. (2023) employed stratified random sampling to collect sample points for accuracy and consistency analysis of multiple land cover types across six land cover datasets on both global and regional scales. Their findings revealed that ESA WorldCover had the highest overall accuracy, and as landscape heterogeneity increase, the mapping accuracy of global land cover products decreased to varying ex-tents. Peng et al. (2023) assessed the spatial consistency and accuracy of six forest cover datasets across China. They designed a progressive stratified random sampling scheme for selecting samples and found that ESA WorldCover 10 had the highest accuracy in China. Additionally, datasets with a 10 m resolution generally outperformed those with a 30 m resolution in terms of classification accuracy. Yang et al. (2017) evaluated eight moderate-resolution (30–50 m) forest cover datasets and found that GlobeLand30 exhibited the highest overall accuracy in the ecologically fragile Loess Plateau region of China. They also noted that terrain attributes, such as elevation and slope, should be considered in forest mapping. Xing et al. (2021) analyzed the inconsistency of eight forest cover datasets in Myanmar, considering climatic factors. Their results showed that GlobalLand30 had the highest forest inversion accuracy in Myanmar, even outperforming 10 m resolution products. However, these studies either focus on the overall classification accuracy evaluation of multiple classification categories or on the accuracy evaluation of specific land cover categories, or they focus on the regional accuracy assessment of the forest category. There is a lack of comparative analysis and discussion on the differences in forest category recognition between datasets across different regions, especially the contribution of low consistency levels and the detailed comparison of misclassified categories in low-consistency areas for each dataset in southern and northern China.
To investigate the consistency differences among various forest cover datasets across southern and northern China, the spatial distribution of classification confusion, and the potential influence mechanisms of production environments and geographic factors on dataset consistency, this study conducted a systematic evaluation and analysis of multiple medium-resolution forest cover datasets in representative regions. Hunan Province and Heilongjiang Province were selected as typical study areas for the south and north zones, respectively. Auxiliary data such as topographic factors and population distribution were incorporated, and eight widely used and publicly available forest cover datasets were integrated for comparative analysis, including Global 30 m Spatial Distribution of Forest Cover 2020 (GFC30 2020) (Zhang et al., 2020), Global PALSAR-2 Forest/Non-Forest map 2020 (JAXA FNF 2020) (Shimada et al., 2014), ESA WorldCover 10 m 2020 (ESA 2020) (Zanaga et al., 2021), ESRI 2020 Land Cover (ESRI 2020) (Karra et al., 2021), Cross-Resolution Land-Cover mapping 2020 (CRLC 2020) (Liu Y. et al., 2023), China 30 m Annual Land Cover Dataset 2020 (CLCD 2020) (Yang and Huang, 2021), Global Land Cover Mapping at 30 m resolution 2020 (GlobaLand30 2020) (Jun et al., 2014; Chen et al., 2015), and the Land-Cover Classification 30 m with a Fine Classification System 2020 (GLC-FCS 2020) (Zhang et al., 2019, 2021). The datasets were compared in terms of area estimation, spatial consistency, and classification accuracy. In addition, low-consistency areas were specifically examined to identify confusion patterns between forest and non-forest land cover types. The effects of terrain complexity and anthropogenic disturbance on classification consistency were further analyzed. Results reveal significant regional discrepancies among datasets, with lower consistency observed in areas characterized by flat terrain or intensive human activity. Datasets with finer spatial resolution generally demonstrated superior forest recognition performance. These findings provide theoretical support and practical guidance for improving forest classification accuracy, optimizing mapping strategies, and promoting sustainable forest management.
2 Study area and datasets
2.1 Study area
This study selected Hunan Province and Heilongjiang Province as the experimental areas (the location and topography are shown in Figure 1), primarily based on the significant differences in geographical environment and ecosystem types between the two provinces, which can represent the distinct land use and forest resource characteristics of southern and northern China. Hunan Province is located in southern China, with a total area of approximately 211,800 km2. The climate is warm and humid, and the province is rich in forest resources, with a forest cover rate of 59.82% (Huang et al., 2022). The major forest types in the province include typical evergreen broad-leaved forests, coniferous forests, mixed evergreen and deciduous forests, deciduous broad-leaved forests, and mossy dwarf forests (Tang et al., 2023). Natural and planted forests are interspersed throughout the region, particularly in mountainous and hilly areas. The forestry resources play a crucial role in both the province’s economy and its ecosystems. However, with the expansion of agriculture and the acceleration of urbanization, issues such as forest fragmentation and degradation have become increasingly prominent (Shen et al., 2022; Zhang et al., 2023). Heilongjiang Province, located in the northeastern part of China, has a total area of approximately 454,000 km2 and belongs to the frigid temperate zone, with a cold climate. The forest cover rate is 43.78% (Zhang Q. et al., 2024). The forest resources in Heilongjiang are primarily composed of frigid temperate coniferous forests and temperate mixed forests, with key species including Larix gmelinii and Picea jezoensis. As an important timber production base in China, the forestry resources of Heilongjiang make a significant contribution to the national economy, though the province also faces challenges such as forest degradation and illegal logging (Chang et al., 2016; Venter et al., 2022).
Figure 1

Location and topography of the study area. (a) Heilongjiang Province, (b) Hunan Province.
Hunan Province and Heilongjiang Province are both significant agricultural regions in China, characterized by complex land cover types and frequent human activities, with notable forest disturbance and recovery phenomena. In terms of landscape patterns, forests in Heilongjiang are primarily concentrated in mountainous areas with gentle terrain relief, exhibiting strong landscape continuity and clear boundaries between forests and agricultural lands. Although Hunan is also dominated by mountainous forests, its forest fragmentation is higher due to fragmented topography and human disturbances, featuring numerous small forest patches with complex and widely distributed forest edges. Morphological Spatial Pattern Analysis (MSPA) (Wu et al., 2025) based on the CRLC 2020 forest mask data (Tables 1, 2) shows that the proportion of Core areas in Heilongjiang is significantly greater than in Hunan, indicating stronger overall forest landscape connectivity. Conversely, Hunan exhibits higher proportions of Edge and Bridge areas than Heilongjiang, further confirming that its forests are more fragmented and have more complex edge structures, as illustrated in Figure 2. The two provinces represent contrasting forest–non-forest coupling patterns: Heilongjiang exemplifies a contiguous and aggregated landscape structure, while Hunan reflects a fragmented and dispersed pattern, making them suitable as comparative reference areas for accuracy difference analyses. A deeper exploration of their classification confusion characteristics not only contributes to improving forest monitoring accuracy but also provides representative cases for forest monitoring, management, and ecological restoration in globally similar ecological zones.
Table 1
| Type | Implications of MSPA type |
|---|---|
| Core | Interior area excluding perimeter. |
| Islet | Disjoint and too small to contain Core. |
| Perforation | Internal object perimeter. |
| Edge | External object perimeter. |
| Loop | Connected to the same Core area. |
| Bridge | Connected to different Core areas |
| Branch | Connected at one end to Edge, Perforation, Bridge, or Loop. |
MSPA types and implications.
Table 2
| MSPA type | Proportion of each MSPA type | |
|---|---|---|
| Hunan | Heilongjiang | |
| Core | 0.68 | 0.77 |
| Islet | 0.03 | 0.05 |
| Perforation | 0.05 | 0.05 |
| Edge | 0.11 | 0.06 |
| Loop | 0.02 | 0.02 |
| Bridge | 0.06 | 0.02 |
| Branch | 0.04 | 0.03 |
Area proportion of each MSPA type.
Figure 2

Forest landscape types of Hunan province and Heilongjiang province. (a) Heilongjiang Province, (b) Heilongjiang Province.
2.2 Forest cover datasets
This study collected eight publicly available medium-resolution (10–30 m) forest cover datasets, including two forest-specific datasets and six land cover datasets. These datasets were developed by well-established universities, research institutions, or major companies, and are widely accessible via platforms such as Google Earth Engine (GEE) and GitHub. The basic information of these datasets is shown in Table 3, with the details provided as follows:
Table 3
| Dataset | Resolution | Satellite | Algorithm | Coverage | Provider |
|---|---|---|---|---|---|
| GFC30 2020 | 30 m | Landsat series GF-1 GF-6 |
Machine learning | Global | Chinese Academy of Sciences |
| JAXA FNF 2020 | 25 m | ALOS-2 | Machine learning | Global | Japan Aerospace Exploration Agency |
| ESA 2020 | 10 m | Sentinel-1 Sentinel-2 |
Supervised classification | Global | European Space Agency |
| ESRI 2020 | 10 m | Sentinel-2 | Deep learning | Global | Environmental Systems Research Institute |
| CRLC 2020 | 10 m | Sentinel-2 | Cross-resolution land-cover mapping framework based on noisy label learning | China | Wuhan University |
| CLCD 2020 | 30 m | Landsat series | Random forest | China | Wuhan University |
| GlobaLand30 2020 | 30 m | Landsat series HJ-1 |
Pixel-and object-based methods with knowledge | Global | National Geomatics Center of China |
| GLC-FCS 2020 | 30 m | Landsat series | Supervised classification | Global | Chinese Academy of Sciences |
The basic information of the datasets used in this study.
2.2.1 GFC30 2020
The GFC30 2020 is a global forest coverage map generated using machine learning algorithms applied to images from Landsat series satellites, GF-1, and GF-6, with a resolution of 30 m (Zhang et al., 2020). By integrating high-resolution imagery and field survey data, 39,900 validation points were selected globally for accuracy assessment. The results indicate that the overall accuracy exceeds 85%. This dataset uses the forest definition provided by the Food and Agriculture Organization of the United Nations (FAO), which specifies that forests are areas larger than 0.5 hectares, with tree heights exceeding 5 m and canopy cover greater than 10%.
2.2.2 JAXA FNF 2020
The JAXA FNF 2020 produced by the Japan Aerospace Exploration Agency (JAXA), is based on the L-band synthetic aperture radar (PALSAR-2) aboard JAXA’s Advanced Land Observing Satellite-2 (ALOS-2) (Shimada et al., 2014). Using machine learning algorithms, the dataset has a resolution of 25 m. The forest definition used is also in accordance with the FAO.
2.2.3 ESA 2020
ESA 2020 is a land cover dataset created by the European Space Agency (ESA) using supervised classification based on Sentinel-1 and Sentinel-2 data, with a resolution of 10 m (Zanaga et al., 2021). In this dataset, forest cover is defined as areas with tree canopy cover of 10% or more, and it includes shrubs below the canopy, buildings, permanent water bodies, plantations (such as oil palm and olive trees), and areas with seasonal or permanent freshwater inundation of tree cover, excluding mangroves. The dataset’s accuracy and spatial uncertainty were assessed using over 200,000 reference points, with an overall accuracy determined to be 74.4%.
2.2.4 ESRI 2020
The ESRI 2020 land cover dataset was developed by ESRI using Sentinel-2 imagery and a deep learning-based approach, with an overall accuracy of 85% (Karra et al., 2021). In this dataset, forests are defined as dense vegetation areas with trees taller than 15 m, typically characterized by closed or dense canopies. This includes tall or dense vegetation in grasslands, plantations, wetlands, and mangroves.
2.2.5 CRLC 2020
CRLC 2020 is a national 10 m resolution land cover mapping dataset, produced by Wuhan University, based on the Cross-Resolution Land Cover (CRLC) framework, which utilizes sample noise learning (Liu Y. et al., 2023). The dataset was generated using a deep semantic segmentation method. Its land cover classification system references the definitions of GlobeLand30, and the selection of training samples also relies on the GlobeLand30 dataset. Accordingly, the forest is defined as land covered by trees with vegetation coverage exceeding 30%, including deciduous forests, coniferous forests, as well as sparse woodland with coverage between 10 and 30%.
2.2.6 CLCD 2020
The China 30 m Annual Land Cover Dataset (CLCD) was developed by Wuhan University, using Landsat series satellite data (Yang and Huang, 2021). The dataset was generated using a combination of random forest classification, spatiotemporal filtering, and logical post-processing. Its quality was evaluated by integrating third-party land cover products with visual interpretation, resulting in an overall classification accuracy of 79.31%. According to its original publication, the dataset adopts a land cover classification system that is similar to that of FROM_GLC (Gong et al., 2013), which defines forest as areas where tree height exceeds 3 meters and tree cover is greater than 15%. Based on this, it can be concluded that the forest definitions used in the two datasets are largely consistent.
2.2.7 GlobaLand30 2020
The GlobeLand30 2020 developed by National Geomatics Center of China, uses a Pixel- and Object-based Knowledge (POK) mapping methodology (Jun et al., 2014; Chen et al., 2015). It was de-rived from over 20,000 Landsat and HJ-1 satellite images, with a resolution of 30 m. The dataset boasts an overall classification accuracy of over 80%. In this dataset, forests are defined as areas with tree cover where the canopy density exceeds 30%, including broadleaf forests (deciduous and evergreen), coniferous forests (deciduous and ever-green), mixed forests, and sparse forests with a canopy cover of 10–30%.
2.2.8 GLC-FCS 2020
The GLC-FCS30 2020 dataset developed by Chinese Academy of Sciences, this is the world’s first 30 m resolution fine land cover classification product at a global scale (Zhang et al., 2019, 2021). The dataset integrates methods for detecting continuous changes in dense time-series Landsat imagery, a locally adaptive update model, and spatiotemporal optimization algorithms. Forests in the dataset are classified into open and closed types based on canopy cover, using a 40% threshold to distinguish between them. Specifically, the classification includes evergreen and deciduous broadleaved forests (Classes 51–52, 61–62), evergreen and deciduous needle-leaved forests (Classes 71–72, 81–82), and mixed forests composed of both broadleaved and needle-leaved species (Classes 91–92). Open forests are defined as those with canopy cover between 15 and 40%, while closed forests have canopy cover greater than 40%.
2.3 Auxiliary data
2.3.1 Accuracy validation data
In this study, a stratified random sampling method was used to select samples within the study area, dividing the area into forest and non-forest strata (Liu B. et al., 2023). To ensure that the minimum sample size for accuracy validation was met, the minimum sample size for the stratified random sampling was first determined using Equation (1), based on the proportion of forest and non-forest coverage area (Olofsson et al., 2014).
In the formula, N represents the number of pixels in the study area, denotes the standard error of the expected estimate accuracy, indicates the percentage of the area occupied by the i-th class, and is the standard deviation of the i-th stratum. The standard deviation can be expressed as (Stehman, 2012). When N is sufficiently large, the equation can be approximated using the right side, where represents user accuracy. We set the standard error of the expected overall accuracy for both provinces to 0.01. For Hunan Province, the reference proportion of forest area is 60% (Huang et al., 2022), while the proportion of non-forest area is 40%. For Heilongjiang Province, the reference proportion of forest area is 44% (Zhang Q. et al., 2024), and the proportion of non-forest area is 56%. Using the forest user accuracy reported in the accuracy assessment of ESA WorldCover as a reference (Zanaga et al., 2021), the forest user accuracy for both provinces was set to 80%, which was used to calculate . Similarly, based on the non-forest user accuracy reported in the accuracy assessment of JAXA FNF (Shimada et al., 2014), the non-forest user accuracy for both provinces was set to 87%, which was used to calculate . As a result, the minimum sample size for Hunan Province was determined to be 1,402, with 841 samples allocated to forest and 561 to non-forest, based on the area proportion. For Heilongjiang Province, the minimum sample size was determined to be 1,326, with 583 samples for forest and 743 for non-forest.
We utilized high-resolution real-time and historical remote sensing imagery provided by Google Earth, along with geotagged field photos available on the platform, to select samples through visual interpretation by overlaying the consistency distribution map. For areas where it was challenging to definitively distinguish between forest and non-forest regions, we supplemented the sampling process with data from the National Forest and Grassland Resource Smart Management Platform. Subsequently, a 100 × 100 m buffer was created around each sample obtained in this process for inspection. Within each buffer, samples with evident mislabeling or unreasonable distribution were removed. This inspection was repeated twice to improve sample quality and reduce excessive clustering of most samples, while still preserving the uneven spacing characteristic of random samples. Finally, 1,462 forest samples and 1,598 non-forest samples were obtained for Hunan Province, while 2,322 forest samples and 2,477 non-forest samples were collected for Heilongjiang Province. These sample sizes far exceeded the minimum required for the study. The distribution of the sample points is shown in Figure 3.
Figure 3

Sample distribution. (a) Sample distribution in Hunan Province, (b) sample distribution in Heilongjiang Province.
2.3.2 Other data
To further investigate the factors influencing the consistency of forest cover datasets, this study utilized DEM data and population distribution data, focusing on topographic factors and human activities for analysis and discussion.
2.3.2.1 DEM data
The DEM data used in this study is the SRTM v3 provided by NASA and the National Geospatial-Intelligence Agency (NGA) with a resolution of 1 arc-second (~30 m) and vertical accuracy better than 10 m (relative) (Farr and Kobrick, 2000; Rabus et al., 2003). Slope information was derived based on this DEM.
2.3.2.2 Population data
The population distribution data comes from the GlobPOP (Global gridded population) product provided by the team led by Cao at Beijing Normal University (Liu L. et al., 2024). This product uses clustering analysis and statistical learning methods, combining five existing datasets (GHS-POP, GRUMP, GPWv4, LandScan, and WorldPop) to generate a continuous global gridded population dataset.
3 Method
3.1 Data preprocessing
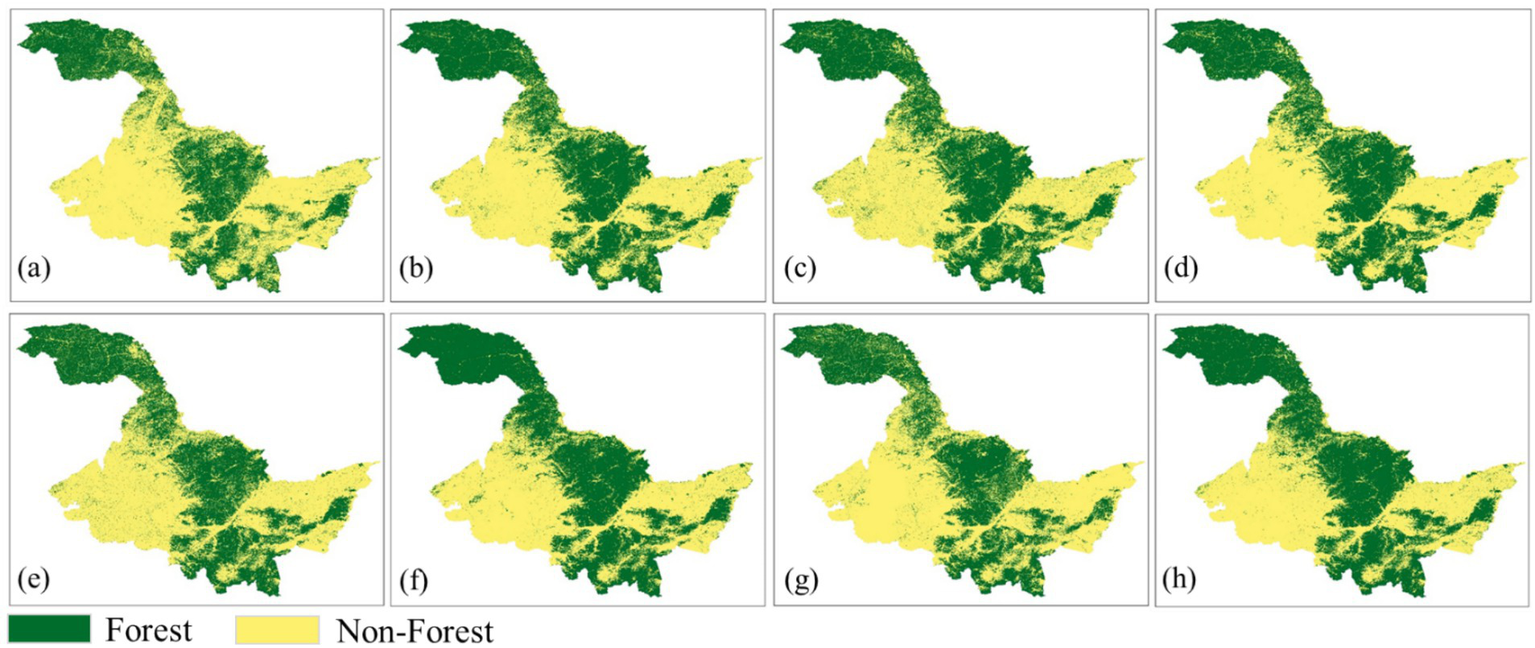
Due to significant differences in the definitions of forest types across datasets, as well as variations in spatial resolution and classification systems (Chazdon et al., 2016; Nabil et al., 2020), this study sequentially applied uniform projection coordinate systems, unified resolution, and forest cover extraction with a binary classification (forest and non-forest) to each dataset. The definitions of forest and the binary classification transformations for each dataset are summarized in Supplementary Table S1. Figures 4, 5 present the results of the FNF mapping.
Figure 4

FNF mapping results after preprocessing for eight datasets in Hunan Province. (a) GFC30 2020, (b) JAXA FNF 2020, (c) ESA 2020, (d) ESRI 2020, (e) CRLC 2020, (f) CLCD 2020, (g) GlobaLand30 2020, (h) GLC-FCS 2020.
Figure 5
FNF mapping results after preprocessing for eight datasets in Heilongjiang Province. (a) GFC30 2020, (b) JAXA FNF 2020, (c) ESA 2020, (d) ESRI 2020, (e) CRLC 2020, (f) CLCD 2020, (g) GlobaLand30 2020, (h) GLC-FCS 2020.
3.2 Spatial consistency evaluation
In this study, spatial consistency was evaluated by comparing the spatial distribution differences among different datasets, with pixels serving as the basic unit of analysis (Chazdon et al., 2016; Wang et al., 2022). This method operates similarly to a voting mechanism, where if a pixel is classified as forest by multiple datasets, it is assigned a higher “vote” score, indicating a higher level of spatial consistency (Fang et al., 2020). As described in Section 3.1, the forest thematic maps generated after preprocessing assign a value of 1 to forest areas and 0 to non-forest areas. Subsequently, a spatial overlay analysis was performed on each dataset to calculate the spatial consistency of forest coverage. For example, a spatial consistency level of 8 indicates that all eight datasets classify the location as forest, signifying extremely high spatial consistency for that pixel. A value of 1 implies that only one dataset classifies the pixel as forest, reflecting low spatial consistency but not necessarily indicating that the area is non-forest. Conversely, a value of 0 represents a common non-forest area identified across all eight datasets. Spatial overlay is shown in Figure 6.
Figure 6
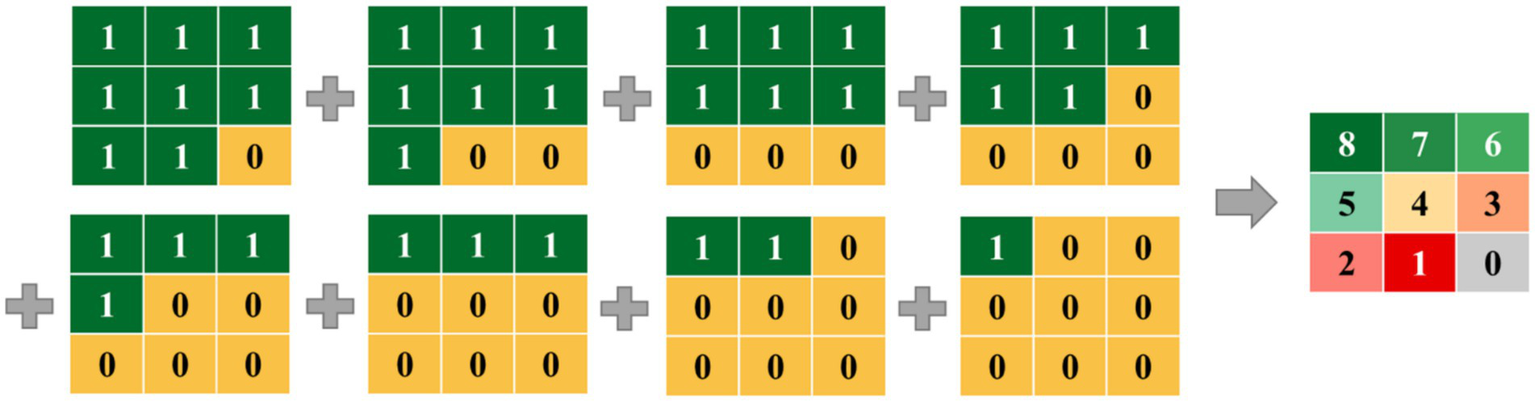
Illustration of a spatial overlay used to study spatial consistency between different datasets.
3.3 Accuracy assessment
The confusion matrix quantitatively describes the confusion between different land cover types and is widely regarded as one of the best methods for evaluating the accuracy of land cover maps (Shi et al., 2023; Wang et al., 2024). The composition of its elements is illustrated in Figure 7. In this study, we constructed confusion matrices based on the obtained sample data, and used the Kappa coefficient (Kappa), overall accuracy (OA), producer accuracy (PA), and user accuracy (UA) as the key metrics for accuracy assessment. The formulas for these metrics are shown in Equations (2–5):
Figure 7
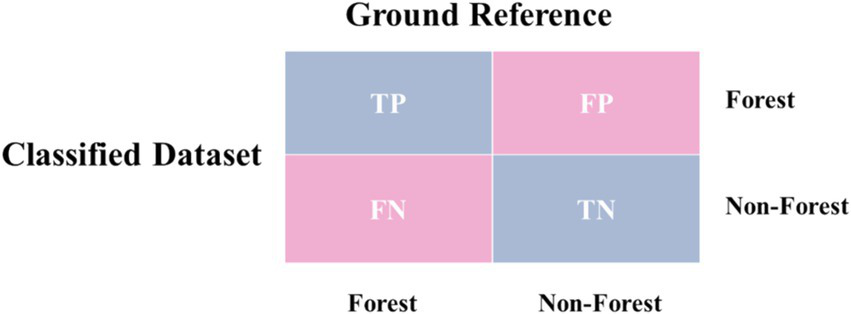
The illustration of the composition of confusion matrix elements.
Where P0 refers to the proportion of correctly classified samples, in which the dataset’s forest and non-forest labels match the reference data, relative to the total number of samples. Pe refers to the probability that the classification results of the dataset coincide with the true samples by chance. True positive (TP) and true negative (TN) refer to points where both the samples and the dataset agree on classifying the location as forest or non-forest. False positive (FP) indicates points where the dataset classifies a location as forest but the sample labels it as non-forest, while false negative (FN) refers to the opposite case.
3.4 Analysis of topographic influencing factors on consistency
This study utilized the SRTM v3 Digital Elevation Model (DEM) to incorporate topographic variables into the analysis of factors affecting the consistency among forest cover datasets. Elevation was extracted from the DEM and categorized into four classes based on common landscape morphology: plains (<200 m), hills (200–500 m), low mountains (500–1,000 m), and medium-to-high mountains (>1,000 m). Slope was derived from the elevation data and classified according to forestry standards into flat (<5°), gentle (5–15°), moderate (15–25°), and steep or hazardous slopes (>25°). For each elevation and slope interval, the area percentage of each forest consistency level (1–8) relative to the total forest area in that interval was computed. The formula for calculating detailed percentages is shown in Equation (6):
In these formulas, represents the percentage of area occupied by consistency level j within a given elevation or slope interval. Sij(Forest) denotes the area of consistency level j in the interval, while Si(Forest) refers to the total forest area within the interval. Where j (the consistency level) ranges from 1 to 8.
This enabled an in-depth assessment of how different levels of spatial consistency are distributed across various topographic conditions, thereby revealing the relationship between terrain factors and dataset agreement. The flow chart of this study is shown in Figure 8.
Figure 8

The methodological flowchart of this study.
4 Results
4.1 Forest area statistics
By performing calculations, we statistically analyzed the forest area and its proportion for the eight datasets, as presented in Table 4. Subsequently, these datasets were compared against the forest cover rates of Hunan Province and Heilongjiang Province, as reported in the literature (Zhang Q. et al., 2024; Huang et al., 2022). It is evident that the eight datasets exhibit varying degrees of overestimation or underestimation across these two regions. In Hunan Province, the datasets CRLC 2020, CLCD 2020, and GLC-FCS 2020 show values that are relatively close to the reference data, while ESA 2020 demonstrates a noticeable overestimation. In contrast, the GFC30 2020 dataset significantly underestimates the forest area. In Heilongjiang Province, the datasets ESRI 2020, CRLC 2020, and JAXA FNF 2020 are relatively close to the reference values, while CLCD 2020 and GLC-FCS 2020 exhibit substantial overestimation, and the GFC30 2020 dataset shows significant underestimation. Overall, CRLC 2020 demonstrates the most consistent performance across both regions, while GFC30 2020 consistently underestimates the forest area. Meanwhile, CLCD 2020 and GLC-FCS 2020 are closer to the reference data in Hunan, but exhibit severe overestimation in Heilongjiang. These findings suggest that forest area estimation varies across different datasets and regions, displaying regionally unstable characteristics. Relying on a single dataset to represent forest cover is highly limiting, as discrepancies in area estimates are primarily attributed to multiple objective factors such as the remote sensing data sources, classification systems, and definitions of forest cover used by the datasets. Therefore, spatial consistency analysis across multiple datasets is essential. Moreover, area statistics solely reflect the forest area of each dataset and do not account for the classification accuracy of the datasets.
Table 4
| Datasets | Hunan Province | Heilongjiang Province | ||
|---|---|---|---|---|
| Area/km2 | Percentage/% | Area/km2 | Percentage/% | |
| GFC30 2020 | 106,616.6 | 50.29 | 162,454.9 | 35.87 |
| JAXA FNF 2020 | 120,149.3 | 56.67 | 206,566.4 | 45.61 |
| ESA 2020 | 142,304.5 | 67.11 | 212,991.2 | 47.03 |
| ESRI 2020 | 134,776.9 | 63.57 | 197,806.7 | 43.68 |
| CRLC 2020 | 127,514.3 | 60.14 | 193,336.6 | 42.69 |
| CLCD 2020 | 131,240.4 | 61.90 | 221,291.9 | 48.86 |
| GlobaLand30 2020 | 118,692.2 | 55.98 | 181,863.7 | 40.16 |
| GLC-FCS 2020 | 123,776.7 | 58.38 | 222,216.8 | 49.07 |
Area and percentage of forest cover in the eight datasets in the study area.
4.2 Spatial consistency evaluation results
By performing spatial consistency calculations on the eight datasets, Figures 9, 10 were generated. Figure 9 illustrates the trend of the consistent area in both regions, which initially decreases and then increases with the improvement in consistency level. Specifically, the areas with consistency levels 7 and 8 in Hunan and Heilongjiang provinces are 30,289.5 km2 and 71,272.6 km2, respectively, and 48,764.6 km2 and 125,552.1 km2, respectively, which are significantly higher than other levels. However, low consistency areas still occupy a substantial portion, with areas of consistency level 1 in Hunan and Heilongjiang provinces being 16,127.4 km2 and 21,973.7 km2, accounting for 9.7 and 8.8%, respectively. Nevertheless, overall, as the two regions with the highest consistency levels collectively account for more than 60%—nearly 70% in Heilongjiang—it can be concluded that the selected datasets exhibit good spatial consistency across the two study areas.
Figure 9
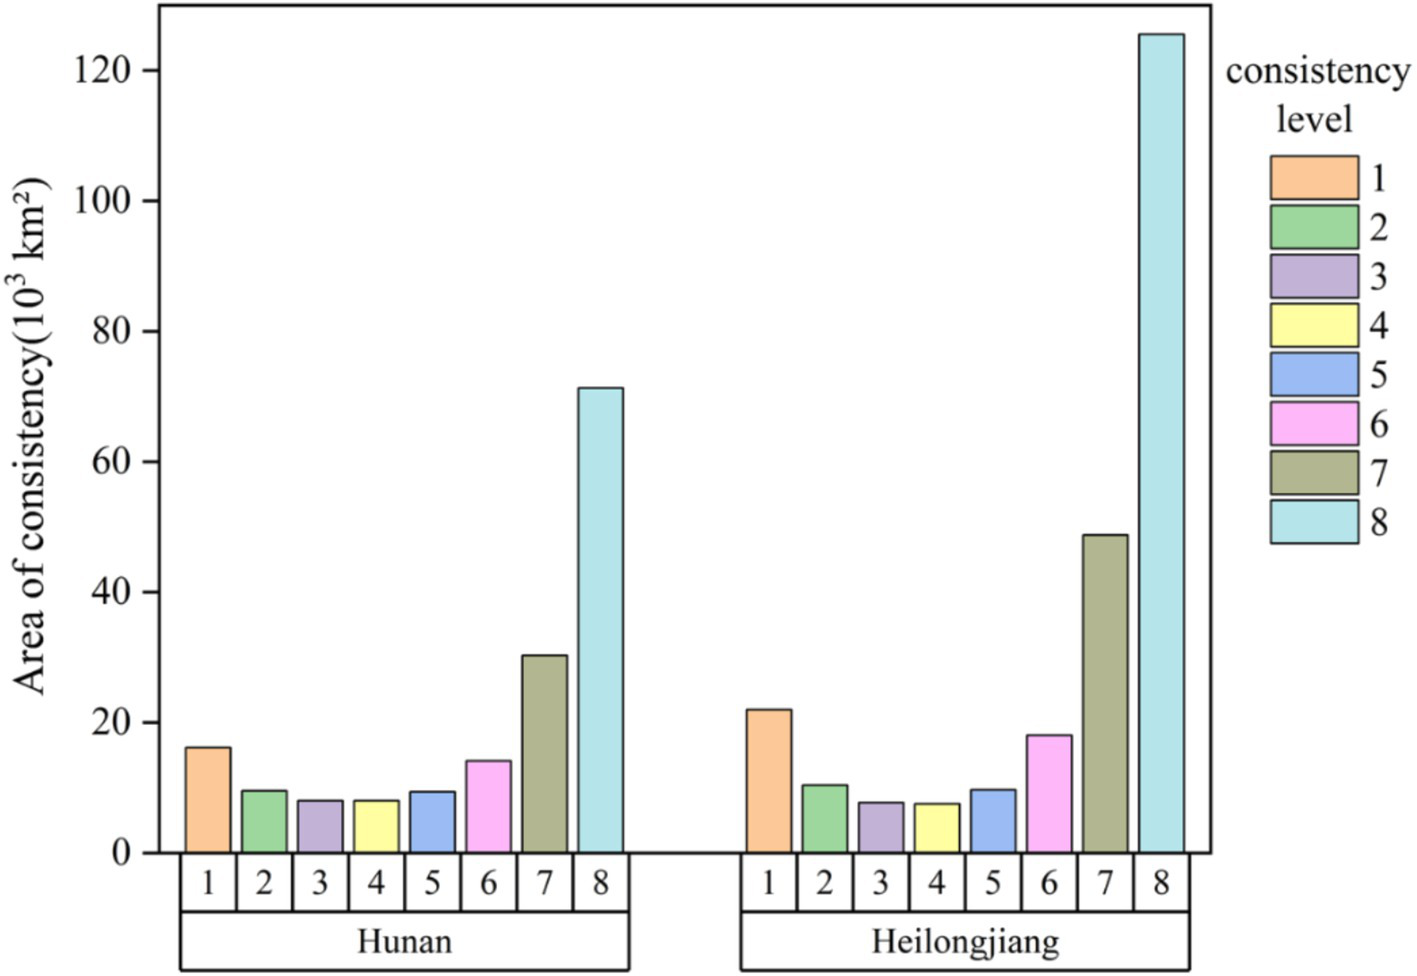
Area statistics of consistency level.
Figure 10
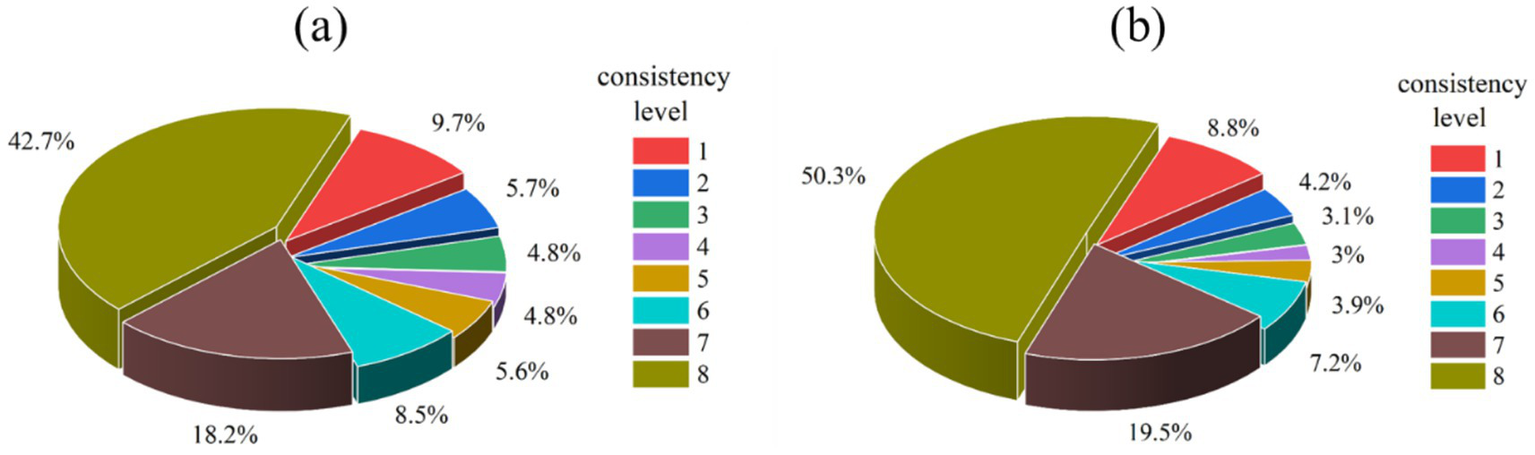
Percentage statistics of consistency level. (a) Percentage of consistency level in Hunan Province, (b) percentage of consistency level in Heilongjiang Province.
From a spatial distribution perspective, as shown in Figure 11, the consistency of the forest cover datasets is particularly high in the western, southern, and eastern regions of Hunan Province, as well as the northwestern, central, and southern regions of Heilongjiang Province. These areas share the common characteristic of concentrated forest distribution, often exhibiting contiguous patches. In contrast, the low-consistency regions are more scattered, primarily located in the northern and central parts of Hunan, as well as the central-western and eastern areas of Heilongjiang. Supplementary Figures S1, S2 illustrate the localized forest identification of each dataset and consistency distribution in Hunan Province and Heilongjiang Province.
Figure 11

Spatial consistency distribution. (a) Consistency distribution map of Hunan Province, (b) consistency distribution map of Heilongjiang Province, (c-f) consistency distribution of region (1–4), (g-j) Optical remote sensing images of region (1–4), (k-n) Consistency distribution of region (5-8), (o-r) Optical remote sensing images of region (5–8).
Further correlation statistics between the datasets are presented in Figure 12. The results show that, as the consistency level increases, the overlapping area between the datasets gradually expands, and their correlation strengthens accordingly. In Hunan Province, ESRI 2020, CRLC 2020, and CLCD 2020 all exhibit similar trends, with a higher contribution at higher consistency levels. In Heilongjiang Province, ESRI 2020 and CRLC 2020 demonstrate identical behavior. Datasets that previously exhibited overestimation of forest area, such as ESA 2020 in Hunan, consistently show a strong contribution at each consistency level, significantly higher than other datasets. This is primarily because ESA 2020 adopts a forest definition that leans more toward the concept of “trees,” which often leads to misclassification of orchards (classified as cropland) as forests in southern China. Conversely, GFC30 2020 exhibited the lowest contributions across different consistency levels in both provinces. This is because the dataset prioritizes mapping efficiency during its production process, simplifying input features for machine learning and adopting the relatively fast random forest algorithm, leading to a more conservative approach to forest identification. Therefore, differences in forest definitions, remote sensing data sources, and classification algorithms all influence the consistency contributions of various datasets. Combining this with Figure 9, it is apparent that although each dataset’s contribution to low-consistency regions is relatively small, these regions still occupy a substantial proportion. This phenomenon primarily arises from the low overlap in low consistency areas, which leads to gradual accumulation of area in numerical terms, thus keeping the area of low-consistency regions at a relatively high level.
Figure 12
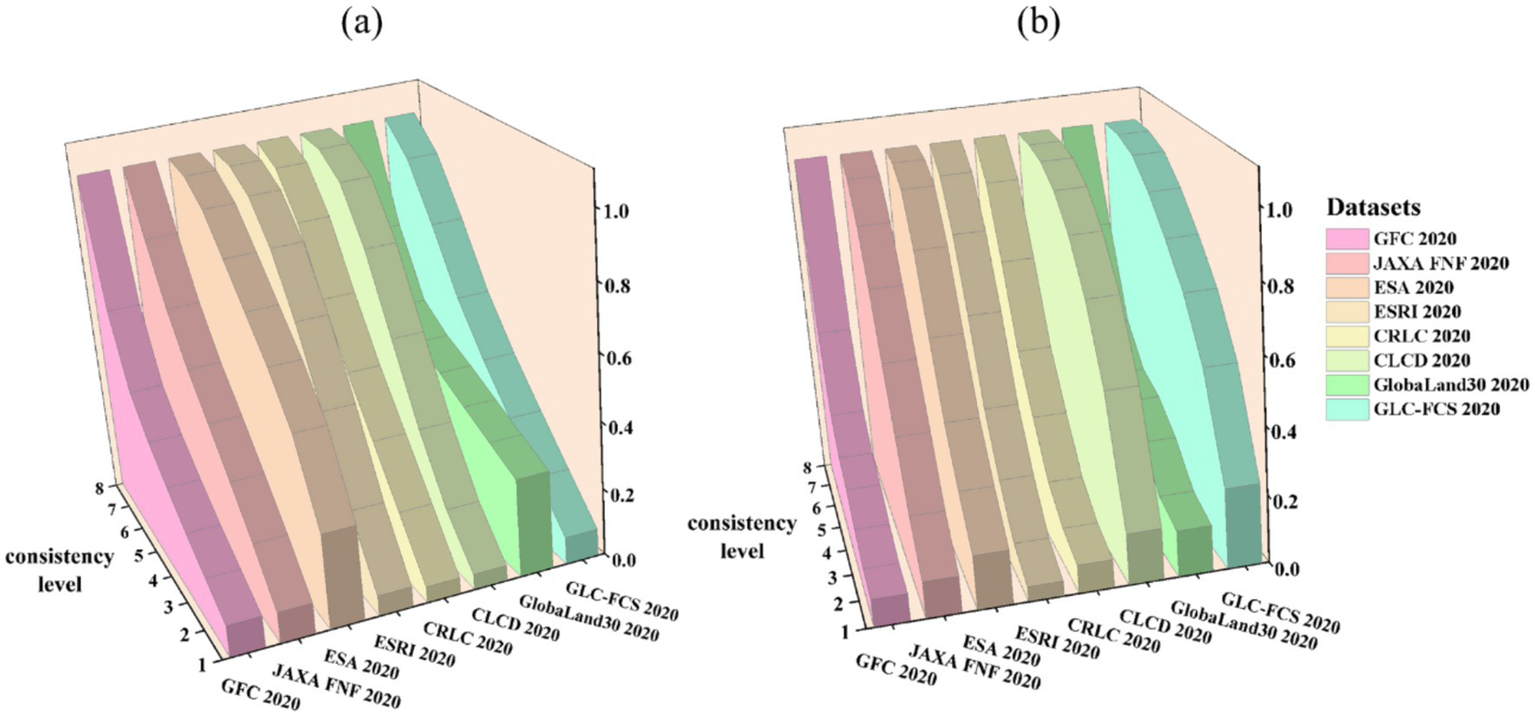
Contribution of each dataset to different consistency levels. (a) Contribution of each dataset to consistency in Hunan Province, (b) contribution of each dataset to consistency in Heilongjiang Province.
4.3 Accuracy assessment results
Based on the collected samples, confusion matrices (as shown in Supplementary Table S2) were constructed to calculate the Kappa coefficient, OA, PA for forest areas, and UA, with the results summarized in Table 5. From the table, it is evident that, with the exception of GFC30 2020, all other datasets achieved an OA exceeding 85%. Among them, CRLC 2020 demonstrated the highest OA in both Hunan and Heilongjiang provinces, reaching 90.88 and 91.69%, respectively. This was followed by ESRI 2020, with OA of 90.78 and 90.16% in the two provinces. However, some datasets exhibited notable fluctuations in performance across different provinces. For instance, CLCD 2020 achieved an OA of 90.52% in Hunan Province but declined to 88.39% in Heilongjiang Province.
Table 5
| Area | Datasets | Kappa/% | OA/% | PA/% | UA/% |
|---|---|---|---|---|---|
| Hunan Province | GFC30 2020 | 66.54 | 83.16 | 75.34 | 90.87 |
| JAXA FNF 2020 | 73.45 | 86.70 | 83.23 | 90.54 | |
| ESA 2020 | 74.61 | 87.42 | 95.43 | 83.02 | |
| ESRI 2020 | 81.48 | 90.78 | 93.93 | 89.03 | |
| CRLC 2020 | 81.69 | 90.88 | 93.37 | 89.61 | |
| CLCD 2020 | 80.98 | 90.52 | 92.37 | 89.78 | |
| GlobaLand30 2020 | 72.47 | 86.27 | 87.86 | 86.13 | |
| GLC-FCS 2020 | 78.37 | 89.18 | 87.48 | 91.43 | |
| Heilongjiang Province | GFC30 2020 | 69.59 | 84.91 | 73.90 | 93.57 |
| JAXA FNF 2020 | 77.80 | 88.89 | 91.42 | 86.41 | |
| ESA 2020 | 79.20 | 89.58 | 93.88 | 85.89 | |
| ESRI 2020 | 80.32 | 90.16 | 90.96 | 88.96 | |
| CRLC 2020 | 83.38 | 91.69 | 93.15 | 90.04 | |
| CLCD 2020 | 76.86 | 88.39 | 95.17 | 83.26 | |
| GlobaLand30 2020 | 73.73 | 86.92 | 80.84 | 91.16 | |
| GLC-FCS 2020 | 76.12 | 88.02 | 94.70 | 82.95 |
Summary of forest identification accuracy assessment for eight datasets in the study area.
It is noteworthy that the OA differences between the datasets in the two regions are relatively small. In this context, the PA and UA serve as complementary metrics to better understand misclassification. In Heilongjiang Province, GFC30 2020 exhibited the highest forest UA, reaching 93.57%, but its PA was only 73.90%, indicating that approximately 26.1% of the forest samples were misclassified as non-forest areas. Meanwhile, GLC-FCS 2020 demonstrated a forest PA of 87.48% and UA of 91.43% in Hunan Province. In Heilongjiang Province, these values were 94.70 and 82.95%, respectively, suggesting that the product performs more balanced in Hunan, while in Heilongjiang, it misclassified approximately 17% of non-forest samples as forest.
We conducted a comparative analysis of the confusion matrices for each dataset to further determine whether there were significant differences between them (Congalton and Green, 1999). The results of the kappa analysis are presented in Figure 13. At a significance level of 0.05, a Z statistic greater than 1.96 indicates a significant difference between the two matrices. It can be observed that datasets with lower overall accuracy exhibited larger Z statistic values when compared to datasets with higher overall accuracy. For instance, the Z statistic values for GFC30 2020 and CRLC 2020 in Hunan Province and Heilongjiang Province reached 8.92 and 10.55, respectively, indicating significant differences in their classification results. In contrast, datasets with higher overall accuracy generally had smaller Z statistic values. For example, the Z statistic value between CRLC 2020 and ESRI 2020 in Hunan Province was only 0.14, suggesting that their classification results showed no significant differences under the same validation sample.
Figure 13
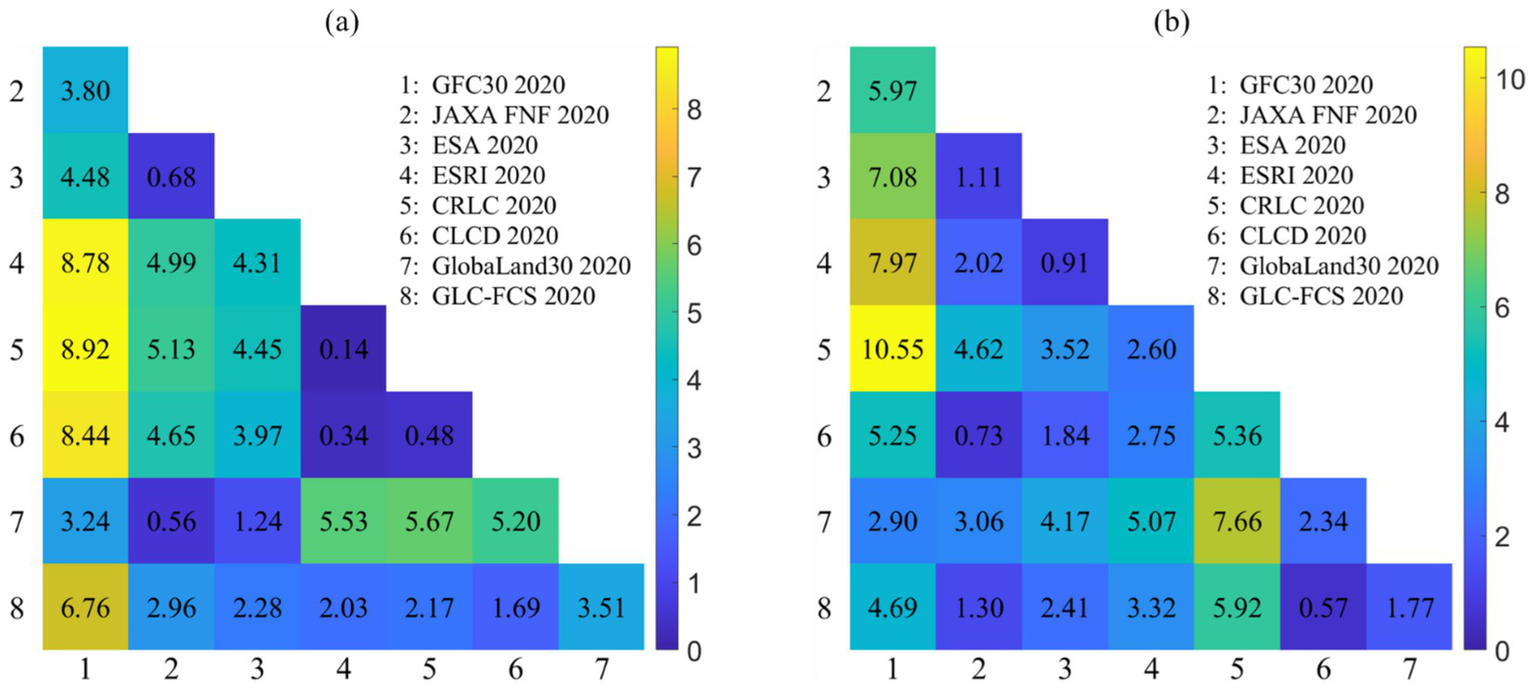
The paired Z-test results of the confusion matrices for the eight datasets in Hunan Province and Heilongjiang Province. (a) Paired Z-test results for Hunan Province, (b) paired Z-test results for Heilongjiang Province.
As inferred from the previous analysis, classification differences among datasets are primarily reflected in areas with low consistency, such as regions with complex land cover or fragmented forests. Increasing sample sizes in these regions would better facilitate the study of classification differences among datasets. Additionally, incorporating more independent sample sets could more effectively mitigate biases arising from reliance on a single validation set.
4.4 Influence of topographic factors on spatial consistency
To investigate the impact of topographic factors on spatial consistency, we categorized the elevation of both provinces into four intervals: less than 200 m, 200–500 m, 500–1,000 m, and greater than 1,000 m. Considering the more complex topography of Hunan Province compared to Heilongjiang, we divided Hunan’s slope into six intervals: less than 5°, 5–15°, 15–25°, 25–35°, 35–45°, and greater than 45°. In contrast, Heilongjiang’s slope was divided into four intervals: less than 5°, 5–15°, 15–25°, and greater than 25°. We then mapped the areas corresponding to the eight consistency levels into these topographic intervals, as shown in Figures 14, 15.
Figure 14
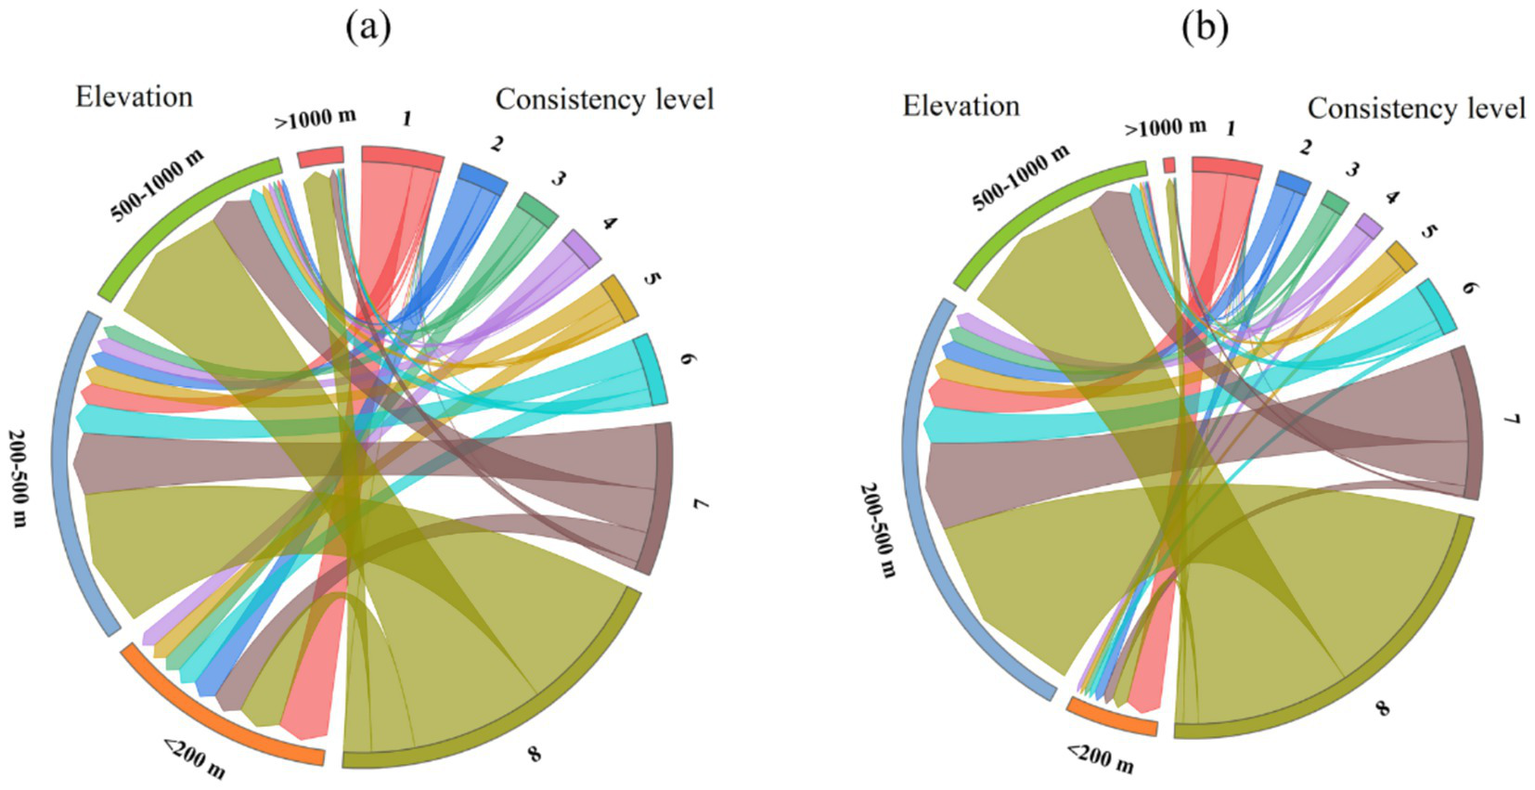
Elevation and consistency correspondence. (a) Elevation and consistency correspondence for Hunan Province, (b) elevation and consistency correspondence for Heilongjiang Province.
Figure 15

Slope and consistency correspondence. (a) Slope and consistency correspondence for Hunan Province, (b) slope and consistency correspondence for Heilongjiang Province.
From the perspective of elevation, in both provinces, regions with elevations less than 200 m corresponded to a substantial proportion of low-consistency areas, with the majority of these regions falling into consistency level 1. As elevation gradually in-creased, the proportion of low-consistency areas decreased, while the proportion of high-consistency areas rose. In the intervals of 200–500 m, 500–1,000 m, and greater than 1,000 m, the proportion of areas with consistency levels 6–8 exceeded 50% in each case.
Regarding slope, in Hunan Province, the low-consistency areas were more prominent in the slope intervals of less than 5° and 5–15°, but in the intervals of 15–25°, 25–35°, 35–45°, and greater than 45°, the proportion of high-consistency areas rapidly increased. In Heilongjiang Province, the majority of low-consistency areas were located in regions with a slope of less than 5°. However, in the slope intervals of 5–15°, 15–25°, and greater than 25°, the proportion of areas with consistency levels 6–8 exceeded 80%.
In summary, it is evident that topographic factors exert a similar influence on the spatial consistency of forest cover datasets in both provinces. In mountainous areas, as elevation and slope increase, forest distribution becomes more concentrated, which facilitates the accurate extraction and classification of forests by the datasets, thereby resulting in higher spatial consistency. In contrast, in flatter regions, the complexity of land cover types and the fragmented nature of forest distribution lead to increased confusion with other categories, significantly impairing the accurate extraction of forests and consequently reducing the spatial consistency.
5 Discussion
5.1 Confusion in the low consistency areas of the datasets
To further investigate the confusion among datasets within the study area, we selected regions with consistency levels ranging from 1 to 4 and quantitatively compared the classification results of six land cover datasets within these areas. For analytical clarity, we extracted common classification labels from these datasets, grouping the land cover into nine categories: forest, shrub, grass, cropland, wetland, impervious surface, water, barren, and herbaceous cover (a unique category in GLC-FCS 2020). The summarized classification results for both provinces are presented in Figures 16, 17. Although the classification categories within these regions are complex, it is evident that, apart from the forest category, cropland, grass, shrub, and herbaceous cover constitute significant proportions across different datasets. This suggests that forest areas are most prone to misclassification with these land cover types. Furthermore, the con-fusion patterns between datasets exhibit distinct characteristics in Hunan and Heilongjiang Provinces. In the low consistency regions, with the exception of forest and cropland, Heilongjiang exhibits the highest proportions of grass, shrub, and herbaceous cover, whereas in Hunan, grass, barren, and impervious surfaces are more prominent. The localized land cover conditions of the datasets for the two provinces are shown in Figures 18, 19.
Figure 16
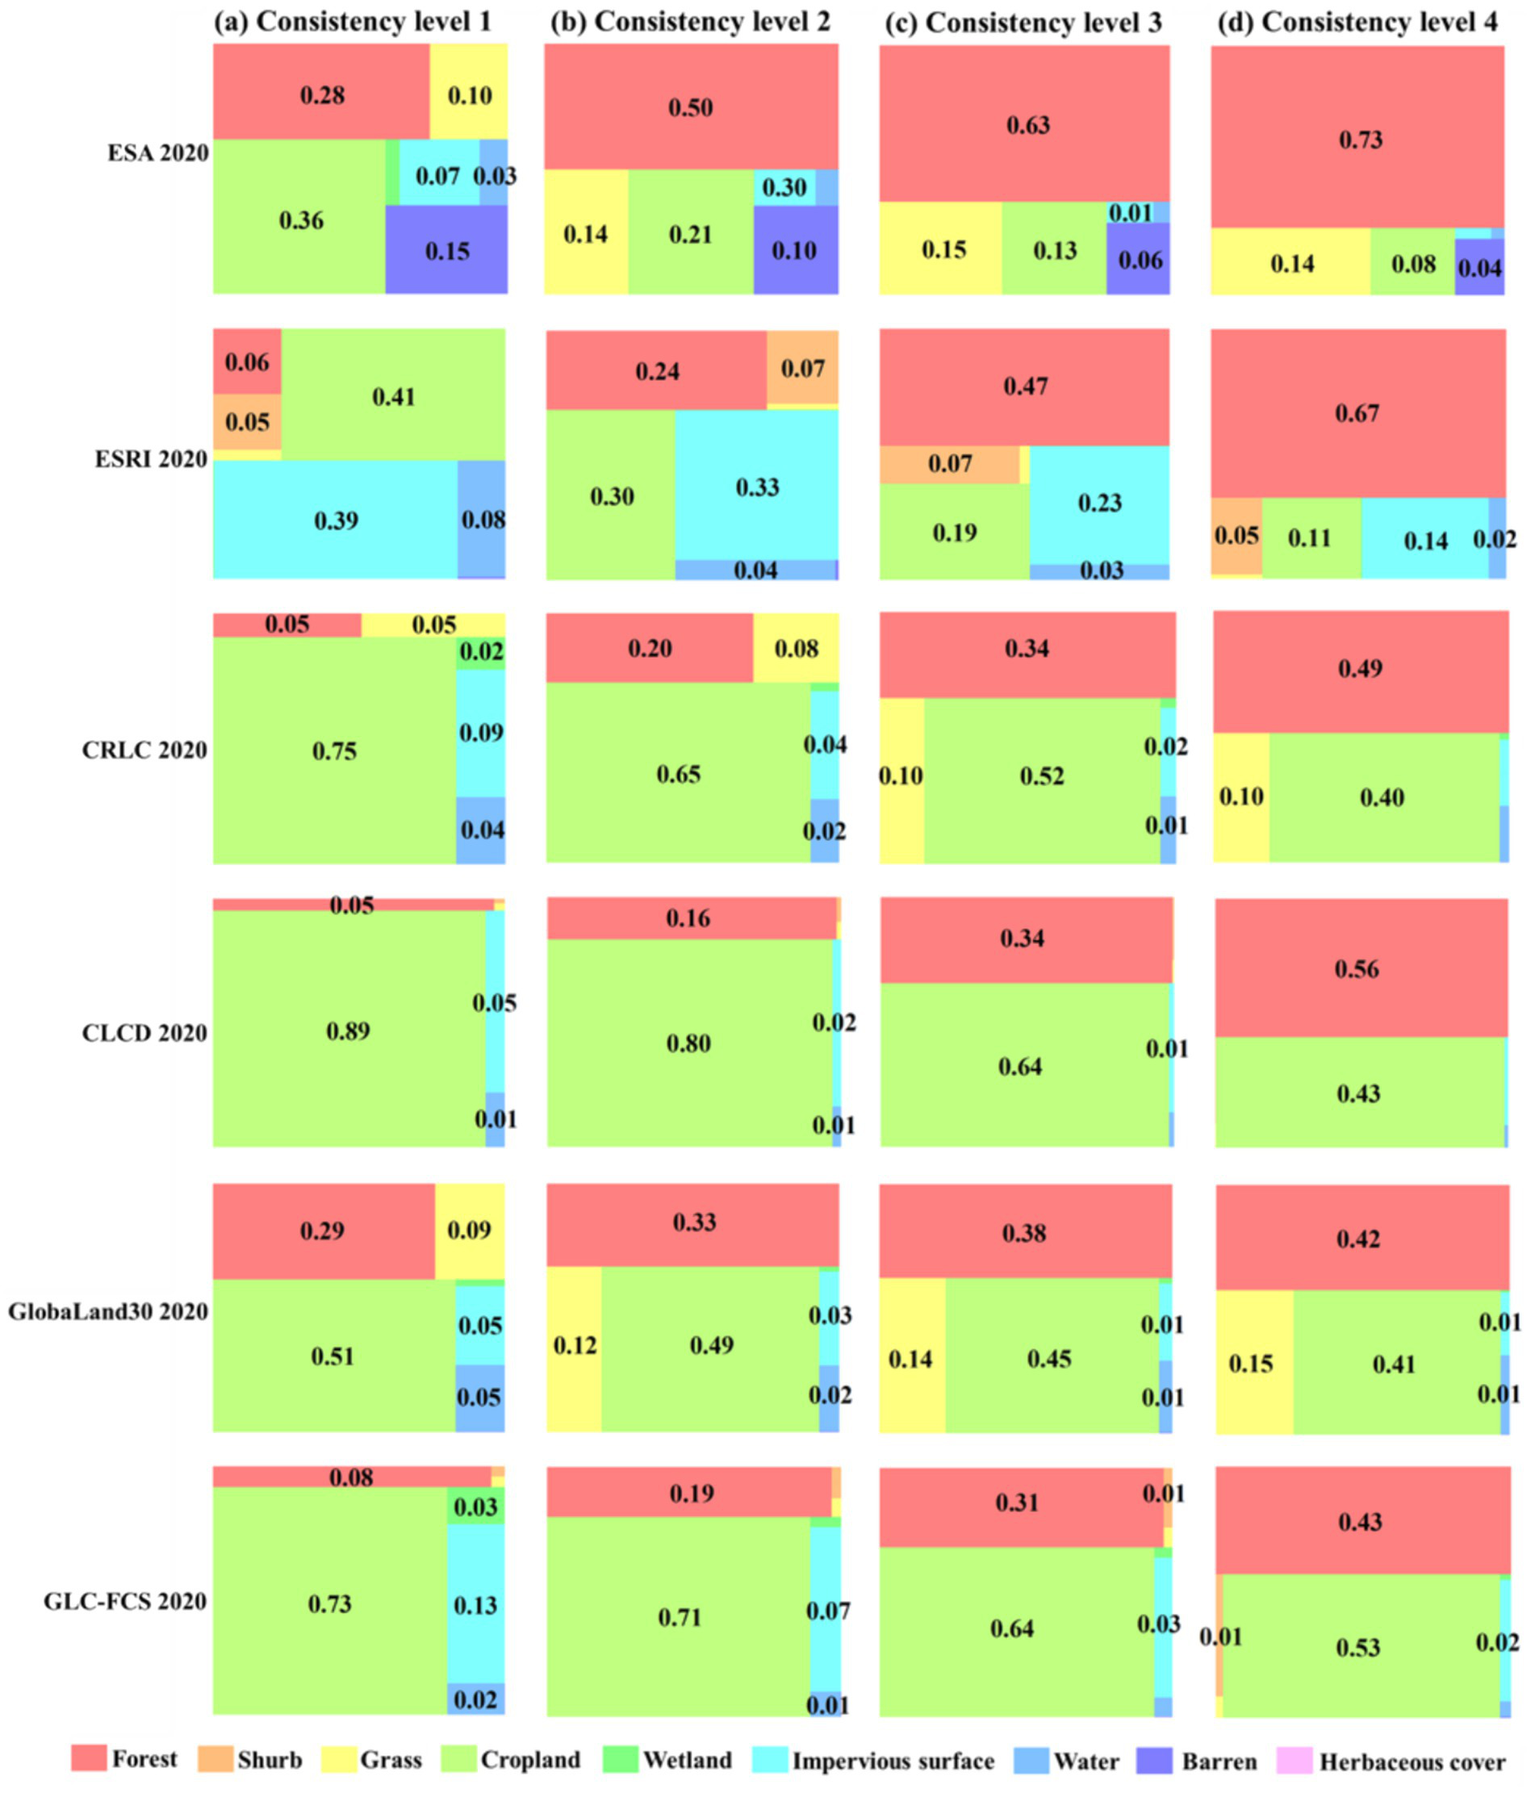
Land cover dataset land classification percentage statistics in the low consistency regions of Hunan Province, (a–d) Correspond to forest consistency distribution levels 1–4.
Figure 17

Land cover dataset land classification percentage statistics in the low consistency regions of Heilongjiang Province, (a–d) correspond to forest consistency distribution levels 1–4.
Figure 18
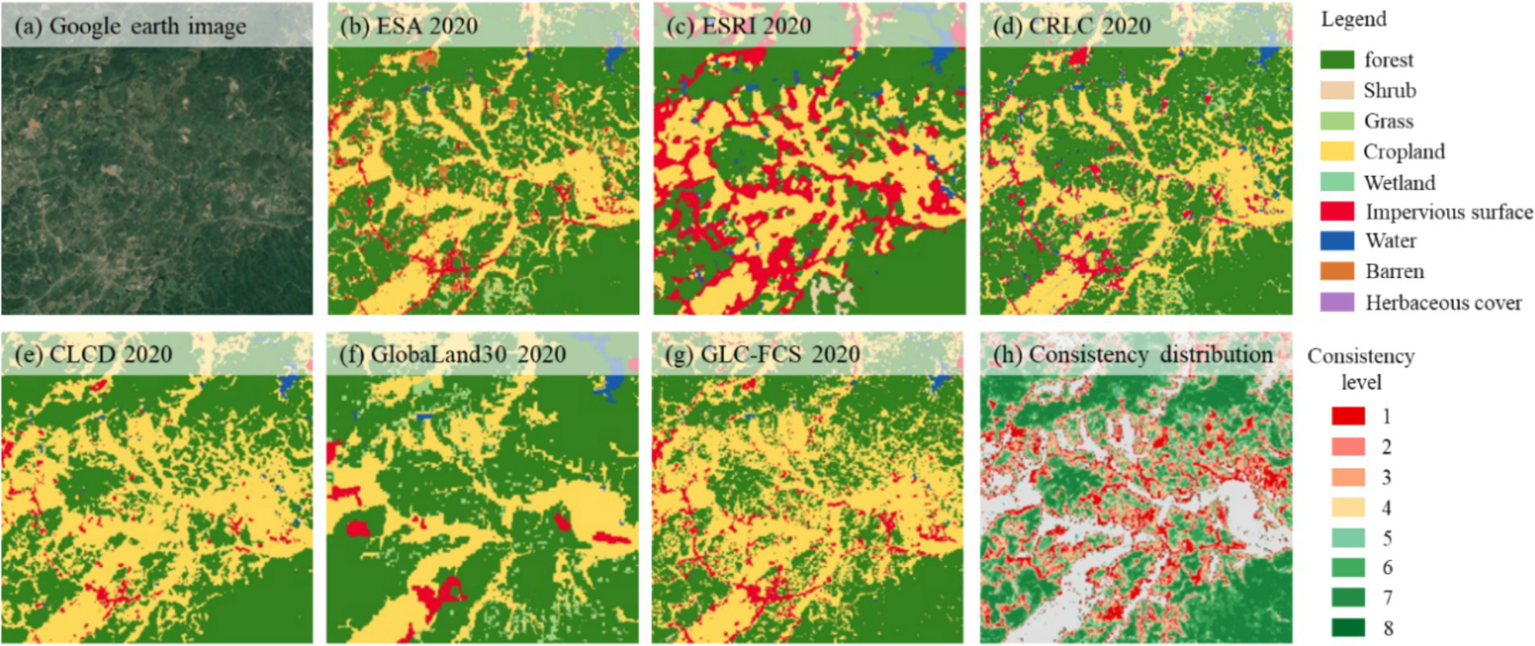
Localized identification of the six land cover datasets in Hunan Province and forest consistency distribution. (a) Remote sensing image, (b) ESA 2020, (c) ESRI 2020, (d) CRLC 2020, (e) CLCD 2020, (f) GlobaLand30 2020, (g) GLC-FCS 2020, and (h) Consistency distribution.
Figure 19
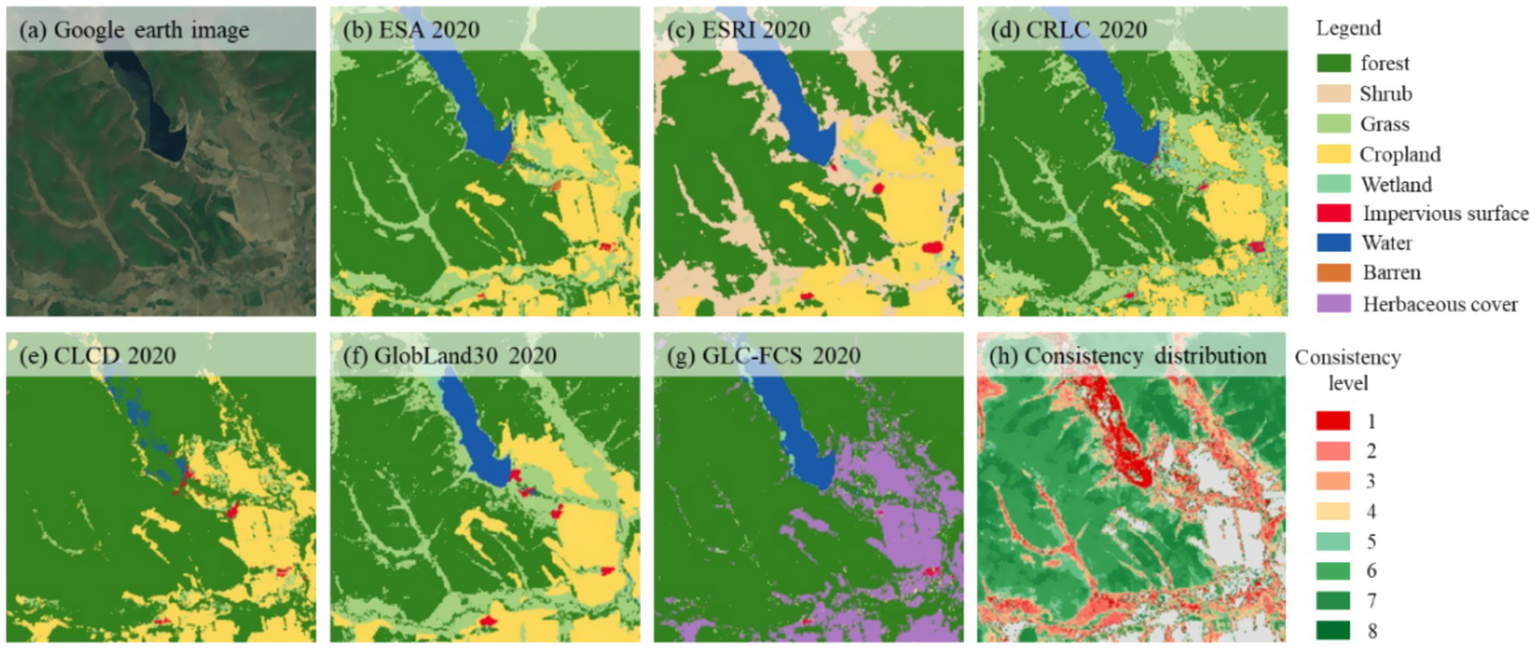
Localized identification of the six land cover datasets in Heilongjiang Province and forest consistency distribution. (a) Remote sensing image, (b) ESA 2020, (c) ESRI 2020, (d) CRLC 2020, (e) CLCD 2020, (f) GlobaLand30 2020, (g) GLC-FCS 2020, and (h) Consistency distribution.
Although the ESRI 2020 dataset exhibits a considerable presence of impervious surfaces and barren in the regions of Hunan Province with consistency levels ranging from 1 to 4, it ranks second in overall accuracy within the province. This observation does not necessarily indicate poor forest classification performance. On the contrary, due to its reliance on remote sensing imagery with a 10 m spatial resolution, this dataset theoretically offers superior spatial analytical capability, allowing for more accurate differentiation of various land cover types in forest and non-forest transitional areas. We therefore hypothesize that similar confusion may originate from other datasets that misclassify complex non-forest areas as forested regions. Such datasets typically exhibit a higher proportion of forest coverage in low-consistency areas, where forests often display low overlap with other land cover types. As a result, these low-consistency regions fail to exhibit clear correlations across different datasets, which may be one of the primary factors contributing to the complexity of the confusion categories. As the consistency level increases, the proportion of land cover types and non-forest areas in each dataset gradually decreases, while the proportion of forested areas progressively increases.
5.2 Impact of forest definition on spatial inconsistency across the datasets
The above analysis reveals substantial inconsistencies among different forest cover datasets in Hunan and Heilongjiang Provinces—two regions representative of the distinct monsoonal climates in southern and northern China. The above analysis reveals substantial inconsistencies among different forest cover datasets in Hunan and Heilongjiang Provinces—two regions representative of the distinct monsoonal climates in southern and northern China. These discrepancies are primarily attributable to differences in forest definitions, which serve as a key factor driving the variation in forest cover classification across datasets. In particular, variations in threshold settings for parameters such as tree height and canopy cover within transitional zones between forest and non-forest areas lead to divergent interpretations across datasets. Consequently, regions with fragmented or heterogeneous forest landscapes are more prone to misclassification compared to areas with contiguous forest cover.
It is noteworthy that the original labels of the ESA 2020 and ESRI 2020 datasets are “tree cover” and “tree,” respectively, whereas other datasets uniformly use the term “forest.” In principle, ESA 2020 and ESRI 2020 adopt a more “liberal” definition of forest, which tends to misclassify urban green belts, orchards in mountainous areas, and tall, dense crops in plains as isolated forest patches. However, due to a tree height constraint of greater than 15 m in ESRI 2020, its overestimation is substantially mitigated compared to ESA 2020, which uses a canopy cover threshold of 10%. This improvement is particularly evident in Hunan Province.
Among datasets targeting “forest” classification, GLC-FCS 2020 performs well in Hunan Province but exhibits notable overestimation in Heilongjiang Province. This overestimation is due to its forest category encompassing a wide variety of forest types and relying solely on canopy cover thresholds, which results in the misclassification of tall, dense shrubs as forest at the northern forest margins. It is also important to highlight that, despite CRLC 2020 and GlobaLand30 2020 sharing consistent forest definitions, and JAXA FNF 2020 aligning with GFC30 2020, significant differences remain in their forest identification performances. Due to the non-open-source nature of their classification algorithms and remote sensing source data, detailed investigations beyond forest definition discrepancies are constrained. Overall, forest cover datasets that incorporate both canopy cover and tree height thresholds, while focusing on less complex tree species compositions, generally achieve better classification accuracy.
From the perspective of forest landscape distribution, agricultural areas in Heilongjiang Province are relatively concentrated in the western and eastern regions, while forests predominantly occupy sparsely populated mountainous areas. The forest landscapes in Heilongjiang exhibit greater continuity, with relatively fewer forest–non-forest interfaces, resulting in higher accuracy and consistency in forest identification across datasets compared to Hunan Province. In contrast, Hunan Province features more complex terrain and considerable human activity even within mountainous regions, leading to extensive transitional zones. Notably, regional landscapes such as terraced fields within some forested areas add to this complexity, posing significant challenges to the applicability of forest definitions in these transitional zones. The population distribution of the two provinces is shown in Figure 20.
Figure 20

Population distribution. (a) Population distribution in Hunan Province, (b) population distribution in Heilongjiang Province.
5.3 Future perspectives
Compared with previous studies that primarily focused on large-scale or single-region assessments, this study selected representative regions in both southern and northern China to systematically investigate the consistency differences of forest cover datasets under varying geographic conditions from a comparative regional perspective. By conducting a comprehensive comparison of eight forest cover datasets, the study revealed substantial discrepancies in forest area estimation and classification accuracy, with pronounced regional variations. These inconsistencies are largely attributed to a combination of factors, including forest definitions, remote sensing data sources, and classification algorithms. The findings highlight the importance of considering local vegetation types, topographic features, and other natural conditions when conducting regional forest mapping, and of identifying the specific contributions of these factors to mapping accuracy (Zhu et al., 2016). This work expands the research framework for assessing the adaptability of forest cover datasets across diverse geographic settings and provides more robust and scientifically grounded technical support for forest resource management, carbon stock estimation, and climate change monitoring.
Most mainstream forest cover datasets currently have a spatial resolution of 10–30 m, with some reaching sub-meter levels. These datasets generally exhibit high consistency and accuracy in densely forested areas with high canopy cover. However, their performance deteriorates in fragmented forests or transitional zones with intensive human activities, where mapping becomes considerably more challenging. During the sample preparation process, the consistency of multiple high-resolution datasets can serve as auxiliary information, enabling the direct selection of highly consistent areas as forest sample regions and thereby significantly improving mapping efficiency.
With the advancement of ecological restoration projects such as the “Grain for Green” program, forest succession has accelerated and associated biophysical characteristics have become increasingly complex. The integration of multi-source remote sensing data—particularly the synergistic use of optical and radar imagery—can enhance the extraction of spectral information, vegetation indices, and texture features, thus improving the accuracy of forest identification (Xia et al., 2022; Kalinaki et al., 2023; Yuh et al., 2023; Zhang X. et al., 2024). Looking ahead, the optimization of deep learning algorithms and the widespread application of cloud computing platforms (e.g., Google Earth Engine) are expected to provide a solid foundation for large-scale and automated forest mapping, promoting simultaneous improvements in both mapping efficiency and accuracy (Gorelick et al., 2017; Pande et al., 2024).
Due to the non-open-source nature of certain remote sensing data sources and classification algorithms, this study is primarily based on the classification results of existing datasets and does not delve into the internal data production processes. Future research could incorporate sensitivity analysis and other quantitative methods to identify and assess the key factors affecting forest mapping accuracy in different regions, thereby enhancing the overall precision and applicability of forest cover mapping. Moreover, this study focuses on representative monsoon forest regions in China, and its findings may provide useful references for ecologically similar areas worldwide. However, arid and semi-arid forest ecosystems were not included in this study, and related forest mapping research in these regions still requires further systematic investigation.
6 Conclusion
This study provides a comprehensive analysis of eight forest cover datasets from 2020, focusing on their area, spatial consistency, and accuracy across southern and northern China, with Hunan and Heilongjiang provinces representing the two regions. Six of the eight datasets were used to conduct a detailed statistical comparison of land cover classification confusion in low consistency (levels 1–4). Additionally, the study further explores and discusses the factors influencing spatial consistency and accuracy, including terrain factors and regional differences between southern and northern China.
The results indicate that the overall accuracy of these datasets is generally high. Among them, the 10 m resolution CRLC 2020 and ESRI 2020 datasets demonstrate higher accuracy compared to the others in both provinces, with overall accuracies of 90.88 and 90.78% in Hunan Province, and 91.69 and 90.16% in Heilongjiang Province, respectively. In Hunan Province, high consistency regions (levels 6–8) account for 69.4%, while low consistency regions (levels 1–3) account for 20.2%. Similarly, in Heilongjiang Province, high consistency regions account for 77%, whereas low consistency regions account for 16.1%. Comparatively, Hunan Province exhibits a lower level than Heilongjiang Province. Overall, datasets exhibit lower consistency in areas with complex land cover types, such as those with elevations below 200 m and slopes less than 5°, while higher consistency is observed in regions with elevations above 500 m and slopes greater than 5%, where forest distribution tends to be more uniform.
In Hunan Province, forests are prone to confusion with cropland, grass, barren, and impervious surfaces, while in Heilongjiang Province, they are more likely to be confused with cropland, grass, shrub, and herbaceous cover. A comprehensive comparative analysis of these datasets helps producing agencies integrate regional characteristics and comprehensively consider factors such as forest definitions, data sources, and algorithms to develop forest mapping schemes tailored to different regions. Additionally, it helps users select the most appropriate forest cover dataset based on the specific characteristics of the region and also offers useful experiences for forest management and ecological restoration in other regions of China.
Statements
Data availability statement
The original contributions presented in the study are included in the article/Supplementary material, further inquiries can be directed to the corresponding author.
Author contributions
KZ: Conceptualization, Data curation, Formal analysis, Investigation, Methodology, Visualization, Writing – original draft, Writing – review & editing. DoL: Conceptualization, Funding acquisition, Validation, Writing – review & editing. HF: Funding acquisition, Validation, Writing – review & editing. TZ: Conceptualization, Data curation, Methodology, Validation, Writing – review & editing. DeL: Visualization, Writing – review & editing. XW: Formal analysis, Writing – review & editing. YL: Supervision, Writing – review & editing.
Funding
The author(s) declare that financial support was received for the research and/or publication of this article. This research was funded by the Natural Science Foundation of Hunan Province (Nos. 2024JJ5144 and 2023JJ20061), and the Scientific Research Fund of Hunan Provincial Education Department (No. 24B0457).
Conflict of interest
The authors declare that the research was conducted in the absence of any commercial or financial relationships that could be construed as a potential conflict of interest.
Generative AI statement
The authors declare that no Gen AI was used in the creation of this manuscript.
Correction note
A correction has been made to this article. Details can be found at: 10.3389/ffgc.2025.1662375.
Publisher’s note
All claims expressed in this article are solely those of the authors and do not necessarily represent those of their affiliated organizations, or those of the publisher, the editors and the reviewers. Any product that may be evaluated in this article, or claim that may be made by its manufacturer, is not guaranteed or endorsed by the publisher.
Supplementary material
The Supplementary material for this article can be found online at: https://www.frontiersin.org/articles/10.3389/ffgc.2025.1627998/full#supplementary-material
References
1
Blickensdörfer L. Oehmichen K. Pflugmacher D. Kleinschmit B. Hostert P. (2024). National tree species mapping using Sentinel-1/2 time series and German National Forest Inventory data. Remote Sens. Environ.304:114069. doi: 10.1016/j.rse.2024.114069
2
Chang Y. Zhu Z. Feng Y. Li Y. Bu R. Hu Y. (2016). The spatial variation in forest burn severity in Heilongjiang Province, China. Nat. Hazards81, 981–1001. doi: 10.1007/s11069-015-2116-9
3
Chazdon R. L. Brancalion P. H. S. Laestadius L. Bennett-Curry A. Buckingham K. Kumar C. et al . (2016). When is a forest a forest? Forest concepts and definitions in the era of forest and landscape restoration. Ambio45, 538–550. doi: 10.1007/s13280-016-0772-y
4
Chen J. Chen J. Liao A. Cao X. Chen L. Chen X. et al . (2015). Global land cover mapping at 30m resolution: a POK-based operational approach. ISPRS J. Photogramm. Remote Sens.103, 7–27. doi: 10.1016/j.isprsjprs.2014.09.002
5
Cheng K. Yang H. Guan H. Ren Y. Chen Y. Chen M. et al . (2024). Unveiling China’s natural and planted forest spatial–temporal dynamics from 1990 to 2020. ISPRS J. Photogramm. Remote Sens.209, 37–50. doi: 10.1016/j.isprsjprs.2024.01.024
6
Congalton R. Green K. . (1999). Assessing the accuracy of remotely sensed data: principles and practices. CRC/Lewis Press, Boca Raton, FL. 137 p.51–52.
7
Cui P. Chen T. Li Y. Liu K. Zhang D. Song C. (2023). Comparison and assessment of different land cover datasets on the cropland in Northeast China. Remote Sens.15:5134. doi: 10.3390/rs15215134
8
Estoque R. C. Johnson B. A. Dasgupta R. Gao Y. Matsuura T. Toma T. et al . (2022). Rethinking forest monitoring for more meaningful global forest landscape change assessments. J. Environ. Manag.317:115478. doi: 10.1016/j.jenvman.2022.115478
9
Fagan M. E. Kim D.-H. Settle W. Ferry L. Drew J. Carlson H. et al . (2022). The expansion of tree plantations across tropical biomes. Nat. Sustain.5, 681–688. doi: 10.1038/s41893-022-00904-w
10
Fang X. Zhao W. Zhang C. Zhang D. Wei X. Qiu W. et al . (2020). Methodology for credibility assessment of historical global LUCC datasets. Sci. China Earth Sci.63, 1013–1025. doi: 10.1007/s11430-019-9555-3
11
Farr T. G. Kobrick M. (2000). Shuttle radar topography mission produces a wealth of data. EoS Trans.81, 583–585. doi: 10.1029/EO081i048p00583
12
Gong P. Wang J. Yu L. Zhao Y. Zhao Y. Liang L. et al . (2013). Finer resolution observation and monitoring of global land cover: first mapping results with Landsat TM and ETM+ data. Int. J. Remote Sens.34, 2607–2654. doi: 10.1080/01431161.2012.748992
13
Gorelick N. Hancher M. Dixon M. Ilyushchenko S. Thau D. Moore R. (2017). Google earth engine: planetary-scale geospatial analysis for everyone. Remote Sens. Environ.202, 18–27. doi: 10.1016/j.rse.2017.06.031
14
Huang W. Min W. Ding J. Liu Y. Hu Y. Ni W. et al . (2022). Forest height mapping using inventory and multi-source satellite data over Hunan Province in southern China. Forest Ecosyst.9:100006. doi: 10.1016/j.fecs.2022.100006
15
Jiang Y. Liu S. Liu M. Peng X. Liao X. Wang Z. et al . (2022). A systematic framework for continuous monitoring of land use and vegetation dynamics in multiple heterogeneous mine sites. Remote Sens. Ecol. Conserv.8, 793–807. doi: 10.1002/rse2.276
16
Jun C. Ban Y. Li S. (2014). Open access to earth land-cover map. Nature514:434. doi: 10.1038/514434c
17
Kalinaki K. Malik O. A. Lai D. T. C. Sukri R. S. Wahab R. B. H. A. (2023). Spatial-temporal mapping of forest vegetation cover changes along highways in Brunei using deep learning techniques and Sentinel-2 images. Eco. Inform.77:102193. doi: 10.1016/j.ecoinf.2023.102193
18
Kang J. Wang Z. Sui L. Yang X. Ma Y. Wang J. (2020). Consistency analysis of remote sensing land cover products in the tropical rainforest climate region: a case study of Indonesia. Remote Sens.12:1410. doi: 10.3390/rs12091410
19
Karra K. Kontgis C. Statman-Weil Z. Mazzariello J. C. Mathis M. Brumby S. P. (2021). “Global land use/land cover with sentinel 2 and deep learning” in 2021 IEEE international geoscience and remote sensing symposium IGARSS (Brussels, Belgium: IEEE), 4704–4707.
20
Keenan R. J. Reams G. A. Achard F. De Freitas J. V. Grainger A. Lindquist E. (2015). Dynamics of global forest area: results from the FAO global forest resources assessment 2015. For. Ecol. Manag.352, 9–20. doi: 10.1016/j.foreco.2015.06.014
21
Li P. Li H. Si B. Zhou T. Zhang C. Li M. (2024). Mapping planted forest age using LandTrendr algorithm and Landsat 5–8 on the loess plateau, China. Agric. For. Meteorol.344:109795. doi: 10.1016/j.agrformet.2023.109795
22
Liang J. Gamarra J. G. P. (2020). The importance of sharing global forest data in a world of crises. Sci. Data7:424. doi: 10.1038/s41597-020-00766-x
23
Liu L. Cao X. Li S. Jie N. (2024). A 31-year (1990–2020) global gridded population dataset generated by cluster analysis and statistical learning. Sci. Data11:124. doi: 10.1038/s41597-024-02913-0
24
Liu Y. Liu R. Qi L. Chen J. Dong J. Wei X. (2024). Global mapping of fractional tree cover for forest cover change analysis. ISPRS J. Photogramm. Remote Sens.211, 67–82. doi: 10.1016/j.isprsjprs.2024.03.019
25
Liu S. Xu Z. Guo Y. Yu T. Xu F. Wang Y. (2023). Consistency analysis of multi-source remote sensing land cover products in arid regions—a case study of Xinjiang. Land12:2178. doi: 10.3390/land12122178
26
Liu B. Yang X. Wang Z. Ding Y. Zhang J. Meng D. (2023). A comparison of six forest mapping products in Southeast Asia, aided by field validation data. Remote Sens.15:4584. doi: 10.3390/rs15184584
27
Liu Y. Zhong Y. Ma A. Zhao J. Zhang L. (2023). Cross-resolution national-scale land-cover mapping based on noisy label learning: a case study of China. Int. J. Appl. Earth Obs. Geoinf.118:103265. doi: 10.1016/j.jag.2023.103265
28
Ma J. Li J. Wu W. Liu J. (2023). Global forest fragmentation change from 2000 to 2020. Nat. Commun.14:3752. doi: 10.1038/s41467-023-39221-x
29
Nabil M. Zhang M. Bofana J. Wu B. Stein A. Dong T. et al . (2020). Assessing factors impacting the spatial discrepancy of remote sensing based cropland products: a case study in Africa. Int. J. Appl. Earth Obs. Geoinf.85:102010. doi: 10.1016/j.jag.2019.102010
30
Nesha K. Herold M. De Sy V. Duchelle A. E. Martius C. Branthomme A. et al . (2021). An assessment of data sources, data quality and changes in national forest monitoring capacities in the global Forest resources assessment 2005–2020. Environ. Res. Lett.16:054029. doi: 10.1088/1748-9326/abd81b
31
Oldekop J. A. Rasmussen L. V. Agrawal A. Bebbington A. J. Meyfroidt P. Bengston D. N. et al . (2020). Forest-linked livelihoods in a globalized world. Nat. Plants6, 1400–1407. doi: 10.1038/s41477-020-00814-9
32
Olofsson P. Foody G. M. Herold M. Stehman S. V. Woodcock C. E. Wulder M. A. (2014). Good practices for estimating area and assessing accuracy of land change. Remote Sens. Environ.148, 42–57. doi: 10.1016/j.rse.2014.02.015
33
Pande C. B. Srivastava A. Moharir K. N. Radwan N. Mohd Sidek L. Alshehri F. et al . (2024). Characterizing land use/land cover change dynamics by an enhanced random forest machine learning model: a Google earth engine implementation. Environ. Sci. Eur.36:84. doi: 10.1186/s12302-024-00901-0
34
Peng X. He G. Wang G. Long T. Zhang X. Yin R. (2023). User-aware evaluation for medium-resolution forest-related datasets in China: reliability and spatial consistency. Remote Sens.15:2557. doi: 10.3390/rs15102557
35
Pitkänen T. P. Balazs A. Tuominen S. (2024). Automatized Sentinel-2 mosaicking for large area forest mapping. Int. J. Appl. Earth Obs. Geoinf.127:103659. doi: 10.1016/j.jag.2024.103659
36
Potapov P. Turubanova S. Hansen M. C. (2011). Regional-scale boreal forest cover and change mapping using Landsat data composites for European Russia. Remote Sens. Environ.115, 548–561. doi: 10.1016/j.rse.2010.10.001
37
Rabus B. Eineder M. Roth A. Bamler R. (2003). The shuttle radar topography mission—a new class of digital elevation models acquired by spaceborne radar. ISPRS J. Photogramm. Remote Sens.57, 241–262. doi: 10.1016/S0924-2716(02)00124-7
38
Reiner F. Brandt M. Tong X. Skole D. Kariryaa A. Ciais P. et al . (2023). More than one quarter of Africa’s tree cover is found outside areas previously classified as forest. Nat. Commun.14:2258. doi: 10.1038/s41467-023-37880-4
39
Shen Y. Li J. Chen F. Cheng R. Xiao W. Wu L. et al . (2022). Correlations between forest soil quality and aboveground vegetation characteristics in Hunan Province, China. Front. Plant Sci.13:1009109. doi: 10.3389/fpls.2022.1009109
40
Shi W. Zhao X. Zhao J. Zhao S. Guo Y. Liu N. et al . (2023). Reliability and consistency assessment of land cover products at macro and local scales in typical cities. Int. J. Digital Earth16, 486–508. doi: 10.1080/17538947.2023.2181992
41
Shimada M. Itoh T. Motooka T. Watanabe M. Shiraishi T. Thapa R. et al . (2014). New global forest/non-forest maps from ALOS PALSAR data (2007–2010). Remote Sens. Environ.155, 13–31. doi: 10.1016/j.rse.2014.04.014
42
Stehman S. V. (2012). Impact of sample size allocation when using stratified random sampling to estimate accuracy and area of land-cover change. Remote Sens. Lett.3, 111–120. doi: 10.1080/01431161.2010.541950
43
Sudmeier-Rieux K. Arce-Mojica T. Boehmer H. J. Doswald N. Emerton L. Friess D. A. et al . (2021). Scientific evidence for ecosystem-based disaster risk reduction. Nat. Sustain.4, 803–810. doi: 10.1038/s41893-021-00732-4
44
Tang W. Liu S. Feng S. Xiao F. Ogbodo U. S. (2023). Evolution and improvement options of ecological environmental quality in the world’s largest emerging urban green heart as revealed by a new assessment framework. Sci. Total Environ.858:159715. doi: 10.1016/j.scitotenv.2022.159715
45
Venter Z. S. Barton D. N. Chakraborty T. Simensen T. Singh G. (2022). Global 10 m land use land cover datasets: a comparison of dynamic world, world cover and Esri land cover. Remote Sens.14:4101. doi: 10.3390/rs14164101
46
Wang H. Cai L. Wen X. Fan D. Wang Y. (2022). Land cover change and multiple remotely sensed datasets consistency in China. Ecosyst. Health Sustain.8:2040385. doi: 10.1080/20964129.2022.2040385
47
Wang Y. Sun Y. Cao X. Wang Y. Zhang W. Cheng X. (2023). A review of regional and global scale land use/land cover (LULC) mapping products generated from satellite remote sensing. ISPRS J. Photogramm. Remote Sens.206, 311–334. doi: 10.1016/j.isprsjprs.2023.11.014
48
Wang Y. Xu Y. Xu X. Jiang X. Mo Y. Cui H. et al . (2024). Evaluation of six global high-resolution global land cover products over China. Int. J. Digital Earth17:2301673. doi: 10.1080/17538947.2023.2301673
49
Wu S. Shi S. Zhang J. (2025). Evolution analysis of ecological security pattern in Forest areas coupling carbon storage and landscape connectivity: a case study of the Xiaoxing’ an mountains, China. Forests16:331. doi: 10.3390/f16020331
50
Xia L. Zhao F. Chen J. Yu L. Lu M. Yu Q. et al . (2022). A full resolution deep learning network for paddy rice mapping using Landsat data. ISPRS J. Photogramm. Remote Sens.194, 91–107. doi: 10.1016/j.isprsjprs.2022.10.005
51
Xing H. Niu J. Liu C. Chen B. Yang S. Hou D. et al . (2021). Consistency analysis and accuracy assessment of eight global forest datasets over Myanmar. Appl. Sci.11:11348. doi: 10.3390/app112311348
52
Yang Z. Dong J. Liu J. Zhai J. Kuang W. Zhao G. et al . (2017). Accuracy assessment and inter-comparison of eight medium resolution forest products on the loess plateau, China. IJGI6:152. doi: 10.3390/ijgi6050152
53
Yang J. Huang X. (2021). The 30 m annual land cover dataset and its dynamics in China from 1990 to 2019. Earth Syst. Sci. Data13, 3907–3925. doi: 10.5194/essd-13-3907-2021
54
Yuh Y. G. Tracz W. Matthews H. D. Turner S. E. (2023). Application of machine learning approaches for land cover monitoring in northern Cameroon. Eco. Inform.74:101955. doi: 10.1016/j.ecoinf.2022.101955
55
Zanaga D. Van De Kerchove R. De Keersmaecker W. Souverijns N. Brockmann C. Quast R. et al . (2021). ESA WorldCover 10 m 2020 v100. Available online at: https://zenodo.org/records/5571936
56
Zhang Q. Kou C. Gao W. (2024). Coupling coordination relationship of forestry industry development and ecological environment: evidence from Heilongjiang Province. Front. Environ. Sci.12:1375657. doi: 10.3389/fenvs.2024.1375657
57
Zhang X. Liu L. Chen X. Gao Y. Xie S. Mi J. (2021). GLC_FCS30: global land-cover product with fine classification system at 30 m using time-series Landsat imagery. Earth Syst. Sci. Data13, 2753–2776. doi: 10.5194/essd-13-2753-2021
58
Zhang X. Liu L. Chen X. Xie S. Gao Y. (2019). Fine land-cover mapping in China using Landsat Datacube and an operational SPECLib-based approach. Remote Sens.11:1056. doi: 10.3390/rs11091056
59
Zhang Y. Liu S. Wang Y. Gao H. Jiang Y. Wei D. (2023). Forest management practices and policies exert strong impacts on the spatio-temporal variations of forest disturbance in Hunan Province, China over the last three decades. For. Ecol. Manag.544:121167. doi: 10.1016/j.foreco.2023.121167
60
Zhang X. Long T. He G. Guo Y. Yin R. Zhang Z. et al . (2020). Rapid generation of global forest cover map using Landsat based on the forest ecological zones. J. Appl. Rem. Sens.14:1. doi: 10.1117/1.JRS.14.022211
61
Zhang X. Zhao T. Xu H. Liu W. Wang J. Chen X. et al . (2024). GLC_FCS30D: the first global 30 m land-cover dynamics monitoring product with a fine classification system for the period from 1985 to 2022 generated using dense-time-series Landsat imagery and the continuous change-detection method. Earth Syst. Sci. Data16, 1353–1381. doi: 10.5194/essd-16-1353-2024
62
Zhao T. Zhang X. Gao Y. Mi J. Liu W. Wang J. et al . (2023). Assessing the accuracy and consistency of six fine-resolution global land cover products using a novel stratified random sampling validation dataset. Remote Sens.15:2285. doi: 10.3390/rs15092285
63
Zhu Z. Gallant A. L. Woodcock C. E. Pengra B. Olofsson P. Loveland T. R. et al . (2016). Optimizing selection of training and auxiliary data for operational land cover classification for the LCMAP initiative. ISPRS J. Photogramm. Remote Sens.122, 206–221. doi: 10.1016/j.isprsjprs.2016.11.004
Summary
Keywords
forest mapping products, land cover and land use, spatial consistency, accuracy assessment, validation
Citation
Zhu K, Lin D, Fu H, Zhang T, Li D, Wang X and Liu Y (2025) Accuracy and consistency assessment of forest cover datasets: a comparative study of two provinces in China. Front. For. Glob. Change 8:1627998. doi: 10.3389/ffgc.2025.1627998
Received
13 May 2025
Accepted
18 June 2025
Published
08 July 2025
Corrected
22 July 2025
Volume
8 - 2025
Edited by
Ram P. Sharma, Tribhuvan University, Nepal
Reviewed by
Sumit Chakravarty, Uttar Banga Krishi Viswavidyalaya, India
Suwit Ongsomwang, Suranaree University of Technology, Thailand
Updates
Copyright
© 2025 Zhu, Lin, Fu, Zhang, Li, Wang and Liu.
This is an open-access article distributed under the terms of the Creative Commons Attribution License (CC BY). The use, distribution or reproduction in other forums is permitted, provided the original author(s) and the copyright owner(s) are credited and that the original publication in this journal is cited, in accordance with accepted academic practice. No use, distribution or reproduction is permitted which does not comply with these terms.
*Correspondence: Dongfang Lin, lindongfang223@163.com
Disclaimer
All claims expressed in this article are solely those of the authors and do not necessarily represent those of their affiliated organizations, or those of the publisher, the editors and the reviewers. Any product that may be evaluated in this article or claim that may be made by its manufacturer is not guaranteed or endorsed by the publisher.