Abstract
This study investigates the distribution and habitat suitability of canopy and non-canopy species in Taraba State, Nigeria, using remote sensing indices (NDVI, NDRE) and species distribution modeling (MaxEnt). Forest ecosystems in this region are increasingly threatened by deforestation, climate change, and land-use change, emphasizing the need for robust monitoring tools to guide conservation strategies. NDVI and NDRE data from 2013 to 2025 were analyzed across six forests, including Gashaka-Gumti National Park, to evaluate vegetation health and distribution. Results revealed clear differences in the sensitivity of canopy and non-canopy species to environmental drivers, with precipitation and temperature variability emerging as the dominant factors influencing distribution. MaxEnt modeling further highlighted the significance of rainfall and temperature seasonality in shaping habitat suitability, showing that non-canopy species are particularly vulnerable to moisture stress during the dry season. Several forests—notably Ngel Yaki (mean NDVI = 0.24), Gashaka-Gumti (0.23), and Gembu (0.21)—exhibited declining vegetation health, emphasizing the urgent need for protection and restoration. The MaxEnt model demonstrated strong predictive performance (AUC = 0.985), providing valuable insights for forest conservation, biodiversity management, and climate adaptation in northern Nigeria, where desertification risk is intensifying.
1 Introduction
Forests provide essential cultural and social benefits, supplying resources such as food, fuel, timber, and bioproducts. They also play a vital role in maintaining ecological balance by purifying air and water, sequestering carbon, and recycling nutrients—functions that are fundamental to human well-being (Hogarth et al., 2013; Khuc et al., 2023). Increasing forest cover through rehabilitation and restoration initiatives enhances the well-being of rural communities, strengthens biodiversity and ecosystem services, and contributes to mitigating the impacts of climate change (Erbaugh and Oldekop, 2018; Phang et al., 2023; Rawat et al., 2022; Shukla et al., 2021). Therefore, understanding the drivers of forest change is essential for effective management and sustainable transitions. Although the concept of forest transition has existed for more than two decades, it has only recently gained prominence within the broader discourse on climate change (Ernst et al., 2013; Gupta et al., 2025; Haq et al., 2024; Hosonuma et al., 2012). Forest transitions are influenced by multiple factors, including economic expansion, scarcity of forest resources, global integration, community displacement, intensified land use by smallholders, and government forest policies (Long et al., 2021; López-Carr, 2021; Syaban and Appiah-Opoku, 2024) While much of the world’s forest area is now in the post-transition stage, many regions remain in the pre-transition or early phases (Hosonuma et al., 2012).
According to the Global Forest Resources Assessment (FAO, 2020), an estimated 4.06 billion hectares of forest remain worldwide, of which approximately 1.11 billion hectares are classified as primary or native forests that have been largely unaffected by human disturbance. Despite this, global forest loss persists. Since 1990, about 420 million hectares of forest have been lost to deforestation (FAO and UNEP, 2020). Nonetheless, the report notes a decline in the annual rate of net forest loss, which decreased from an average of 7.8 million hectares per year between 1990 and 2000 to 4.7 million hectares per year between 2010 and 2020 (FAO, 2020).
Across much of Sub-Saharan Africa, including Nigeria, ecological environments and forest resources are being degraded as a result of land-cover changes driven by deforestation (Figures 1b,c). Despite widespread recognition of its impacts, deforestation remains a critical challenge that continues to threaten many of the world’s fragile ecosystems, as repeatedly documented in the literature (Ibrahim et al., 2023; Ojeh et al., 2022; Yahaya et al., 2024). Deforestation is a prevalent environmental issue that profoundly affects the stability and spread of forests beyond geographic boundaries (Gorte and Sheikh, 2010).
Between 2002 and 2020, Nigeria lost approximately 141,000 hectares of humid primary forest, representing 14% of the country’s total tree cover loss during this period. Overall, the extent of humid primary forests declined by 7.4%. From 2001 to 2019, 14% of national tree cover loss occurred in areas heavily impacted by deforestation. Regionally, Edo State experienced the greatest decline, with 268,000 hectares lost, followed by Ondo (107,000 hectares), Cross River (102,000 hectares), Taraba (91,100 hectares), and Ogun (82,000 hectares). Together, these states accounted for 54% of Nigeria’s total tree cover loss between 2001 and 2020. Edo State’s losses far exceeded the national average of 28,200 hectares per state. In contrast, between 2001 and 2012, Nigeria recorded only a modest gain of 60,300 hectares in tree cover, contributing less than 0.1% to the global total.
In 2010, Taraba State had approximately 1.64 million hectares of tree cover, representing 27% of its total land area. However, by 2020, the state had lost 7,820 hectares of this cover, resulting in an estimated 2.39 million tons of CO₂ emissions. In addition, in 2021, wildfires affected about 4.0 million hectares of land across Nigeria, further intensifying the country’s overall forest loss.
Taraba State, located in north-eastern Nigeria, is renowned for its rich biodiversity and varied landscapes. The state is home to the Mambila Plateau, Nigeria’s highest plateau, as well as the Gashaka-Gumti National Park, which is the largest national park in the country and a critical haven for wildlife conservation. In addition, Taraba contains several key forest reserves, including the Montane Forest, Ngel Yaki, and others that provide vital ecosystem services, sustain local livelihoods, and serve as important carbon sink (Chapman et al., 2004; Danladi et al., 2025). These natural areas are vital for maintaining ecological balance, sustaining diverse flora and fauna, and providing essential ecosystem services. However, they face mounting pressures from deforestation driven by agricultural expansion, illegal logging, population growth, and urbanization (Danladi et al., 2025). Human activities, coupled with the impacts of climate change, have accelerated severe forest depletion in Taraba State. This degradation has resulted in habitat loss, soil erosion, and rising carbon emissions. The continued destruction of Taraba’s forests not only threatens biodiversity but also undermines the region’s ecological balance. If unchecked, these pressures will further exacerbate the risk of desertification spreading across northern Nigeria, with serious implications for both the environment and local livelihoods (Ibrahim et al., 2024). As the land’s capacity to retain moisture declines, desert-like conditions continue to expand. In response, Nigeria has acknowledged the urgency of combating deforestation by aligning national policies with international frameworks such as the United Nations Sustainable Development Goals and by adopting environmental protection conventions. Confronting these challenges is essential to safeguarding the long-term sustainability of the region’s natural resources and ensuring the well-being of its population.
In this study, we employ species distribution modeling (MaxEnt) using bioclimatic variables (BIO1–BIO10 and BIO12–BIO19) from the WorldClim database (Fick and Hijmans, 2017; Poggio et al., 2018). Key variables include BIO1 (Annual Mean Temperature), BIO12 (Annual Precipitation), and BIO19 (Precipitation of Coldest Quarter). We distinguish two functional groups: Canopy species: Trees forming the uppermost forest layer (>10 m height) non-canopy species: understory vegetation including shrubs, herbs, and saplings (<10 m height).
This study addresses the following research questions:
-
What is the relationship between bioclimatic variables (e.g., temperature variability, precipitation) and the distribution of canopy versus non-canopy species?
-
How does habitat suitability influence plant distribution and mitigate climate change impacts on forest ecosystems?
2 Literature review
To ensure a rigorous and transparent review of existing studies, a structured search strategy was employed. Relevant literature was retrieved from Scopus, Web of Science, and Google Scholar, covering the period 2010 to 2024 to capture both foundational and recent developments in the field. The search employed a combination of keywords and Boolean operators, including “NDVI AND forest monitoring,” “NDRE AND vegetation stress,” “species distribution modeling OR MaxEnt,” “canopy species AND understory species,” and “Nigeria OR West Africa AND forest cover change.” The inclusion criteria were limited to peer-reviewed journal articles, scholarly books, and high-quality conference proceedings written in English. Exclusion criteria encompassed grey literature, studies lacking methodological transparency, and publications not directly focused on tropical or subtropical forest ecosystems. This methodological framework ensured that the review incorporated both seminal works and recent contributions relevant to remote sensing indices, land-use/land-cover change analysis, and species distribution modeling in forest ecosystems.
Remote sensing has become an indispensable tool for monitoring changes in forest cover, vegetation health, and land use/land cover (LULC) (Mashala et al., 2023; Olorunfemi et al., 2020; Twisa and Buchroithner, 2019). Among the most widely applied indices, the Normalized Difference Vegetation Index (NDVI), derived from satellite imagery, has proven highly effective in assessing vegetation health, productivity, and forest cover dynamics (Akbar et al., 2020; Robinson et al., 2017; Zaitunah et al., 2018). NDVI has been extensively used to monitor forest dynamics (Hansen et al., 2013), evaluate deforestation trends (Townshend et al., 2012), and estimate carbon stocks in tropical regions (Glennie and Anyamba, 2018; Saatchi et al., 2011). Long-term NDVI analysis enables researchers to capture spatial and temporal variations in forest ecosystems, thereby offering critical insights into the impacts of human activities and climate change.
Land use and land cover (LULC) analysis, which tracks changes in land cover and land utilization over time, is another critical approach for assessing forest loss and landscape transformation. Remote sensing facilitates multi-temporal LULC classification, enabling researchers to examine how forests are converted into agricultural land or urban areas (Kumar, 2017; Shawul and Chakma, 2019; Zoungrana et al., 2015). For instance, studies have demonstrated that agricultural expansion and urbanization in northern Nigeria have driven extensive forest fragmentation (Adenle and Ifejika Speranza, 2020).
Although NDVI is widely used for monitoring vegetation cover, it has limitations in dense forests where canopy structures can distort reflectance signals (Chu and Guo, 2013; Ecke et al., 2022; Vélez et al., 2023). To address these limitations, the Normalized Difference Red Edge (NDRE) index has gained prominence for assessing chlorophyll concentration and nitrogen levels in vegetation canopies (Easterday et al., 2019; Sims and Gamon, 2002; Zhao et al., 2025). While NDRE is primarily employed to evaluate photosynthetic activity rather than vertical stratification, its sensitivity to upper canopy properties (Gitelson et al., 2005) provides a valuable complement to NDVI for comprehensive vegetation assessment. In this study, NDRE is applied alongside NDVI to capture differential responses to environmental stressors between canopy species (dominant upper-layer trees) and non-canopy species (understory vegetation) in Taraba’s multi-layered forests (Abiem et al., 2023; Adedibu et al., 2022; Garkida et al., 2024). Recent studies in comparable ecosystems further highlight NDRE’s potential in detecting stress responses across vegetation strata (Adelabu et al., 2014; Hamada et al., 2023).
NDVI and NDRE are established tools for assessing forest health, productivity, and species distributions (Pettorelli et al., 2011; Tuominen et al., 2009). For instance, NDVI effectively monitors canopy stress and phenological shifts in boreal forests (Myneni et al., 2007), while NDRE enables species-level discrimination of invasive plants (Luo et al., 2021) and detects early chlorophyll deficiency in conifers (Carle, 2023; Zarco et al., 2018).
Species distribution modeling (SDM) has become an essential approach for predicting the potential distributions of plant and animal species in relation to environmental variables. Among the available methods, the Maximum Entropy (MaxEnt) model is one of the most widely applied, particularly in regions with limited occurrence data, due to its strong predictive performance and ability to handle presence-only datasets (Phillips et al., 2006). MaxEnt predicts species’ potential distributions using known occurrence points together with environmental variables, including bioclimatic factors (e.g., precipitation, temperature) and vegetation indices such as NDVI (Elith et al., 2011).
MaxEnt has been successfully used to model species distributions in tropical forests, comparing the habitat preferences of canopy and understory species. Canopy species generally require specific environmental conditions, such as adequate sunlight and stable temperature ranges, while understory species may be more tolerant of low light and varying moisture conditions (Elith et al., 2011). By using MaxEnt, studies have revealed the different habitat preferences of these species, allowing for better forest management and conservation strategies (Abolmaali et al., 2018; Zhao et al., 2023).
Although considerable research on species distribution modeling and forest monitoring has been conducted in Nigeria, most studies have emphasized broad trends such as deforestation and general vegetation change, with little attention given to the specific dynamics of canopy versus non-canopy species. While NDVI and LULC analyses are commonly employed to track forest cover and land-use change, the application of NDRE (Normalized Difference Red Edge) for distinguishing canopy and non-canopy species—particularly in tropical and subtropical forests such as those in Taraba State—remains limited. Moreover, comparative assessments of forest health across multiple sites are scarce, despite clear variability in vegetation structure and condition across the region.
This study integrates NDVI, NDRE, and MaxEnt to model distribution patterns of canopy and non-canopy species using environmental variables. This multi-method approach provides a more comprehensive framework for assessing species-habitat relationships and climate change impacts, with potential applications for conservation planning in northern Nigeria’s desertification-threatened forests.
3 Materials and methods
3.1 Study area
Taraba State, located in northern Nigeria, is bordered by Adamawa, Benue, Plateau, Bauchi, and Gombe states, and shares an international boundary with Cameroon to the east. Covering approximately 54,000 km2 (Figure 1a), the state lies within Nigeria’s Middle Belt and encompasses diverse landscapes, including tropical forests, savannas, and wetlands (Mayomi and Yohanna, 2019). It supports rich biodiversity, most notably within Gashaka-Gumti National Park—the largest in Nigeria—which harbors species such as chimpanzees and elephants. The Mambila Plateau, situated in the southeastern part of the state, is characterized by montane forests and a cooler climate. Taraba experiences a tropical climate with distinct wet (April–October) and dry seasons. In the lowlands, annual rainfall ranges from 1,000 to 1,500 mm, with temperatures varying between 20 °C and 33 °C, while on the Mambila Plateau, temperatures may fall to around 15 °C during the dry season (Adebayo and Oruonye, 2013).
Figure 1

(a) Shows the location of Taraba State; (b) African continent showing 54 countries; (c) Nigeria’s map where the study area is located.
3.2 Data collection and pre-processing
3.2.1 Satellite data acquisition
Time series analysis (2013–2025) utilized:
Landsat 8–9 OLI:
Total images: 126 scenes
Years: 2013, 2016, 2019, 2022, 2025 (dry season: Nov-Mar)
Product: Surface Reflectance Tier 1 (L2SP)
Source: USGS Earth Explorer1
Spatial Resolution: 30 m
Sentinel-2 MSI:
Total images: 38 scenes (Gashaka Gumti National Park only)
Product: Level-2A (Bottom-of-Atmosphere reflectance)
Source: Copernicus Open Access Hub2
Spatial Resolution: 10 m (resampled to 30 m for cross-sensor consistency)
Image Selection Criteria
Cloud Cover Threshold: ≤20% per scene
Temporal Window: ±15 days of target anniversary date
Data Gap Mitigation:
Cloud-contaminated pixels replaced via linear temporal interpolation
Adjacent year data used when target-year data unavailable (validated with ≤5% coverage deviation) (Table 1).
Table 1
| Step | Landsat 8–9 | Sentinel-2 |
|---|---|---|
| 1. Radiometric | QUAC atmospheric correction | Level-2A BOA used directly |
| 2. Geometric | Ground control points (GCPs) alignment to WGS84 UTM Zone 32 N (Required due to terrain distortions) | No correction applied (Level-2A includes terrain correction) |
| 3. Cloud mask | Fmask 4.2 (cloud/shadow probability >80%) (Zhu and Woodcock, 2012) | SEN2COR scene classification map (Main-Knorn et al., 2017) |
| 4. Mosaicking | Performed for Taraba State (6 tiles) and Gashaka Gumti (3 tiles) | Single-tile coverage for Gashaka Gumti |
| 5. Resampling | Sentinel-2 data resampled to 30 m using bilinear interpolation |
Pre-processing workflow (ENVI 5.6 + Python) processing applied uniformly unless specified.
3.3 Vegetation index calculation NDVI and NDRE
3.3.1 Temporal compositing protocol
To ensure phenological consistency, yearly NDVI and NDRE values were derived from dry-season composites (November–March). The following protocol was applied (
Equations 1,
2):
Landsat-based NDVI (for all six forests):
All available Landsat 8/9 Operational Land Imager (OLI) scenes meeting the cloud cover threshold (≤20%) were selected for each year
A median of 5–7 scenes per year per forest was used
Annual NDVI composites were generated using a pixel-wise median to minimize atmospheric noise
Spatial resolution: 30 m
Sentinel-based NDRE (for Gashaka Gumti National Park only):
Level-2A scenes (median 4–6 per year) meeting ≤20% cloud threshold were selected
Annual NDRE composites were generated using 95th percentile method
Data resampled to 30 m resolution using bilinear interpolation
Spatial resolution: Native 10 m resampled to 30 m
3.3.2 Index calculation
The Normalized Difference Vegetation Index (NDVI) and Normalized Difference Red Edge Index (NDRE) were calculated for each scene using the following formulas:
3.3.2.1 Ecological interpretation
The synergy of NDVI and NDRE enhances vertical forest stratification assessment:
-
NDVI provides broad vegetation health across canopy-understory continuum
-
NDRE shows superior sensitivity to chlorophyll in upper canopy layers (>70% signal from top canopy in tropical forests) (Darvishzadeh et al., 2019) (Table 2).
Table 2
| Sensor | Band | Name | Wave length |
|---|---|---|---|
| Landsat 8/9 | B4 | Red | 0.64–0.67 μm |
| B5 | Near Infrared | 0.85–0.88 μm | |
| Sentinel 2 | B4 | Red | 665 nm |
| B5 | Red Edge | 705 nm | |
| B8 | Near Infrared | 842 nm |
Band specifications.
3.3.3 Validation approach
Consistent with established remote sensing principles (Chang-Hua et al., 2010; Delegido et al., 2011; Zhang et al., 2022). NDRE exhibits stronger correlation with upper canopy dynamic. NDVI captures integrated vegetation health across strata (Table 3).
Table 3
| Method | Purpose | References |
|---|---|---|
| Pixel-wise median | Reduces atmospheric noise and outliers | White et al. (2014) |
| 95th percentile | Captures peak vegetation conditions | Jenkins and Frazier (2010) |
| Dry-season focus | Minimizes cloud/moisture interference | Michaelides et al. (2009) |
Justification for compositing approach.
3.4 Land use land cover (LULC) analysis
The inclusion of LULC classification is central to achieving the study’s objectives. Distinguishing between dense forest (canopy-dominated), open forest or shrubland (mixed or degraded canopy), and bareland or non-forest areas allows for a more precise analysis of canopy versus non-canopy species distributions over time. By integrating LULC classification with NDVI and NDRE indices, the study evaluates how changes in vegetation health correspond to land-cover transitions such as forest degradation, shrubland conversion, and bareland expansion. This integration enhances the ecological interpretation of vegetation dynamics within Gashaka-Gumti National Park.
3.4.1 Training data collection protocol
Training data were developed through remote sensing methods:
Total training samples: 500 polygons (100 per LULC class)
Source: Visual interpretation of high-resolution imagery
Maxar Vivid Basemap (0.5 m resolution, 2023)
Google Earth Engine historical imagery
Sampling methodology:
Stratified random sampling across all six forests
Minimum polygon size: 30 × 30 m (1 Landsat pixel)
Interpretation by two independent analysts
3.4.2 Supervised classification methodology
Algorithm: Maximum Likelihood Classifier (da Silva et al., 2019).
Thematic classes:
Waterbodies (rivers, lakes)
Dense Forests (>80% canopy cover)
Open forests (30–80% canopy cover)
Built Areas (urban/rural developments)
Shrubland (grasses, shrubs)
Barelands (eroded areas)
3.4.3 Classification
The maximum likelihood classifier estimates the posterior probability that a pixel belongs to a given class Ck, based on the likelihood function and prior class probabilities (Equation 3):
Where
probability pixel belongs to class Ck
Accuracy Assessment
Validation dataset: 600 independent points
Validation methodology:
Visual interpretation using Maxar Vivid basemap
Sentinel-2 10 m resolution imagery
Accuracy metrics:
Overall Accuracy: 88.5%
Kappa Coefficient: 0.84
3.5 Environmental variables
In this study, 18 environmental variables, encompassing climate, topography, and social factors, were selected as auxiliary variables to construct the species distribution model (Table 4). These include 19 widely used bioclimatic factors from the WorldClim dataset (version 2.1), specifically Bio1 to Bio10 and Bio12 to Bio19, which represent key climate-related variables essential for assessing species distribution and habitat suitability3 (GBIF.org, 2025). The species distribution model was then applied to investigate the responses of canopy and non-canopy species in the study area.
Table 4
| Variable | Description | Type |
|---|---|---|
| BIO1 | Annual mean air temperature/_C | Climatic |
| BIO2 | Mean diurnal temperature range/_C | Climatic |
| BIO3 | Isothermality/_C | Climatic |
| BIO4 | Temperature seasonality | Climatic |
| BIO5 | Maximum temperature of warmest month | Climatic |
| BIO6 | Min Temperature of Coldest Month/_C | Climatic |
| BIO7 | Temperature annual range/_C | Climatic |
| BIO8 | Mean temperature of wettest quarter/C | Climatic |
| BIO9 | Mean temperature of driest quarter/_C | Climatic |
| BIO10 | Mean temperature of warmest quarter/C | Climatic |
| BIO12 | Annual precipitation/mm | Climatic |
| BIO13 | Precipitation of wettest month/mm | Climatic |
| BIO14 | Precipitation of driest month/mm | Climatic |
| BIO15 | Precipitation seasonality | Climatic |
| BIO16 | Precipitation of wettest quarter/mm | Climatic |
| BIO17 | Precipitation of driest quarter/mm | Climatic |
| BIO18 | Precipitation of Warmest Quarter/mm | Climatic |
| BIO19 | Precipitation of coldest quarter/mm | Climatic |
Environmental variables.
3.5.1 Study species and occurrence data
3.5.1.1 Identification of canopy species
This study focused on strict canopy-dominant tree species, defined as mature individuals typically attaining the uppermost layer of the forest structure (≥20 m in height) and whose crowns contribute significantly to the spectral signal captured by satellite sensors. Species selection was based on botanical surveys and checklists specific to Gashaka Gumti National Park and the Guinean-Congolian/Sudanian transition zone (Durrieu et al., 2024; Vogt, 2021; Zadbagher et al., 2023).
The primary canopy species targeted in this study include:
-
Khaya senegalensis (Desr.) A.Juss. (African Mahogany).
-
Isoberlinia doka Craib & Stapf (Doka Tree).
-
Daniellia oliveri (Rolfe) Hutch. & Dalziel (African Copaiba Balsam Tree).
-
Antiaris toxicaria Lesch. (Upas Tree).
-
Ceiba pentandra (L.) Gaertn. (Kapok Tree).
-
Entandrophragma angolense (Welw.) C.DC. (Mahogany).
-
Lophira lanceolata Tiegh. ex Keay (False Shea Tree).
-
Parkia biglobosa (Jacq.) R.Br. ex G.Don (Locust Bean Tree).
These species were selected due to their ecological dominance, known canopy-forming habit, and economic importance, which makes their accurate distribution mapping a conservation priority. Understory tree species (e.g., Carissa edulis Vahl, various shrub species), sub-canopy trees, and woody lianas were explicitly excluded from this analysis to ensure a direct mechanistic link between recorded species presence and the canopy-level spectral indices (NDVI, NDRE) used as predictors.
3.5.1.2 Sourcing and processing of occurrence data
Species occurrence data (geographic coordinates) were compiled from a combination of sources to ensure robust spatial coverage:
-
Systematic Field Surveys: Ground-truthing expeditions were conducted within GGNP during the dry seasons of (September 2024). Using handheld GPS devices (Garmin GPSMAP 64 s; accuracy < 3 m), the coordinates of individual mature trees of the target species were recorded. Identification was performed by trained botanists following the Flora of West Tropical Africa (Gosling et al., 2013; Mcllwaine, 1999)
-
Verification via Remote Sensing: For large, distinctive species such as Ceiba pentandra and Khaya senegalensis, presence points were further verified by visually interpreting high-resolution baseline imagery in Google Earth Pro to confirm the location and canopy characteristics.
-
Public Biodiversity Repositories: Data were supplemented with records from the Global Biodiversity Information Facility (GBIF.org, 2025), To ensure high quality and temporal relevance, GBIF data were subjected to a rigorous filtering process: only records with (i) coordinate uncertainty less than 1,000 m, (ii) no evident geographic or taxonomic issues as flagged by the CoordinateCleaner R package (Aiello-Lammens et al., 2015), (v2.0–20), and (iii) collection dates post-2000 were retained to align with the temporal range of our satellite imagery
3.5.1.3 Spatial thinning and bias reduction
To mitigate the effects of spatial autocorrelation and sampling bias, which can inflate model performance metrics, the combined occurrence dataset was spatially rarefied. Using the spThin R package (v0.2.0), we applied a thinning distance of 1 km, ensuring that no two presence points for a single species were closer than this threshold. This process resulted in a final, environmentally representative dataset of 500 unique occurrence points for model calibration.
3.6 Model construction and evaluation
Environmental variables were sourced from the WorldClim database (Version 2.1) (Fick and Hijmans, 2017) at a spatial resolution of 30 arc-seconds (~1 km2). These variables represent long-term average conditions for the period 1970–2000. The eighteen bioclimatic variables were initially considered due to their established relevance to plant physiological tolerances. To mitigate multicollinearity, a pairwise Pearson correlation analysis was performed. For any pair of variables with a correlation coefficient |r| > 0.8, the variable with the clearer ecological interpretation for canopy trees was retained. The final set of 18 variables used in the model included Bio 12 (Annual Precipitation), Bio 4 (Temperature Seasonality), and Bio 15 (Precipitation Seasonality).
3.6.1 Model construction and evaluation
Species distribution modeling was performed using Maximum Entropy modeling implemented in the MaxEnt software (version 3.4.4) (Zhao et al., 2024). The model input consisted of two elements:
-
Species Occurrence Data: The spatially thinned presence-only (POE) data for the target canopy species. The final dataset comprised a total of 500 points across all species
-
Environmental Predictors: The processed ASCII raster files of the selected bioclimatic and spectral variables.
The optimal model complexity was determined using the ENMeval R package to test combinations of feature classes (L, LQ, H, LQH, LQHP) and regularization multipliers (a range from 0.5 to 4). The model with the lowest delta AICc score was selected for final production (Li et al., 2023). The final model used a regularization multiplier of 0.5 and linear and quadratic features.
Model performance was evaluated using the Area Under the Receiver Operating Characteristic Curve (AUC). The AUC score quantifies the model’s ability to distinguish between presence and background locations, with a value of 0.5 representing random prediction and 1.0 representing perfect discrimination. The reported AUC value of 0.985 was derived from the average test AUC across 5-fold cross-validation runs, not the training AUC. This high-test AUC indicates excellent predictive performance. To further guard against overfitting, we:
-
Employed 5-fold cross-validation, which partitions the data into training and test sets, ensuring the performance metric is based on predictions to unseen data.
-
Used a regularization multiplier to penalize model complexity.
-
Critically evaluated the response curves to ensure they reflected ecologically plausible relationships.
3.7 Regression analysis
Regression analysis is a statistical technique used to explore the relationship between a dependent (response) variable and independent (predictor) variables (Arum et al., 2025; Chatterjee and Hadi, 2015). It is commonly employed for prediction and modeling, helping to understand how independent variables influence the dependent variable (Harrell, 2001; Xu et al., 2019).
Linear regression was selected due to its ability to model straightforward relationships between bioclimatic variables and NDVI values, providing clear insights into the effects of environmental variables on vegetation health over time (Equation 4). All regression analyses were performed using R software (version 4.3.1; R Core Team, 2023) with the built-in lm() function for linear modeling. In this study, we apply regression analysis to predict the future NDVI values of six forest and game reserve locations: Ngel Yaki, Gashaka Gumti, Baissat, Gembu, Kwazun, and Kashimbila. Our goal is to predict the future conditions of these forests and identify which areas require immediate attention. The analysis is based on five time periods (2013, 2016, 2019, 2022, and 2025), where we extract the mean NDVI values for each reserve during these years (Figure 2).
Figure 2

(a) Illustrates the mean NDVI values extracted from six forest reserves over time. (b) Shapefiles of the study area for these six forests and game reserves. (c) Photographs of the six forest reserve areas.
While correlation analysis helps identify relationships between variables, it does not clarify the direction or strength of the dependency. Therefore, we use regression analysis to model linear relationships between dependent and independent variables (
Franzese and Iuliano, 2018).
The regression model used in this analysis can be expressed as:
Is the Dependent Variable (The predicted NDVI Value for 2028).
are the dependent variables (predictors, including factors such as year, precipitation, temperature, etc.).
is the intercept are the regression coefficients and is the error term
This approach will allow us to predict the NDVI value in 2028, providing insight into future forest conditions and guiding conservation efforts. This comprehensive methodology will allow us to model species distributions, predict future forest conditions, and assess the impacts of climate change and land use on forest health, providing vital data for conservation strategies in Taraba State.
4 Results and discussions
4.1 Normalized difference vegetation index (NDVI) analysis for Taraba State
The NDVI values derived from Landsat 8 and 9 satellite data for different land-cover categories (Waterbody, Land, Shrubs, and Vegetation) show fluctuating patterns of vegetation health in Taraba State over the years. These values provide an indication of vegetation density and health, with higher NDVI values representing denser, healthier vegetation. NDVI, which ranges from −1 to +1, provides valuable insights into vegetation density and health, with higher values indicating better vegetation conditions (Meneses-Tovar, 2011; Peters et al., 2002). This range of values allows us to interpret trends in vegetation health, especially when comparing different land-cover categories across multiple years.
4.1.1 Waterbody class
The Waterbody class showed relatively stable NDVI values throughout the study period, ranging from −0.17 to −0.11. These values are characteristic of non-vegetated areas, with water bodies exhibiting low or negative NDVI values. In 2013, Waterbody coverage was 1187.31 hectares, significantly increasing to 8998.01 hectares by 2025. The sharp increase in waterbody area suggests natural phenomena like flooding (Bako et al., 2016; Gabriel et al., 2018) or land use and water management changes that exposed more water surfaces. Despite the area increase, the NDVI values remained low, indicating that the expansion of water bodies did not contribute to the increase in vegetation health.
4.1.2 Bareland class
For the Land class, the NDVI values remained low, ranging from 0.11 to 0.18, reflecting areas with sparse or minimal vegetation cover, possibly urbanized areas, agricultural land, or bare soil. The Land category experienced a fluctuating coverage pattern, starting at 30087.87 hectares in 2013, dropping to 25760.76 hectares in 2019, and increasing again to 33,605 hectares in 2025. The fluctuations in area coverage may be attributed to urbanization, agricultural activities, or land-use reclassification over time (Ijafiya et al., 2023; Yusuf and Jauro, 2024). Although the NDVI values remained relatively constant, the changes in the Land area are significant and suggest shifts in land-use dynamics (Figures 3a–d).
4.1.3 Shrubs class
The Shrubs class exhibited NDVI values ranging from 0.18 to 0.23, indicative of moderate vegetation health. These values reflect areas with scrublands or low-density vegetation. However, the observed NDVI values may be influenced by the mixed-pixel effect, where the pixel values may include both vegetated areas (such as shrubs) and non-vegetated surfaces (e.g., bare soil), which could dilute the NDVI signal, leading to potentially lower values than would be observed in purely vegetated areas.
Despite this, the overall NDVI trend suggests that the shrubland areas maintained relatively healthy vegetation conditions, although the low NDVI values indicate that the shrub coverage is not as dense as that of forested areas. The increase in shrub coverage from 20,547.55 hectares in 2013 to 23,770.11 hectares in 2019 may reflect natural vegetation recovery or reduced land-use pressures, such as less intensive agricultural practices.
However, by 2025, the reduction in shrubland area to 12,253.75 hectares suggests that these areas may have been converted to other land uses, such as agricultural expansion or deforestation (Figure 3d). The fluctuating NDVI values over time reflect a complex interplay of factors, including land cover changes, land-use pressures, and the limitations of NDVI as a vegetation health indicator in mixed-pixel environments. Despite fluctuations, the NDVI values indicate that shrubland areas remained relatively healthy, although some decline was noted towards 2025.
Figure 3

Normalized difference vegetation index (NDVI) in Taraba State from 2013 to 2015. This figure illustrates the changes in the vegetation index over the specified years, highlighting the ecological trends in the region.
4.1.4 Vegetation class
The Vegetation class, indicative of dense vegetation or forest areas, experienced moderate to high NDVI values, ranging from 0.23 to 0.47. These values reflect healthy vegetation but show a slight decline over time, particularly in the later years of the study. Vegetation coverage started at 8310.75 hectares in 2013 and decreased to 5244.26 hectares by 2025 (Figure 3). The decline in vegetation health (NDVI) and area suggests significant degradation, possibly due to deforestation, illegal logging, or agricultural land conversion. The NDVI values of 0.23 to 0.47 for Vegetation highlight that while the area still maintains some forest cover, the overall health and vitality of the forest are decreasing, consistent with the observed area loss over time (Abba et al., 2021; Ojeh et al., 2022).
The analysis of NDVI data and land cover in Taraba State reveals a significant decline in healthy vegetation, particularly in the Vegetation and Shrub categories. This decline indicates the region’s ecosystems’ vulnerability to natural and human-induced pressures (James, 2019; James and Ngala, 2015; Omijeh, 2021; Oruonye et al., 2024). Immediate conservation efforts are essential in areas experiencing substantial vegetation loss. Notably, the increase in Waterbody area does not correlate with improved vegetation health, suggesting changes in hydrology or land use that negatively affect forest vitality (Table 5).
Table 5
| Year | Waterbody_NDVI | Waterbody_Area (ha) | Land_NDVI | Land_Area (ha) | Shrubs_NDVI | Shrubs_Area (ha) | Vegetation_NDVI | Vegetation_Area (ha) |
|---|---|---|---|---|---|---|---|---|
| 2013 | −0.17 | 1187.31 | 0.11 | 30087.87 | 0.18 | 20547.5 | 0.23 | 8310.75 |
| 2016 | −0.13 | 3342.65 | 0.11 | 29042.7 | 0.2 | 20734.2 | 0.25 | 6958.08 |
| 2019 | −0.14 | 1401.12 | 0.12 | 25760.76 | 0.22 | 23770.1 | 0.3 | 9137.43 |
| 2022 | −0.18 | 4445.62 | 0.11 | 32665.39 | 0.21 | 16147.6 | 0.28 | 6824.82 |
| 2025 | −0.17 | 8998.01 | 0.11 | 33,605 | 0.23 | 12253.7 | 0.23 | 5244.26 |
Showing the NDVI range of each class and the area covered in hectares from 2013 to 2025.
4.2 Land use land cover (LULC) analysis for Taraba State
Figures 4, 5 present area coverage changes in hectares for different land-use categories in Taraba State from 2013 to 2025. The figures reveal important land-use dynamics trends, showing gains and losses across the study period.
Figure 4

Land use land cover (LULC) in Taraba State from 2013 to 2015. This figure illustrates the spatiotemporal changes over the specified years, highlighting the ecological trends in the region.
Figure 5
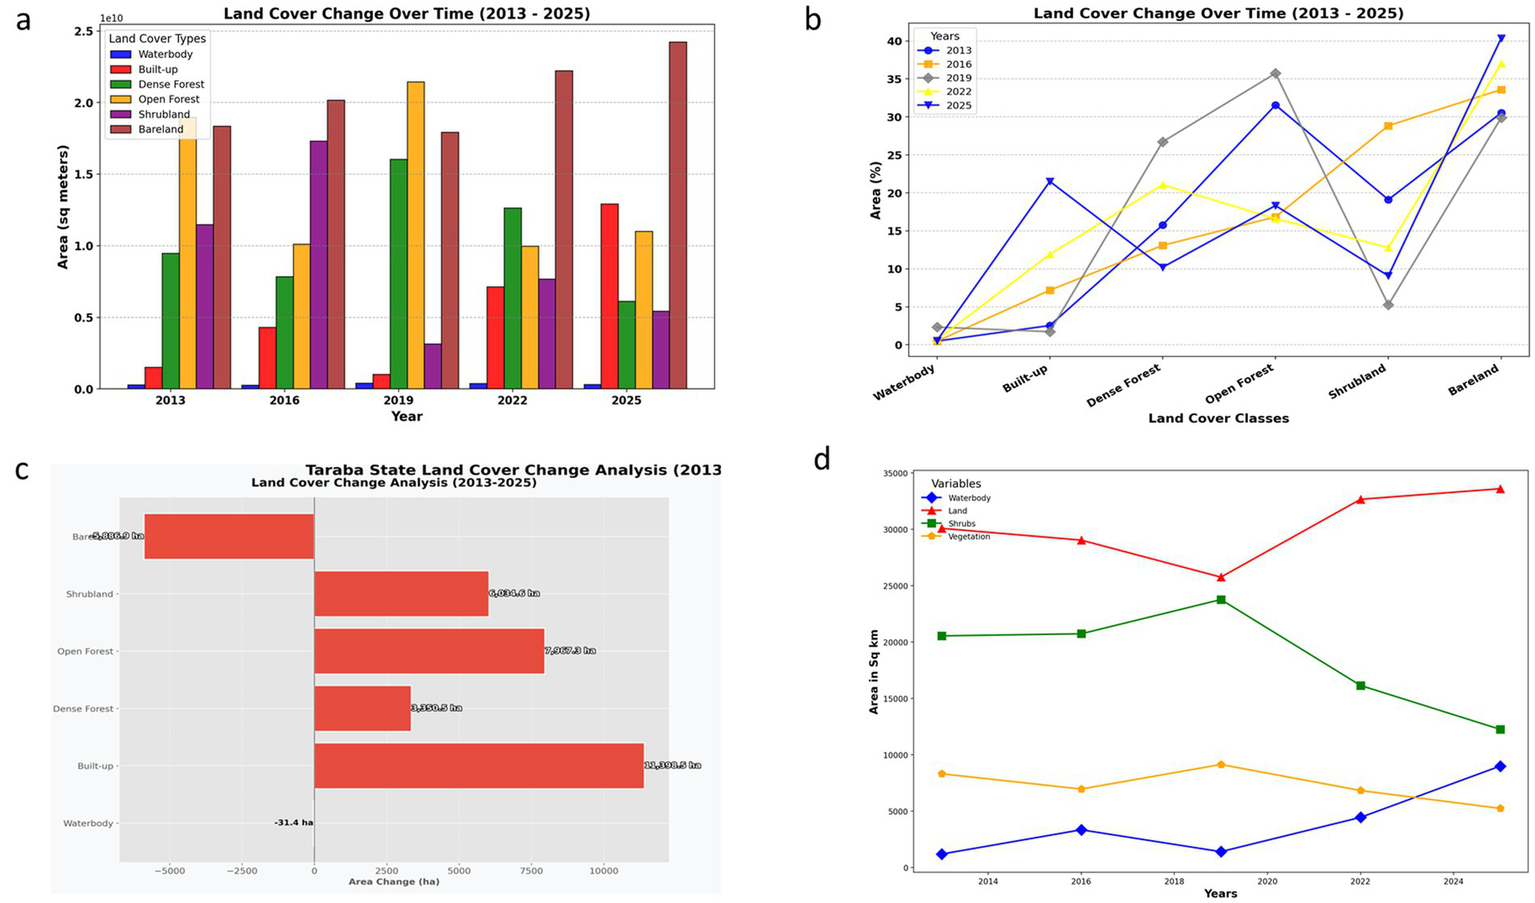
(a) Land use and land cover changes show a trend in sq. meter. (b) Land use land cover anomaly. (c) Changes in land cover classes 2013–2025. (d) Land use and land cover changes show a trend in sq. kilometer.
4.2.1 Waterbody
The Waterbody category shows a general decline in coverage over time, with a reduction from 294.11 hectares in 2013 to 328.56 hectares in 2025, marking a loss of −34.45 hectares. This decrease might reflect shrinking water bodies due to climate change, reduced precipitation, or land-use alterations, such as diversifying water resources for agriculture or infrastructure (Bako et al., 2016; Gabriel et al., 2018).
4.2.2 Built-up area
The Built-up category shows substantial expansion between 2013 and 2025. Starting at 1,523.57 hectares in 2013, the built-up area increased to 12,922.07 hectares by 2025. This represents a net increase of 11,398.50 hectares (748% growth), indicating rapid urbanization driven by population growth and development projects (Bako et al., 2016; Gabriel et al., 2018).
4.2.3 Dense forest
The dense forest category’s area declined from 9484.88 hectares in 2013 to 6134.42 hectares in 2025, showing a net loss of −3350.46 hectares. This loss highlights the severe impact of deforestation, likely caused by logging, agricultural expansion, and infrastructure development. The decrease in dense forests reflects a degradation in the quality of the forest ecosystem, potentially leading to the loss of biodiversity and critical ecosystem services, such as carbon sequestration and water regulation.
4.2.4 Open forest
Open forest also showed a decline in area, from 18978.88 hectares in 2013 to 11011.62 hectares in 2025, reflecting a loss of −7967.26 hectares. The reduction in open forests, which may represent secondary forests or areas under lesser vegetation cover, further underscores the trends of land-use conversion and deforestation. These areas could have been replaced by agriculture, urban development, or barren land over time.
4.2.5 Shrubland
The Shrubland category showed substantial fluctuation, starting at 11487.71 hectares in 2013, peaking at 17324.78 hectares in 2016, and then declining to 5453.09 hectares by 2025. This overall loss of −6034.62 hectares could be due to land conversion to agriculture or urbanization, as well as climate impacts such as drought or fire. Shrublands are often transitional habitats, so their decline can indicate ecosystem changes, potentially affecting wildlife species dependent on such areas. In Figure 5d, it was observed that the decline of shrubland in 2019 resulted in a significant increase in bare land through 2025.
4.2.6 Bareland
The Bareland category, representing areas with minimal or no vegetation, has consistently increased over the years, from 18356.04 hectares in 2013 to 24242.91 hectares in 2025, reflecting an increase of 5886.87 hectares. The expansion of barelands likely reflects soil erosion, degradation, and deforestation (Abba et al., 2021; Danung et al., 2025). The trend could also be associated with unsustainable land-use practices like overgrazing, poor agricultural practices, and urban expansion, which expose the land to erosion and reduced vegetation cover.
The combined analysis of NDVI values and land-cover area changes reveals significant trends in Taraba State. The expansion of Built-up areas and the loss of dense forest, Open Forest, and Shrubland highlight the pressure on the region’s natural landscapes. The increase in Bareland and the corresponding decrease in forested areas suggest ongoing land degradation. These findings highlight the need for urgent conservation and land-use management efforts to reverse these trends and protect the region’s ecosystems.
4.3 Natural parks and forest reserves assessment in Taraba
Taraba State is known for its rich biodiversity and landscapes, such as the Mambila Plateau and Gashaka-Gumti National Park. These areas are vital for ecological balance and support diverse flora and fauna. Nevertheless, analyzing the vegetation index and land use land cover is essential. However, due to the rapid increase in Nigeria’s population (Yahaya et al., 2024), it is tough to keep urbanization and urban migration in check. However, we can restore the damaged forests and limit anthropogenic activities in the restricted areas.
This paper inspects the vegetation level in the study area’s six forests and game reserves from 2013 to 2025 (Table 6 and Figure 6).
Table 6
| Forests | X-Coord | Y-Coord | ndvi_13 | ndvi_16 | ndvi_19 | ndvi_22 | ndvi_25 | ndvi_28 |
|---|---|---|---|---|---|---|---|---|
| Ngel-yaki | 11.12820637 | 7.078259757 | 0.25382024 | 0.194244027 | 0.199337721 | 0.260533303 | 0.210317925 | 0.2425 |
| GGNP | 11.49004269 | 7.305932779 | 0.224392295 | 0.168839097 | 0.235863388 | 0.235690638 | 0.176672518 | 0.2343 |
| Baissat | 10.53733564 | 7.282119493 | 0.332799643 | 0.196835294 | 0.193088248 | 0.171520159 | 0.106929645 | 0.6296 |
| Gembu | 11.27434141 | 6.722258373 | 0.211109743 | 0.187239945 | 0.219434619 | 0.226242274 | 0.189159334 | 0.2111 |
| Kwazun | 11.56204501 | 8.600037627 | 0.299320817 | 0.272380799 | 0.299326211 | 0.243754953 | 0.233750984 | 0.4136 |
| Kashimbila | 9.85590623 | 6.86026811 | 0.258152723 | 0.252093494 | 0.266334563 | 0.161773846 | 0.143604666 | 0.5036 |
Showing the NDVI range of each class and the area covered in hectares from 2013 to 2028.
Figure 6
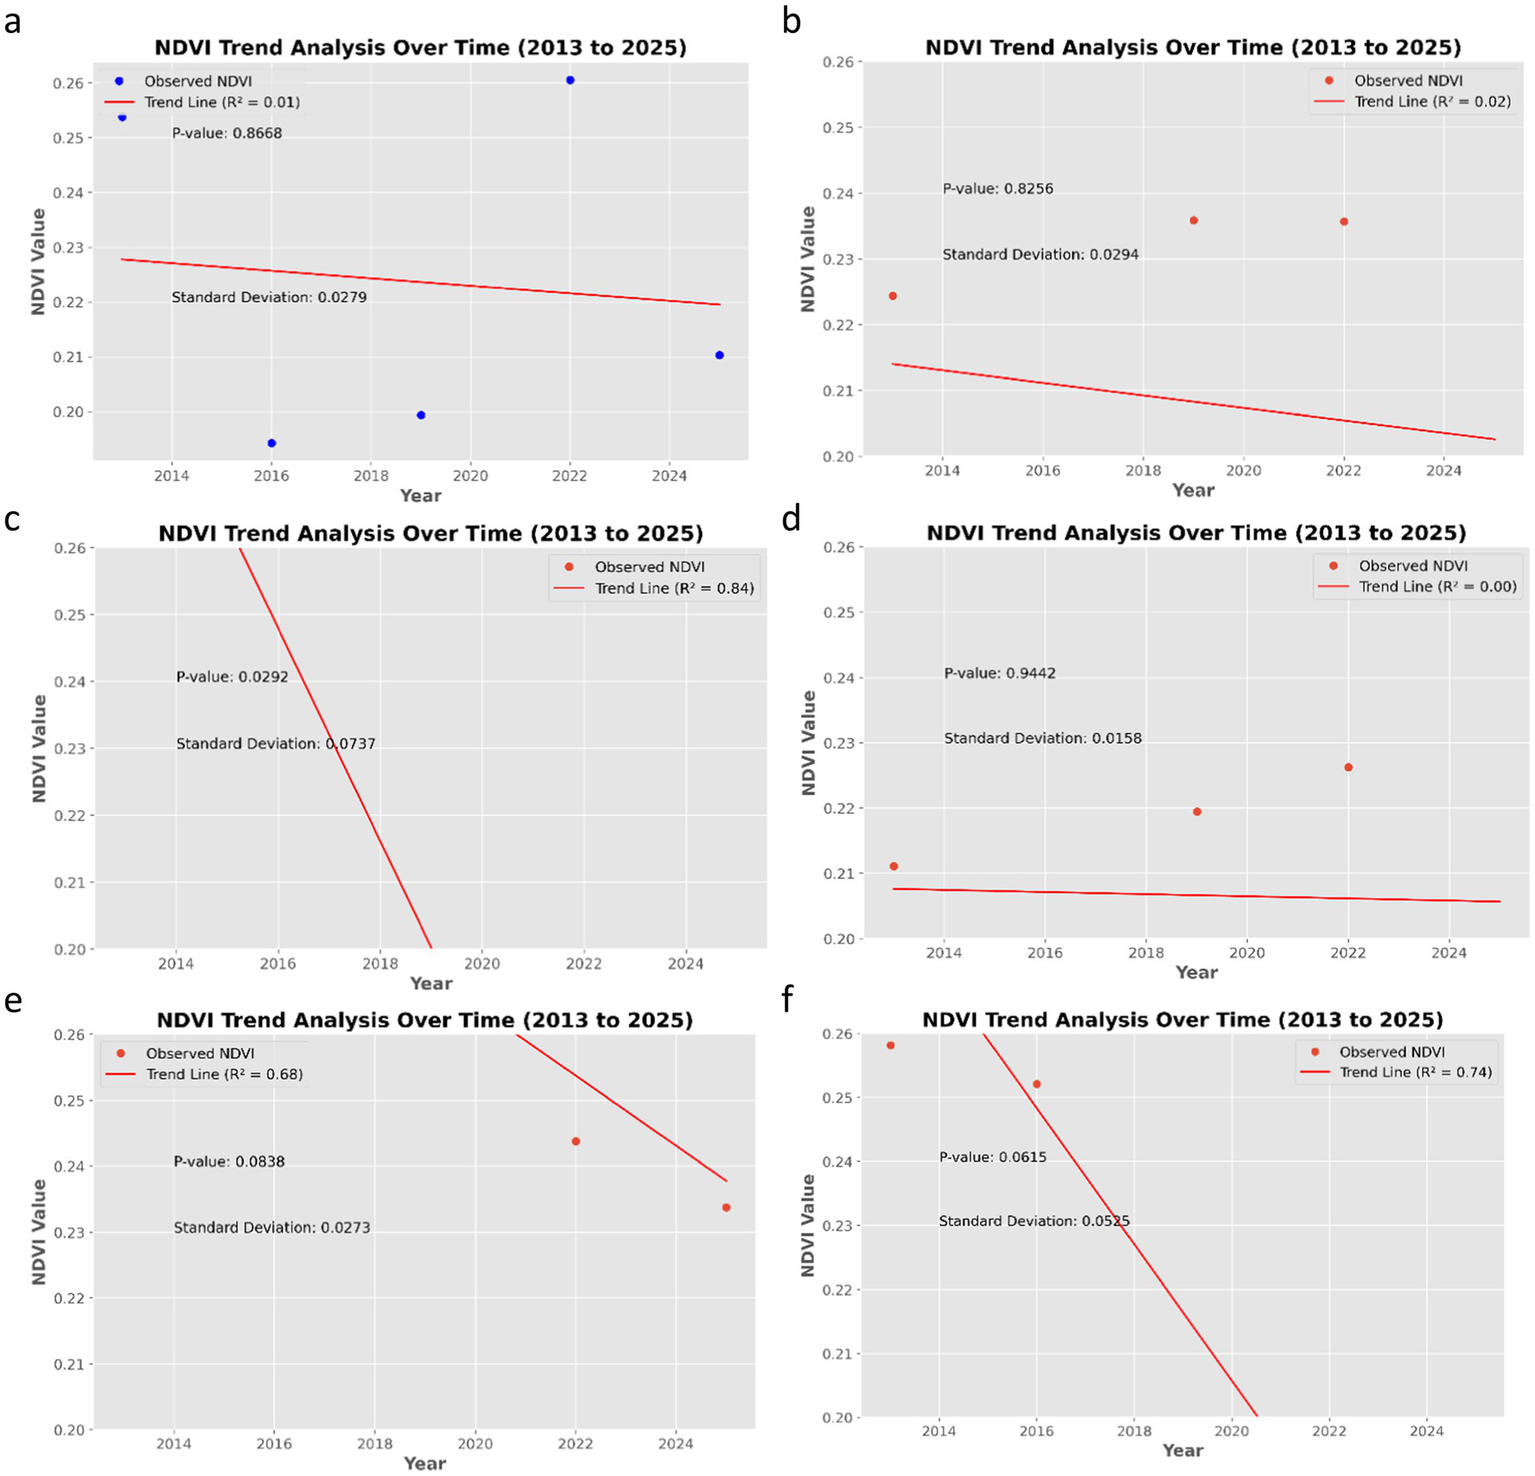
Correlation analysis of six forests and game reserves under Taraba States: (a) Ngel –Yaki, (b) Gashaka Gumti, (c) Baissat, (d) Gembu, (e) Kwazun, and (f) Kashimbila.
We analyzed the temporal trends in NDVI for six forests in Taraba State: Ngel-Yaki, Gashaka Gumti, Gembu, Baissat, Kwazun, and Kashimbila. For each forest, we calculated the annual mean NDVI across all pixels within the forest boundaries. The mean NDVI provides a representative measure of overall vegetation health for the entire forest area. To account for variability, we also computed the standard deviation (SD) of NDVI for each year, which reflects the spatial heterogeneity within the forest.
The trends were assessed using linear regression, where the independent variable was the year and the dependent variable was the annual mean NDVI. The strength and direction of the trend were quantified by the slope (m) and the correlation coefficient (r). The statistical significance of the trend was determined by the p-value (with p < 0.05 considered significant). The goodness of fit of the regression model was evaluated using the coefficient of determination (R2). The regression equation for each forest is:
Using this equation, we predicted the mean NDVI for the year 2028. The 95% confidence intervals for the predictions were also calculated to indicate the uncertainty (Equation 5).
Ngel-Yaki Forest (Figure 6a): The mean NDVI showed minimal change from 2013 to 2025 (slope = −0.00069, R = −0.1048 p = 0.866 R2 = 0.01). The standard deviation ranged from 0.02 to 0.03, indicating moderate spatial variability. The weak, non-significant negative correlation suggests that vegetation health has remained relatively stable. The predicted NDVI for 2028 is 0.2425 (95% CI, 0.2201–0.2649).
Gashaka Gumti (Figure 6b): Similarly, a weak negative trend was observed (slope = −0.00095, r = −0.13, p = 0.82, R2 = 0.02). The spatial variability (SD: 0.01–0.029) was consistent. The forest exhibited stable vegetation health. The predicted NDVI for 2028 is 0.2343 (95% CI, 0.2105–0.2581).
Baissat Forest (Figure 6c): A strong negative trend was found (slope = −0.01590, r = −0.91, p < 0.02, R2 = 0.837), indicating significant degradation. The predicted NDVI for 2028 is 0.6296.
Gembu (Figure 6d): This forest also displayed a weak negative trend (slope = −0.00016, r = −0.043, p = 0.94, R2 = 0.0019). The predicted NDVI for 2028 is 0.2111 (95% CI, 0.1902–0.2320).
Kwazun Forest: Strong negative trend (slope = −0.0053, r = −0.827, p = 0.0837, R2 = 0.684). The predicted NDVI for 2028 is 0.4136.
Kashimbila Forest: Strong negative trend (slope = −0.0106, r = −0.8600, p = 0.06512, R2 = 0.739). The predicted NDVI for 2028 is 0.5036.
Note: The slope indicates the annual change in mean NDVI. Negative slopes represent declining trends.
Although Ngel-Yaki, Gashaka Gumti, and Gembu show statistically non-significant trends (p > 0.05), their projected NDVI values for 2028 are below 0.25, which is considered a threshold for moderate vegetation health in this region. This suggests that even without a strong historical trend, these forests may be approaching critical low levels of vegetation health. Therefore, immediate conservation efforts are warranted.
In contrast, Baissat, Kwazun, and Kashimbila exhibit statistically significant and steep declines, indicating active degradation. These forests require urgent intervention (Table 6).
4.4 Gashaka Gumti National Park (GGNP)
Given the observed decline in vegetation within Gashaka-Gumti National Park (GGNP), we conducted an NDVI and NDRE correlation analysis from 2013 to 2015, focusing on the Red Edge band in NDRE to more accurately assess the park’s vegetation condition (Figures 7, 8).
Figure 7

Normalized different vegetation index in GGNP from 2013 to 2025.
Figure 8

Normalized different red edge in GGNP from 2013 to 2025.
The correlation between NDVI (Normalized Difference Vegetation Index) and NDRE (Normalized Difference Red Edge) from 2013 to 2025 provides valuable insights into the vegetation health and dynamics of Gashaka-Gumti National Park (GGNP). NDVI is widely used to assess vegetation cover and productivity. In contrast, NDRE is particularly sensitive to the red edge of the electromagnetic spectrum (Boiarskii and Hasegawa, 2019; Davidson et al., 2022; Eitel et al., 2011; Li et al., 2024), which helps distinguish between canopy and non-canopy species. This offers a more detailed understanding of vegetation health, especially in densely forested areas.
4.5 NDVI and NDRE correlation
The NDVI values for GGNP range from 0.74 to −0.15 in 2013, with fluctuations observed over the years. The overall trend shows a slight decline in mean NDVI values by 2025. Notably, the minimum NDVI values reached approximately −0.45 in 2025, which typically correspond to water bodies or non-vegetated surfaces. This suggests possible changes in water extent or increased exposure of non-vegetated areas within the park. Concurrently, NDRE values, which are more sensitive to vegetation health, fluctuated from 0.60 to −0.26 in 2013 and 0.57 to −0.33 in 2025. The decline in NDRE values, particularly the minimum values in 2025, signals potential degradation in the canopy layer and vegetation health. This degradation could be attributed to disturbances such as illegal logging, climate variability, or other anthropogenic activities affecting the park’s ecological integrity (Dong et al., 2025; Krivoguz, 2024).
Assessing NDVI and NDRE is crucial for understanding the long-term vegetation dynamics in GGNP. While NDVI gives a broad view of vegetation cover, NDRE offers more targeted insights into the health of the canopy and understory vegetation, making it a more effective tool for analyzing forest health, particularly in tropical environments like GGNP. Combining both indices makes differentiating between canopy species and non-canopy species easier, offering a more nuanced view of forest degradation and health. Moreover, assessing these indices over a long period from 2013 to 2025 (Figure 9) provides a detailed temporal analysis, revealing trends in vegetation health and potential areas of concern. This is especially important as GGNP is a biodiversity hotspot, and any changes in vegetation cover or forest structure could have significant implications for local species, ecosystem services, and the overall health of the park.
Figure 9
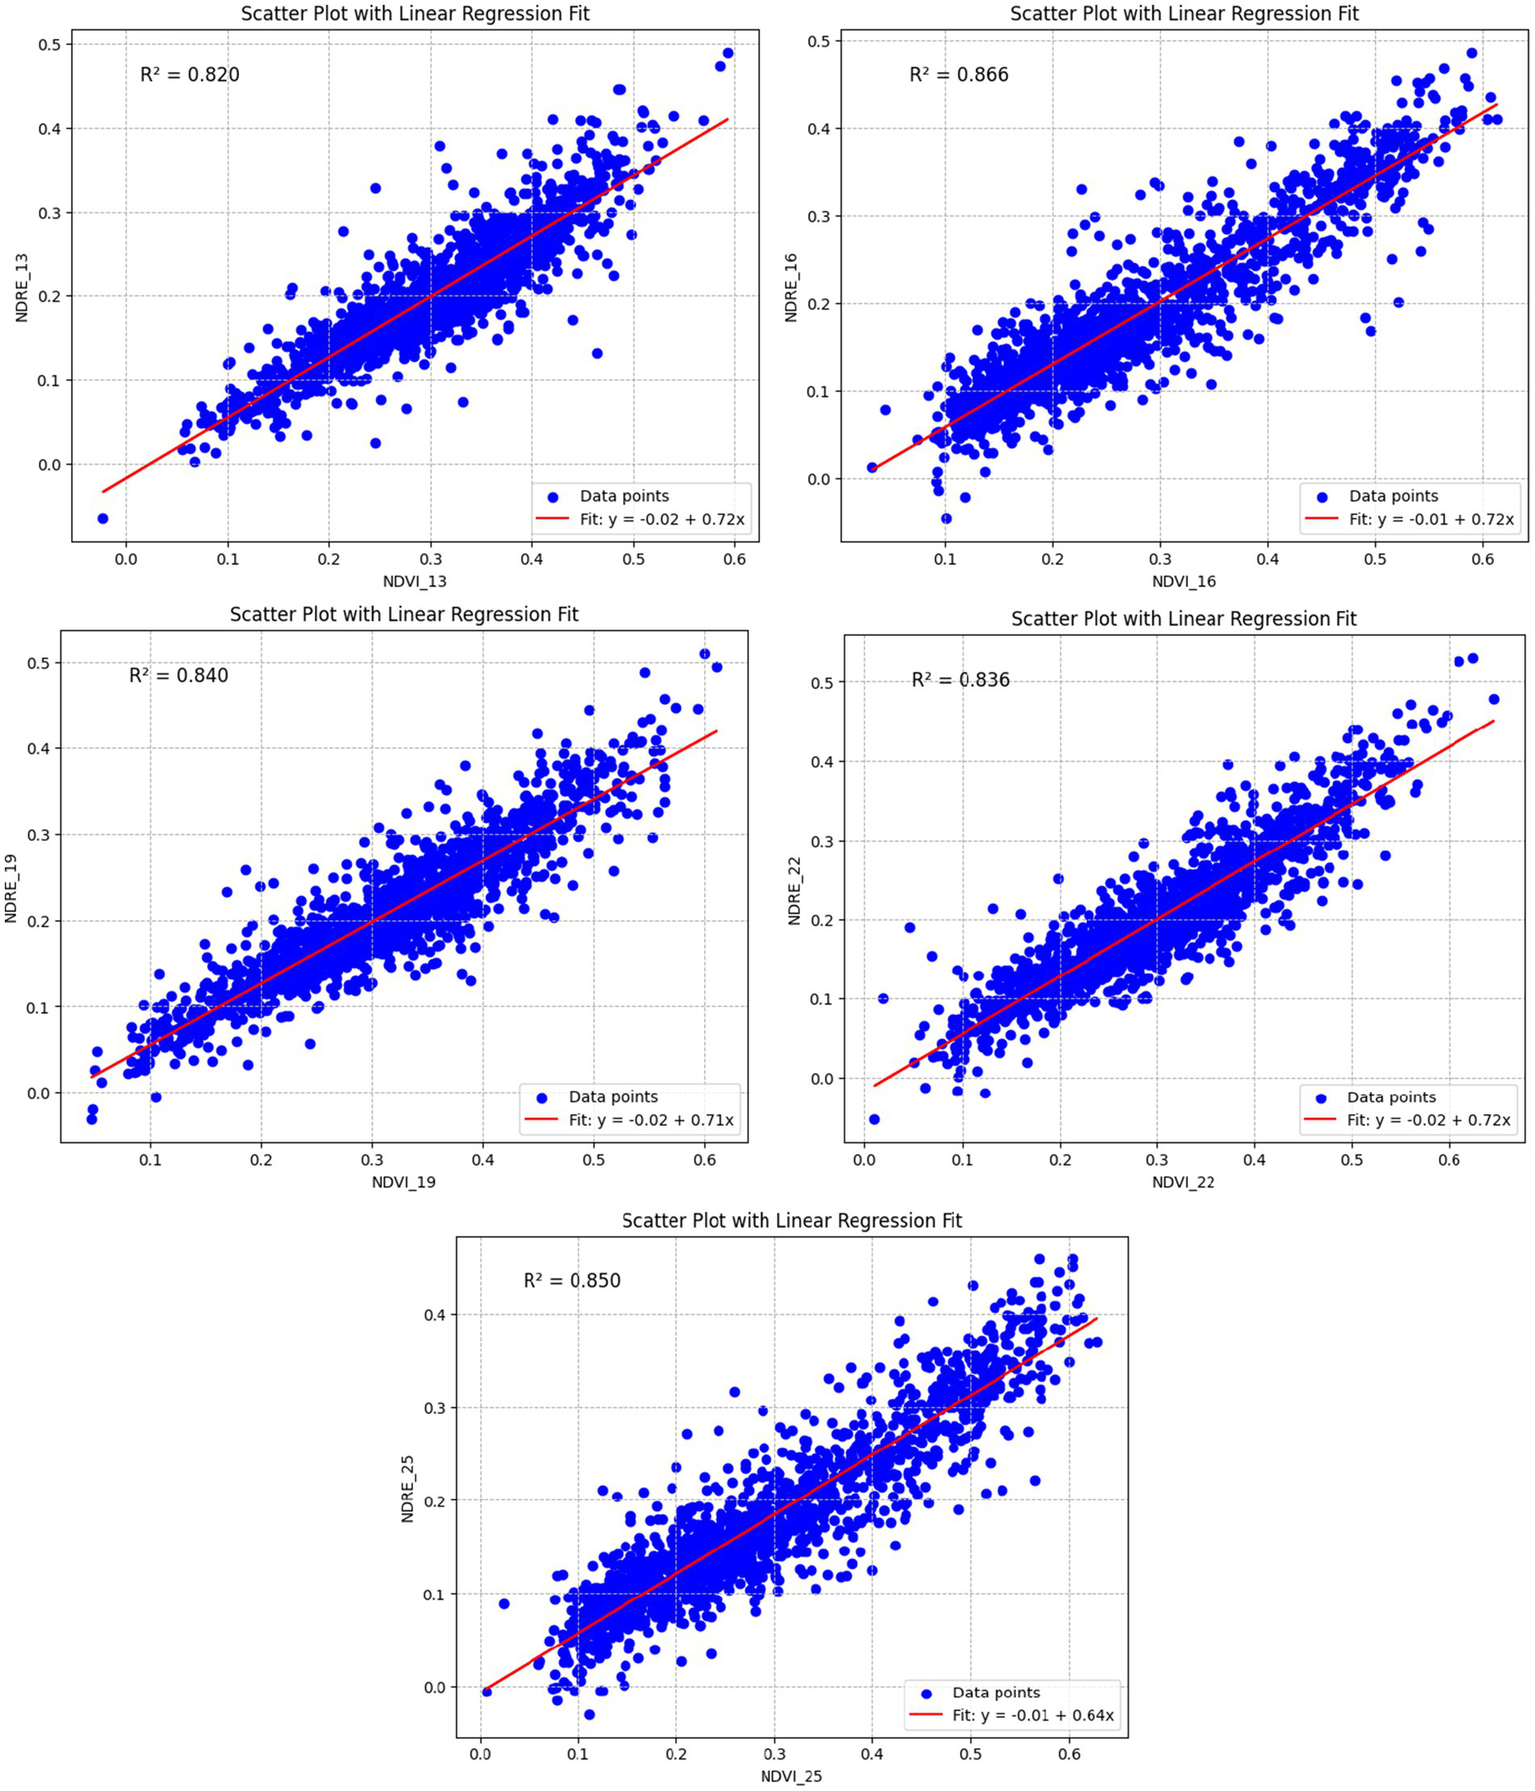
Correlation of NDVI and NDRE analysis of GGNP from 2013 to 2025.
Despite the increasing interest in Gashaka-Gumti National Park and its importance as a protected area, few studies have used NDRE in combination with NDVI for vegetation monitoring. This is likely due to the technical complexity of NDRE analysis and the limited availability of high-resolution satellite data. However, with advancements in satellite technology and the availability of high-resolution imagery (e.g., Sentinel-2), the use of NDRE has become more feasible, providing more accurate data on forest canopies and vegetation health, especially in dense forest environments.
Moreover, studies relying solely on NDVI may miss important nuances in canopy structure and health. NDVI tends to saturate dense vegetation areas, offering limited differentiation between canopy and understory vegetation. NDRE is better suited for this purpose as it detects subtle changes in the red edge spectrum, offering a more precise view of vegetation composition and health (Table 7).
Table 7
| Year | NDVI_Min | NDVI_Max | NDRE_Min | NDRE_Max |
|---|---|---|---|---|
| 2013 | −0.15 | 0.74 | −0.26 | 0.6 |
| 2016 | −0.13 | 0.73 | −0.27 | 0.6 |
| 2019 | −0.16 | 0.78 | −0.25 | 0.65 |
| 2022 | −0.17 | 0.78 | −0.26 | 0.65 |
| 2025 | −0.45 | 1 | −0.33 | 0.57 |
Annual NDVI and NDRE range for vegetation health assessment in GGNP (2013–2025).
4.6 Canopy and non-canopy species distributions
4.6.1 MaxEnt model evaluation for canopy species
The MaxEnt model predicted the potential distribution of canopy and non-canopy species within Taraba State, explicitly focusing on Gashaka-Gumti National Park (GGNP). The model integrates environmental variables, including bioclimatic factors Bio 1–10 to Bio12-19 (temperature and precipitation), to assess habitat suitability for different species over time.
The MaxEnt model results for the canopy species are illustrated in Figure 10 above, which includes model performance metrics and response to environmental variables.
-
Cumulative Threshold vs. Fractional Value:
Figure 10
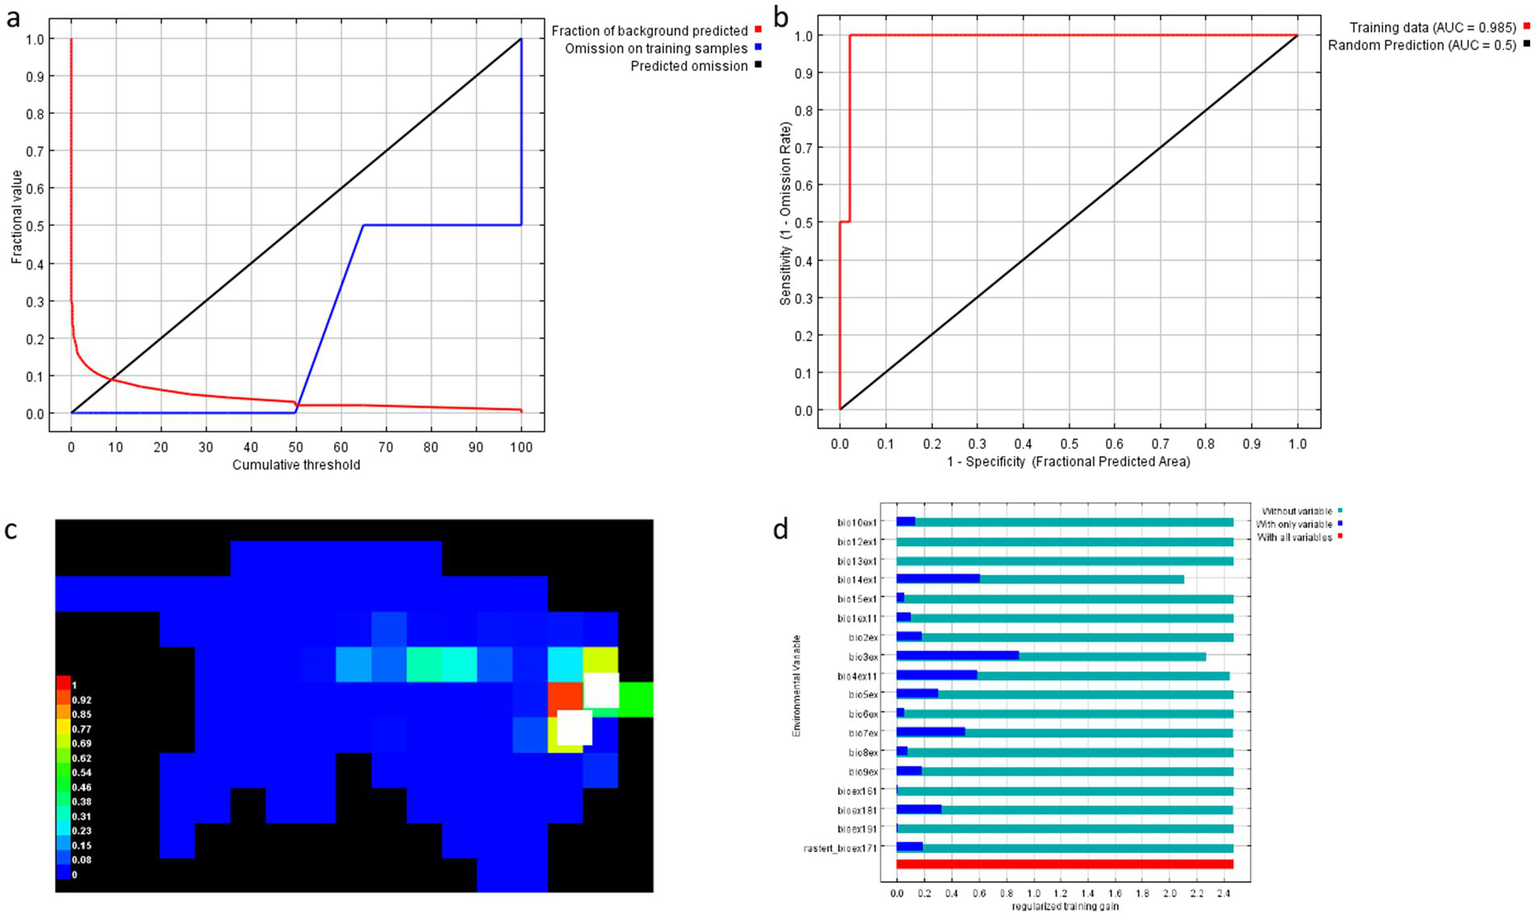
The MaxEnt model results for the canopy species. (a) Cumulative threshold vs. fractional. (b) Sensitivity vs. 1-specificity: value. (c) Predicted suitability map. (d) Variable contribution to model performance.
This plot shows the relationship between the cumulative threshold and the fractional value of background predicted and omission on training samples. A sharp rise in the red curve (representing omission on training samples) indicates that the model initially struggles to correctly classify the presence of canopy species, with omission rates decreasing significantly as the threshold increases. This suggests that training the model with more data improves its ability to predict the habitat suitability for canopy species.
-
Sensitivity vs. 1-Specificity:
This is the Receiver Operating Characteristic (ROC) curve, showing the sensitivity (True Positive Rate) against the false positive rate (1-specificity). The training data curve shows a high AUC (0.985) (Chou et al., 2021), indicating that the MaxEnt model performs exceptionally well in distinguishing between suitable and unsuitable habitats for the canopy species. The black curve, representing random prediction, has an AUC of 0.5, which is expected as a random model would produce no meaningful predictions. The high AUC value confirms that the model is highly reliable for predicting the distribution of canopy species.
-
Predicted Suitability Map:
This habitat suitability map shows the spatial distribution of suitable habitats for canopy species across the study area. The colour gradient ranges from blue (low suitability) to red (high suitability). Areas with high suitability are concentrated in forest areas with adequate precipitation and temperature stability, which are critical for canopy species. This map provides valuable spatial insights into where conservation efforts should be focused, as areas with high suitability will likely be the primary habitats for canopy species.
-
Variable Contribution to Model Performance:
The bar chart illustrates the contribution of each environmental variable to the model’s performance, shown by regulated training gain. The red bars indicate the importance of all variables, while the blue bars represent the importance when individual variables are included in the model. Variables like precipitation, temperature, and bioclimatic factors (BIO1-10 to BIO 12-BIO19) have the most substantial influence on the model’s ability to predict habitat suitability for canopy species. This analysis suggests that canopy species in the study area depend highly on specific climatic conditions, with Isothermality/_C playing a key role in determining suitable habitats.
The response curve for BIO3 (Figure 11) shows a sharp increase in suitability as the Isothermality value rises, suggesting that canopy species prefer regions with more stable temperatures throughout the year. This aligns with the fact that canopy species generally thrive in stable climates with minimal temperature extremes, which supports forest growth (Nakamura et al., 2017). BIO7 (Temperature Annual Range): The curve for BIO7 demonstrates a sharp decline in habitat suitability as the temperature range increases. This suggests that canopy species are more suited to regions with low-temperature variability. High-temperature extremes likely reduce their habitat suitability, as they are sensitive to drastic shifts in temperature (Figure 12).
Figure 11

Response curve 1—bio-climatic variables in response to habitat suitability for canopy tree species in GGNP.
Figure 12

Response curve 2—bio-climatic variables in response to habitat suitability for canopy tree species in GGNP.
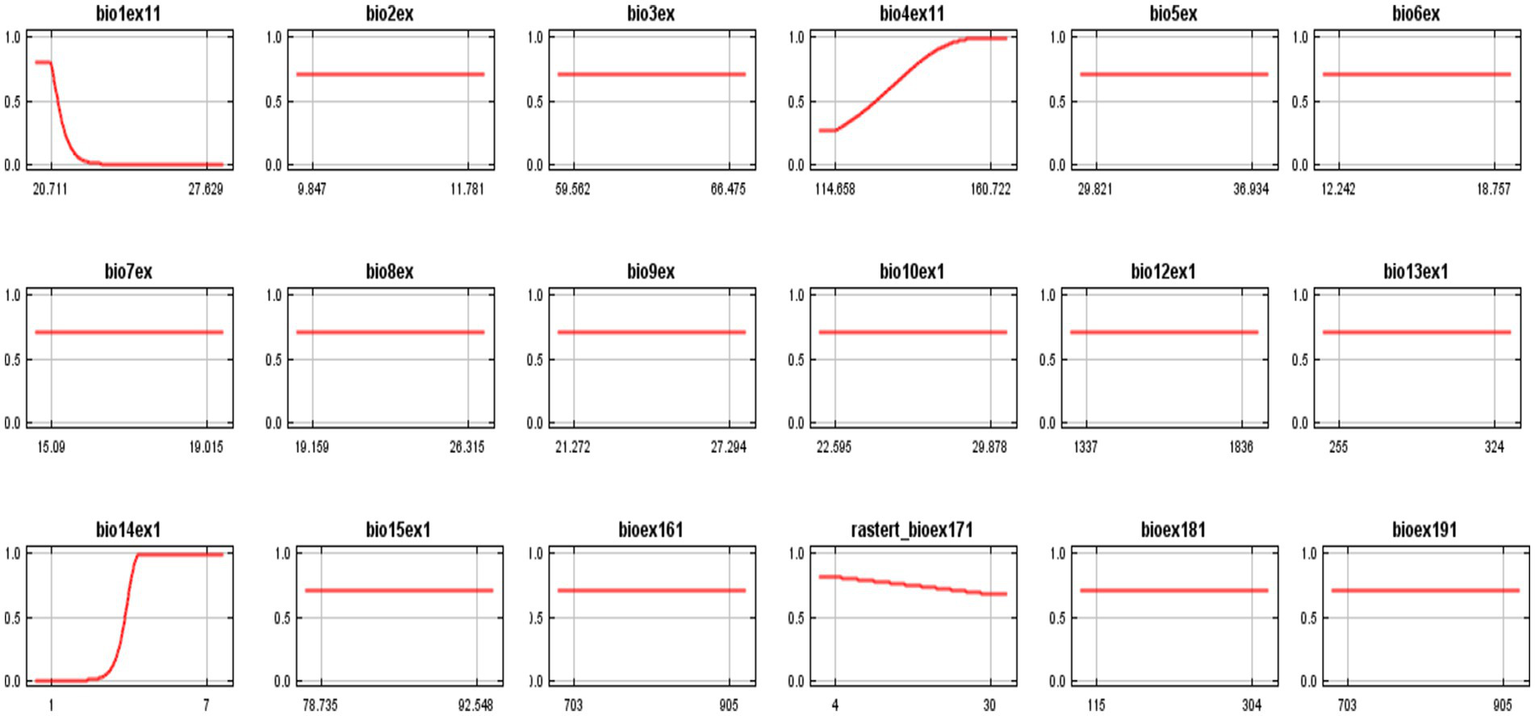
The response curve for BIO14 indicates that canopy species show high suitability in regions with consistent, substantial rainfall during the wettest months. This reinforces the dependency of canopy species on water availability for growth and survival. BIO16 (Precipitation of Wettest Quarter): Similar to BIO14, the curve for BIO16 shows that increased precipitation in the wettest quarter increases habitat suitability for canopy species, confirming the importance of regular rainfall for forest health. The other variables, such as BIO2 (Mean Diurnal Temperature Range), BIO9 (Precipitation of Driest Month), and BIO15 (Precipitation Seasonality), show minimal influence on the model, as reflected in the flat response curves. This suggests that these variables do not significantly affect the habitat suitability for canopy species in Taraba State.
The second set of response curves offers insights into environmental factors affecting canopy species distribution. Unlike the first set, which focuses on temperature and precipitation, this set examines factors like temperature seasonality and specific precipitation patterns (e.g., wettest quarter and driest month). These elements are essential for understanding how canopy species adapt to seasonal temperature and water availability changes, which are critical for their growth and survival.
For instance, the response curve for BIO4 (Temperature Seasonality) indicates that canopy species thrive in areas with lower fluctuations in seasonal temperatures. This distinction was not emphasized in the initial set of curves. Similarly, the BIO14 (Precipitation of Wettest Month) curve illustrates that canopy species favor regions with stable rainfall during the wet season, a critical factor for sustaining healthy forest cover. These additional variables offer a more nuanced understanding of the environmental conditions that support canopy species, particularly in areas facing fluctuating climate conditions.
The second set is important because it addresses the seasonal dynamics that influence canopy species, which are often overlooked in broader environmental assessments. Integrating these additional variables makes the model more robust, offering insights vital for targeted conservation efforts. While the first set provides a general overview of the key climate factors, the second set deepens the analysis by considering the more specific temporal and spatial variations that significantly impact forest ecosystems.
The second set of response curves is essential for offering a more comprehensive and refined model of canopy species distribution. It complements the first set by focusing on seasonal temperature and precipitation variables, ultimately helping to guide more precise forest conservation strategies.
4.6.2 MaxEnt model evaluation for canopy species
The MaxEnt model was also applied to the non-canopy species to understand how various bioclimatic variables influence their habitat suitability. The following interpretation discusses the results shown in the response curves (Figures 13–15), highlighting the key environmental variables affecting the distribution of non-canopy species.
Figure 13

The MaxEnt model results for the non-canopy species. (a) Cumulative threshold vs. fractional. (b) Sensitivity vs. 1-specificity: value. (c) Predicted suitability map. (d) Variable contribution to model performance.
Figure 14
Response curve 1—bio-climatic variables in response to habitat suitability for non-canopy species in GGNP.
Figure 15

Response curve 2—bio-climatic variables in response to habitat suitability for non-canopy species in GGNP.
The ROC curve (Figure 13) shows that the model’s performance demonstrates a high AUC value of 0.985 for training data. This suggests that the model reliably predicts the habitat suitability for non-canopy species, significantly outperforming random predictions (AUC = 0.5). A higher AUC indicates a better ability of the model to discriminate between suitable and unsuitable areas for the species. The bar graph provides insights into the relative importance of each environmental variable. It was observed that most of the bio-climatic variables show considerable effects in non-canopy species (Figure 13d). It shows that BIO10 (Mean temp), BIO1 (Annual mean air temp), and BIO8 (mean temperature of wettest quarter) are the most influential predictors, with BIO12 showing the precipitation gain. This means that non-canopy species are most sensitive to temperature stability and precipitation patterns, which are critical in shaping their distribution.
The suitability map in Figure 13c shows areas with the highest habitat suitability for non-canopy species based on the environmental variables considered. Areas with low to moderate temperature fluctuations and consistent rainfall are identified as the most suitable for non-canopy species, which aligns with the response curves indicating their preference for stable climatic conditions.
Non-canopy species demonstrate a high suitability across various environmental conditions. They adapt well to a wide range of annual mean temperatures (BIO1) and prefer regions with lower diurnal temperature variation (BIO2) and low-temperature seasonality (BIO4). Their adaptability is also evident in their tolerance to moderate Isothermality (BIO3) and a necessity for consistent moisture, as seen in their higher suitability with moderate precipitation during the wettest quarter (BIO6) and higher precipitation during the driest quarter (BIO9). Furthermore, they thrive in areas with adequate annual and monthly rainfall (BIO12 and BIO14) while slightly decreasing suitability with increasing environmental interaction complexity (BIO17).
The response curves −2 for various environmental factors indicate that non-canopy species are susceptible to temperature and moisture conditions. For BIO1 (Annual Mean Temperature), habitat suitability sharply declines beyond 20 °C, while BIO2 (Mean Diurnal Temperature Range) shows high suitability only with moderate temperature fluctuations. Habitat suitability increases with Isothermality (BIO3) and decreases with temperature seasonality (BIO4), reflecting a preference for stable conditions. Non-canopy species thrive under varying rainfall during the wettest quarter (BIO6) but become increasingly vulnerable to low precipitation in the driest period (BIO9). Additionally, they favor moderate to high annual rainfall (BIO12) and significant moisture during the wettest month (BIO14). Finally, BIO17 indicates a slight increase in habitat suitability with environmental interactions, emphasizing the interplay between soil moisture and temperature.
5 Conclusion
This study provides valuable insights into the distribution and habitat suitability of both canopy and non-canopy species in Taraba State, Nigeria, using remote sensing data (NDVI, NDRE) and species distribution modeling (MaxEnt). The findings reveal the significant impact of climatic variables on forest ecosystems, particularly in areas affected by climate change, deforestation, and land-use changes. Our analysis of NDVI and NDRE data from 2013 to 2025 highlights distinct trends in vegetation health, showing how canopy and non-canopy species respond differently to environmental stressors.
For canopy species, temperature seasonality and precipitation patterns emerged as the most influential factors determining their distribution. In contrast, non-canopy species were more sensitive to precipitation during the driest periods and temperature extremes. These species-specific responses emphasize the importance of understanding the nuanced effects of environmental conditions on forest health. Similar studies in other regions, such as those conducted in tropical rainforests (Phillips et al., 2006) and temperate (Yang et al., 2024) have also observed temperature and precipitation as critical drivers of species distribution, further supporting our findings. Our study contributes to this body of research by providing context-specific data for the forests of Taraba State, offering a comprehensive look at the intersection of climate and vegetation health in West Africa.
The MaxEnt modeling results further elucidate the habitat suitability of both species groups, highlighting rainfall and temperature as key bioclimatic factors for both canopy and non-canopy species. Seasonal variations in these factors were particularly significant for non-canopy species, whose habitat suitability sharply declined during the dry season with increasing temperature and decreasing moisture. This finding highlights the vulnerability of non-canopy species to climate fluctuations and their reliance on consistent moisture and temperature stability. Similar trends have been observed in studies on species distributions in arid and semi-arid ecosystems (Tabari et al., 2012) reinforcing the broader applicability of our results.
The study also identified critical areas such as the forests of Ngel-Yaki, GGNP, and Gembu that exhibit declining vegetation health and high vulnerability to deforestation and climate stress. These areas require immediate conservation and restoration efforts, particularly in light of the climate projections for 2028. The robustness of the MaxEnt model, as demonstrated by its AUC values and response curves, highlights its potential as a powerful tool for forest conservation, particularly for predicting species distribution in the face of environmental change.
5.1 Limitations
However, there are limitations to this study. The reliance on a thirteen-year dataset restricts our ability to assess long-term trends, and the spatial resolution of the satellite imagery may not capture finer-scale vegetation changes in highly dense forests. Additionally, the use of bioclimatic variables alone does not account for other ecological factors, such as soil quality and topography, that influence species distribution. Future research could integrate these factors, along with higher-resolution satellite data, to improve the accuracy of species distribution models.
Looking ahead, it would be valuable to incorporate future bioclimatic forecasts into species distribution models to develop potential scenarios for vegetation shifts in response to climate change. This would broaden the scope of the research, enabling long-term management and planning for forest ecosystems in Taraba State and similar regions. By forecasting future trends in species distributions, such studies could help inform climate adaptation strategies, policy decisions, and land management practices aimed at ensuring the sustainability of forest ecosystems in the face of ongoing environmental changes.
In conclusion, this study makes a significant contribution to our understanding of the distribution and health of both canopy and non-canopy species in Taraba State. The findings offer critical insights for forest monitoring, biodiversity conservation, and climate adaptation strategies in northern Nigeria. By providing a clearer picture of how climate change impacts these ecosystems, this research can guide future conservation efforts and improve land management practices to safeguard the long-term sustainability of forest ecosystems in the region.
Statements
Data availability statement
The raw data supporting the conclusions of this article will be made available by the authors, without undue reservation.
Author contributions
IY: Data curation, Formal analysis, Methodology, Software, Writing – original draft. CW: Investigation, Funding acquisition, Writing – review & editing. CO: Conceptualization, Investigation, Writing – review & editing. MY: Investigation, Validation, Writing – review & editing.
Funding
The author(s) declare that financial support was received for the research and/or publication of this article. This work was supported by the National Key R&D Program of China under grant number 2022YFB3903304 and the National Natural Science Foundation of China under grant number 42471422.
Conflict of interest
The authors declare that the research was conducted in the absence of any commercial or financial relationships that could be construed as a potential conflict of interest.
Generative AI statement
The authors declare that no Gen AI was used in the creation of this manuscript.
Any alternative text (alt text) provided alongside figures in this article has been generated by Frontiers with the support of artificial intelligence and reasonable efforts have been made to ensure accuracy, including review by the authors wherever possible. If you identify any issues, please contact us.
Publisher’s note
All claims expressed in this article are solely those of the authors and do not necessarily represent those of their affiliated organizations, or those of the publisher, the editors and the reviewers. Any product that may be evaluated in this article, or claim that may be made by its manufacturer, is not guaranteed or endorsed by the publisher.
Footnotes
1.^ https://earthexplorer.usgs.gov/
2.^ https://scihub.copernicus.eu/dhus
3.^ https://www.worldclim.org, accessed on 22 March 2025.
References
1
Abba U. J. Taiye A. Bakoji Y. M. Mohammed B. B. Umar A. A. Abdullahi I. et al . (2021). GIS and remote sensing analysis of the impact of land use land cover change on forest degradation: evidence from the central part of Taraba state, Nigeria. J. Geogr. Environ. Earth Sci. Int25, 27–39. doi: 10.9734/jgeesi/2021/v25i1130318
2
Abiem I. Kenfack D. Chapman H. M. (2023). Assessing the impact of abiotic and biotic factors on seedling survival in an African montane forest. Front. For. Glob. Change6:1108257. doi: 10.3389/ffgc.2023.1108257
3
Abolmaali S. M.-R. Tarkesh M. Bashari H. (2018). MaxEnt modeling for predicting suitable habitats and identifying the effects of climate change on a threatened species, Daphne mucronata, in Central Iran. Eco. Inform.43, 116–123. doi: 10.1016/j.ecoinf.2017.10.002
4
Adebayo A. Oruonye E. D. (2013). An assessment of climate change in Taraba state. Nigeria: Nigeria Journal of Tropical Geography.
5
Adedibu P. A. Opeyemi A. A. Lawrence A. J. Paul J. I. Oguntoye E. (2022). Savanna biomes in Nigeria: Indicatzor species and plant adaptation strategies. Berlin, Germany: ScienceOpen Preprints.
6
Adelabu S. Mutanga O. Adam E. (2014). Evaluating the impact of red-edge band from Rapideye image for classifying insect defoliation levels. ISPRS J. Photogramm. Remote Sens.95, 34–41. doi: 10.1016/j.isprsjprs.2014.05.013
7
Adenle A. A. Ifejika Speranza C. (2020). Social-ecological archetypes of land degradation in the Nigerian Guinea Savannah: insights for sustainable land management. Remote Sens13:32. doi: 10.3390/rs13010032
8
Aiello-Lammens M. E. Boria R. A. Radosavljevic A. Vilela B. Anderson R. P. (2015). spThin: an R package for spatial thinning of species occurrence records for use in ecological niche models. Ecography38, 541–545. doi: 10.1111/ecog.01132
9
Akbar M. Arisanto P. Sukirno B. Merdeka P. Priadhi M. Zallesa S. (2020). Mangrove vegetation health index analysis by implementing NDVI (normalized difference vegetation index) classification method on sentinel-2 image data case study: Segara Anakan, Kabupaten Cilacap. IOP Conf. Series Earth Environ. Sci.584:012069. doi: 10.1088/1755-1315/584/1/012069
10
Arum K. C. Ndukwe S. C. Oranye H. E. Sule O. B. (2025). Comparative analysis of ridge and principal component regression in addressing multicollinearity. FUDMA J. Sci.9, 240–245. doi: 10.33003/fjs-2025-0901-2981
11
Bako T. Oparaku L. Flayin J. (2016). The environmental issues of Taraba state. Int. J. Sci. Eng. Res.7, 286–294. Available online at: https://www.academia.edu/download/53544718/THE-ENVIRONMENTAL-ISSUES-OF-TARABA-STATE1.pdf
12
Boiarskii B. Hasegawa H. (2019). Comparison of NDVI and NDRE indices to detect differences in vegetation and chlorophyll content. J. Mech. Contin. Math. Scispl 1, 20–29. doi: 10.26782/jmcms.spl.4/2019.11.00003
13
Carle H. J. (2023). Complexities of carbon, traits and tree performance in tropical Forest. Australia: The Australian National University.
14
Chang-Hua J. Yong-Chao T. Xia Y. Wei-Xing C. Yan Z. (2010). Estimating leaf chlorophyll content using red edge parameters. Pedosphere20, 633–644. doi: 10.1016/S1002-0160(10)60053-7
15
Chapman H. M. Olson S. M. Trumm D. (2004). An assessment of changes in the montane forests of Taraba state, Nigeria, over the past 30 years. Oryx38, 282–290. doi: 10.1017/S0030605304000511
16
Chatterjee S. Hadi A. S. (2015). Regression analysis by example (5th edn). Hoboken, NJ: John Wiley & Sons.
17
Chou T.-H. Yeh H.-J. Chang C.-C. Tang J.-H. Kao W.-Y. Su I.-C. et al . (2021). Deep learning for abdominal ultrasound: A computer-aided diagnostic system for the severity of fatty liver. J. Chin. Med. Assoc.84, 842–850. doi: 10.1097/JCMA.0000000000000585
18
Chu T. Guo X. (2013). Remote sensing techniques in monitoring post-fire effects and patterns of forest recovery in boreal forest regions: A review. Remote Sens6, 470–520. doi: 10.3390/rs6010470
19
da Silva V. S. Salami G. da Silva M. I. O. Silva E. A. Monteiro Junior J. J. Alba E. (2019). Methodological evaluation of vegetation indexes in land use and land cover (LULC) classification. Geol. Ecol. Landscapes4, 159–169. doi: 10.1080/24749508.2019.1608409
20
Danladi T. E. Oruonye E. Babanyaya B. Tebrimam G. C. Anger R. (2025). An assessment of local community perception of effects of Landuse land cover change (LULCC) on biodiversity in Taraba central Senatorial District Taraba state Nigeria. Jalingo J. Soc. Manag. Sci.6, 219–231. Available online at: https://oer.tsuniversity.edu.ng/index.php/jjsms/article/view/861/636
21
Danung I. J. Ategbe D. Usman A. A. Uthman I. B. (2025). Temporal LANDUSE change along two road infrastructure: A comparative analysis of YAKOWA and YAR’ADUA ways, KADUNA metropolis, Nigeria. Int. J. Built Environ. Earth Sci.7. doi: 10.70382/tijbees.v07i4.034
22
Darvishzadeh R. Wang T. Skidmore A. Vrieling A. O’Connor B. Gara T. W. et al . (2019). Analysis of Sentinel-2 and RapidEye for retrieval of leaf area index in a saltmarsh using a radiative transfer model. Remote Sens11:671. doi: 10.3390/rs11060671
23
Davidson C. Jaganathan V. Sivakumar A. N. Czarnecki J. M. P. Chowdhary G. (2022). NDVI/NDRE prediction from standard RGB aerial imagery using deep learning. Comput. Electron. Agric.203:107396. doi: 10.1016/j.compag.2022.107396
24
Delegido J. Verrelst J. Alonso L. Moreno J. (2011). Evaluation of sentinel-2 red-edge bands for empirical estimation of green LAI and chlorophyll content. Sensors11, 7063–7081. doi: 10.3390/s110707063
25
Dong D. Zhang R. Guo W. Gong D. Zhao Z. Zhou Y. et al . (2025). Assessing spatiotemporal dynamics of net primary productivity in Shandong Province, China (2001–2020) using the CASA model and Google earth engine: trends, patterns, and driving factors. Remote Sens17:488. doi: 10.3390/rs17030488
26
Durrieu S. Vega C. Bouvier M. Gosselin F. Renaud J.-P. Saint-André L. et al . (2024). “Optical remote sensing of tree and stand heights” in Remote Sensing Handbook, Volume IV. Ed. P. S. Thenkabai (Boca Raton, FL: CRC Press), 125–188.
27
Easterday K. Kislik C. Dawson T. E. Hogan S. Kelly M. (2019). Remotely sensed water limitation in vegetation: insights from an experiment with unmanned aerial vehicles (UAVs). Remote Sens.11:1853. doi: 10.3390/rs11161853
28
Ecke S. Dempewolf J. Frey J. Schwaller A. Endres E. Klemmt H.-J. et al . (2022). UAV-based forest health monitoring: A systematic review. Remote Sens.14:3205. doi: 10.3390/rs14133205
29
Eitel J. U. Vierling L. A. Litvak M. E. Long D. S. Schulthess U. Ager A. A. et al . (2011). Broadband, red-edge information from satellites improves early stress detection in a new Mexico conifer woodland. Remote Sens. Environ.115, 3640–3646. doi: 10.1016/j.rse.2011.09.002
30
Elith J. Phillips S. J. Hastie T. Dudík M. Chee Y. E. Yates C. J. (2011). A statistical explanation of MaxEnt for ecologists. Divers. Distrib.17, 43–57. doi: 10.1111/j.1472-4642.2010.00725.x
31
Erbaugh J. T. Oldekop J. A. (2018). Forest landscape restoration for livelihoods and well-being. Curr. Opin. Environ. Sustain.32, 76–83. doi: 10.1016/j.cosust.2018.05.007
32
Ernst C. Mayaux P. Verhegghen A. Bodart C. Christophe M. Defourny P. (2013). National forest cover change in Congo Basin: deforestation, reforestation, degradation and regeneration for the years 1990, 2000 and 2005. Glob. Chang. Biol.19, 1173–1187. doi: 10.1111/gcb.12092
33
FAO . (2020). The State of World Fisheries and Aquaculture 2020: Sustainability in Action. Food and Agriculture Organization of the United Nations. doi: 10.4060/ca9229en
34
FAO and UNEP . (2020). “The State of the World’s Forests 2020: Forests, Biodiversity and People”. in Food and Agriculture Organization of the United Nations and United Nations Environment Programme. doi: 10.4060/ca8642en
35
Fick S. E. Hijmans R. J. (2017). WorldClim 2: new 1-km spatial resolution climate surfaces for global land areas. Int. J. Climatol.37, 4302–4315. doi: 10.1002/joc.5086
36
Franzese M. Iuliano A. (2018). “Correlation analysis” in Encyclopedia of bioinformatics and computational biology: ABC of bioinformatics. Vol. 1. Eds. S. Ranganathan, M. Gribskov, K. Nakai and C. Schönbach (Oxford, UK: Elsevier), 706–721.
37
Gabriel T. A. Abdullahi I. Joseph A. E. (2018). Rainfall variation, water resources potential and implication for flooding: A case study of catchment area of major tributaries to River Benue in Taraba state. African J. Eng. Res.6, 55–63. doi: 10.30918/AJER.63.18.028
38
Garkida D. M. David D. L. Danburam H. J. (2024). The diversity, abundance and distribution of butterfly species in GASHAKA GUMTI national park, TARABA STATE, Nigeria. IJCRLS. 11, 24–33. doi: 10.5281/zenodo.14282407
39
GBIF.org . (2025). GBIF occurrence download [Data set]. Copenhagen, Denmark: GBIF Secretariat. doi: 10.15468/dl.e93w6v
40
Gitelson A. A. Viña A. Ciganda V. Rundquist D. C. Arkebauer T. J. (2005). Remote estimation of canopy chlorophyll content in crops. Geophys. Res. Lett.32:688. doi: 10.1029/2005GL022688
41
Glennie E. Anyamba A. (2018). Midwest agriculture and ENSO: A comparison of AVHRR NDVI3g data and crop yields in the United States Corn Belt from 1982 to 2014. Int. J. Appl. Earth Obs. Geoinf.68, 180–188. doi: 10.1016/j.jag.2017.12.011
42
Gorte R. W. Sheikh P. A. (2010). “Deforestation and climate change (CRS Report R41144). (Washington, DC: Congressional Research Service, Library of Congress).
43
Gosling W. D. Miller C. S. Livingstone D. A. (2013). Atlas of the tropical west African pollen flora. Rev. Palaeobot. Palynol.199, 1–135. doi: 10.1016/j.revpalbo.2013.01.003
44
Gupta L. Dixit J. Pandey P. C. Pandey M. (2025). Assessment of forest cover dynamics for the detection of deforestation in the Hindu Kush Himalayan region using geospatial and machine learning approaches. Earth Sci. Inf.18:160. doi: 10.1007/s12145-024-01517-x
45
Hamada Y. Zumpf C. R. Quinn J. J. Negri M. C. (2023). Estimating field-level perennial bioenergy grass biomass yields using the normalized difference red-edge index and linear regression analysis for Central Virginia, USA. Energies16:7397. doi: 10.3390/en16217397
46
Hansen M. C. Potapov P. V. Moore R. Hancher M. Turubanova S. A. Tyukavina A. et al . (2013). High-resolution global maps of 21st-century forest cover change. Science342, 850–853. doi: 10.1126/science.1244693
47
Haq F. Mark B. G. Shum C. Zeballos-Castellon G. Rahman G. (2024). Effectiveness of billion trees tsunami afforestation projects in restoration of forests in Pakistan. Environ. Dev. Sustain.2024, 1–16. doi: 10.1007/s10668-024-04573-x
48
Harrell F. E. (2001). Regression modeling strategies (Vol. 54). New York, NY: Springer.
49
Hogarth N. J. Belcher B. Campbell B. Stacey N. (2013). The role of Forest-related income in household economies and rural livelihoods in the border-region of southern China. World Dev.43, 111–123. doi: 10.1016/j.worlddev.2012.10.010
50
Hosonuma N. Herold M. De Sy V. De Fries R. S. Brockhaus M. Verchot L. et al . (2012). An assessment of deforestation and forest degradation drivers in developing countries. Environ. Res. Lett.7:044009. doi: 10.1088/1748-9326/7/4/044009
51
Ibrahim I. Wang Y. Umar D. Ibrahim B. Ogbue C. Abubakar Y. et al . (2024). Applying ADVANCED spatial analysis methods to develop A scientifically robust anticipatory framework for forecasting desertification patterns in JAHUN, JIGAWA STATE, Nigeria. Appl. Ecol. Environ. Res.22, 3641–3676. doi: 10.15666/aeer/2204_36413676
52
Ibrahim I. Wang Y. Zhou N. Ibrahim B. Umar D. You Y. et al . (2023). Assessment of remote sensing on deforestation of economic tree species in Wudil, Kano State, Nigeria. Appl. Ecol. Environ. Res.21, 4445–4474. doi: 10.15666/aeer/2105_44454474
53
Ijafiya D. J. Bawa B. Gyalison N. (2023). SPATIO-temporal assessment of land use/land cover change and its implications on Donga River Basin, Taraba state, Nigeria. FUDMA J. Sci.7, 224–231. doi: 10.33003/fjs-2023-0703-1838
54
James P. H. (2019). Feed the future innovation lab for food security policy. East Lansing, MI: Michigan State University.
55
James P. H. Ngala A. L. (2015). Survey on soil conservation practices among food crop farmers in zing local government area of Taraba state, Nigeria. Int. J. Plant Soil Sci.8, 1–7. doi: 10.9734/IJPSS/2015/19090
56
Jenkins R. B. Frazier P. S. (2010). High-resolution remote sensing of upland swamp boundaries and vegetation for baseline mapping and monitoring. Wetlands30, 531–540. doi: 10.1007/s13157-010-0059-1
57
Khuc V. Q. Tran B. Q. Nong D. Nguyen T. H. Nguyen M.-H. Le T.-T. et al . (2023). Driving forces of forest cover rehabilitation and implications for forest transition, environmental management and upland sustainable development in Vietnam. Environ. Dev. Sustain.27, 6619–6639. doi: 10.1007/s10668-023-04159-z
58
Krivoguz D. (2024). The Kerch peninsula in transition: A comprehensive analysis and prediction of land use and land cover changes over thirty years. Sustainability16:5380. doi: 10.3390/su16135380
59
Kumar D. (2017). Monitoring and assessment of land use and land cover changes (1977-2010) in kamrup district of Assam, India using remote sensing and gis techniques. Appl. Ecol. Environ. Res.15, 221–239. doi: 10.15666/aeer/1503_221239
60
Li X. Wu K. Hao S. Yue Z. Ran Z. Ma J. (2023). Mapping cropland suitability in China using optimized MaxEnt model. Field Crop Res.302:109064. doi: 10.1016/j.fcr.2023.109064
61
Li R. Ye S. Bai Z. Nedzved A. Tuzikov A. (2024). Moderate red-edge vegetation index for high-resolution multispectral remote sensing images in urban areas. Ecol. Indic.167:112645. doi: 10.1016/j.ecolind.2024.112645
62
Long H. Zhang Y. Ma L. Tu S. (2021). Land use transitions: Progress, challenges and prospects. Land10:903. doi: 10.3390/land10090903
63
López-Carr D. (2021). A review of small farmer land use and deforestation in tropical forest frontiers: implications for conservation and sustainable livelihoods. Land10:1113. doi: 10.3390/land10111113
64
Luo X. Tong X. Hu Z. (2021). An applicable and automatic method for earth surface water mapping based on multispectral images. Int. J. Appl. Earth Obs. Geoinf.103:102472. doi: 10.1016/j.jag.2021.102472
65
Main-Knorn M. Pflug B. Louis J. Debaecker V. Müller-Wilm U. Gascon F. (2017). “Sen2Cor for sentinel-2” in Image and signal processing for remote sensing XXIII. Eds. L. Bruzzone and F. Bovolo (Bellingham, WA: SPIE). The International Society for Optics and Photonics. doi: 10.1117/12.2278218
66
Mashala M. J. Dube T. Mudereri B. T. Ayisi K. K. Ramudzuli M. R. (2023). A systematic review on advancements in remote sensing for assessing and monitoring land use and land cover changes impacts on surface water resources in semi-arid tropical environments. Remote Sens15:3926. doi: 10.3390/rs15163926
67
Mayomi I. Yohanna L. (2019). Geostatistical techniques for settlement pattern analysis of Adamawa and Taraba states, north East Nigeria. Jalingo J. Soc. Manag. Sci.1, 50–70. Available online at: https://www.researchgate.net/publication/336902947
68
Mcllwaine J. (1999). Flora of Africa: guide to reference material. African Res. Document.81, 23–51. doi: 10.1017/S0305862X00020008
69
Meneses-Tovar C. (2011). NDVI as indicator of degradation. Unasylva62, 39–46. Available online at: https://www.fao.org/4/i2560e/i2560e07.pdf
70
Michaelides S. Levizzani V. Anagnostou E. Bauer P. Kasparis T. Lane J. (2009). Precipitation: measurement, remote sensing, climatology and modeling. Atmos. Res.94, 512–533. doi: 10.1016/j.atmosres.2009.08.017
71
Myneni R. B. Yang W. Nemani R. R. Huete A. R. Dickinson R. E. Knyazikhin Y. et al . (2007). Large seasonal swings in leaf area of Amazon rainforests. Proc. Natl. Acad. Sci.104, 4820–4823. doi: 10.1073/pnas.0611338104
72
Nakamura A. Kitching R. L. Cao M. Creedy T. J. Fayle T. M. Freiberg M. et al . (2017). Forests and their canopies: achievements and horizons in canopy science. Trends Ecol. Evol.32, 438–451. doi: 10.1016/j.tree.2017.02.020
73
Ojeh V. N. Yusha'u A. M. Usman D. S. (2022). Assessment of changes in land cover by deforestation in Kurmi LGA, Taraba state, Nigeria using remote sensing/geographic information system. Aswan Univ. J. Environ. Stud.1, 67–87. doi: 10.21608/aujes.2022.114556.1055
74
Olorunfemi I. E. Fasinmirin J. T. Olufayo A. A. Komolafe A. A. (2020). GIS and remote sensing-based analysis of the impacts of land use/land cover change (LULCC) on the environmental sustainability of Ekiti state, southwestern Nigeria. Environ. Dev. Sustain.22, 661–692. doi: 10.1007/s10668-018-0214-z
75
Omijeh J. E. (2021). Towards sustainability of ecosystem services in north-East Nigeria. Int. J. Sci. Res. Arch.2, 037–056. doi: 10.30574/ijsra.2021.2.2.0039
76
Oruonye E. Mohammed B. B. Anger R. Ahmed Y. (2024). An assessment of forest degradation in Taraba central zone, Nigeria.
77
Peters A. J. Walter-Shea E. A. Ji L. Vina A. Hayes M. Svoboda M. D. (2002). Drought monitoring with NDVI-based standardized vegetation index. Photogramm. Eng. Remote. Sens.68, 71–75. Available online at: https://www.researchgate.net/publication/284778912
78
Pettorelli N. Ryan S. Mueller T. Bunnefeld N. Jędrzejewska B. Lima M. et al . (2011). The normalized difference vegetation index (NDVI): unforeseen successes in animal ecology. Clim. Res.46, 15–27. doi: 10.3354/cr00936
79
Phang L.-Y. Mohammadi M. Mingyuan L. (2023). Underutilised plants as potential Phytoremediators for inorganic pollutants decontamination. Water Air Soil Pollut.234:8. doi: 10.1007/s11270-023-06322-8
80
Phillips S. J. Anderson R. P. Schapire R. E. (2006). Maximum entropy modeling of species geographic distributions. Ecol. Model.190, 231–259. doi: 10.1016/j.ecolmodel.2005.03.026
81
Poggio L. Simonetti E. Gimona A. (2018). Enhancing the WorldClim data set for national and regional applications. Sci. Total Environ.625, 1628–1643. doi: 10.1016/j.scitotenv.2017.12.258
82
Rawat L. S. Maikhuri R. K. Bahuguna Y. M. Jugran A. K. Maletha A. Jha N. K. et al . (2022). Rejuvenating ecosystem services through reclaiming degraded land for sustainable societal development: implications for conservation and human wellbeing. Land Use Policy112:105804. doi: 10.1016/j.landusepol.2021.105804
83
R Core Team . (2023). “R: A language and environment for statistical computing.” in R Foundation for Statistical Computing. Available online at: https://www.R-project.org/
84
Robinson N. P. Allred B. W. Jones M. O. Moreno A. Kimball J. S. Naugle D. E. et al . (2017). A dynamic Landsat derived normalized difference vegetation index (NDVI) product for the conterminous United States. Remote Sens9:863. doi: 10.3390/rs9080863
85
Saatchi S. S. Harris N. L. Brown S. Lefsky M. Mitchard E. T. Salas W. et al . (2011). Benchmark map of forest carbon stocks in tropical regions across three continents. Proc. Natl. Acad. Sci.108, 9899–9904. doi: 10.1073/pnas.1019576108
86
Shawul A. A. Chakma S. (2019). Spatiotemporal detection of land use/land cover change in the large basin using integrated approaches of remote sensing and GIS in the upper awash basin, Ethiopia. Environ. Earth Sci.78:141. doi: 10.1007/s12665-019-8154-y
87
Shukla K. Shukla S. Upadhyay D. Singh V. Mishra A. Jindal T. (2021). Socio-economic assessment of climate change impact on biodiversity and ecosystem services. Climate Change Microb.2021, 661–694. doi: 10.1007/978-3-030-76863-8_34
88
Sims D. A. Gamon J. A. (2002). Relationships between leaf pigment content and spectral reflectance across a wide range of species, leaf structures and developmental stages. Remote Sens. Environ.81, 337–354. doi: 10.1016/S0034-4257(02)00010-X
89
Syaban A. S. N. Appiah-Opoku S. (2024). Unveiling the complexities of land use transition in Indonesia’s new Capital City IKN Nusantara: A multidimensional conflict analysis. Land13:606. doi: 10.3390/land13050606
90
Tabari H. Aeini A. Talaee P. H. Some'e B. S. (2012). Spatial distribution and temporal variation of reference evapotranspiration in arid and semi-arid regions of Iran. Hydrol. Process.26, 500–512. doi: 10.1002/hyp.8146
91
Townshend J. R. Masek J. G. Huang C. Vermote E. F. Gao F. Channan S. et al . (2012). Global characterization and monitoring of forest cover using Landsat data: opportunities and challenges. Int. J. Digital Earth5, 373–397. doi: 10.1080/17538947.2012.713190
92
Tuominen J. Lipping T. Kuosmanen V. Haapanen R. (2009). Remote sensing of forest health. Geosci. Remote Sensing2009, 29–52. Available online at: https://cdn.intechopen.com/pdfs/9498/InTech-Remote_sensing_of_forest_health.pdf
93
Twisa S. Buchroithner M. F. (2019). Land-use and land-cover (LULC) change detection in Wami River basin, Tanzani. Land8:136. doi: 10.3390/land8090136
94
Vélez S. Martínez-Peña R. Castrillo D. (2023). Beyond vegetation: A review unveiling additional insights into agriculture and forestry through the application of vegetation indices. J Multidiscip. Sci.6, 421–436. doi: 10.3390/j6030028
95
Vogt H. (2021). “Derivation of forest inventory parameters from high-resolution satellite imagery for the Thunkel area, northern Mongolia” in A comparative study on various satellite sensors and data analysis techniques (Göttingen: Georg-August-Universität) Doctoral dissertation.
96
White J. C. Wulder M. Hobart G. Luther J. Hermosilla T. Griffiths P. et al . (2014). Pixel-based image compositing for large-area dense time series applications and science. Can. J. Remote. Sens.40, 192–212. doi: 10.1080/07038992.2014.945827
97
Xu W. Peng H. Zeng X. Zhou F. Tian X. Peng X. (2019). A hybrid modelling method for time series forecasting based on a linear regression model and deep learning. Appl. Intell.49, 3002–3015. doi: 10.1007/s10489-019-01426-3
98
Yahaya I. I. Wang Y. Zhang Z. Inuwa A. Y. Zhao Y. You Y. et al . (2024). Assessing desertification vulnerability and mitigation strategies in northern Nigeria: A comprehensive approach. Heliyon10:e31167. doi: 10.1016/j.heliyon.2024.e31167
99
Yang L. Zhu X. Song W. Shi X. Huang X. (2024). Predicting the potential distribution of 12 threatened medicinal plants on the Qinghai-Tibet plateau, with a maximum entropy model. Ecol. Evol.14:e11042. doi: 10.1002/ece3.11042
100
Yusuf M. B. Jauro U. A. (2024). Impact of land use and land cover change on deforestation in the Central Taraba state: A geographic information system and remote sensing analysis. Environ. Protect. Res.2024, 30–41. doi: 10.37256/epr.4120243326
101
Zadbagher E. Marangoz A. M. Becek K. (2023). Characterizing and estimating forest structure using active remote sensing: an overview. Adv. Remote Sensing3, 38–46. Available online at: https://www.researchgate.net/publication/381489363
102
Zaitunah A. Samsuri A. Safitri R. (2018). Normalized difference vegetation index (ndvi) analysis for land cover types using landsat 8 oli in besitang watershed, Indonesia. IOP Conf. Series126:012112. doi: 10.1088/1755-1315/126/1/012112
103
Zarco T. P. J. Camino C. Beck P. Calderon R. Hornero A. Hernandez-Clemente R. et al . (2018). Previsual symptoms of Xylella fastidiosa infection revealed in spectral plant-trait alterations. Nat. Plants4, 432–439. doi: 10.1038/s41477-018-0189-7
104
Zhang H. Li J. Liu Q. Lin S. Huete A. Liu L. et al . (2022). A novel red-edge spectral index for retrieving the leaf chlorophyll content. Methods Ecol. Evol.13, 2771–2787. doi: 10.1111/2041-210X.13994
105
Zhao H. Chang C. Wang Z. Zhao G. (2025). A large-scale agricultural land classification method based on synergistic integration of time series red-edge vegetation index and Phenological features. Sensors25:503. doi: 10.3390/s25020503
106
Zhao Q. Li H. Chen C. Fan S. Wei J. Cai B. et al . (2024). Potential global distribution of Paracoccus marginatus, under climate change conditions, using MaxEnt. Insects15:98. doi: 10.3390/insects15020098
107
Zhao X. Zheng Y. Wang W. Wang Z. Zhang Q. Liu J. et al . (2023). Habitat suitability evaluation of different forest species in Lvliang Mountain by combining prior knowledge and MaxEnt model. Forests14:438. doi: 10.3390/f14020438
108
Zhu Z. Woodcock C. E. (2012). Object-based cloud and cloud shadow detection in Landsat imagery. Remote Sens. Environ.118, 83–94. doi: 10.1016/j.rse.2011.10.028
109
Zoungrana B. J. Conrad C. Amekudzi L. K. Thiel M. Da E. D. Forkuor G. et al . (2015). Multi-temporal landsat images and ancillary data for land use/cover change (LULCC) detection in the southwest of Burkina Faso, West Africa. Remote Sensing7, 12076–12102. doi: 10.3390/rs70912076
Summary
Keywords
canopy species, non-canopy species, species distribution modeling, MaxEnt, soil erosion, forest conservation
Citation
Yahaya II, Wang C, Ogbue CP and Yahaya MS (2025) Remote sensing and MaxEnt modeling of canopy and non-canopy forest tree species in Taraba State for biodiversity conservation and ecosystem management. Front. For. Glob. Change 8:1631859. doi: 10.3389/ffgc.2025.1631859
Received
20 May 2025
Accepted
15 September 2025
Published
09 October 2025
Volume
8 - 2025
Edited by
Walter Mattioli, Council for Agricultural Research and Agricultural Economy Analysis, Italy
Reviewed by
Admir Avdagić, University of Sarajevo, Bosnia and Herzegovina
Giorgia Di Domenico, University of Tuscia, Italy
Updates
Copyright
© 2025 Yahaya, Wang, Ogbue and Yahaya.
This is an open-access article distributed under the terms of the Creative Commons Attribution License (CC BY). The use, distribution or reproduction in other forums is permitted, provided the original author(s) and the copyright owner(s) are credited and that the original publication in this journal is cited, in accordance with accepted academic practice. No use, distribution or reproduction is permitted which does not comply with these terms.
*Correspondence: Changcheng Wang, wangchangcheng@csu.edu.cn
Disclaimer
All claims expressed in this article are solely those of the authors and do not necessarily represent those of their affiliated organizations, or those of the publisher, the editors and the reviewers. Any product that may be evaluated in this article or claim that may be made by its manufacturer is not guaranteed or endorsed by the publisher.