 Chulsang Yoo1
 Wooyoung Na
 Sang-Keun Song
- 1School of Civil, Environmental and Architectural Engineering, Korea University, Seoul, Republic of Korea
- 2Department of Civil Engineering, Dong-A University, Busan, Republic of Korea
- 3Department of Earth and Marine Sciences, Jeju National University, Jeju-si, Republic of Korea
- 4Research Applications Department, National Institute of Meteorological Sciences, Jeju-si, Republic of Korea
Cloud seeding has emerged as a promising strategy for artificially enhancing water availability in forest ecosystems, thereby supporting hydrological processes and promoting ecological function. While previous studies have reported improvements in hydrological indicators such as soil moisture and runoff following cloud seeding-induced precipitation, there remains a critical knowledge gap regarding the extent of these ecological effects including GPP and NPP across basins with differing forest characteristics—such as total area, forest coverage, and dominant tree species. This study addresses this gap by conducting a comparative assessment of the ecological benefits of cloud seeding across three basins in South Korea with varying forest properties. An ecohydrological model, RHESSys, is first calibrated for each basin to simulate both hydrological and ecological responses under different cloud seeding scenarios from 2020 to 2023. The results indicate that cloud seeding improves hydrological conditions—including runoff and soil moisture—proportional to the degree of precipitation enhancement, These hydrological improvements, in turn, lead to nonlinear yet consistent increases in GPP and NPP. Notably, the magnitude and persistence of these ecological benefits are more strongly influenced by forest characteristics than by basin size. Under cloud seeding scenarios simulating a 20% annual increase in precipitation, an expansion in forest cover from 78% to 84% results in a 3.1% to 4.2% increase in GPP. Moreover, basins dominated by broadleaf forests exhibit extended vegetation productivity responses, lasting approximately 20–30 days longer. These findings underscore the importance of incorporating basin-specific forest characteristics into the design and implementation of cloud seeding strategies aimed at ecological conservation and productivity enhancement.
1 Introduction
Given the critical role of water supply in sustaining and enhancing forest vegetation activity, various strategies have been developed to optimize water availability in forested ecosystems, particularly in response to challenges such as climate change, prolonged droughts, and soil degradation. These approaches encompass irrigation systems adapted to natural landscapes, rainwater harvesting, soil moisture retention techniques, cloud seeding, and afforestation strategies that incorporate water-efficient plant species (Al-Jamal et al., 2002; Herzog et al., 2014; Terêncio et al., 2018; Mahmoud et al., 2016; Huang et al., 2022; Zheng et al., 2024; Yoo et al., 2024). By improving water accessibility, these methods not only support forest health but also yield broader environmental benefits, such as mitigating wildfire risk and maintaining regional hydrological cycles (Ager et al., 2016; Smerdon et al., 2009). However, the effectiveness of different water supply strategies in enhancing forest vegetation activity, as well as their broader implications for sustainable forest management, remains a subject of ongoing debate.
Several studies have investigated climate or weather manipulation experiments to evaluate potential impacts on ecosystem functioning and drought mitigation (Norby and Zak, 2011; Zarnetske et al., 2021; Leyrer et al., 2022; Sanchez-Martinez et al., 2025). Norby and Zak (2011) introduced the Free-Air CO2 Enrichment (FACE) experiment, which advanced predictions of ecosystem responses by showing how elevated concentrations affect productivity and carbon storage. Zarnetske et al. (2021) provided a comprehensive assessment of the potential ecological impacts of climate intervention strategies, with particular emphasis on solar radiation management and, more specifically, stratospheric aerosol intervention. More recently, Sanchez-Martinez et al. (2025) reported from a long-term Amazonian drought experiment that rainforest ecosystems attained ecohydrological stability through water redistribution.
Cloud seeding offers a means of artificially enhancing water availability in forested ecosystems. As a form of weather modification, this technique was initially explored as a potential solution to mitigate drought and enhance precipitation in arid regions, including parts of the United States, Australia, and the Middle East (Ryan and King, 1997; Khatri et al., 2021; Pokharel et al., 2021; Al Hosari et al., 2021). By spraying seeding materials such as silver iodide (AgI) or calcium chloride (CaCl2) into clouds, cloud seeding aims to stimulate ice crystal formation, ultimately increasing rainfall or snowfall. The effectiveness of cloud seeding is typically evaluated by comparing surface precipitation at designated test sites before, during, and after seeding (Ryan and King, 1997; Bruintjes, 1999). To investigate the impacts of cloud seeding through numerical simulations, the Weather Research and Forecasting (WRF) model—a mesoscale atmospheric modeling and forecasting system (Skamarock et al., 2005) equipped with advanced microphysics parameterizations—has been extensively employed (Fonseca et al., 2022; Lin et al., 2023; Moon et al., 2025). This model allows explicit representation of microphysical processes including droplet activation, auto-conversion, deposition, condensation freezing, and contact freezing (Khain and Lynn, 2009), thereby providing a robust framework for assessing the dynamical effects of seeding operations.
The ecological implications of cloud seeding warrant careful scrutiny within the context of hydrological processes. In particular, cloud seeding has been shown to enhance infiltration rates, thereby promoting soil moisture and groundwater recharge (Yoo et al., 2022). Once adequate soil moisture is secured, it not only mitigates excessive nutrient leaching but also improves nutrient solubility, ultimately facilitating uptake by plant roots and enhancing plant productivity (Metwally and Pollard, 1959). Furthermore, improved soil–water conditions can alleviate drought stress, thereby supporting the resilience of water and carbon cycling at the ecosystem scale (Wondie, 2023; Mondal et al., 2024; Fan and Wei, 2025). Moreover, precipitation enhancement may increase transpiration rates—which are strongly correlated with biomass accumulation (Lie et al., 2018; Li et al., 2021)—thereby underscoring the need for sophisticated hydrological modeling to capture these dynamics accurately (Chun et al., 2018; Tripathi et al., 2022; Sharma et al., 2024). In addition, previous studies highlight the potential of weather modification techniques, such as cloud seeding, to supplement conventional water resources and enhance crop yields in water-stressed regions (Abshaev et al., 2022; Valjarević et al., 2022). This is because the augmented rainfall can lead to increased soil moisture availability (Alzahrani and Abdelbaki, 2025).
To the best of our knowledge, aside from the recent work by Yoo et al. (2024), who scrutinized the ecological effect of cloud seeding along with its hydrological performance at Boryeong dam basin in South Korea, studies that directly couple cloud seeding simulations or experiments with ecohydrological modeling remain scarce. Only a few investigations have examined ecohydrological responses to precipitation variability based on modeling approach (Saksa et al., 2020; Smith et al., 2021). For instance, Saksa et al. (2020) used the Regional Hydro-Ecological Simulation System (RHESSys) model in the Sierra Nevada in U.S. and demonstrated that precipitation variability exerts a stronger influence on runoff and infiltration than vegetation changes induced by forest management or wildfires. Smith et al. (2021), applying the Ecohydrological Water Isotope (EcH2O-iso) model calibrated to Demnitzer Millcreek catchment in Germany, quantified the impacts of land use and vegetation on water partitioning and water age.
A significant research gap exists in assessing the ecological effects of cloud seeding, particularly regarding its efficacy in enhancing productivity across different forest ecosystems, which is expected to vary depending on the characteristics. Different forest types exhibit distinct hydrological dynamics, soil compositions, and species adaptability, all of which influence how additional precipitation from cloud seeding influences the forest vitality. For instance, in water-limited ecosystems such as dry coniferous forests, increased rainfall may significantly boost plant growth and carbon sequestration (Gerten et al., 2008; Rohr et al., 2013). In contrast, in already moisture-saturated rainforests, additional precipitation could lead to nutrient leaching or excessive runoff, potentially offsetting productivity gains (Fuentes et al., 2018). Furthermore, variations in canopy density, root structure, and microbial activity mediate water absorption and retention, further diversifying the ecological outcomes of cloud seeding. Understanding these differences is crucial for assessing the feasibility of cloud seeding as a tool for ecosystem restoration and climate resilience.
To address the identified research gap, this study advances the ecohydrological modeling framework proposed by Yoo et al. (2024) to assess the effects of cloud seeding for ecological conservation and vegetation productivity in basins with varying forest characteristics. To this end, we construct an ecohydrological model for three basins in South Korea. Using multi-year (2020–2023) scenario-based cloud seeding simulations as input, we generate hydrological and ecological components, respectively, to evaluate the effects of cloud seeding on vegetation photosynthesis, respiration, and water use efficiency. Specifically, we incorporate both unseeded (UNSD) and seeded (SEED) scenarios into the modeling framework and quantify their differences, where a greater difference indicates a stronger influence of cloud seeding. The hydrological variables analyzed include runoff, soil moisture, and evapotranspiration, while the vegetation-related metrics encompass GPP, NPP, and respiration. By employing this approach, we assess the diverse ecohydrological responses to cloud seeding, investigating whether its effects vary with forest scale and type. Furthermore, we examine the temporal dynamics of these effects, including potential time lags and the persistence of cloud seeding impacts on plant growth.
2 Materials and methods
2.1 Research areas with different climate and ecological conditions
Three dam basins with distinct characteristics—Boryeong, Yongdam, and Namgang—are selected as the study areas (Figure 1). They serve as representative experimental sites for a cloud seeding research project launched in 2022 with support from the National Institute of Meteorological Sciences (NIMS). Consequently, these basins have already been the focus of previous research (Yoo et al., 2022; Ma et al., 2023; Yoo et al., 2024; Moon et al., 2025). Moreover, all three basins have recently encountered challenges related to water resource availability due to recurrent droughts. Boryeong dam basin, covering an area of 163.6 km2, is relatively small compared to other dam basins in South Korea. Thus, its water resources can be inherently constrained, making the basin particularly susceptible to drought conditions, which resulted in multiple water shortage issues during the 2010s (Chungnam Institute, 2016). Yongdam dam basin, located in the upper Geum River basin, spans an area of 930.0 km2. In 2015, the basin received an annual precipitation of 877.6 mm, which accounted for only 67.5% of the normal annual precipitation of 1,300.7 mm recorded between 1983 and 2021. This substantial deviation highlights the basin's vulnerability to hydrological variability. Namgang dam basin, one of the largest in South Korea, covers an area of 2,285 km2. Despite its extensive catchment area, the basin has a relatively limited reservoir capacity, making it particularly prone to drought events.
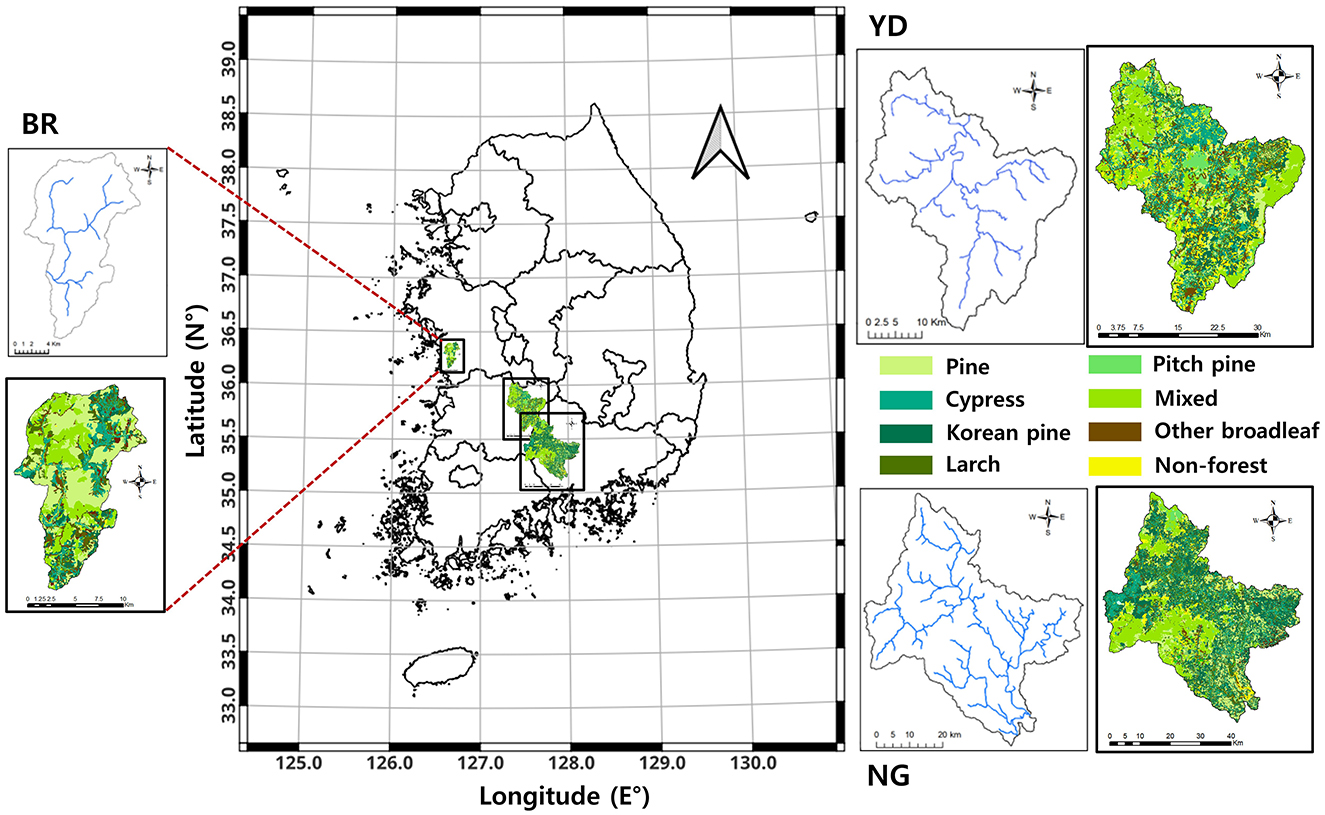
Figure 1. Geographical Locations, river networks, and forest maps of study areas (BR, Boryeong dam basin; YD, Yongdam dam basin; NG, Namgang dam basin).
Forest characteristics exhibit notable variations across the different basins (Figure 1). Among them, Boryeong dam basin, the smallest in size, has the highest proportion of forest cover, encompassing 83.7% of its total area. In comparison, Yongdam dam basin has a forest cover of 79.8%, while Namgang dam basin exhibits a slightly lower forest coverage of 78.1%. Distinct differences are also observed in the forest types, including broadleaf, coniferous, and mixed forests. In all basins, broadleaf forests constitute a larger proportion of the forested area than coniferous forests. Overall, despite Namgang dam basin's substantially larger spatial extent, its forest coverage and composition suggest a relatively lower productivity potential compared to the other basins.
2.2 Observation data and GIS information
The RHESSys model is calibrated using various observational datasets, which play a crucial role in determining key ecohydrological parameters. For this purpose, meteorological data, including daily precipitation (mm), minimum and maximum temperatures (°C), soil temperature (°C), wind speed (m/s), and relative humidity (%), are collected from weather stations operated by Korea Meteorological Administration (KMA). When multiple weather stations are located within the basin, the Thiessen polygon method is applied to assign weights based on the spatial influence of each station, facilitating the computation of area-averaged meteorological variables (e.g., for Yongdam and Namgang dam basins). In cases where no observation stations are located within the basin (e.g., Boryeong dam basin), data from the nearest station is utilized. Additionally, daily dam inflow data (m3/s), representing runoff from the basin, and satellite-derived LAI are incorporated. The dam inflow data are managed by K-Water, and the satellite-derived LAI, used to validate ecological parameters, is obtained from the Moderate Resolution Imaging Spectroradiometer (MODIS) Terra satellite. The LAI observations, recorded at 8-day intervals, are aggregated into monthly averages (Running and Zhao, 2015). MODIS/Terra satellite data have been widely recognized for their relatively accurate estimates of vegetation activity indicators such as LAI and GPP (Li et al., 2015; Fu et al., 2017; Pu et al., 2023). Data from 2016 to 2020 are employed for parameter estimation, while data from 2021 to 2023 are used to validate the RHESSys model.
Various types of GIS data are employed to simulate hydrological and vegetation-related components, which are important in ecohydrological studies (Durlević et al., 2024; Vujović et al., 2025). A Digital Elevation Model (DEM) serves as the fundamental source of elevation data for the target basin. From the DEM (30 × 30 m2), hydrological modeling parameters, including slope, aspect, stream network, contributing area, and the topographic wetness index, are derived. Soil properties, such as porosity, field capacity, wilting point, and effective soil depth, are obtained from soil maps (30 × 30 m2). Information on infiltration and evaporation characteristics, as well as vegetation distribution, is derived from land use maps (30 × 30 m2). Additionally, vegetation distribution maps or forest type maps (25 × 25 m2) are utilized to estimate ecological parameters corresponding to different vegetation types. These spatial data sets collectively inform the determination of initial ecological parameter values, soil parameter estimation, and spatial unit classification. The spatial data utilized in this study are presented in Supplementary Figure S1.
2.3 Modeling framework
The assessment of cloud seeding impacts on vegetation activity within a basin follows a two-stage process: (1) calibration of the ecohydrological model and (2) simulation of hydrological and ecological variables using cloud seeding scenarios as input. The model is constructed based on observed meteorological, hydrological, and ecological data and topographical information, with the target basin hierarchically divided into spatial units to simulate both hydrological and ecological processes. Once the validation is complete, multiple scenarios—with and without cloud seeding, which are called SEED and UNSD, respectively—are used to simulate hydrological and ecological components from 2020 to 2023. The hydrological outputs include runoff, soil moisture content, and evapotranspiration, while ecological outputs encompass GPP, NPP, and vegetation respiration. By comparing the outputs from cloud SEED and UNSD scenarios, the effects of cloud seeding on vegetation activity are assessed. For instance, an increase in primary productivity may indicate an enhancement in vegetation activity due to cloud seeding implementation.
2.4 RHESSys model
This study employs the RHESSys as the ecohydrological model. The RHESSys is a coupled modeling framework that integrates the simulation of water, carbon, and nitrogen fluxes, driven by interactions among the atmosphere, soil, and vegetation (Tague and Band, 2004). As a process-based and spatially distributed model, the RHESSys is capable of simulating hydrological, vegetation, soil, and water quality dynamics across a wide range of spatial scales, from 0.1 to 60,000 km2. Moreover, by capturing the cycling and spatial distribution of water, carbon, and nitrogen at fine spatial resolutions, the RHESSys is particularly well-suited for assessing hydrological-ecological interactions, making it a valuable tool for research on sustainable watershed management and ecosystem dynamics (Chen et al., 2020). The RHESSys model has been widely applied to mid-latitude regions including the Rocky Mountains in the United States and Mediterranean forests (Tague et al., 2013; Rog et al., 2021). In South Korea, Yoo et al. (2024) validated the applicability of the RHESSys for ecological simulations in Boryeong dam basin.
The calibration of the RHESSys model consists of two processes: parameter estimation and validation. For ecological parameter estimation, an initial spin-up phase is conducted, during which the initial values of ecological parameters are artificially set for the simulation period. This step ensures that the simulated vegetation state at the beginning of the simulation accurately reflects the conditions of the target basin. To further refine this initialization, the leaf area index (LAI) data observed in October 2016 from the MODIS/Terra satellite is utilized as a reference in this study. A 400-year spin-up simulation is performed to stabilize the ecological parameters, after which key hydrological and ecological parameters are estimated for the calibration period (2016–2020).
During this process, an appropriate range for parameter estimation is predefined, and an optimal parameter set is determined through Monte Carlo random sampling. The model's validity is assessed by comparing simulated and observed streamflow (representing hydrological parameters) and LAI (representing ecological parameters) using evaluation metrics. The optimized parameters are then employed to generate hydrological and ecological variables for the validation period (2021–2023). Similarly, the simulated results are compared against observed data to evaluate the model's performance during this period. If significant discrepancies arise between the simulations and observations, the optimal parameter set is re-estimated. For a more detailed description of the parameter estimation process, please refer to Yoo et al. (2024) and the National Institute of Meteorological Sciences (2024).
2.5 Evaluation metrics
Parameter estimation performance is assessed using the Nash-Sutcliffe Efficiency (NSE), Percent Bias (Pbias), and the Correlation Coefficient (R) [Equations 1–3]. Generally, for hydrological parameters, a simulation is considered adequately estimated if the criteria of NSE lie between 0.5 and 0.7, Pbias < 10%, and a correlation coefficient of at least 0.7 (Yoo et al., 2024). For ecological parameters, estimation is deemed appropriate when the correlation coefficient between the simulated and observed monthly LAI exceeds 0.7. Given that ecological processes exhibit lower temporal variability compared to hydrological processes, evaluation metrics are computed on a monthly rather than a daily basis. Furthermore, daily comparisons are inherently challenging due to the high uncertainty associated with spatially distributed LAI across target basins, necessitating reliance on satellite observations. Since such observations typically have a temporal resolution of 8 or 16 days, they are aggregated to a monthly scale for assessment.
Here, Si represents the simulated values, while Oidenotes the observed values. and refer to the mean of the simulated and observed values, respectively. The variable i represents numbers ranging from 1 to t, corresponding to the simulation periods.
2.6 Change ratio
Vegetation activity is evaluated by comparing the results of two scenarios: without cloud seeding (UNSD) and with cloud seeding (SEED). To quantify the impact of cloud seeding, the changes are expressed as a ratio. Specifically, the change ratio (CR) is determined as the relative difference of simulations between SEED and UNSD, normalized by UNSD, as defined in Equation 4.
Here, Sunsd represents the simulated values of the UNSD scenario, while Sseed denotes the simulated values of the SEED scenario.
2.7 Lagged correlation analysis
The effects of rainfall on hydrological and ecological components typically manifest with a temporal lag. Yoo et al. (2022) reported that increased antecedent 5-day precipitation enhances the contribution of cloud seeding to runoff. Soil moisture is also strongly influenced by precedent precipitation, with 5-day antecedent precipitation commonly used as a key criterion for soil wetness in the rainfall-runoff analysis. However, from a longer-term perspective, particularly in the context of plant growth, precipitation over a period of 1–3 months is considered more relevant as a precursor (Méndez-Barroso et al., 2009; Wei et al., 2016). Given that soil moisture is directly linked to vegetation dynamics, including GPP and NPP, it is subject to the influence of preceding precipitation, akin to hydrological components.
Thus, we examine the lagged correlation between antecedent precipitation and following ecological components. The cross-correlation coefficient, a metric that quantifies the degree of similarity or synchrony between two time series, measures how closely the temporal variability or trends of one dataset align with those of another when a time shift is applied (Podobnik et al., 2010; Altmann, 2011). To assess the relationship between precipitation and time-lagged responses in soil moisture, GPP, NPP, and vegetation respiration, we apply a lag time in 10-day intervals (e.g., 10, 20, 30 days, etc.) [Equation 5].
Here, X and Y represent the two variables subjected to correlation analysis. Specifically, X denotes 1-month cumulative precipitation at time point i, while Y corresponds to 1-month average soil moisture content, cumulative GPP, NPP, and vegetation respiration, each with τ-day lags. and denote the mean values of X and Y, respectively. The interpretation of the time-lagged cross-correlation coefficient is identical to that of a conventional correlation coefficient: values close to 1 or −1 indicate strong positive or negative correlations, respectively, whereas a value of 0 signifies no correlation.
3 Results
3.1 Calibration of RHESSys model
The optimal hydrological parameters are identified through the comprehensive estimation procedures outlined in Sections 2.2 and 2.3. The calibrated model successfully reproduces the observed peak discharge, peak timing, and baseflow variations across three basins (Figure 2, Supplementary Figure S2, and Supplementary Table S1). Notably, the model demonstrates relatively strong and robust performance in Boryeong dam basin compared to other dam basins (Supplementary Table S1 and Figure 2a). Calibration over the period 2016–2020 is well-supported by three evaluation metrics, with most NSE values exceeding 0.5. Moreover, the Pbias values, which reflect discrepancies in total runoff volume, remain within approximately ±10%, indicating satisfactory model performance in Boryeong and Yongdam dam basins. Correlation coefficients exceeding 0.65 further reinforce the reliability of the simulation results for all basins (Supplementary Table S1). However, in Namgang dam basin, which covers a relatively larger area, the performance metrics are slightly lower than those of the other two basins. Nevertheless, the evaluation metrics for the validation period (2021–2023) exhibit an overall improvement relative to the calibration period, suggesting that the parameterization remains appropriate.
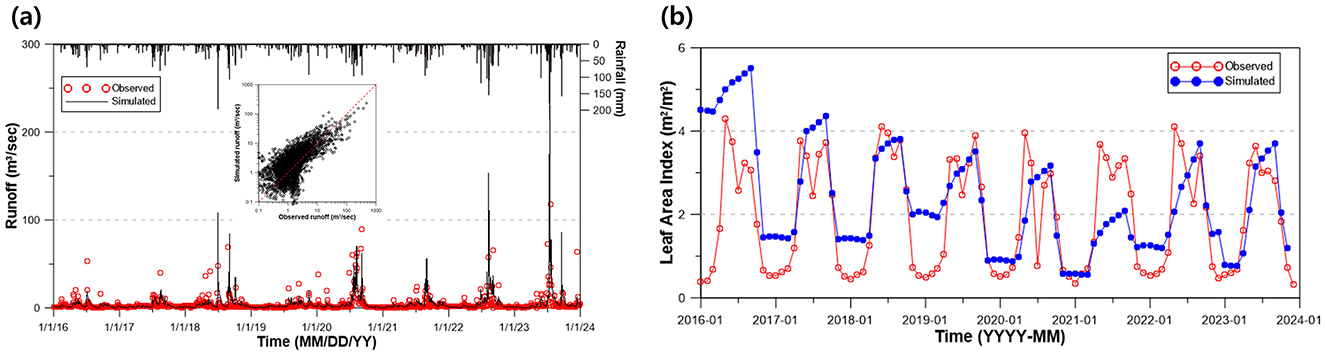
Figure 2. Calibration (2016–2020) and validation (2021–2023) results based on comparisons of runoff (a) and LAI (b) in the Boryeong dam basin. The black and blue lines represent time series of daily runoff and monthly LAI respectively simulated from the calibrated RHESSys model, and red dots indicate the observations. The scatter plot embedded in runoff time series presents the linear relationship between observed (x-axis) and simulated (y-axis) daily runoff.
The suitability of the ecological parameters is evaluated by comparing the simulated LAI during the model calibration period (2016–2020) and validation period (2021–2023) with MODIS/Terra satellite observations for the corresponding periods (Supplementary Figure S3). In the case of Boryeong dam basin, the correlation coefficient for the calibration period is 0.627, while for the validation period, it increases to 0.729. This indicates that the RHESSys model calibrated in this study effectively captures the monthly dynamics of LAI (Figure 2b). Similarly, for Yongdam and Namgang dam basins, the correlation coefficients for the calibration period are 0.868 and 0.794, respectively, while for the validation period, they are 0.849 and 0.752, demonstrating satisfied performance. These results suggest that the ecological parameters are appropriately calibrated for all basins, ensuring reliable LAI simulation. Furthermore, the model's capacity to provide GPP and NPP within reasonable ranges has been independently verified by Yoo et al. (2024).
3.2 Cloud seeding scenarios
Multiple cloud seeding scenarios are generated referring to previous research findings. The National Institute of Meteorological Sciences (2023) and Yoo et al. (2024) conducted numerical simulations of cloud seeding for Boryeong dam basin in 2021 using the WRF model, whose performance was subsequently validated by Moon et al. (2025), confirming its ability to reliably reproduce ground-observed precipitation. The simulations were performed at 24-h intervals, with the first 6 h allocated for model spin-up and the subsequent 18 h dedicated to forecasting. The results indicated that cloud seeding contributed to an approximate 18% enhancement in the annual precipitation over Boryeong dam basin. Figure 3 presents the time series of annual precipitation in 2021, derived by averaging the simulated values (UNSD, SEED) over the grid cells within the basin. The findings suggest a general increase in daily precipitation under SEED conditions, with more pronounced enhancements on days with higher precipitation. For instance, on July 7, the precipitation increased from 148.3 mm in the UNSD scenario to 192.4 mm in the SEED scenario, while on August 31, it increased from 180.8 mm to 286.3 mm.
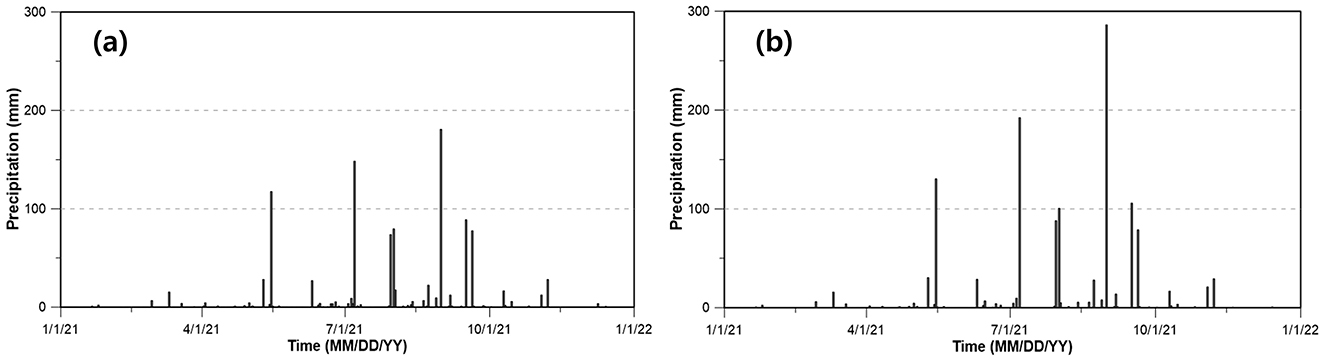
Figure 3. Time series of daily precipitation under both UNSD (a) and SEED (b) cloud seeding simulations over Boryeong dam basin in 2021 (Yoo et al., 2024).
Building on the simulation framework, this study adopts scenario-based assumptions in which annual precipitation is increased by 5%, 10%, 15%, and 20% through hypothetical cloud seeding over Boryeong, Yongdam, and Namgang dam basins during 2020–2023 (Supplementary Figure S4). This uniform N% increase in annual precipitation follows previous approaches (Acharya et al., 2011; Yoo et al., 2022). For example, Acharya et al. (2011) demonstrated that directly adding a 1–5% increment to observed daily winter precipitation—a period typically targeted for cloud seeding—effectively enhanced seasonal precipitation totals. Similarly, following Yoo et al. (2022), (2024), we impose precipitation enhancement only on days with daily rainfall exceeding 20 mm, thereby reflecting more realistic seeding effects. Empirical evidence from historical cloud seeding experiments in the United States, Israel, and China further supports the plausibility of the enhancement ranges (5–20%) adopted in this study (Ben, 1990; Acharya et al., 2011; Wang et al., 2019).
3.3 Comparison of cloud seeding's effect at three dam basins
In this section, we assess the hydrological and ecological effects from cloud seeding across three dam basins of varying scales and forest characteristics. We evaluate the impact of cloud seeding-induced precipitation increases of 5%, 10%, 15%, and 20% by comparing the annually averaged change ratio (CR) of key hydrological and ecological components for each basin. The hydrological components considered include runoff, soil moisture content, and evapotranspiration, while the ecological components encompass GPP, NPP, and vegetation respiration. Furthermore, we analyze WUE, which quantifies the relative ratio of vegetation productivity (GPP) to hydrological flux (evapotranspiration, ET) (WUE = GPP/ET) (Baldocchi, 1994). The WUE has been widely employed to examine the interactions between climate conditions and vegetation productivity, providing insights into terrestrial ecosystem metabolism (Briggs and Shantz, 1913; El Masri et al., 2019). Figures 4, 5 present the comparative results, with colors distinguishing different dam basins and line and symbol styles differentiating the components.
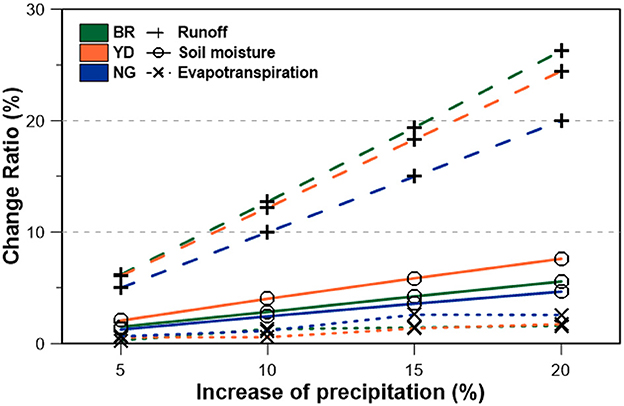
Figure 4. Trends in hydrological component increases across three dam basins under four cloud seeding scenarios (5, 10, 15, 20% increases). Green, orange, and blue lines represent results for the Boryeong (BR), Yongdam (YD), and Namgang (NG) dam basins, respectively. Dashed lines with cross markers indicate runoff, solid lines with circle markers represent soil moisture, and dotted lines with X-shaped markers denote evapotranspiration.
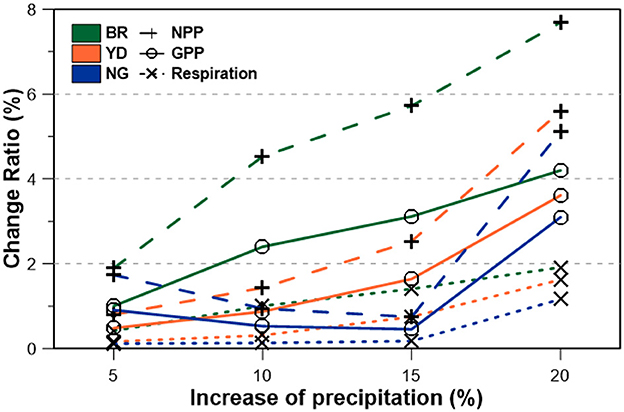
Figure 5. Similar to Figure 4 but for ecological components. Dashed lines with cross markers indicate NPP, solid lines with circle markers represent GPP, and dotted lines with X-shaped markers denote vegetation respiration.
3.3.1 Hydrological components
With increasing amounts of cloud seeding, the CRs of hydrological components across three dam basins exhibit a consistently linear upward trend. Overall, runoff emerges as the most sensitive component to cloud seeding, followed by soil moisture, while evapotranspiration exhibits only a marginal increase. For instance, the CRs of runoff rise from approximately 5% to over 25% as annual precipitation increases from 5% to 20% due to cloud seeding across all basins. In contrast, the corresponding increase in soil moisture remains below 5%, even under a 20% enhancement in rainfall. The hydrological response of Boryeong dam basin is particularly notable, as it shows a relatively greater increase in runoff and soil moisture. Although the CRs of soil moisture and evapotranspiration are lower than that of runoff, they still demonstrate a clear linear relationship with precipitation changes. Interestingly, the relative magnitudes of CRs for each hydrological component vary across the basins, reflecting differences in their intrinsic basin characteristics (Figure 4).
Another noteworthy finding is that Namgang dam basin, the largest among the three, exhibits the smallest increase in both runoff and soil moisture. When precipitation increases by 20%, the CRs for Namgang dam basin reach 20.1% for runoff and 3.4% for soil moisture—representing the lowest increments among the three basins. While additional precipitation enhances various hydrological components, larger basins tend to experience greater hydrological losses, particularly through soil infiltration during water transit from upstream areas to the outlet. This leads to a reduced runoff response to precipitation inputs. Consequently, although the Namgang basin offers substantial total water storage potential due to its size, its relative hydrological responsiveness—particularly in terms of runoff and soil moisture—is more muted compared to smaller basins. Furthermore, in this basin, the added precipitation appears to preferentially enhance evapotranspiration, thereby contributing to the minimal increase in soil moisture.
3.3.2 Ecological productivity
The CRs of ecological components also exhibit a nonlinear yet overall increasing trend with greater amounts of cloud seeding, although the magnitude of these responses is generally lower than that observed for hydrological components. However, compared to hydrological components, the differences and variability among dam basins are relatively more pronounced. The upward trend in CRs for GPP and NPP, which serve as indicators of vegetation activity, is most evident in Boryeong dam basin, followed by the Yongdam and Namgang dam basins (Figure 5). In Boryeong dam basin, the CR for NPP reaches 7.8%, and that for GPP reaches 4.1% when the precipitation amount increases by 20%, representing the highest levels of enhancement among the three basins. In contrast, Namgang dam basin shows the lowest increases in CR, with NPP and GPP rising by 5.2% and 3.1%, respectively. Interestingly, the order of increasing vegetation activity among three basins aligns with the proportion of forested area within each basin—Boryeong dam: 83.7%, Yongdam dam: 79.8%, Namgang dam: 78.1%—suggesting a potential relationship between cloud seeding-induced ecological response and forest cover. A more detailed analysis of this relationship will be provided in Section 4.4.
Among the ecological components, NPP exhibits the most substantial increase due to cloud seeding, followed by GPP and vegetation respiration. Notably, the most pronounced enhancement is observed in the primary production solely driven by vegetation activity—specifically, the amount of carbon absorbed from the atmosphere by forests—underscoring the significant impact of cloud seeding on forest carbon sequestration. Furthermore, unlike other dam basins, Namgang dam basin demonstrates a distinctive trend: as the precipitation increase induced by cloud seeding rises from 5% to 15%, the increments in GPP and NPP diminish. This finding suggests that large-scale cloud seeding does not necessarily translate into a proportional enhancement of vegetation activity. Instead, an effective strategy for stimulating vegetation growth through cloud seeding may require consideration of factors such as the proportion of forested area, forest composition, and tree species, rather than focusing solely on basin size.
3.3.3 Water use efficiency
Consistent with previous analyses, the CRs of annual and seasonal WUE are estimated and compared across the three dam basins under scenarios of 5%, 10%, 15%, and 20% increases in precipitation. The results indicate that cloud seeding generally enhances WUE (Figure 6). In Boryeong dam basin, for instance, annual WUE increased by approximately 2.5% in response to a 20% increase in precipitation (Figure 6a). The most substantial improvement is observed in spring, followed by winter and summer, whereas a decreasing trend was evident in fall. Specifically, spring WUE increased by up to 7.5%. Given that WUE is calculated as the ratio of GPP to evapotranspiration, the observed variations are primarily attributable to changes in GPP, as the CRs of evapotranspiration under cloud seeding scenarios remained relatively stable (Figures 4, 5).
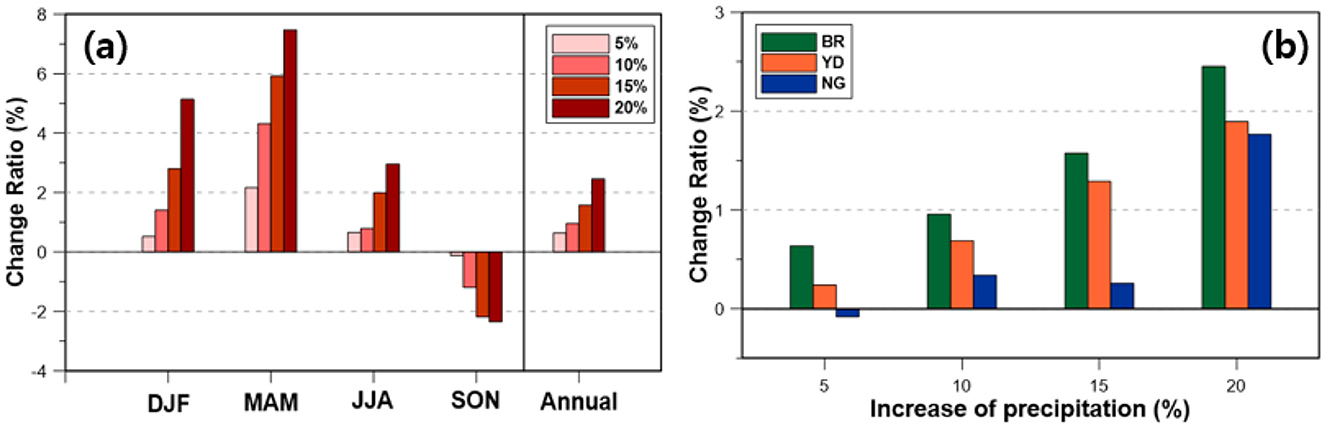
Figure 6. Comparison of CRs in WUE under cloud seeding scenarios from 2020 to 2023: Seasonal and annual mean CRs in Boryeong dam basin (a) and annual mean CRs across three dam basins (b).
The variation in CRs of WUE across three dam basins highlights distinct regional disparities. Although WUE generally exhibits an increasing trend in response to enhanced precipitation, the most substantial increase is observed in Boryeong dam basin, while Namgang dam basin shows the smallest rate of increase. This pattern aligns with the trends observed in GPP and NPP. However, compared to GPP and NPP, the magnitude of WUE enhancement remains relatively modest—reaching a maximum of approximately 2% under a 20% increase in precipitation (Figure 6b). This limited response is likely attributable to a simultaneous increase in evapotranspiration, driven by elevated plant respiration under cloud seeding conditions, which partially offsets the gains in GPP and thus moderates the overall increase in WUE. Collectively, these findings suggest that, similar to other ecological parameters, WUE is more strongly governed by the proportion of forest cover within the basin than by its spatial extent.
3.4 Sensitivity of three basins' ecological effects induced by cloud seeding
This section examines the relationship between basin's forest characteristics and vegetation vitality indicators in response to a 20% increase in precipitation. The basin characteristics considered include: (1) total basin area (km2), (2) the proportion of forested land area within the basin (%), calculated as 100 × (forested area/total basin area), and (3) the proportion of broadleaf forest relative to the total forested area (%), calculated as 100 × (broadleaf forest area/total forest area). Correspondingly, vegetation vitality is assessed using four ecological indicators: GPP, NPP, respiration, and WUE. Figure 7 presents scatter plots for three basins, where the x-axis denotes the basin-specific forest characteristics, and the y-axis represents the corresponding rate of increase (CR) in ecological components in response to a cloud seeding-induced 20% increase in precipitation.
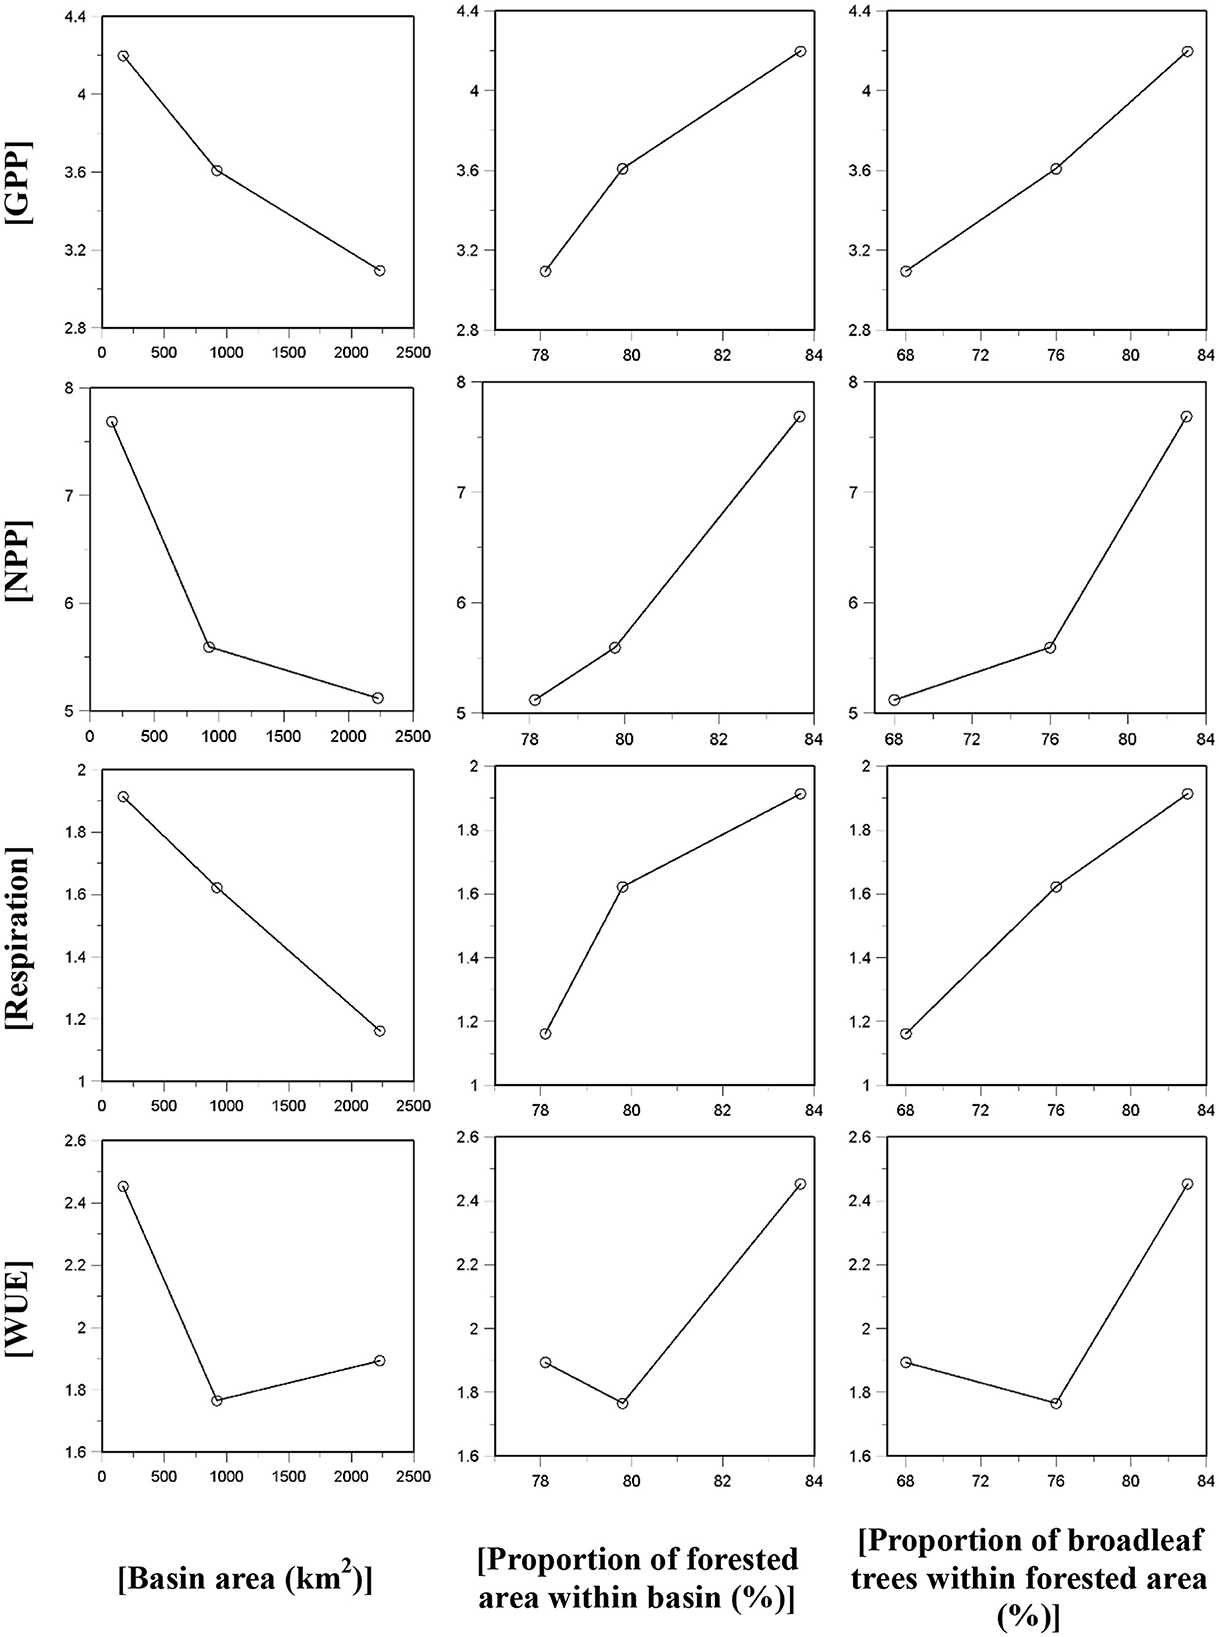
Figure 7. Response of the CRs for vegetation activity (y-axis) to a 20% increase in precipitation, shown as a function of basin-specific characteristics (x-axis). Each panel presents three data points, corresponding to the estimated CRs (y-axis) and the associated forest attributes (x-axis) for the three study basins.
It is observed that vegetation vitality generally declines with increasing basin area, with NPP exhibiting a pronounced decrease from 7.6% to 5%. This pattern implies that larger basins are less likely to exhibit enhanced ecological effects from cloud seeding. In contrast, a higher proportion of forested area within a basin is positively associated with post-seeding vegetation activity, thereby suggesting an inverse relationship when compared to basin size. For example, the GPP increases from 3.1% to 4.2% as forest cover rises from 78% to 84%. These results indicate that greater forest cover is conducive to amplifying the ecological benefits of cloud seeding. Furthermore, an increased proportion of broadleaf species within the forest exhibits a similar positive association with vegetation productivity, mirroring the trend observed for total forest cover. Given that broadleaf species typically exhibit higher photosynthetic productivity compared to coniferous species, it is reasonable to infer that areas dominated by broadleaf trees are more likely to experience substantial productivity gains as a result of cloud seeding.
3.5 Forest-dependent lagged impact of cloud seeding
This section examines the temporal lag and persistence of the effects of seeding-induced precipitation enhancement on soil moisture and vegetation activity, as indicated by GPP, NPP, and WUE. A cross-correlation analysis is performed between the cumulative precipitation over the current month and the time-lagged responses of soil moisture content, GPP, NPP, and vegetation respiration across three dam basins. The results of the lagged correlation analysis for GPP are presented in Figure 8, where the blue dashed line denotes the confidence interval derived from the T-test. Correlation coefficients exceeding this confidence interval in absolute value are considered statistically significant at the lag time. The corresponding analysis results for soil moisture content, NPP, and WUE are provided in Supplementary Figures S5–S7.
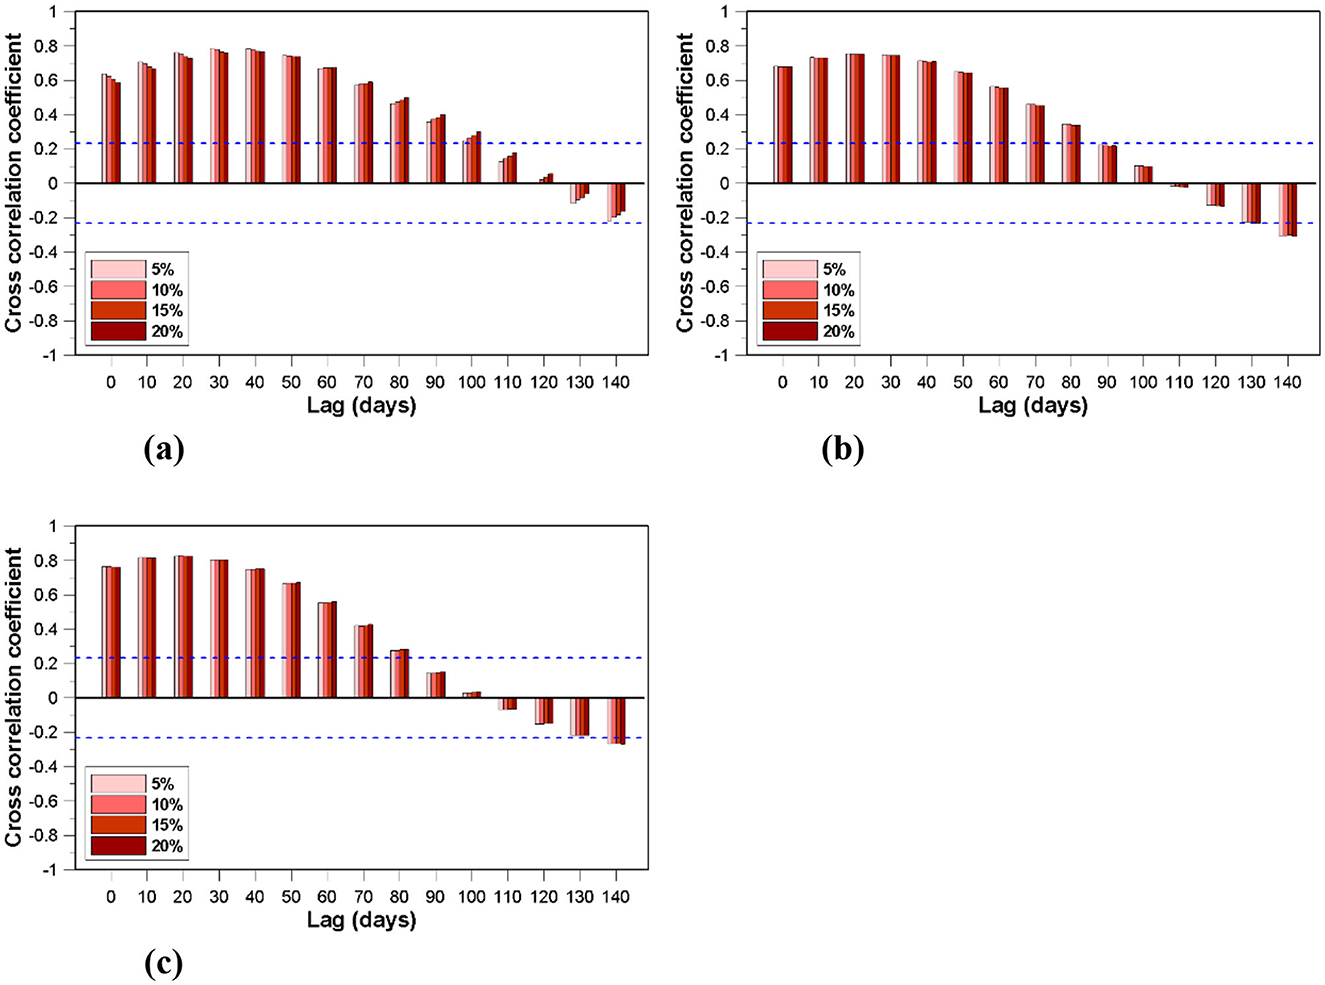
Figure 8. Time-Lagged correlation correlograms between 1-month cumulative precipitation and following GPP. Correlation coefficients for each N-day lag are calculated under four cloud seeding scenarios with precipitation increases of 5%, 10%, 15%, and 20%, indicated by different bar colors. The blue dashed lines denote the confidence interval derived from the T-test. (a) Boryeong dam basin. (b) Yongdam dam basin. (c) Namgang dam basin.
The correlogram patterns exhibit general similarity across all four variables; however, notable differences emerge in the way correlations manifest between soil moisture, representing the hydrological component, and GPP, NPP, and WUE, representing the ecological component. In the case of soil moisture, the highest correlation coefficient is observed at the time of rainfall occurrence (lag = 0) across all dam basins, with correlations becoming insignificant after approximately 50–60 days (Supplementary Figure S5). This suggests that soil moisture responds relatively promptly to the effects of cloud seeding. In contrast, GPP and NPP exhibit peak correlation coefficients with a noticeable delay of approximately 30 days, about a month, following seeding-induced rainfall, highlighting a temporal discrepancy in their response dynamics (Figure 8 and Supplementary Figure S6).
The lag duration of significant correlations for GPP and NPP varies across dam basins. In Boryeong dam basin, this correlation persists for up to 100 days, whereas in Namgang dam basin, it lasts approximately 70–80 days. Integrating these findings with the results presented in the previous section, it can be inferred that a higher proportion of forested area within a basin corresponds to a greater rate of increase in GPP and NPP in response to cloud seeding, as well as a prolonged duration of this effect (Figure 8 and Supplementary Figure S6). In contrast, a different pattern is observed for WUE. The lag time corresponding to the highest correlation coefficient ranges from approximately 40 to 60 days. While the correlograms for Boryeong and Yongdam dam basins exhibit a pattern similar to that of GPP and NPP, Namgang dam basin demonstrates relatively weaker statistical significance (Supplementary Figure S7). These findings suggest that the persistence of cloud seeding effects on ecological water use efficiency is more strongly governed by the proportion of vegetation cover rather than by basin size.
4 Discussion
Based on the correlation analysis of three dam basins, it is plausible to hypothesize that “the proportion of forest within a basin, particularly the proportion of broadleaf trees, has a more significant influence on the impact of cloud seeding than the overall basin size.” Although the reliability of this analysis is constrained by the limited sample size, the methodology employed in this study can be readily applied to a larger set of dam basins across South Korea. Expanding the analysis in this way would enable more robust validation of the proposed hypothesis or the emergence of alternative insights, thereby contributing to a more comprehensive understanding of the relationship between basin characteristics and cloud seeding outcomes. Notably, the findings of this study—specifically, that larger forested areas may enhance ecological response to cloud seeding—are supported by previous research emphasizing the ecological benefits of broadleaf afforestation (Semenyutina et al., 2016; Wu et al., 2020; Hüblová and Frouz, 2021; Cukor et al., 2022).
Previous studies have consistently demonstrated that vegetation responses to precipitation exhibit distinct time-lagged correlations across diverse climatic regions (Gessner et al., 2013; Ding et al., 2020; Kong et al., 2020). For instance, Gessner et al. (2013) reported 1–3 month lags across Central Asia, while Kong et al. (2020) highlighted daily-scale lags of 8–20 days. Extending this line of inquiry, Yoo et al. (2024) identified that cloud seeding events exhibit similar lagged effects, with vegetation activity strongly linked to interventions occurring 1–2 months prior, thereby supporting the role of cloud seeding in enhancing carbon uptake. Building on these foundations, this study advances the field by showing that the temporal dynamics of vegetation activation induced by cloud seeding are not uniform but rather strongly dependent on forest type and coverage, underscoring the importance of ecosystem-specific characteristics in shaping the ecological outcomes of weather modification.
Forest management, land use changes, and population pressure are all critical factors that can interact with or modify the ecological effects of cloud seeding. Practices such as afforestation, logging, or wildfire occurrences can directly alter hydrological cycles, while land use changes may shift soil water retention and the surface heat–moisture balance, producing heterogeneous ecological responses even under identical magnitudes of cloud seeding (Wang et al., 2021; Zhang et al., 2021). In densely populated regions, the benefits of cloud seeding may be preferentially absorbed into water use demands, drought alleviation, or agriculture, rather than ecosystem revitalization. Conversely, enhanced precipitation induced by cloud seeding could drive land use changes through agricultural expansion or modified irrigation practices (Douglas et al., 2009), while increased water availability may facilitate new forest management strategies or accelerate urban and industrial growth.
In addition to the observed enhancement of forest productivity through cloud seeding, it is also necessary to consider vegetation activation on regional hydrological and climatic conditions. Weather modification has been reported to generate feedback to local or regional climate systems through changes in evapotranspiration, surface albedo, and boundary layer processes (Bonan, 2008; Mahmood et al., 2014). Wu et al. (2016), for example, demonstrated in the central African tropical rainforest that increases in forest cover and LAI modified evapotranspiration and surface albedo, ultimately exerting a significant impact on precipitation patterns. Recent studies further highlight that, beyond precipitation enhancement alone, cloud seeding may influence surrounding systems—such as the lower atmosphere, hydrological cycle, and regional moisture flows—underscoring the importance of evaluating unintended feedback. Thus, while cloud seeding may provide ecological benefits, future investigations should systematically assess long-term land–atmosphere interactions.
This study underscores the importance of considering basin-specific forest characteristics when developing strategies to maximize the vegetation-related benefits of cloud seeding. However, several limitations must be acknowledged, and future research directions are suggested. First, precipitation scenarios adopted in this study, which assume a uniform percentage increase in annual rainfall, may simplify the complex atmospheric dynamics associated with cloud seeding. This assumption was necessary given the absence of long-term observational records of cloud seeding in South Korea, where large-scale, sustained experiments have not yet been conducted. Nevertheless, our approach is consistent with previous scenario-based studies (e.g., Acharya et al., 2011) and is informed by recent WRF-based simulations (Yoo et al., 2022, 2024). While such simplified scenarios inevitably limit the physical realism of our analysis, they provide a valuable first step in exploring the potential long-term ecological consequences of cloud seeding. Future research should incorporate more detailed process-based simulations and observational campaigns to validate and extend these findings.
We also recognize that this study is limited to three dam basins, which constrains the extent to which the findings can be generalized across broader regions. The three sites, previously investigated in national cloud seeding projects, represent diverse hydroclimatic and forest characteristics among South Korean dams, thereby lending contextual robustness to our results. These comparative insights highlight the importance of site-specific evaluation, as forest coverage and storage capacity can fundamentally alter seeding outcomes. Expanding this framework to encompass additional basins across South Korea and East Asia would enhance the generalizability and validation of the conclusions, while further analyses could also offer broader perspectives on basin-specific modeling uncertainties.
5 Conclusion
In this study, we propose a modeling framework to evaluate the ecological conservation and vegetation activity impacts of cloud seeding across three dam basins of varying scales and forest characteristics. To this end, we simulate hydrological and ecological components using long-term cloud seeding data (2020–2023) as input and assess the effects of cloud seeding on vegetation activity, respiration rates, and water use efficiency. The evaluation is conducted using the RHESSys model, calibrated for the target basins, by comparing simulation results under two scenarios: UNSD and SEED. Differences between these scenarios are quantified to elucidate the impacts of cloud seeding. The hydrological components analyzed include runoff, soil moisture, and evapotranspiration, while the ecological components encompass GPP, NPP, and vegetation respiration. This analysis enables us to examine the ecohydrological responses to cloud seeding and their interrelationships. Furthermore, we investigate the effects of delayed additional precipitation on vegetation activity and its sustained viability.
The key findings of this study are as follows. First, ecohydrological modeling under cloud seeding scenarios suggests that cloud seeding effectively enhances various hydrological and ecological variables. Among the hydrological components, runoff exhibits the highest annual increase due to cloud seeding, followed by soil moisture and evapotranspiration. In terms of vegetation activity, both GPP and NPP show the most pronounced increases. Second, while similar trends in the increase rates of hydrological and ecological components are observed across three dam basins, these trends are modulated by basin characteristics. Specifically, Namgang dam basin, which has a larger area but a lower proportion of forest cover, exhibits lower vegetation activity compared to Boryeong dam basin, which has a smaller area but a higher proportion of forest cover. This finding suggests that the effectiveness of cloud seeding is influenced more by factors such as the proportion of forested area and the dominance of broadleaf tree species rather than the overall basin size.
Third, the persistence of enhanced vegetation activity is significantly influenced by the forest characteristics of each dam basin. In terms of soil moisture, the highest correlation coefficient is observed immediately following cloud seeding events across all basins, indicating that soil moisture is the most immediate hydrological component to respond to cloud seeding. The rates of increase in GPP and NPP are higher in basins with greater forest cover, with their effects also exhibiting greater persistence. Furthermore, WUE results suggest that the proportion of vegetation, rather than basin size, plays a pivotal role in sustaining the effects of cloud seeding on vegetation water use efficiency.
This study demonstrates that cloud seeding can activate forests and vegetation, offering broad practical implications. Nationally, agencies such as the Korea Meteorological Administration, Korea Forest Service, and Korea Rural Community Corporation may employ these findings to support climate adaptation and improve agricultural productivity. Internationally, organizations including the WMO, FAO, United Nations Environment Programme (UNEP), and United Nations Office for Disaster Risk Reduction (UNDRR) could apply the results to refine weather modification guidelines, strengthen ecosystem-based adaptation, and enhance disaster risk reduction strategies. Overall, the study highlights a significant potential to contribute to sustainable forest–water–climate management while fostering global cooperation.
Data availability statement
The original contributions presented in the study are included in the article/Supplementary material, further inquiries can be directed to the corresponding author.
Author contributions
CY: Conceptualization, Formal analysis, Supervision, Writing – original draft. WN: Conceptualization, Formal analysis, Investigation, Methodology, Visualization, Writing – original draft. S-KS: Data curation, Formal analysis, Validation, Writing – review & editing. K-HC: Conceptualization, Supervision, Validation, Writing – review & editing.
Funding
The author(s) declare that financial support was received for the research and/or publication of this article. This work was supported by the National Institute of Meteorological Sciences (NIMS) through Research on Weather Modification and Cloud Physics (KMA2018-00224) and the Regional Innovation System & Education (RISE) program through the Jeju RISE center, funded by the Ministry of Education (MOE) and the Jeju Special Self-Governing Province, Republic of Korea (2025-RISE-17-001).
Conflict of interest
The authors declare that the research was conducted in the absence of any commercial or financial relationships that could be construed as a potential conflict of interest.
Generative AI statement
The author(s) declare that no Gen AI was used in the creation of this manuscript.
Any alternative text (alt text) provided alongside figures in this article has been generated by Frontiers with the support of artificial intelligence and reasonable efforts have been made to ensure accuracy, including review by the authors wherever possible. If you identify any issues, please contact us.
Publisher's note
All claims expressed in this article are solely those of the authors and do not necessarily represent those of their affiliated organizations, or those of the publisher, the editors and the reviewers. Any product that may be evaluated in this article, or claim that may be made by its manufacturer, is not guaranteed or endorsed by the publisher.
Supplementary material
The Supplementary Material for this article can be found online at: https://www.frontiersin.org/articles/10.3389/ffgc.2025.1639721/full#supplementary-material
References
Abshaev, A. M., Flossmann, A., Siems, S. T., Prabhakaran, T., Yao, Z., and Tessendorf, S. (2022). “Rain enhancement through cloud seeding,” in Unconventional Water Resources (Cham: Springer International Publishing), 21–49.
Acharya, A., Piechota, T. C., Stephen, H., and Tootle, G. (2011). Modeled streamflow response under cloud seeding in the North Platte River watershed. J. Hydrol. 409, 305–314. doi: 10.1016/j.jhydrol.2011.08.027
Ager, A. A., Day, M. A., Short, K. C., and Evers, C. R. (2016). Assessing the impacts of federal forest planning on wildfire risk mitigation in the Pacific Northwest, USA. Landsc. Urban Plan. 147, 1–17. doi: 10.1016/j.landurbplan.2015.11.007
Al Hosari, T., Al Mandous, A., Wehbe, Y., Shalaby, A., Al Shamsi, N., Al Naqbi, H., et al. (2021). The UAE cloud seeding program: a statistical and physical evaluation. Atmosphere 12:1013. doi: 10.3390/atmos12081013
Al-Jamal, M. S., Sammis, T. W., Mexal, J. G., Picchioni, G. A., and Zachritz, W. H. (2002). A growth-irrigation scheduling model for wastewater use in forest production. Agric. Water Manag. 56, 57–79. doi: 10.1016/S0378-3774(02)00003-3
Altmann, U. (2011). “Investigation of movement synchrony using windowed cross-lagged regression,” in Analysis of Verbal and Nonverbal Communication and Enactment. Eds. A. Vinciarelli, M. Pantic, and A. Nijholt (Berlin, Heidelberg: Springer), 335–345.
Alzahrani, A. S., and Abdelbaki, A. M. (2025). Evaluating cloud seeding initiatives for sustainable water supply in arid environments: insights from Al Baha, Saudi Arabia. Ain Shams Eng. J. 16:103591. doi: 10.1016/j.asej.2025.103591
Baldocchi, D. (1994). An analytical solution for coupled leaf photosynthesis and stomatal conductance models. Tree Physiol. 14, 1069–1079. doi: 10.1093/treephys/14.7-8-9.1069
Ben, Z. P. (1990). Springflow enhancement in Northern Israel due to cloud seeding. Isr. J. Earth Sci. 39, 103–117.
Bonan, G. B. (2008). Forests and climate change: forcings, feedbacks, and the climate benefits of forests. Science 320, 1444–1449. doi: 10.1126/science.1155121
Briggs, L. J., and Shantz, H. L. (1913). The Water Requirement of Plants (Nos. 284-285). Washington, DC: US Government Printing Office.
Bruintjes, R. T. (1999). A review of cloud seeding experiments to enhance precipitation and some new prospects. Bull. Am. Meteorol. Soc. 80, 805–820. doi: 10.1175/1520-0477(1999)080<0805:AROCSE>2.0.CO;2
Chen, B., Liu, Z., He, C., Peng, H., Xia, P., and Nie, Y. (2020). The regional hydro-ecological simulation system for 30 years: a systematic review. Water 12:2878. doi: 10.3390/w12102878
Chun, J. A., Baik, J., Kim, D., and Choi, M. (2018). A comparative assessment of SWAT-model-based evapotranspiration against regional-scale estimates. Ecol. Eng. 122, 1–9. doi: 10.1016/j.ecoleng.2018.07.015
Chungnam Institute (2016). Study on the Evaluation of Boryeong Dam's Water Supply Capacity and Drought Response Measures. Gongju-si: Chungnam Institute.
Cukor, J., Vacek, Z., Vacek, S., Linda, R., and Podrázský, V. (2022). Biomass productivity, forest stability, carbon balance, and soil transformation of agricultural land afforestation: a case study of suitability of native tree species in the submontane zone in Czechia. Catena 210:105893. doi: 10.1016/j.catena.2021.105893
Ding, Y., Li, Z., and Peng, S. (2020). Global analysis of time-lag and-accumulation effects of climate on vegetation growth. Int. J. Appl. Earth Obs. Geoinf. 92:102179. doi: 10.1016/j.jag.2020.102179
Douglas, E. M., Beltrán-Przekurat, A., Niyogi, D., Pielke, R. A. Sr., and Vörösmarty, C. J. (2009). The impact of agricultural intensification and irrigation on land–atmosphere interactions and Indian monsoon precipitation—a mesoscale modeling perspective. Glob. Planet. Change 67, 117–128. doi: 10.1016/j.gloplacha.2008.12.007
Durlević, U., Valjarević, A., Novković, I., Vujović, F., Josifov, N., Krušić, J., et al. (2024). Universal snow avalanche modeling index based on SAFI–Flow-R approach in poorly-gauged regions. ISPRS Int. J. Geo-Inf. 13:315. doi: 10.3390/ijgi13090315
El Masri, B., Schwalm, C., Huntzinger, D. N., Mao, J., Shi, X., Peng, C., et al. (2019). Carbon and water use efficiencies: a comparative analysis of ten terrestrial ecosystem models under changing climate. Sci. Rep. 9:14680. doi: 10.1038/s41598-019-50808-7
Fan, D., and Wei, W. (2025). Impacts of nature reserves on water–carbon relations and drought recovery time of ecosystems in the Yellow River Basin of China. Ecol. Front. 2:e12048. doi: 10.1016/j.ecofro.2025.02.013
Fonseca, R., Francis, D., Nelli, N., Farrah, S., Wehbe, Y., Al Hosari, T., et al. (2022). Assessment of the WRF model as a guidance tool into cloud seeding operations in the United Arab Emirates. Earth Space Sci. 9:e2022EA002269. doi: 10.1029/2022EA002269
Fu, G., Zhang, J., Shen, Z. X., Shi, P. L., He, Y. T., and Zhang, X. Z. (2017). Validation of collection 6 MODIS/Terra and MODIS/Aqua gross primary production in an alpine meadow of the Northern Tibetan Plateau. Int. J. Remote Sens. 38, 4517–4534. doi: 10.1080/01431161.2017.1323283
Fuentes, N., Vizcaino, L. Y., and Britto, T. S. (2018). Leaf litter production of a tropical forest of bank Santa Marta Colombia. Contemp. Eng. Sci. 11, 4301–4310. doi: 10.12988/ces.2018.88444
Gerten, D., Luo, Y., Le Maire, G., Parton, W. J., Keough, C., Weng, E., et al. (2008). Modelled effects of precipitation on ecosystem carbon and water dynamics in different climatic zones. Glob. Change Biol. 14, 2365–2379. doi: 10.1111/j.1365-2486.2008.01651.x
Gessner, U., Naeimi, V., Klein, I., Kuenzer, C., Klein, D., and Dech, S. (2013). The relationship between precipitation anomalies and satellite-derived vegetation activity in Central Asia. Glob. Planet. Change 110, 74–87. doi: 10.1016/j.gloplacha.2012.09.007
Herzog, C., Steffen, J., Graf Pannatier, E., Hajdas, I., and Brunner, I. (2014). Nine years of irrigation cause vegetation and fine root shifts in a water-limited pine forest. PLoS ONE 9:e96321. doi: 10.1371/journal.pone.0096321
Huang, H., Tian, D., Zhou, L., Su, H., Ma, S., Feng, Y., et al. (2022). Effects of afforestation on soil microbial diversity and enzyme activity: a meta-analysis. Geoderma 423:115961. doi: 10.1016/j.geoderma.2022.115961
Hüblová, L., and Frouz, J. (2021). Contrasting effect of coniferous and broadleaf trees on soil carbon storage during reforestation of forest soils and afforestation of agricultural and post-mining soils. J. Environ. Manage. 290:112567. doi: 10.1016/j.jenvman.2021.112567
Khain, A. P., and Lynn, B. (2009). Simulation of a supercell storm in clean and dirty atmosphere using weather research and forecast model with spectral bin microphysics. J. Geophys. Res. Atmos. 114:D19207. doi: 10.1029/2009JD011827
Khatri, K. B., Pokharel, B., and Strong, C. (2021). Development of hydrologically-based cloud seeding suspension criteria in the Western United States. Atmos. Res. 262:105768. doi: 10.1016/j.atmosres.2021.105768
Kong, D., Miao, C., Wu, J., Zheng, H., and Wu, S. (2020). Time lag of vegetation growth on the Loess Plateau in response to climate factors: estimation, distribution, and influence. Sci. Total Environ. 744:140726. doi: 10.1016/j.scitotenv.2020.140726
Leyrer, V., Patulla, M., Hartung, J., Marhan, S., and Poll, C. (2022). Long-term manipulation of mean climatic conditions alters drought effects on C-and N-cycling in an arable soil. Glob. Change Biol. 28, 3974–3990. doi: 10.1111/gcb.16173
Li, D., Liu, J., Verhoef, A., Xi, B., and Hernandez-Santana, V. (2021). Understanding the relationship between biomass production and water use of Populus tomentosa trees throughout an entire short-rotation. Agric. Water Manag. 246:106710. doi: 10.1016/j.agwat.2020.106710
Li, Z., Tang, H., Zhang, B., Yang, G., and Xin, X. (2015). Evaluation and intercomparison of MODIS and GEOV1 global leaf area index products over four sites in North China. Sensors 15, 6196–6216. doi: 10.3390/s150306196
Lie, Z., Xue, L., and Jacobs, D. F. (2018). Allocation of forest biomass across broad precipitation gradients in China's forests. Sci. Rep. 8:10536. doi: 10.1038/s41598-018-28899-5
Lin, K. I., Chung, K. S., Wang, S. H., Chen, L. H., Liou, Y. C., Lin, P. L., et al. (2023). Evaluation of hygroscopic cloud seeding in warm-rain processes by a hybrid microphysics scheme using a Weather Research and Forecasting (WRF) model: a real case study. Atmos. Chem. Phys. 23, 10423–10438. doi: 10.5194/acp-23-10423-2023
Ma, J. H., Yoo, C., Song, S. U., Na, W., Cho, E., Song, S. K., et al. (2023). Different effect of cloud seeding on three dam basins, Korea. Water 15:2555. doi: 10.3390/w15142555
Mahmood, R., Pielke Sr, R. A., Hubbard, K. G., Niyogi, D., Dirmeyer, P. A., McAlpine, C., et al. (2014). Land cover changes and their biogeophysical effects on climate. Int. J. Climatol. 34, 929–953. doi: 10.1002/joc.3736
Mahmoud, S. H., Adamowski, J., Alazba, A. A., and El-Gindy, A. M. (2016). Rainwater harvesting for the management of agricultural droughts in arid and semi-arid regions. Paddy Water Environ. 14, 231–246. doi: 10.1007/s10333-015-0493-z
Méndez-Barroso, L. A., Vivoni, E. R., Watts, C. J., and Rodríguez, J. C. (2009). Seasonal and interannual relations between precipitation, surface soil moisture and vegetation dynamics in the North American monsoon region. J. Hydrol. 377, 59–70. doi: 10.1016/j.jhydrol.2009.08.009
Metwally, S. Y., and Pollard, A. G. (1959). Effects of soil moisture conditions on the uptake of plant nutrients by barley and on the nutrient content of the soil solution. J. Sci. Food Agric. 10, 632–636. doi: 10.1002/jsfa.2740101109
Mondal, S. K., An, S. I., Min, S. K., Jiang, T., and Su, B. (2024). Enhanced soil moisture–temperature coupling could exacerbate drought under net-negative emissions. npj Clim. Atmos. Sci. 7:265. doi: 10.1038/s41612-024-00820-0
Moon, S. H., Lim, Y. K., Song, S. K., Lee, S. S., Kang, C. Y., Ko, E. A., et al. (2025). Effects of cloud seeding on precipitation based on long-term numerical simulations and seasonal case analyses. Adv. Atmos. Sci. 42, 2352–2364. doi: 10.1007/s00376-025-4476-8
National Institute of Meteorological Sciences (2023). A Study on the Development of Artificial Rainfall Operation Technology and Effect Analysis Using Observed and Simulated Data for Continuous Experiments. Seoguipo.
National Institute of Meteorological Sciences (2024). Assessment of Artificial Rainfall Effects on Air Quality and Ecosystem Protection, and Analysis of Cloud—Precipitation Observation Characteristics. Seoguipo.
Norby, R. J., and Zak, D. R. (2011). Ecological lessons from free-air CO2 enrichment (FACE) experiments. Annu. Rev. Ecol. Evol. Syst. 42, 181–203. doi: 10.1146/annurev-ecolsys-102209-144647
Podobnik, B., Wang, D., Horvatic, D., Grosse, I., and Stanley, H. E. (2010). Time-lag cross-correlations in collective phenomena. Europhys. Lett. 90:68001. doi: 10.1209/0295-5075/90/68001
Pokharel, B., Wang, S. Y. S., Gu, H., LaPlante, M. D., Serago, J. M., Gillies, R. R., et al. (2021). A modeling examination of cloud seeding conditions under the warmer climate in Utah, USA. Atmos. Res. 248:105239. doi: 10.1016/j.atmosres.2020.105239
Pu, J., Yan, K., Roy, S., Zhu, Z., Rautiainen, M., Knyazikhin, Y., et al. (2023). Sensor-independent LAI/FPAR CDR: reconstructing a global sensor-independent climate data record of MODIS and VIIRS LAI/FPAR from 2000 to 2022. Earth Syst. Sci. Data 15, 3701–3722. doi: 10.5194/essd-2023-356
Rog, I., Tague, C., Jakoby, G., Megidish, S., Yaakobi, A., Wagner, Y., et al. (2021). Interspecific soil water partitioning as a driver of increased productivity in a diverse mixed Mediterranean forest. J. Geophys. Res. Biogeosci. 126:e2021JG006382. doi: 10.1029/2021JG006382
Rohr, T., Manzoni, S., Feng, X., Menezes, R. S. C., and Porporato, A. (2013). Effect of rainfall seasonality on carbon storage in tropical dry ecosystems. J. Geophys. Res. Biogeosci. 118, 1156–1167. doi: 10.1002/jgrg.20091
Running, S. W., and Zhao, M. (2015). Daily GPP and annual NPP (MOD17A2/A3) products NASA Earth Observing System MODIS land algorithm. MOD17 User's Guide. 2015, 1–28.
Ryan, B. F., and King, W. D. (1997). A critical review of the Australian experience in cloud seeding. Bull. Am. Meteorol. Soc. 78, 239–254. doi: 10.1175/1520-0477(1997)078<0239:ACROTA>2.0.CO;2
Saksa, P. C., Conklin, M. H., Tague, C. L., and Bales, R. C. (2020). Hydrologic response of Sierra Nevada mixed-conifer headwater catchments to vegetation treatments and wildfire in a warming climate. Front. For. Glob. Change 3:539429. doi: 10.3389/ffgc.2020.539429
Sanchez-Martinez, P., Martius, L. R., Bittencourt, P. R. L., da Silva, M. C., Binks, O., Coughlin, I., et al. (2025). Amazon rainforest adjusts to long-term experimental drought. Nat. Ecol. Evol. 9, 970–979. doi: 10.1038/s41559-025-02702-x
Semenyutina, A., Huzhahmetova, A., and Semenyutina, V. (2016). Regulations of safe and sustainable use of biodiversity of woody plants in protective afforestation. J. Agric. Environ. 3:3. doi: 10.23649/jae.2018.3.7.3
Sharma, A., Kumar, A., Shankar, V., and Thakur, P. K. (2024). Hydrological modeling for rainfall–runoff assessment in a sub-Himalayan catchment using a distributed MIKE SHE/MIKE+ model. Water Pract. Technol. 19, 2929–2943. doi: 10.2166/wpt.2024.158
Skamarock, W. C., Klemp, J. B., Dudhia, J., Gill, D. O., Barker, D. M., Duda, M. G., et al. (2005). A Description of the Advanced Research WRF Version 2 (No. NCARTN468STR). Boulder, CO: National Science Foundation – National Center for Atmospheric Research.
Smerdon, B. D., Redding, T., and Beckers, J. (2009). An overview of the effects of forest management on groundwater hydrology. J. Ecosyst. Manag. 10, 1–16. doi: 10.22230/jem.2009v10n1a409
Smith, A., Tetzlaff, D., Kleine, L., Maneta, M. P., and Soulsby, C. (2021). Quantifying the effects of land use and model scale on water partitioning and water ages using tracer-aided ecohydrological models. Hydrol. Earth Syst. Sci. 25, 2239–2259. doi: 10.5194/hess-25-2239-2021
Tague, C. L., and Band, L. E. (2004). RHESSys: Regional Hydro-Ecologic Simulation System—an object-oriented approach to spatially distributed modeling of carbon, water, and nutrient cycling. Earth Interact. 8, 1–42. doi: 10.1175/1087-3562(2004)8<1:RRHSSO>2.0.CO;2
Tague, C. L., McDowell, N. G., and Allen, C. D. (2013). An integrated model of environmental effects on growth, carbohydrate balance, and mortality of Pinus ponderosa forests in the southern Rocky Mountains. PLoS ONE 8:e80286. doi: 10.1371/journal.pone.0080286
Terêncio, D. P. S., Fernandes, L. F. S., Cortes, R. M. V., Moura, J. P., and Pacheco, F. A. L. (2018). Rainwater harvesting in catchments for agro-forestry uses: a study focused on the balance between sustainability values and storage capacity. Sci. Total Environ. 613-614, 1079–1092. doi: 10.1016/j.scitotenv.2017.09.198
Tripathi, A., Tiwari, P. K., Misra, A. K., and Kang, Y. (2022). Impacts of transpiration of agricultural crops and seeding on rainfall: implications from a mathematical model. Int. J. Biomathematics 15:2250028. doi: 10.1142/S1793524522500280
Valjarević, A., Popovici, C., Štilić, A., and Radojković, M. (2022). Cloudiness and water from cloud seeding in connection with plants distribution in the Republic of Moldova. Appl. Water Sci. 12:262. doi: 10.1007/s13201-022-01784-3
Vujović, F., Valjarević, A., Durlević, U., Morar, C., Grama, V., Spalević, V., et al. (2025). A comparison of the AHP and BWM models for the flash flood susceptibility assessment: a case study of the Ibar River Basin in Montenegro. Water 17:844. doi: 10.3390/w17060844
Wang, T., Xu, Q., Gao, D., Zhang, B., Zuo, H., and Jiang, J. (2021). Effects of thinning and understory removal on the soil water-holding capacity in Pinus massoniana plantations. Sci. Rep. 11:13029. doi: 10.1038/s41598-021-92423-5
Wang, W., Yao, Z., Guo, J., Tan, C., Jia, S., Zhao, W., et al. (2019). The extra-area effect in 71 cloud seeding operations during winters of 2008–14 over Jiangxi Province, East China. J. Meteorol. Res. 33, 528–539. doi: 10.1007/s13351-019-8122-1
Wei, J., Su, H., and Yang, Z. L. (2016). Impact of moisture flux convergence and soil moisture on precipitation: a case study for the southern United States with implications for the globe. Climate Dynamics, 46, 467–481. doi: 10.1007/s00382-015-2593-2
Wondie, M. (2023). Modeling cloud seeding technology for rain enhancement over the arid and semiarid areas of Ethiopia. Heliyon 9:e15403. doi: 10.1016/j.heliyon.2023.e14974
Wu, D., Xie, X., Tong, J., Meng, S., and Wang, Y. (2020). Sensitivity of vegetation growth to precipitation in a typical afforestation area in the loess plateau: plant-water coupled modelling. Ecol. Model. 430:109128. doi: 10.1016/j.ecolmodel.2020.109128
Wu, M., Schurgers, G., Rummukainen, M., Smith, B., Samuelsson, P., Jansson, C., et al. (2016). Vegetation–climate feedbacks modulate rainfall patterns in Africa under future climate change. Earth Syst. Dyn. 7, 627–647. doi: 10.5194/esd-7-627-2016
Yoo, C., Na, W., Chang, K. H., and Song, S. K. (2024). Ecohydrological investigation of cloud seeding effect on vegetation activity in the Boryeong Dam Basin, South Korea. Sci. Total Environ. 940:173598. doi: 10.1016/j.scitotenv.2024.173598
Yoo, C., Na, W., Cho, E., Chang, K. H., Yum, S. S., and Jung, W. (2022). Evaluation of cloud seeding on the securement of additional water resources in the Boryeong Dam Basin, Korea. J. Hydrol. 613:128480. doi: 10.1016/j.jhydrol.2022.128480
Zarnetske, P. L., Gurevitch, J., Franklin, J., Groffman, P. M., Harrison, C. S., Hellmann, J. J., et al. (2021). Potential ecological impacts of climate intervention by reflecting sunlight to cool Earth. Proc. Natl. Acad. Sci. U. S. A. 118:e1921854118. doi: 10.1073/pnas.1921854118
Zhang, Y. W., Wang, K. B., Wang, J., Liu, C., and Shangguan, Z. P. (2021). Changes in soil water holding capacity and water availability following vegetation restoration on the Chinese Loess Plateau. Sci. Rep. 11:9692. doi: 10.1038/s41598-021-88914-0
Keywords: cloud seeding, ecohydrological model, forest characteristics, vegetation growth, scenario-based analysis, lagged correlation analysis
Citation: Yoo C, Na W, Song S-K and Chang K-H (2025) Comparative ecological responses to cloud seeding in three forested basins of South Korea. Front. For. Glob. Change 8:1639721. doi: 10.3389/ffgc.2025.1639721
Received: 02 June 2025; Accepted: 27 October 2025;
Published: 17 November 2025.
Edited by:
Aleksandar Valjarević, University of Belgrade, SerbiaReviewed by:
Uroš Durlević, University of Belgrade, SerbiaDragica Živković, University of Belgrade, Serbia
Arvind Misra, Banaras Hindu University, India
Copyright © 2025 Yoo, Na, Song and Chang. This is an open-access article distributed under the terms of the Creative Commons Attribution License (CC BY). The use, distribution or reproduction in other forums is permitted, provided the original author(s) and the copyright owner(s) are credited and that the original publication in this journal is cited, in accordance with accepted academic practice. No use, distribution or reproduction is permitted which does not comply with these terms.
*Correspondence: Wooyoung Na, d25hOTJAZGF1LmFjLmty