Abstract
Introduction:
The vegetation at the Sichuan-Tibet Interface (STI) in China serves as a core element in maintaining the ecological barrier function of the Qinghai-Tibet Plateau, playing a crucial role in safeguarding the ecological service functions of Southwest China.
Methods:
Based on normalized difference vegetation index (NDVI) data in August between 2001 and 2023, this study investigates the spatiotemporal variations in vegetation coverage during the peak growth period across adjacent administrative boundaries (STI-Tibet and STI-Sichuan), analyzes the time-lag effects of major climatic factors on it with Pearson’s correlation, and explores the driving factors by dream optimization algorithm-random forest model and Optimal parameter geographic detector.
Results:
The research has found that the average NDVI value in STI regions was between 0.6 and 0.8 with a growth rate of 0.009 per decade, and 68.41% of areas showed higher mean NDVI from 2012–2023 compared to 2001–2011. STI-Sichuan displays higher proportions of both medium-low and high vegetation coverage and lower proportions of middle-high vegetation coverage compared to STI-Tibet, but STI-Sichuan showed higher proportions of non-significant increase, significant increase, and extremely significant increase compared to STI-Tibet. The NDVI shift in STI-Sichuan occurred approximately 2 years earlier than in STI-Tibet, with greater magnitude and coverage. NDVI response lags to growing-season temperature, precipitation, and solar radiation are 2 months, 1 month, and immediate, respectively. Elevation significantly impacts NDVI across both regions; however, temperature exerts greater influence in STI-Sichuan, while precipitation predominantly affects STI-Tibet. Dual-factor interactions generally enhance explanatory power, reflected by increased q-values.
Discussion:
These findings provide valuable insights for transboundary vegetation management and conservation. Further research could encompass a broader range of ecological elements, and formulate targeted ecological restoration strategies.
1 Introduction
The ecological environment is intrinsically linked to regional sustainable development (You et al., 2023). Vegetation, as a fundamental element of terrestrial ecosystems, significantly influences environmental stability (Chen et al., 2023). In the 21st century, climatic and environmental shifts combined with expanding anthropogenic activities have profoundly altered surface vegetation patterns (Mehmood et al., 2024) exacerbating threats to ecologically vulnerable regions. Several indices are utilized in current ecological research to characterize vegetation health, including the vegetation health index (VHI) (Chen Y. et al., 2024), vegetation condition index (VCI) (Yin et al., 2024), leaf area index (LAI) (Chen et al., 2025a), and normalized difference vegetation index (NDVI) (Oliveira et al., 2025). These indicators vary in regional suitability; however, NDVI stands out for its extensive applicability and precision in diverse ecosystems globally (Mehmood et al., 2024), including tropical (Mohanasundaram et al., 2022), arid (Bento et al., 2020), and plateau regions (Guo et al., 2014). Given the challenging hydrothermal conditions prevalent in plateau ecosystems, vegetation health on the Mongolian Plateau (Li et al., 2023), Loess Plateau (Zhao et al., 2023) and Qinghai-Tibet Plateau (Liu X. et al., 2024), is particularly critical. Li et al. (2024) reported an overall declining trend in NDVI within the Mongolian Plateau’s permafrost areas between 2014 and 2023, noting that rising temperatures initially promoted vegetation growth during early permafrost degradation phases, whereas increased precipitation negatively impacted vegetation growth. Additionally, vegetation activity in Mongolia displays marked instability, strongly linked to annual variations in livestock production, presenting notably higher instability compared to surrounding regions (Zhao et al., 2021). By contrast, studies on the Loess Plateau, such as those from Yao Z. et al. (2025) and Song et al. (2024), have consistently documented increasing vegetation coverage over the past three decades, with a significant northward migration of the vegetation greenness line from 2005 to 2010. The Qinghai-Tibet Plateau similarly exhibits an accelerating upward NDVI trend post-2000, particularly pronounced during spring and autumn (Wang et al., 2023). Nonetheless, this general trend masks localized disparities, such as stable or declining NDVI in low-altitude alpine steppe regions such as Zhegucuo Valley (Zhao et al., 2024). Despite extensive research, comparative analyses across administrative boundaries and temporal scales remain limited.
Vegetation conditions across regions are influenced by a range of environmental factors. In the Chengdu-Chongqing region, human activities notably surpass natural environmental factors in influencing NDVI, and their interaction significantly amplifies explanatory power regarding NDVI spatial distribution (Zhang et al., 2013). A similar dominance of anthropogenic impacts over natural factors also occurs in the southern Qinghai-Tibet Plateau (Zhao et al., 2024). Conversely, Wu et al. (2024) highlighted increased climatic sensitivity of vegetation on 61% of the Qinghai-Tibet Plateau during 1982–2015, projecting heightened responsiveness to temperature shifts in the eastern and southeastern regions. Deng et al. (2024) demonstrated positive contributions of temperature and precipitation to NDVI in the western Sichuan Plateau, albeit with a 1–3 month lag. These findings underscore that even within climatically uniform plateau areas, the relative influences of anthropogenic and environmental factors on vegetation differ considerably by locality. To quantify these influences, statistical correlation analyses (Jumana and Rounak, 2024), geographical detector methods (Zhang et al., 2013; Dong et al., 2021), and increasingly prevalent machine learning models are widely applied, effectively capturing nonlinear dynamics between vegetation health and environmental factors (Wang et al., 2022).
Apart from climate, factors such as soil type, altitude, and land use also necessitate detailed examination. Existing studies predominantly focus on natural watersheds or administrative boundaries as research units (Ou et al., 2022), potentially overlooking ecological and environmental differences arising from distinct administrative jurisdictions in adjacent regions. The high-altitude position of the Sichuan-Tibet Interface (STI), combined with recent climatic extremes, inherently contributes to ecological vulnerability in this region (Sheng et al., 2024). August represents the peak period of vegetation activity due to elevated summer temperatures and ample sunlight, thus serving as a highly representative and specific month for analysis (Zheng et al., 2015). However, recent heatwaves during summer months have heightened drought risks in August (Ran et al., 2024), complicating vegetation protection and ecological monitoring efforts.
In summary, the unique geographical and ecological attributes of the STI require targeted research on NDVI dynamics and their driving factors within clearly defined administrative zones and periods. Therefore, this study breaks through the traditional research paradigm based on natural watersheds or single administrative units. Utilizing August NDVI data from a comparative perspective that crosses provincial administrative boundaries, it aims to: (1) elucidate the heterogeneity in August NDVI variation trends and vegetation cover types between STI-Sichuan and STI-Tibet; (2) comprehensively apply lag correlation analysis to explore the lagged response of August NDVI to climatic factors (temperature, precipitation, solar radiation) from different months; (3) employ hyperparameter-optimized random forest and optimal parameter-based geographical detector (OPGD) methods to evaluate the individual and interactive effects of multiple driving factors on August NDVI in the STI region. This study provides new evidence for understanding the impact of administrative boundaries on ecosystems.
2 Materials and methods
2.1 Study area
The STI, located between Sichuan and Tibet (98°E–100°E, 29.5°N–32°N), features mountainous terrain averaging over 4,000 m in altitude, situated above the water vapor transport layer of 850–700 hPa (Figure 1). It exhibits a plateau mountain climate, receiving approximately 600 mm of annual precipitation (Li et al., 2010). Vegetation coverage is extensive, dominated by evergreen coniferous forests, evergreen broadleaf forests, and deciduous broadleaf forests. The Jinsha River traverses the STI from north to south, delineating the Tibetan side (west) from the Sichuan side (east). The region’s topography is notably diverse and complex, comprising plateaus, high mountains, and valleys rich in mountainous and karst landscapes (Feng et al., 2023). Although the National Highway 318 connects these areas east to west, the region remains sparsely populated with poor transportation infrastructure, low economic development, and low ecological resilience to disturbances.
Figure 1

Geographical location of the study area [The map of China on the left includes the South China Sea area (marked with red curved dashed lines), and the red box on the left represents the specific location of the study area in China.] [GS (2022) 1873].
2.2 Research methods
2.2.1 Linear trend estimation
Linear trend, suitable for analyzing two-variable relationships (X, Y) Jin et al. (2023) was employed in this study to examine the temporal trend of regional NDVI means. The fundamental equation is expressed as Equation 1:
where yt represents the observed NDVI at time point, xt is the NDVI corresponding to the time point, b is a constant, and a is the linear regression coefficient.
2.2.2 Mann–Kendall (M–K) trend/mutation test
The Mann–Kendall (M–K) trend test, a nonparametric statistical method, is particularly effective for meteorological and hydrological datasets (Yue et al., 2002). Given a time series E = {x1, x2, …, xn}, the M–K trend test statistic is calculated as Equation 2:
where xj denotes the jth (2 ≤ j ≤ n) observation of the observations E = {x1, x2, …, xn}, n is the length (sample size) of the time series, and the sgn is the sign function. When the input value is greater than 0, equal to 0, or less than 0, the output value is 1, 0, or −1, respectively.
The statistic S exhibits an nearly normal distribution (n ≥ 8), and its variance is calculated as Equation 3:
The standardized statistic Z can be calculated as Equation 4:
Z > 0, Z = 0, and Z < 0 indicate upward, stable, and downward trends, respectively.
The M–K mutation test is adopted to test for sudden changes in NDVI. For a time series, x with n samples, a rank sequence can be constructed as Equation 5:
where r is as Equation 6:
Defines statistics under the condition where the time series is randomly independent as Equation 7:
where UF1 = 0, , and are the mean and variance of , respectively.
The above process is repeated in reverse chronological order to construct the UBk curve, providing a significance level of α = 0.05. The intersection point of these two curves indicates the onset time of abrupt change.
2.2.3 Pearson’s correlation
This study employs the Pearson correlation coefficient to examine the relationships between rainfall, temperature, solar radiation in May, June, July, August and NDVI in August. This method is widely used in vegetation and climate change studies (Jiao et al., 2024).
2.2.4 Dream optimization algorithm-random forest model with SHAP
The random forest (RF) algorithm, a decision-tree-based machine learning model proposed by Breiman, generates training subsets through bootstrap resampling of the original dataset. Multiple decision trees, each constructed from these subsets, collectively form a random forest. The regression result is obtained by aggregating the individual trees’ voting scores, thus ensuring high robustness (Breiman, 2001).
The dream optimization algorithm (DOA) integrates a fundamental memory strategy, a forgetting-replenishment mechanism for balancing exploration and exploitation, and a dream-sharing strategy to improve its ability to avoid local optima. The pseudocode of the DOA is detailed by Lang and Gao (2025). DOA optimizes RF model parameters, specifically n_estimators (50–500), max_depth (3–30), min_samples_leaf (1–30), min_samples_split (2–30), and max_features (0.1–0.999).
Shapley additive explanations (SHAP) represent a model interpretation method grounded in game theory, designed to quantify each feature’s contribution to model predictions (Zhang et al., 2022). During SHAP analysis. The statistical significance (p-value) is calculated via Spearman correlation between the variables’ feature values and their corresponding SHAP values.
2.2.5 Optimal parameter geographic detector (OPGD)
The optimal parameter-based geographical detector (OPGD) enhances the explanatory power for dependent variables, analytical efficiency, and adaptability to complex geographical phenomena by automatically optimizing discretization methods, category numbers, and spatial scales (Song et al., 2020). OPGD demonstrating improved stability and reliability across diverse geographical conditions and data characteristics.
OPGD is implemented within RStudio to objectively classify continuous variables, detect spatial heterogeneity, and identify driving factors influencing NDVI spatial distribution (Chen Z. et al., 2024). The q-value (q ∈ [0,1]) for each continuous factor by applying various classification methods and segmentation intervals. The q-value formula is as Equation 8:
where q quantifies the explanatory power of the factor; h indicates stratification of the explanatory or dependent variable; Nh and N denote the number of units in layer h and the entire study area, respectively; region, respectively, and and represent the variance of layer h and the whole region value, respectively. Interaction effects are examined through interaction detection, categorized primarily in Table 1.
Table 1
| Interaction types | Formula expressions |
|---|---|
| Nonlinear attenuation | q(X1∩X2) < min(q(X1), q(X2)) |
| Single-factor nonlinear attenuation | min(q(X1), q(X2)) < q(X1∩X2) < max(q(X1), q(X2)) |
| Double-factor enhancement | q(X1∩X2) > max(q(X1), q(X2)) |
| Independent | q(X1∩X2) = q(X1) + q(X2) |
| Nonlinearity enhancement | q(X1∩X2) > q(X1) + q(X2) |
Interaction types and the formula expressions.
2.3 Data sources and preprocessing
2.3.1 Data sources and partition
Environmental, climatic, vegetation, and related datasets are employed in this study, with original formats and specific sources detailed in Table 2. These datasets, frequently used in ecology, environmental science, and meteorology research (Liu H. et al., 2024; Huang et al., 2024; Xie et al., 2024), meet high-quality control standards suitable for this analysis.
Table 2
| Data name | Resolution ratio | Source |
|---|---|---|
| NDVI | 30 m × 30 m | http://www.nesdc.org.cn |
| Temperature (2 m) (Tem) | 1 km × 1 km | http://www.geodata.cn |
| Precipitation (Pre) | 1 km × 1 km | |
| Solar radiation (Srd) | 0.1° × 0.1° | https://cds.climate.copernicus.eu/datasets |
| Land use-cover change (LUCC) | 1 km × 1 km | https://www.resdc.cn/data.aspx?DATAID=360 |
| Slope | 30 m × 30 m | https://www.gscloud.cn/ |
| Digital elevation model (DEM) | 30 m × 30 m | |
| Total nitrogen (TN) | 30″ × 30″ | Wei et al. (2013) |
| Total phosphorus (TP) | 30″ × 30″ | |
| pH-value (pH) | 30″ × 30″ |
Basic information of the data used in this study.
STI region is sparsely populated (avg. 7 persons/km2), with 62.4% rural population and per capita GDP of 21,900 yuan (Yang et al., 2025). Its high altitude, complex terrain, and harsh climate further limit human activity intensity (Pu et al., 2025). As a result, purely socioeconomic metrics (e.g., GDP, nighttime lights) exhibit low spatial variability and limited explanatory power over vegetation patterns at large scales. By comparison, the land use and change (LUCC) indicator integrate both natural and anthropogenic factors, more effectively capturing the key environmental gradients governing vegetation distribution in this high-altitude region.
The DEM data were sourced from ASTER GDEM V3, while the slope was derived through calculations performed in ArcGIS software. The raw soil-related data were obtained through an integrated process of data synthesis (including field measurements) and spatial interpolation. The LUCC data originated from the Chinese Multi-Period Land Use Remote Sensing Monitoring Dataset, which adopts a two-tier classification system to categorize over twenty types of land cover.
NDVI and climatic variables possess a monthly temporal resolution. Among them, NDVI is calculated using Landsat 5/7/8/9 remote sensing data. Through a series of data preprocessing and smoothing methods, the required NDVI values are obtained using the formula NDVI = (NIR − R)/(NIR + R), where NIR represents the near-infrared band and R represents the red band. The meteorologically related data were generated through a spatial downscaling scheme based on the global 0.5° climate data released by CRU and the global high-resolution climate data from World Clim, and were validated using 496 independent meteorological observation stations.
Original data formats varied (.tif, .nc). All datasets, excluding solar radiation, were converted into a unified.nc format using Python scriptsand aligned to the WGS-1984 coordinate system. Among the aforementioned datasets, the spatial coverage is national (or global). The data was clipped to align with the study area extent and ensured consistent pixel sizes (1 km × 1 km) through resampling.
To facilitate comparative analysis of NDVI trends and their influencing factors across varying periods and regions, the Sichuan-Tibet Interface (STI) was partitioned into two temporal phases and two spatial regions, separated by the provincial boundary of Sichuan Province (defined by the Jinsha River): Tibet side (2001–2011), Sichuan side (2001–2011), Tibet side (2012–2023), and Sichuan side (2012–2023). Temporal segmentation criteria included: (1) significant advancements in Ecological Civilization Construction (ECC) post-2012 (Yan and Sun, 2023); (2) equitable distribution of study periods. Spatial segmentation followed natural administrative boundaries. Machine learning computations utilized Python’s Scikit-Learn library, whereas optimal parameter geographic detector (OPGD) analyses employed the GD package in RStudio.
2.3.2 Selection of machine learning models
Vegetation dynamics are governed by numerous external variables, often exhibiting nonlinear relationships. Among these, climatic conditions, terrain morphology, and soil physicochemical properties significantly influence vegetation growth. Due to its coarse spatial resolution, solar radiation data were excluded from spatial analyses. Water availability and thermal conditions are critical for vegetation growth (Gu et al., 2018). Thus, temperature and precipitation data from June to August—characterized by elevated temperatures and concentrated precipitation—were selected to assess hydrothermal impacts on August NDVI values. Land Use and Cover Change (LUCC) reflects anthropogenic activity, while variations in slope and elevation further influence vegetation density (Zhang et al., 2018). Essential soil nutrients such as nitrogen, phosphorus, and pH significantly affect plant health (Musa et al., 2022). Considering the variations in root depth among arbor, shrub, and herbaceous vegetation (Yao Y. et al., 2025), two representative soil depths (−16 cm and −50 cm) were selected for analysis.
This study investigates the spatial distribution patterns of August NDVI in the STI, treating NDVI as the response variable and 15 environmental factors as explanatory variables (Table 3), to elucidate their driving effects.
Table 3
| Code | Variables | Code | Variables |
|---|---|---|---|
| X1 | Temperature, Tem (June) | X9 | Precipitation, Pre (August) |
| X2 | Temperature, Tem (July) | X10 | Total nitrogen, TN (16 cm) |
| X3 | Temperature, Tem (August) | X11 | Total nitrogen, TN (50 cm) |
| X4 | Land use-cover change, LUCC | X12 | Total phosphorus, TP (16 cm) |
| X5 | Digital Elevation Model, DEM | X13 | Total phosphorus, TP (50 cm) |
| X6 | pH (50 cm) | X14 | Slope |
| X7 | Precipitation, Pre (June) | X15 | pH (16 cm) |
| X8 | Precipitation, Pre (July) | ||
Driving factors of NDVI spatial distribution.
Machine learning models—including XGBoost, Random Forest (RF), CatBoost, LightGBM, and Multiple Linear Regression—were trained using variables listed in Table 4 across four spatiotemporal domains: Tibet side (2001–2011), Sichuan side (2001–2011), Tibet side (2012–2023), and Sichuan side (2012–2023). Each model training involved a random division into training datasets of 80% and testing datasets of 20%, repeated tenfold, with metrics averaged from test set performances (results presented in Table 4). RF emerged as the optimal performer and was subsequently enhanced using the DOA method to quantify environmental factor contributions.
Table 4
| Models | Evaluation metrics | STI-Tibet (2001–2011) | STI-Sichuan (2001–2011) | STI-Tibet (2012–2023) | STI-Sichuan (2012–2023) |
|---|---|---|---|---|---|
| XGBOOST | R2 | 0.7288 | 0.8007 | 0.7307 | 0.8122 |
| RMSE | 0.0575 | 0.0709 | 0.0581 | 0.0714 | |
| MAE | 0.0425 | 0.0506 | 0.0421 | 0.0517 | |
| Random Forest | R2 | 0.7371 | 0.8025 | 0.7411 | 0.8153 |
| RMSE | 0.0564 | 0.0710 | 0.0573 | 0.0711 | |
| MAE | 0.0414 | 0.0506 | 0.0415 | 0.0509 | |
| CatBoost | R2 | 0.7293 | 0.7993 | 0.7297 | 0.8134 |
| RMSE | 0.0576 | 0.0576 | 0.0579 | 0.0713 | |
| MAE | 0.0425 | 0.0425 | 0.0424 | 0.052 | |
| LightGBM | R2 | 0.7259 | 0.8010 | 0.7367 | 0.8171 |
| RMSE | 0.0575 | 0.0712 | 0.0574 | 0.0709 | |
| MAE | 0.0423 | 0.0516 | 0.0422 | 0.0515 | |
| MLR | R2 | 0.4050 | 0.5120 | 0.4030 | 0.5980 |
| RMSE | 0.0858 | 0.1132 | 0.0869 | 0.1043 | |
| MAE | 0.0634 | 0.0864 | 0.0642 | 0.0781 |
Comparison of Training Performance among Different Machine Learning Models.
2.3.3 Preprocessing data of the OPGD model
Continuous variables (Table 3), excluding X4, required discretization for optimal parameter analysis, achieved using RStudio’s GD package.
3 Results
3.1 NDVI spatiotemporal characteristics
Based on pixel-level statistics, the NDVI box plot for August within the specified period was constructed (Figure 2a). Between 2001 and 2023, peak NDVI values in the STI regions exhibited minimal variation, consistently approaching or equaling 1. According to Figure 2c, the average NDVI values from 2001 to 2023 predominantly ranged between 0.6 and 0.7, with notably lower averages recorded in 2003 and 2008, and a higher average in 2020. Linear regression analysis revealed a slight, statistically insignificant upward trend in NDVI, increasing at a rate of approximately 0.009 per decade. The Mann-Kendall trend test results (Figure 2b) indicated an upward NDVI trend covering 69.71% of the STI region, primarily located along the periphery of the Jinsha River basin, while regions exhibiting a downward trend comprised approximately 30.29%, concentrated mainly in Mangkang and western Gongjue. In the STI region, approximately 9.09% of the area displayed statistically significant NDVI trend changes (p ≤ 0.05).
Figure 2
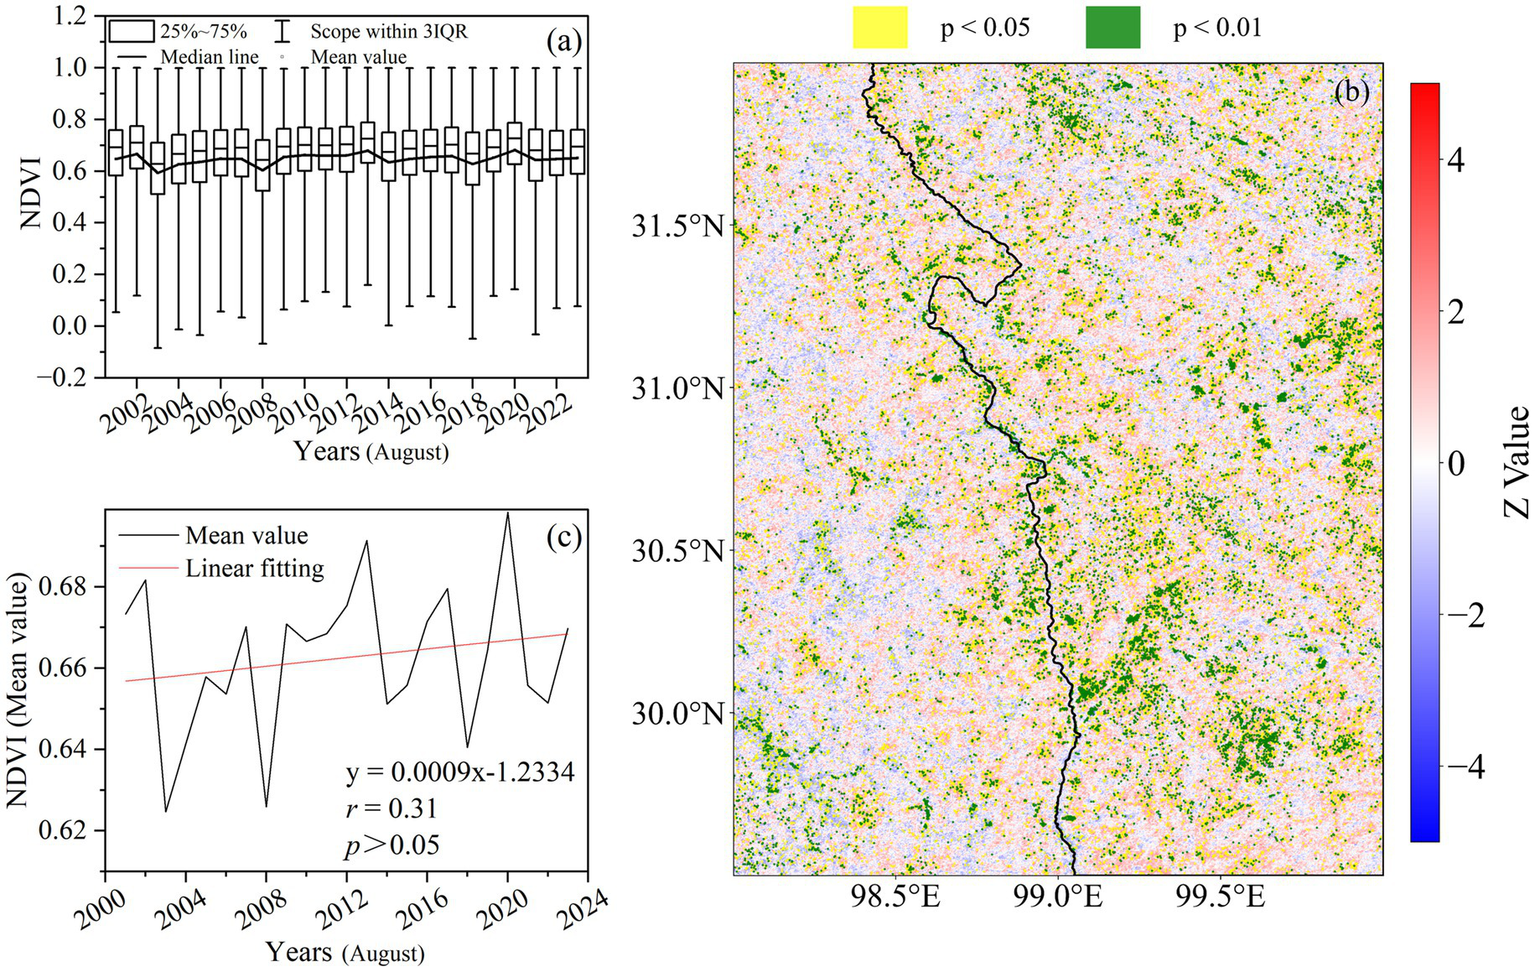
Three-part visualization includes: (a) Box plot showing NDVI trends from 2001 to 2023 with median, mean, and interquartile ranges. (b) Map with regions in yellow and green, indicating significance levels (p < 0.05 and p < 0.01) in vegetation changes, with a color bar for Z values. (c) Line graph of mean NDVI from 2001 to 2023 with a linear trend line, presenting a slight increase, correlation coefficient r = 0.31, and a significance level p > 0.05.
Spatial distribution maps comparing periods 2001–2011 and 2012–2023 (Figures 3a,b) revealed no substantial changes in the overall spatial NDVI patterns within the STI region. Between 2012 and 2023, 68.41% of pixels showed increased NDVI versus 31.39% decreasing. The positive-to-negative ratio was higher in STI-Sichuan (2.69:1) than in STI-Tibet (1.63:1), indicating greater improvement there (Figure 3c). Notably, major NDVI increases clustered along the Jinsha River banks, while decreases centered in western Mangkang and central Gongjue.
Figure 3
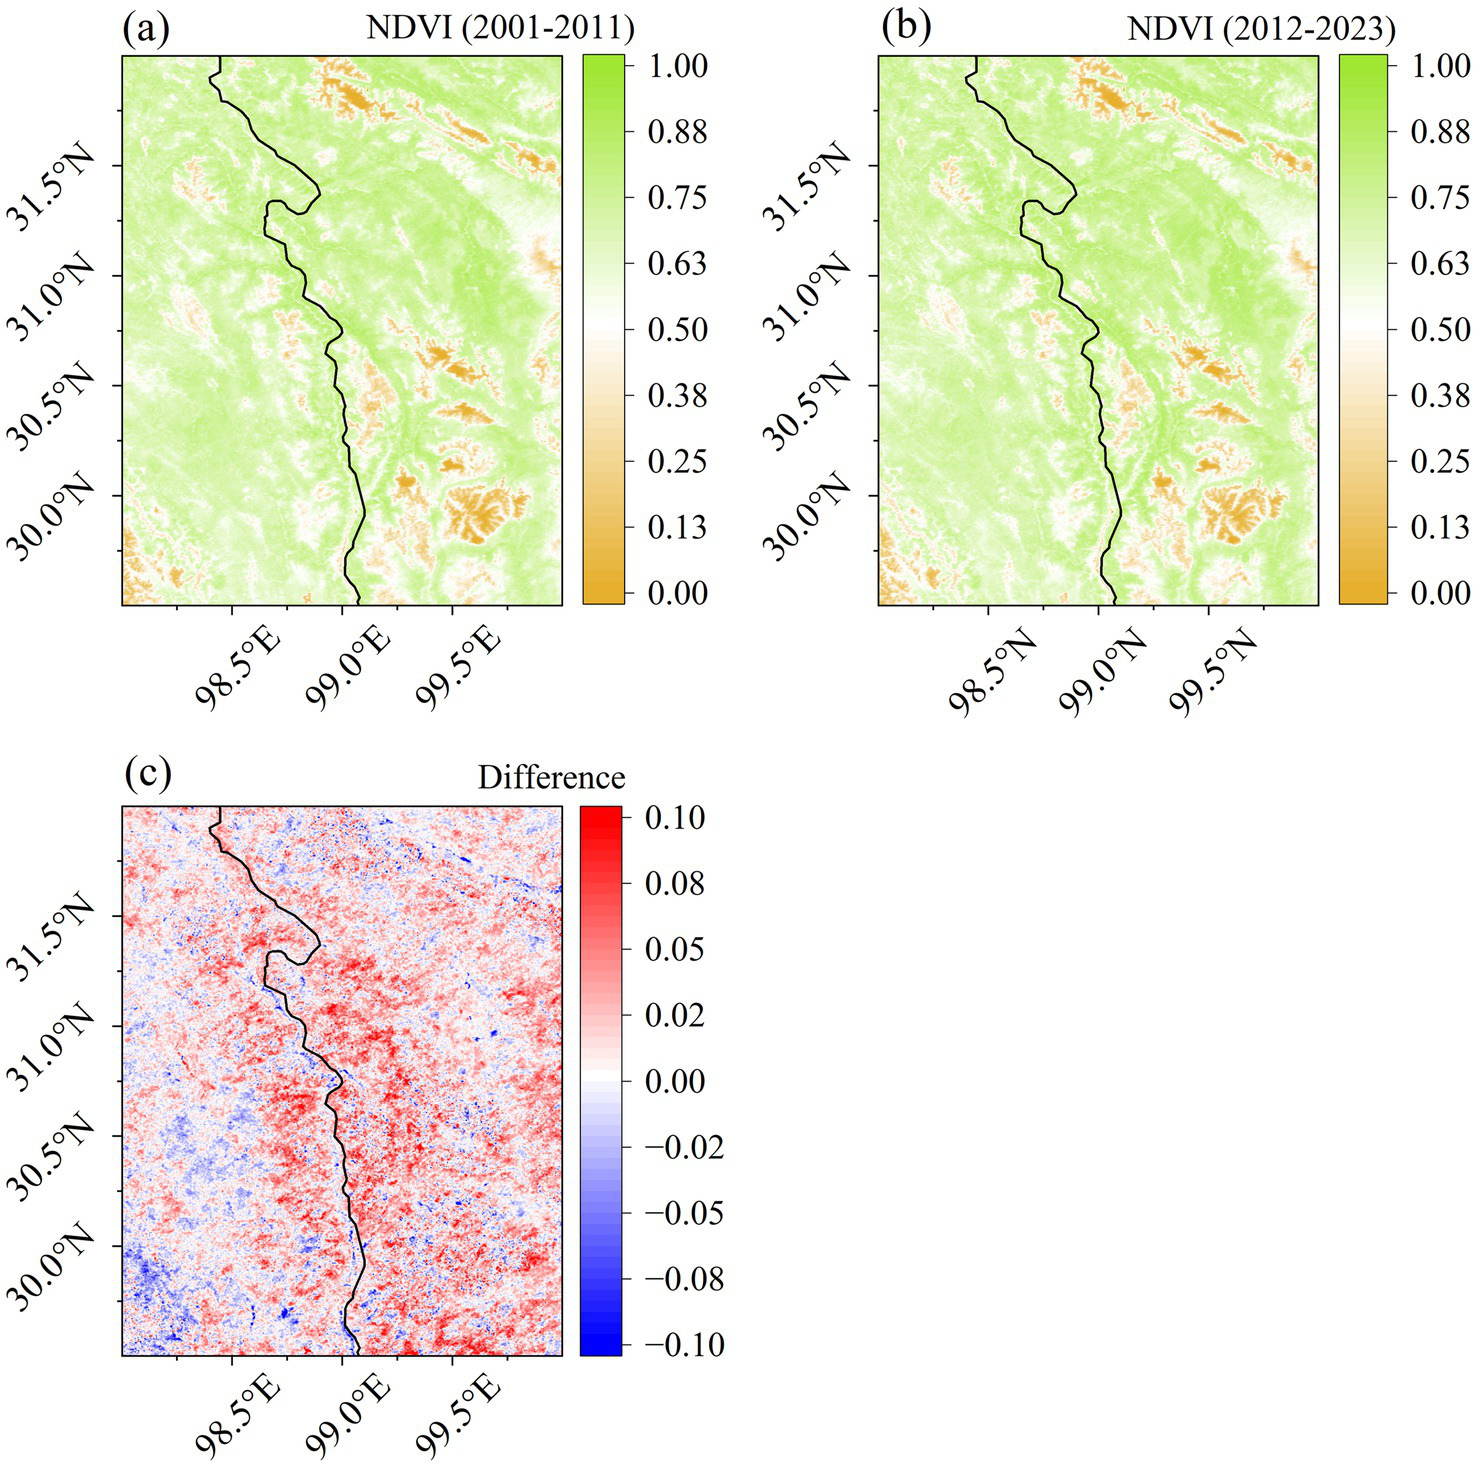
Three maps display NDVI data and changes. Map (a) shows NDVI from 2001 to 2011 in shades of green and orange. Map (b) shows NDVI from 2012 to 2023, similarly colored with (a). Map (c) illustrates NDVI differences between the two periods in a red to blue gradient, highlighting changes across the region. Each map includes latitude and longitude markers.
Classification of average August vegetation cover (2001–2023) showed varying category proportions (Figure 4). Low and medium-low vegetation cover (NDVI <0.4) were more prevalent in STI-Sichuan (8.96–15.59%) than in STI-Tibet (3.65–5.86%). Medium vegetation cover (0.4–0.6) was comparable between the two regions. Medium-high vegetation cover (0.6–0.8) was dominant in both areas but notably higher in STI-Tibet (60.88–73.9%) than in STI-Sichuan (45.85–58.33%). Conversely, high vegetation cover (0.8–1) was greater in STI-Sichuan (5.17–26.37%) compared to STI-Tibet (2.37–13.69%).
Figure 4
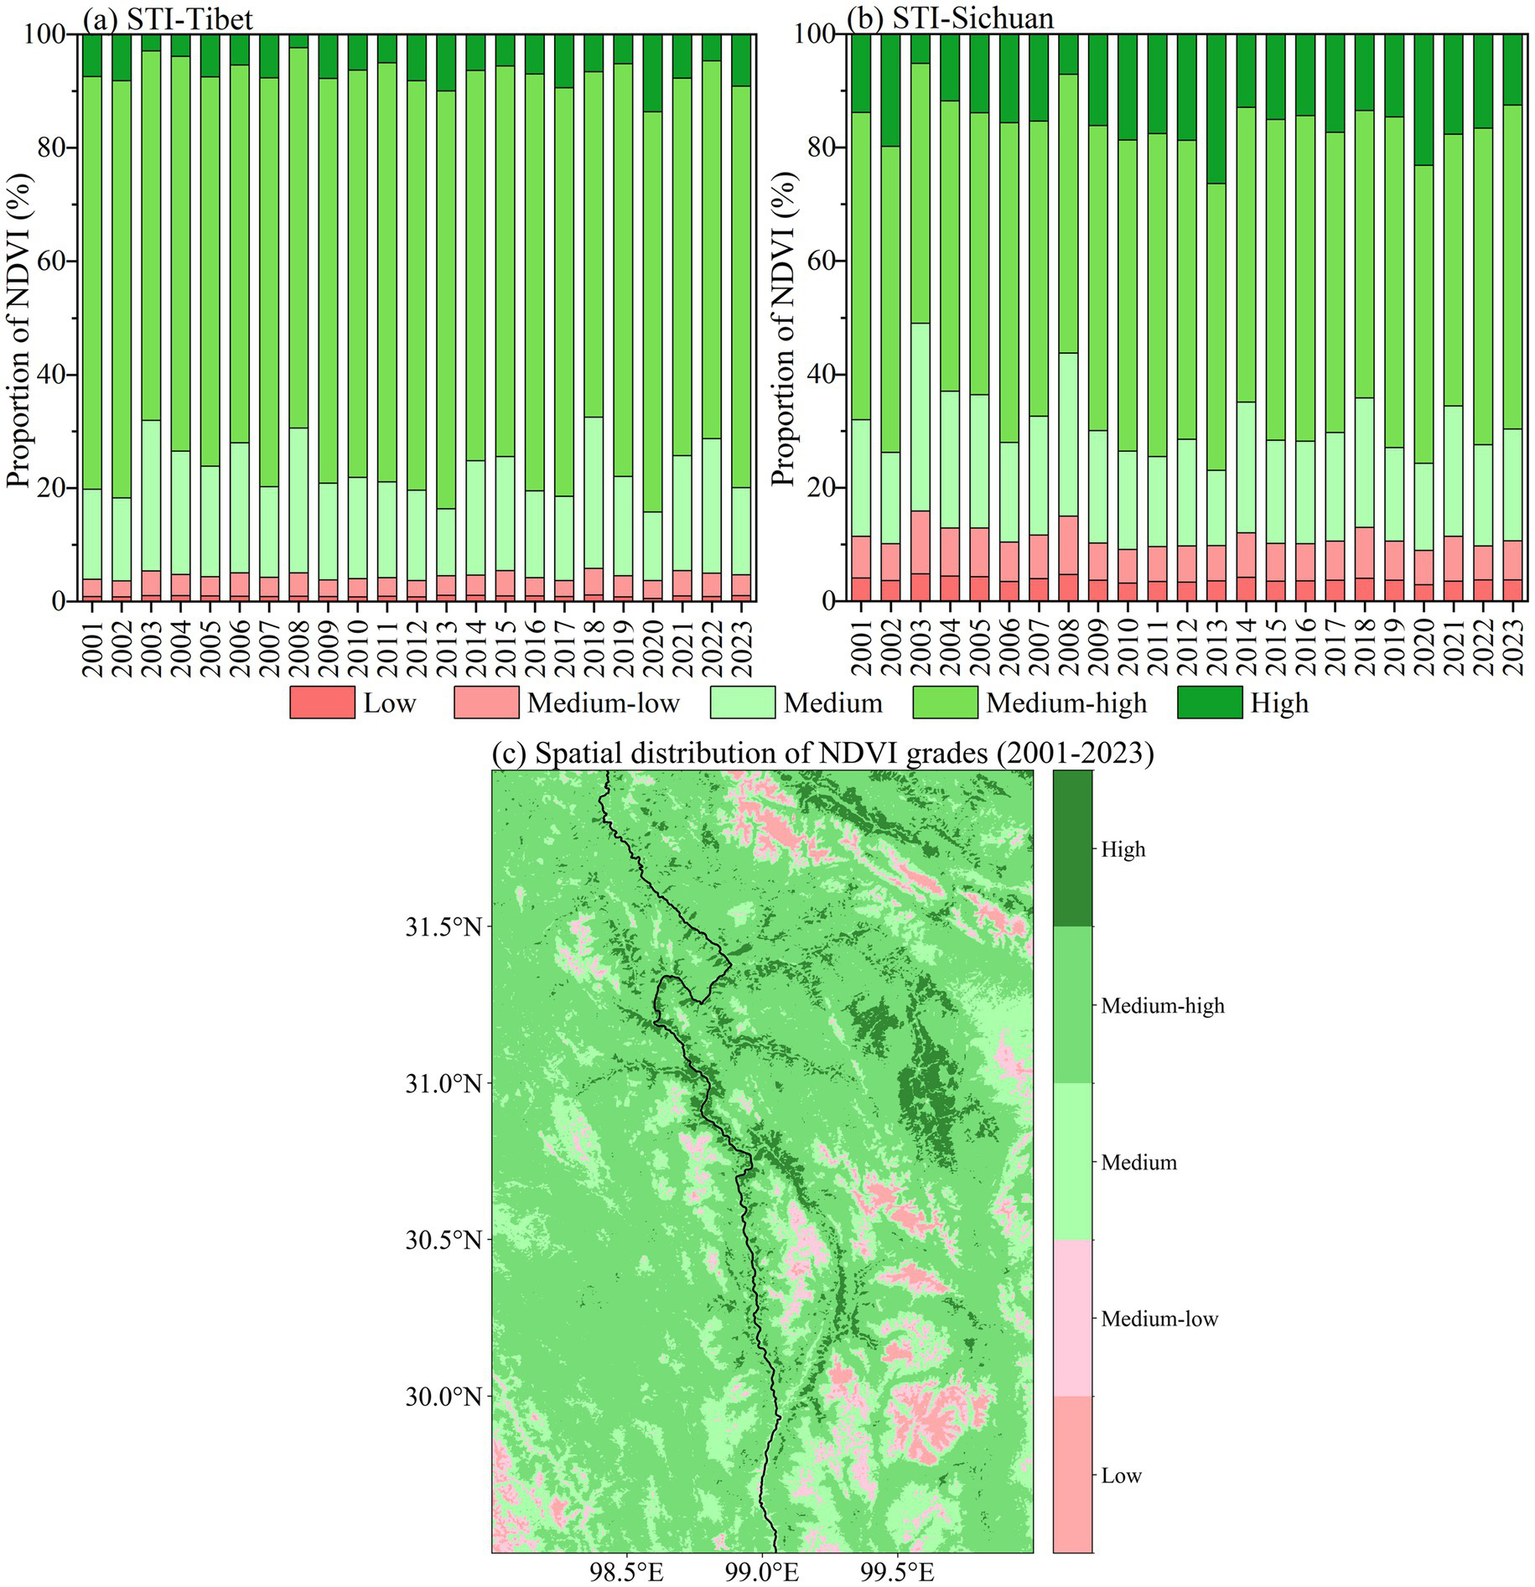
The percentage of different vegetation cover levels (a,b) and the multi-year average of spatial distribution of vegetation cover levels (c) for STI-Tibet and STI-Sichuan from 2001 to 2023.
Table 5, Figure 5 presents the area and proportion of NDVI trend significance on STI-Tibet and STI-Sichuan, respectively. The most common trend classification for both regions was a non-significant increase, followed by a non-significant decrease. Compared to STI-Sichuan, STI-Tibet had less area with non-significant increase and more with non-significant decrease, indicating a greater degradation tendency. STI-Sichuan had a higher proportion of significant and extremely significant increase than STI-Tibet, while significant negative trends were similar in both.
Table 5
| Grading | p value | Z-value range | STI-Tibet area (km2) | STI-Sichuan area (km2) |
|---|---|---|---|---|
| Extremely significant increase | p < 0.01 | [2.58, +∞) | 244.3 | 912.83 |
| Significant increase | 0.01 < p < 0.05 | [1.96, 2.58) | 664.68 | 1788.41 |
| Non-significant increase | p > 0.05 | (0, 1.96) | 12028.02 | 19480.02 |
| Non-significant decrease | p > 0.05 | (−1.96, 0] | 4891.15 | 8268.29 |
| Significant decrease | 0.01 < p < 0.05 | (−2.58, −1.96] | 413.78 | 366.38 |
| Extremely significant decrease | p < 0.01 | (−∞, −2.58] | 167.27 | 235.97 |
Distribution of NDVI trends and their significance across different subregions in the STI.
Figure 5
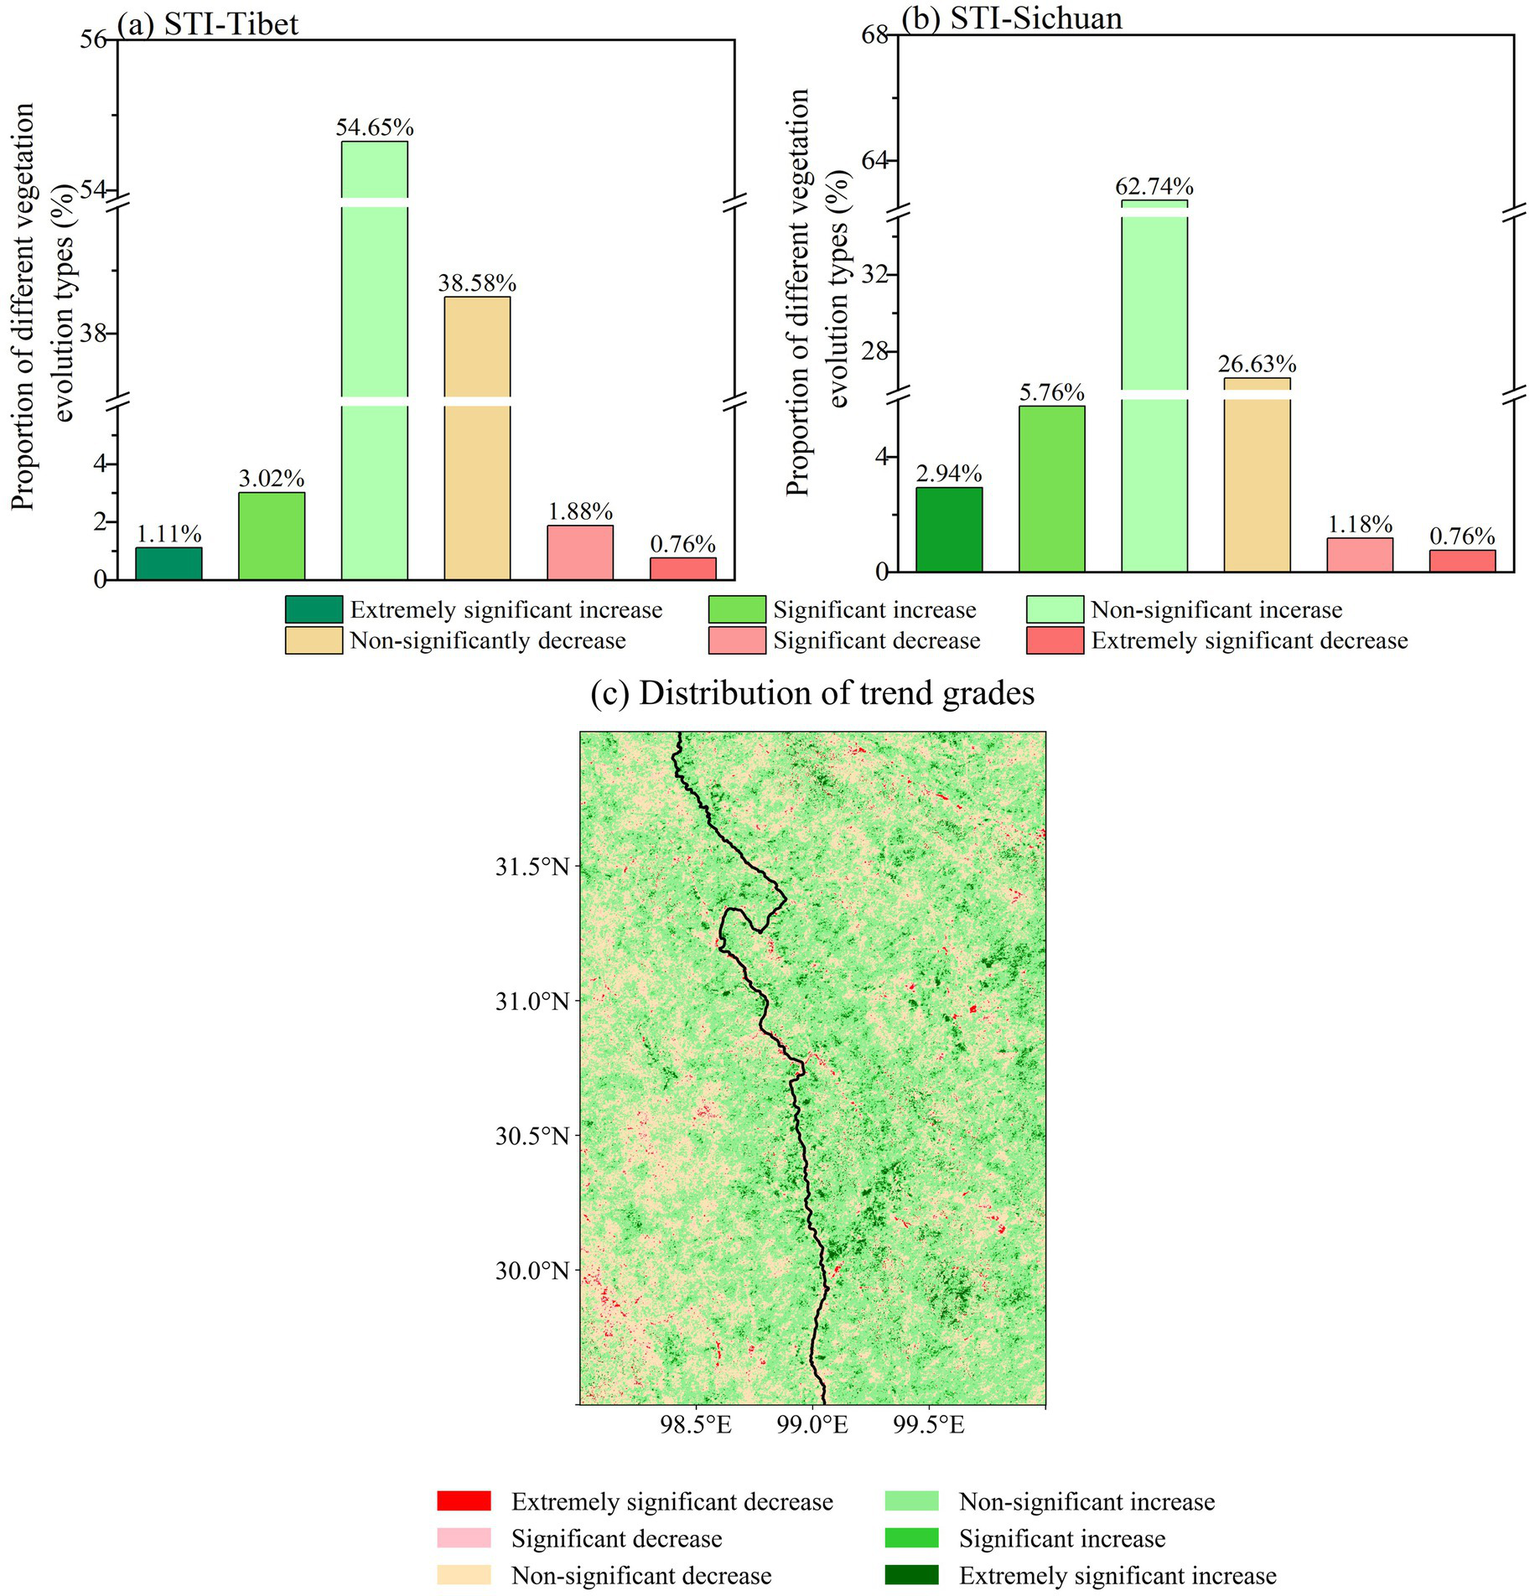
Bar charts (a) and (b) compare vegetation evolution types in STI-Tibet and STI-Sichuan, respectively, showing proportions with varying significance from increase to decrease. A map (c) depicts trend grades using color band for different vegetation changes in the area.
The spatial mean NDVI for the entire STI region and its Sichuan and Tibet sides exhibited no significant long-term growth trends. However, a notable abrupt increase in spatial mean NDVI for the entire region occurred around 2007. The STI-Sichuan side mirrored this abrupt change timing, while the STI-Tibet side experienced a lag of approximately 2 years, with its abrupt NDVI increase occurring in 2009 (Figure 6).
Figure 6
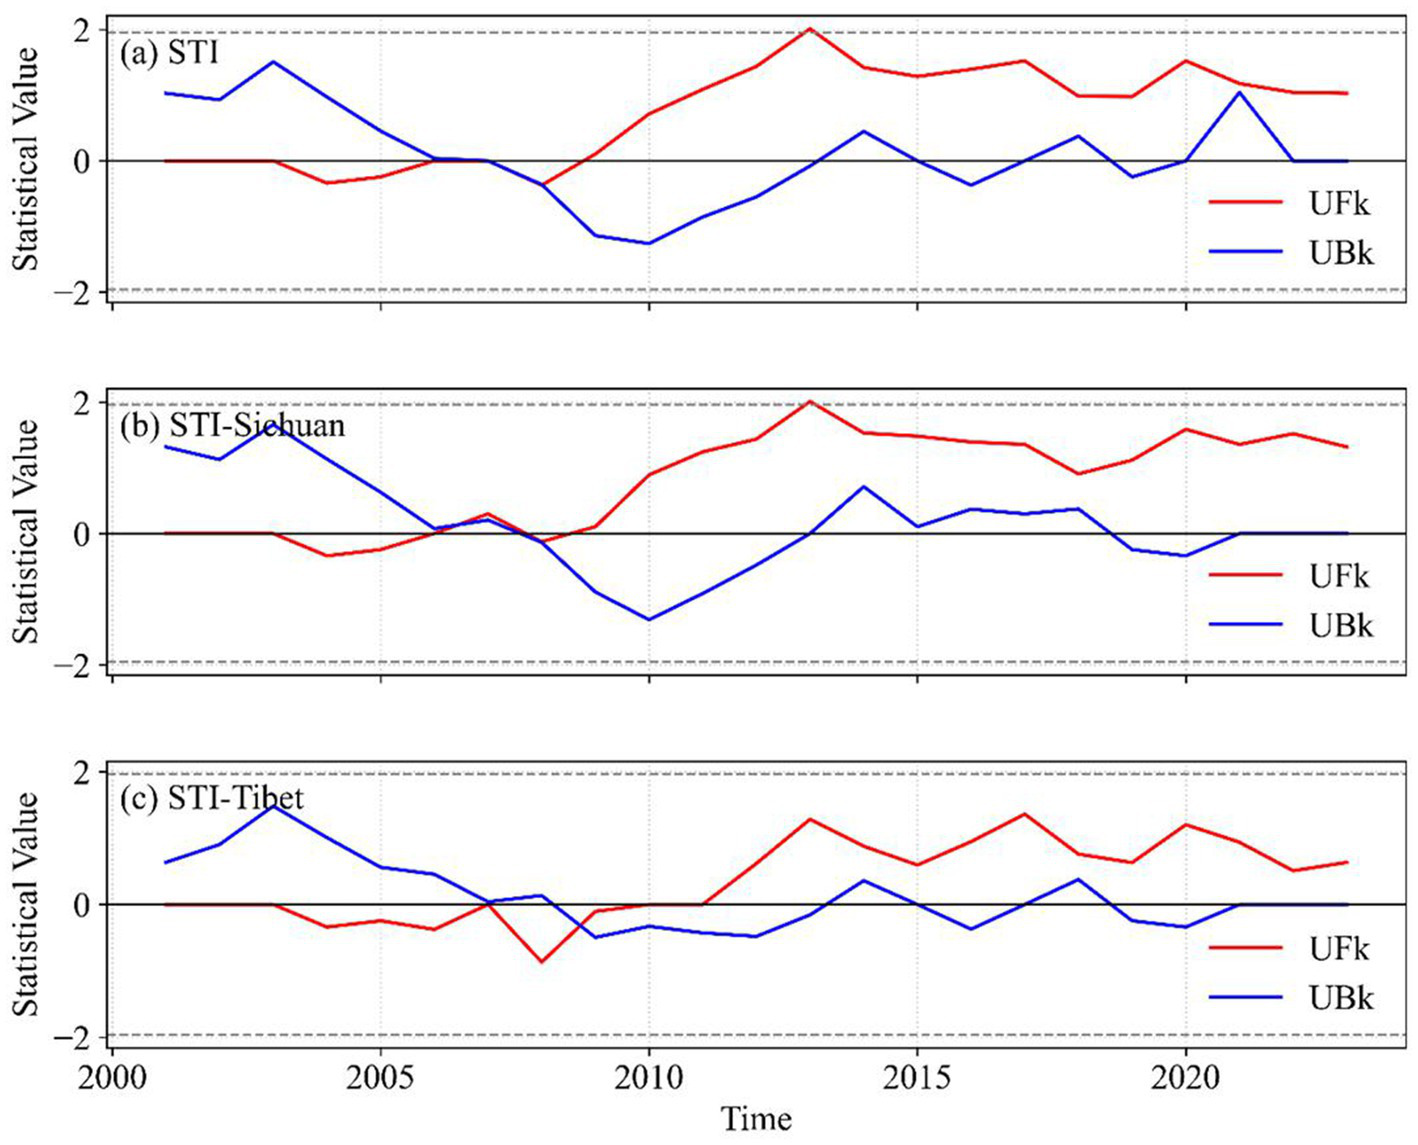
Three line graphs comparing statistical values of UFk and UBk from 2001 to 2023. Graph (a) for STI shows an increasing red line and fluctuating blue line. Graph (b) for STI-Sichuan indicates a rising red line and slightly declining blue line. Graph (c) for STI-Tibet shows a fluctuating red line and decreasing blue line.
As depicted in Figure 7a, NDVI changes on the STI-Tibet side were relatively stable, increasing at a modest rate of 0.0045 per decade, whereas the eastern STI-Sichuan side showed more pronounced growth at 0.0128 per decade. The correlation between NDVI changes on both sides was strong and statistically significant (r = 0.7918, p < 0.01). Although NDVI growth rates differed between the eastern and western sides, the differences were statistically non-significant (Figure 7b).
Figure 7
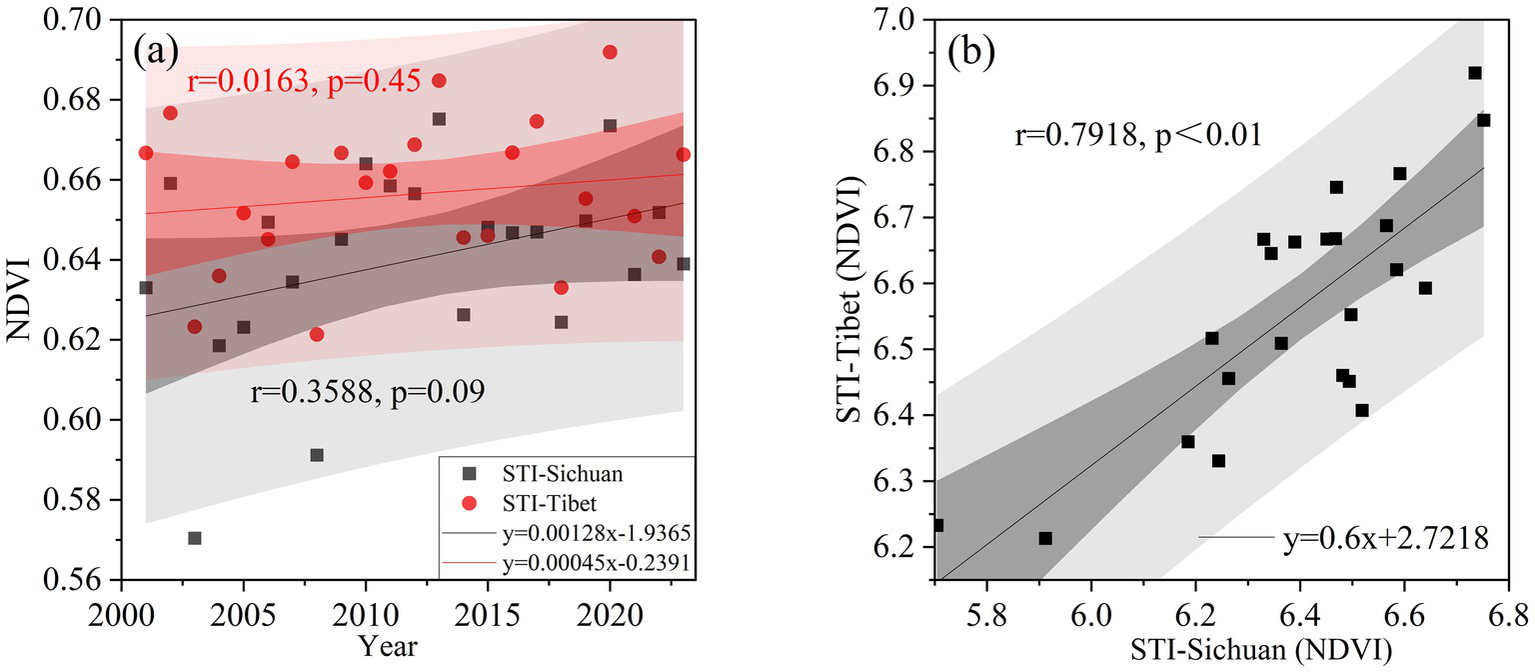
Comparison of the interannual changes in the spatially averaged NDVI in August between the STI-Tibet and STI-Sichuan [linear trends in (a) and correlations in (b).
3.2 Delayed response of NDVI to climate factors
To assess the climatic impact on vegetation during the high-altitude growing season, correlations between May–August temperature (Tem), precipitation (Pre), solar radiation (Rad), and August NDVI were examined (Figure 8, Table 6). The positive correlation coefficients between May, June, July, and August temperatures and August NDVI were 39.87, 70.96, 71.45, and 56.23%, respectively. These results indicate that June and July temperatures significantly influence August NDVI, while May and August temperatures exert comparatively less influence, suggesting a 1–2 months lag in NDVI response to temperature changes. Similarly, the positive correlation coefficients between precipitation in May, June, July, August and August NDVI were 38.57, 36.76, 66.72, and 29.11%, respectively. These results indicate that July precipitation exhibits the strongest positive correlation with August NDVI, highlighting a one-month lag in the response of NDVI to precipitation. Solar radiation in August showed the strongest positive correlation with August NDVI (67.26%), indicating an immediate relationship between solar radiation and NDVI. Conversely, July Rad showed widespread negative correlations 0f 68.91% with August NDVI, and significant negative correlations mainly observed in STI-Tibet.
Figure 8
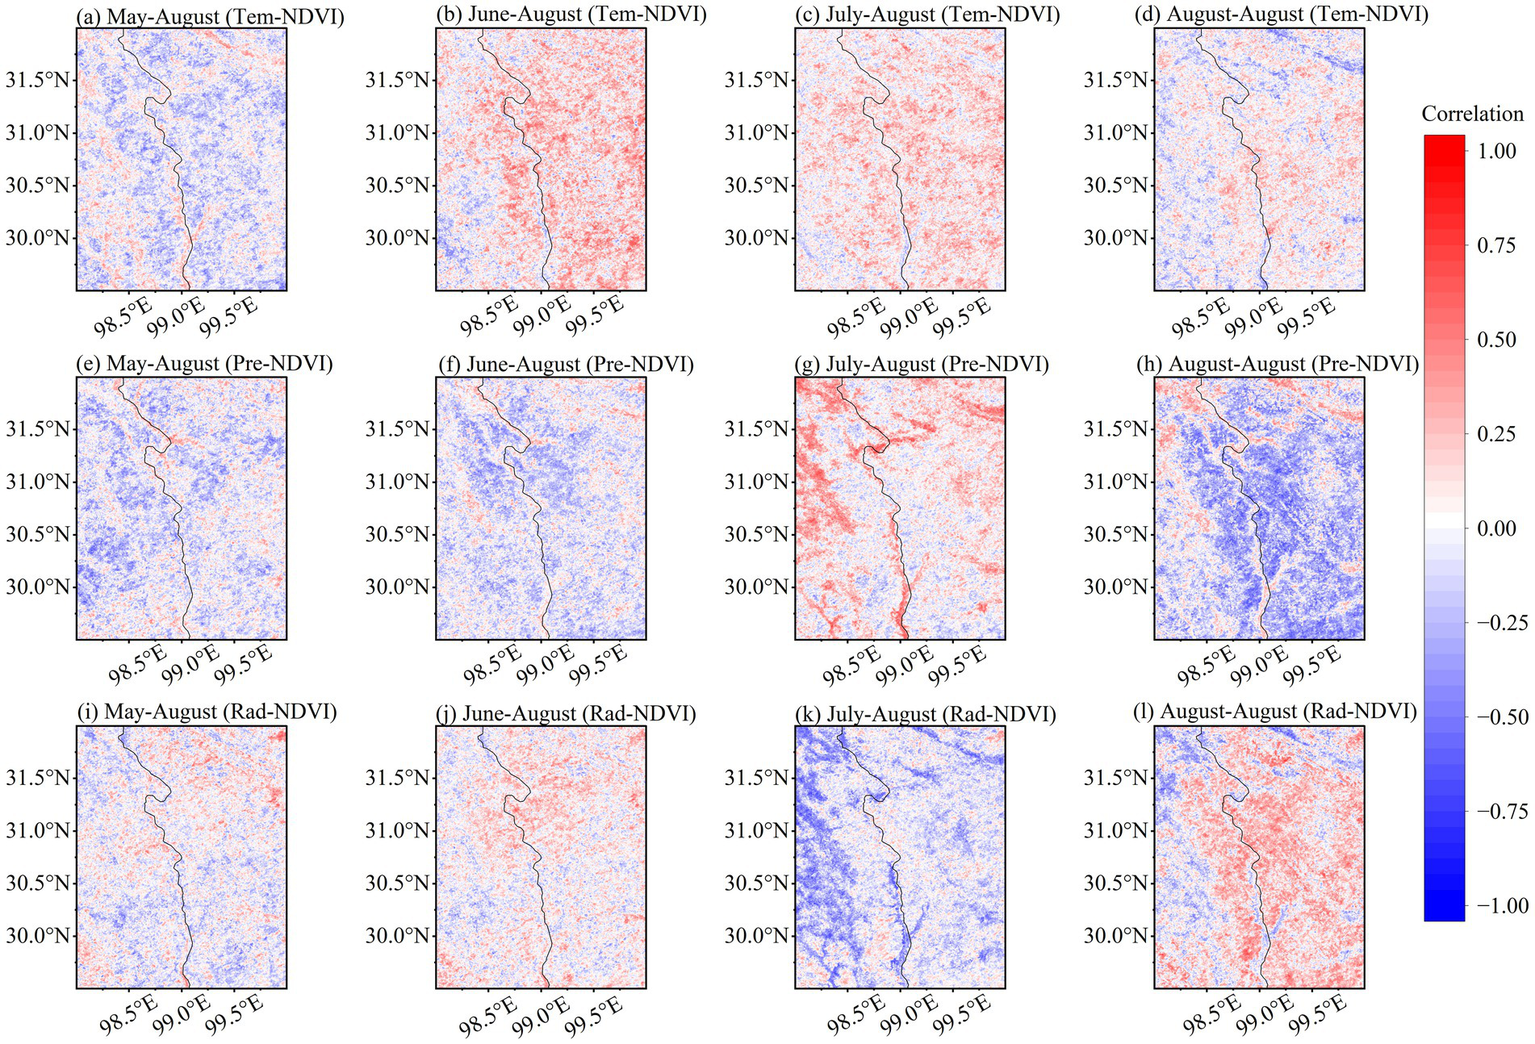
Twelve maps showing correlations between climate variables and NDVI across different times and conditions. Maps (a) to (d) display correlations from May to August labeled “Tem-NDVI.” Maps (e) to (h) show correlations for the same period labeled “Pre-NDVI.” Maps (i) to (l)display “Rad-NDVI” correlations. Color scales range from blue (negative correlation) to red (positive correlation).
Table 6
| Climate factors | Relevance | May | June | July | August |
|---|---|---|---|---|---|
| Temperature | Positive correlation | 39.87% | 70.96% | 71.45% | 56.23% |
| Negative correlation | 60.13% | 29.04% | 25.55% | 43.77% | |
| Precipitation | Positive correlation | 38.57% | 36.76% | 66.72% | 29.11% |
| Negative correlation | 61.43% | 63.24% | 33.28% | 70.89% | |
| Solar radiation | Positive correlation | 48.90% | 60.75% | 31.09% | 67.26% |
| Negative correlation | 51.10% | 39.25% | 68.91% | 32.74% |
Proportion of positive and negative correlations area between climate factors in different months and NDVI in August.
3.3 Environmental factors’ influence on NDVI spatial distribution
3.3.1 Single factor contribution based on DOA-RF
Figure 9 illustrates NDVI sensitivity to key environmental factors across spatiotemporal divisions. During 2001–2011, STI-Tibet showed highest sensitivity to DEM with the explanatory power of 27.67% (SHAP = 0.0272), followed by the precipitation of June and July (SHAP = 0.0221 and 0.0088), and low-cover grassland (SHAP = 0.0086) (Figure 9a). In STI-Sichuan, DEM remained dominant with the explanatory power of 36.94% (SHAP = 0.0556), with July and August temperatures as secondary factors (SHAP = 0.0274 and 0.0146) (Figure 9b). LUCC influence was weaker here than in Tibet.
Figure 9
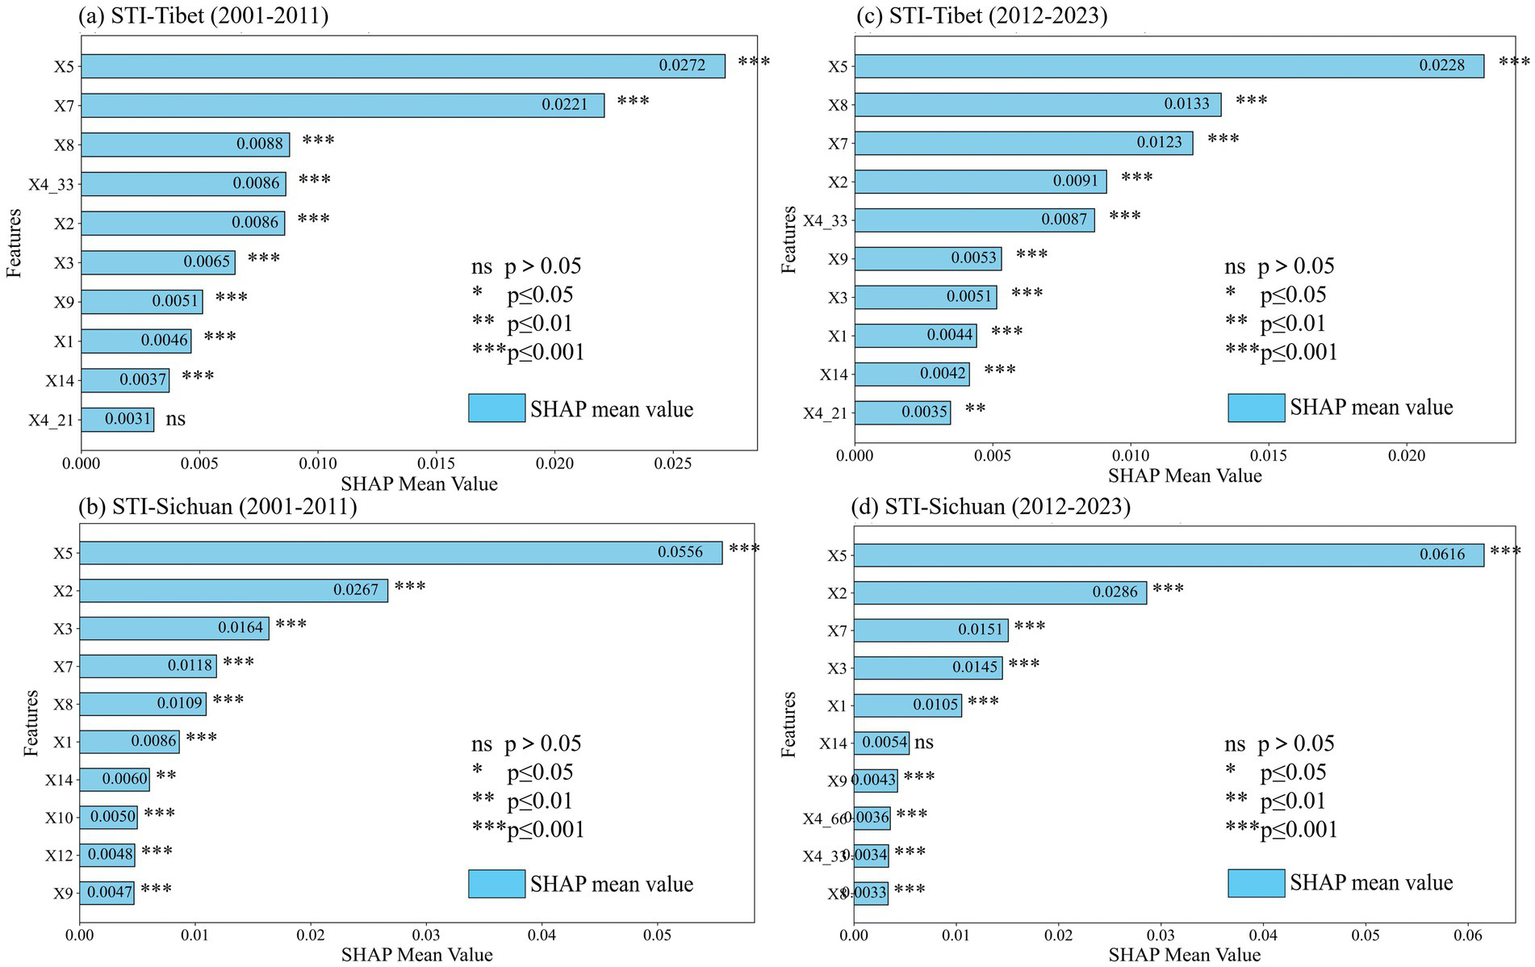
Four bar charts compare SHAP mean values for different features across two regions, Tibet (a, c) and Sichuan (b, d), during two time periods: 2001-2011 and 2012-2023. Each chart shows feature importance, with varying levels of statistical significance indicated. Statistical significance levels are marked as not significant (ns), and with asterisks for increasing significance: * for less than 0.05, ** less than 0.01, and *** for less than 0.001.
During 2012–2023, the influence of DEM slightly declined in STI-Tibet with the explanatory power of 25.7% (SHAP = 0.0228), while July and June precipitation gained importance (SHAP = 0.0286 and 0.0151) (Figure 9c). In STI-Sichuan, DEM remained strongest with the explanatory power of 40.98% (SHAP = 0.0616), followed by July temperature and June precipitation (SHAP = 0.0286 and 0.0151) (Figure 9d). Sensitivity to June–July temperature and June precipitation increased in both regions. Notably, bare rock and soil texture (X4_66) exceeded July precipitation in influence in STI-Sichuan, highlighting soil conditions’ growing role over precipitation alone.
3.3.2 Explanatory power of spatial distribution based on OPGD
On the STI-Tibet (2001–2011, Figure 10a), interactions between environmental factors generally enhanced explanatory power, with the strongest interaction (X4 and X5, q = 0.4952) reflecting how topography and land use jointly shape NDVI spatial heterogeneity. Forests and grasslands were topographically constrained, while valleys showed more land-use diversity. Farmlands concentrated in gentle, well-watered valleys, indicating combined natural and human influences on NDVI. In contrast, interactions involving TN (X11) with TP (X13) and slope (X14) reduced explanatory power, likely due to nutrient redundancy or slope-induced loss. However, TN/TP interactions with precipitation increased explanatory power, suggesting water-mediated nutrient uptake. On the STI-Sichuan (2001–2011, Figure 10b), all interactions increased explanatory power, peaking at q = 0.677 for X2 and X5. No weakening effects were observed.
Figure 10
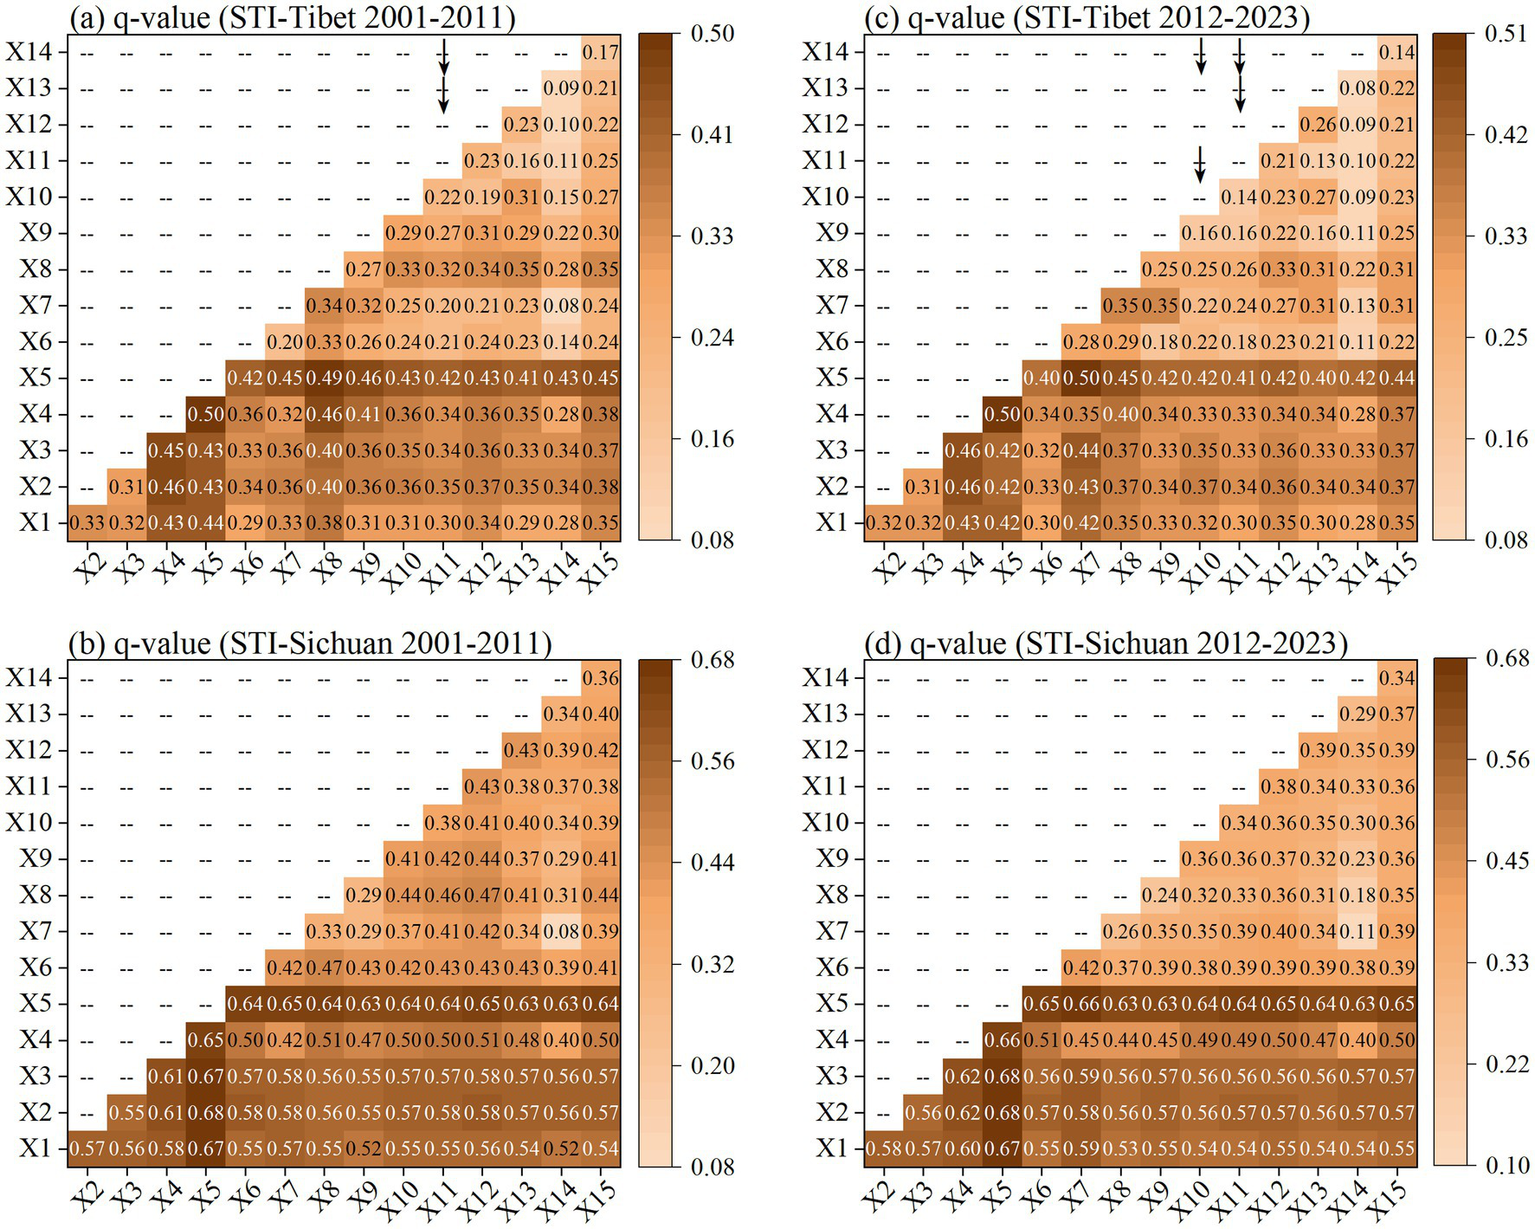
Four heatmaps labeled (a), (b), (c), and (d) display the q-values for STI studies on the Tibet side and the Sichuan side. Each matrix represents the interaction (q-values) between variables X1 to X15, with darker colors indicating higher q-values. Maps (a) and (c) focus on Tibet, while maps (b) and (d) focus on Sichuan. The scale on the right ranges from 0.08 to 0.68. The arrows represent the factor whose explanatory power is weakened after interaction.
During 2012–2023 on STI-Tibet (Figure 10c), June precipitation (X5) and elevation (X7) showed the strongest interaction (q = 0.5045). Most interactions enhanced explanatory power, except between shallow and deep soil TN—likely due to vegetation differences: western Sichuan has shrub/coniferous forests with limited meadows, while eastern Tibet has shallow-rooted meadows, reducing deep nitrogen relevance. On STI-Sichuan (2012–2023, Figure 10d), interactions further strengthened explanatory power, with X2 and X5 again being strongest (q = 0.677). Slope (X14) nonlinearly enhanced 86.67% of other factors. Overall, natural factors influence NDVI through interactive and nonlinear enhancement, with minimal weakening effects.
4 Discussions
4.1 Spatiotemporal variation characteristics of NDVI
Results indicate that temporally, the August NDVI in the STI region showed a slow and fluctuating upward trend across most areas (consistent with previous findings (Liu et al., 2025), averaging a growth rate of 0.009 per decade. This increase is primarily attributable to sustained ecological conservation initiatives implemented since 2001, such as forest protection, cropland reforestation, and grassland restoration projects, which have directly supported vegetation growth (Liu S. et al., 2024). Significant reductions in NDVI were recorded during extreme events such as the widespread drought in southern China in 2003, post-disaster impacts of the 2008 Wenchuan earthquake, and anomalously high temperatures experienced in the eastern Qinghai-Tibet Plateau in 2018 (Liu Z. et al., 2024; Shen et al., 2020).
Spatial analysis revealed an increasing NDVI trend predominantly in marginal zones along the Jinsha River Basin, indicating progressive ecological benefits from restoration initiatives near the river (Feng et al., 2025). Conversely, significant vegetation decline occurred in Mangkang and Gongjue, likely due to their location within the Jinsha River plate suture zone, a region highly susceptible to geological hazards such as landslides and debris flows (Zhou et al., 2025; Ye et al., 2021). Furthermore, global warming has exacerbated the frequency of such hazards in high-altitude mountainous regions (Duan et al., 2025a,b), negatively impacting vegetation recovery.
Both STI-Tibet and STI-Sichuan exhibited predominantly medium-to-high vegetation coverage, but in STI Tibet is higher than STI-Sichuan. It may be due to differences in terrain, climate conditions, soil types, vegetation characteristics, and human influences on both sides. Specifically, STI-Tibet’s lower population density and the implementation of grassland-livestock balance policies have effectively preserved vegetation integrity (Chen and Xu, 2022; Colin et al., 2021), whereas STI-Sichuan’s lower-altitude areas, experience more vegetation fragmentation due to steep cropland cultivation, infrastructure development, tourism, and agricultural expansion (Xie et al., 2020). Regarding the change trends in vegetation coverage, non-significant increase trends were most prevalent across the STI region, but higher in STI-Sichuan compared to STI-Tibet. Non-significant decrease trends ranked second, more commonly observed in STI-Tibet, reflecting harsher environmental constraints including high altitude (Wang et al., 2023), climatic variability (Lepre and Quinn, 2022), and intensified freeze–thaw erosion (Bonini, 2020), collectively contributing to accelerated vegetation degradation compared to STI-Sichuan.
4.2 Driver analysis of NDVI
This study highlights the lagged response characteristics of August NDVI to climatic factors in the STI region: the response times for temperature, precipitation, and solar radiation are 1–2 months, 1 month, and immediate (0 months), respectively. This differs from findings by Sun et al. (2021), who reported longer average lag periods of approximately 3 months for temperature and 2.45 months for precipitation. Such discrepancies likely arise from the unique geographic context of the STI region, positioned on the eastern edge of the Tibetan Plateau, where heightened hydrothermal sensitivity may accelerate vegetation response to climatic variations (Kong et al., 2020). Additionally, this study specifically targets August, whereas previous studies typically examine broader interannual or seasonal scales (Liu W. et al., 2024). Variations in these spatiotemporal scales may further contribute to observed differences in lag durations. Notably, areas exhibiting positive correlations between July precipitation and August NDVI comprise 66.73% of the region, with significant correlations concentrated in valley zones (Figure 8g). This aligns with Zhao and Zhu (2024), who reported similar findings in the Jinsha River Dry-Hot Valley, suggesting that concentrated precipitation in valley regions substantially promotes vegetation growth. However, the negative correlation between solar radiation and NDVI observed in STI-Tibet contrasts with Bento et al., who reported positive correlations in arid regions (Bento et al., 2020). This divergence potentially stems from increased evaporation stress due to intense solar radiation on the plateau (Wang et al., 2023) or sensitivity biases of NDVI’s optical band parameters under high solar radiation conditions.
Using OPGD and SHAP mean value analyses, the study identifies elevation (DEM) as the primary determinant of NDVI spatial heterogeneity in the STI region. Numerous studies focusing on the Qinghai-Tibet Plateau and its surrounding areas have consistently shown that in such high-altitude and ecologically fragile regions, climatic and topographic factors have the highest explanatory power for changes in vegetation dynamics (Yao et al., 2024; Liu et al., 2025). In contrast, changes in vegetation dynamics in this area are less affected by anthropogenic variables such as GDP, population density, and night-time light intensity (Liu X. et al., 2024; Duan et al., 2025a,b). The STI region is characterized by its high altitude, complex terrain, and climatic conditions, which limit the intensity and spatial scope of human settlement and economic development, thereby reducing the pressure of human activities on nature (Pu et al., 2025). Furthermore, the reduced explanatory power of soil nutrient factors (e.g., X11 and X13) after interaction in STI-Tibet (Figure 10) may relate to the low efficiency of shallow-rooted vegetation in absorbing deep soil nutrients, while STI-Sichuan’s shrubs and coniferous forests, with deeper root systems, may rely more on deep layer soil nutrient (Li et al., 2024).
Interaction analyses demonstrate that synergistic effects between climatic and topographic factors substantially enhance their explanatory power concerning NDVI spatial variability, for example, interaction between X2 and X5 achieves 0.677, consistent with findings by Peng et al. (2019) in western Sichuan (Liu et al., 2025). However, weakened explanatory power observed in parts of STI-Tibet (e.g., interactions involving X11 and X14) may result from compounded effects of nutrient loss and steep slopes in alpine meadow regions (Li et al., 2023). In contrast, STI-Sichuan exhibits broadly enhanced interactions due to synergistic effects between human activities (e.g., the Grain for Green Program) and natural factors driven by ecological compensation policies (Chen et al., 2025b).
4.3 Vegetation management across administrative boundaries
The research findings hold significant implications for across administrative vegetation management in high-altitude regions. Management strategies should be tailored to regional realities. For instance, differentiated protection strategies are essential: STI-Sichuan should prioritize controlling steep slope cultivation and tourism development while strengthening the effectiveness of the Grain for Green Program, whereas STI-Tibet should optimize grassland-livestock balance policies and enhance prevention and control capabilities for freeze–thaw disasters. Additionally, inter-regional collaboration is critical. Establishing a Sichuan-Tibet joint ecological monitoring platform would unify ecological restoration goals and evaluation standards, mitigating fragmented conservation efforts caused by administrative divisions. Equally important is the creation of a cross-regional ecological compensation mechanism, utilizing fiscal transfers, carbon sink trading, and other incentives to align conservation costs with benefit distribution, thereby motivating local governments and communities to jointly engage in vegetation restoration.
4.4 Limitations and future research directions
This study goes beyond traditional annual or seasonal analysis and systematically elucidates the dynamic changes of vegetation coverage in target months, providing theoretical support for ecological protection strategies in high-altitude fragile areas across administrative boundaries. Nonetheless, limitations persist: critical ecological drivers, including soil organic carbon and microbial communities, were not included, limiting comprehensive insights into vegetation growth mechanisms. Future studies should incorporate broader ecological factors (e.g., soil physicochemical properties, microbial activity) to construct a multidimensional “natural-anthropogenic-disaster” interaction model and develop targeted ecological restoration strategies—such as prioritizing freeze–thaw disaster prevention in STI-Tibet and optimizing the balance between tourism and vegetation protection in STI-Sichuan.
5 Conclusion
Key findings regarding NDVI evolution and sensitivity factors in the STI region from 2001 to 2023 include:
In August, the average of NDVI value at STI regions was between 0.6 and 0.8, showing a non-significant upward trend, with nearly 70% of the area showing enhanced NDVI from 2012 to 2023 compared to 2001–2011. Notably, the increasing trend of STI-Sichuan was more obvious than that of STI-Tibet.
STI-Sichuan displays higher proportions of both medium-low and high vegetation coverage and lower proportions of middle-high vegetation coverage compared to STI-Tibet, but STI-Sichuan showed higher proportions of non-significant increase, significant increase, and extremely increase compared to STI-Tibet. The NDVI shift in STI-Sichuan occurred approximately 2 years earlier than in STI-Tibet, with greater magnitude and coverage.
The Pearson correlation analysis between climate factors in different months and NDVI in August shows that temperature and precipitation during June and July strongly correlate positively with August NDVI, reflecting a lagged response of 1–2 months. While August solar radiation positively correlates with August NDVI, July solar radiation notably negatively correlates, which reflects the immediacy of NDVI to solar radiation, particularly in Tibet.
Elevation emerges as the principal explanatory factor for NDVI variability, with precipitation serving as the secondary influential factor in STI-Tibet and temperature in STI-Sichuan. Interaction among climate and elevation factors significantly enhances explanatory power for NDVI spatial distribution, although interactions involving soil nutrients in STI-Tibet exhibit reduced explanatory power.
Statements
Data availability statement
The original contributions presented in the study are included in the article/supplementary material, further inquiries can be directed to the corresponding author.
Author contributions
HL: Conceptualization, Methodology, Resources, Software, Supervision, Writing – original draft, Writing – review & editing. LB: Conceptualization, Data curation, Writing – review & editing, Software, Validation. JL: Conceptualization, Data curation, Software, Validation, Writing – review & editing. ZC: Writing – review & editing, Funding acquisition, Methodology, Visualization. ZY: Methodology, Visualization, Writing – review & editing, Software, Validation. PL: Methodology, Visualization, Writing – review & editing, Funding acquisition. HY: Funding acquisition, Methodology, Writing – review & editing, Conceptualization, Data curation, Resources, Supervision.
Funding
The author(s) declare that financial support was received for the research and/or publication of this article. This work was financially supported by Doctoral research program (Grant No. 21E021), Ongoing Engineering Project in Tibet of Huaneng, China (JC2022/D01) and Talent Project of Tibet (XZ202401JD0003).
Acknowledgments
We would like to thank the Chinese Academy of Science Discipline Data Center for Ecosystem and National Ecosystem Science Data Center.
Conflict of interest
PL was employed by Huaneng Tibet Yarlung Tsangpo River Hydropower Development and Investment Company Limited Jiacha Hydropower Construction Branch Company.
The remaining authors declare that the research was conducted in the absence of any commercial or financial relationships that could be construed as a potential conflict of interest.
Generative AI statement
The authors declare that no Gen AI was used in the creation of this manuscript.
Any alternative text (alt text) provided alongside figures in this article has been generated by Frontiers with the support of artificial intelligence and reasonable efforts have been made to ensure accuracy, including review by the authors wherever possible. If you identify any issues, please contact us.
Publisher’s note
All claims expressed in this article are solely those of the authors and do not necessarily represent those of their affiliated organizations, or those of the publisher, the editors and the reviewers. Any product that may be evaluated in this article, or claim that may be made by its manufacturer, is not guaranteed or endorsed by the publisher.
References
1
BentoV. A.GouveiaC.DaCamaraC.LibonatiR.TrigoI. (2020). The roles of NDVI and land surface temperature when using the vegetation health index over dry regions. Glob. Planet. Change190:103198. doi: 10.1016/j.gloplacha.2020.103198
2
BoniniM. (2020). Investigating earthquake triggering of fluid seepage systems by dynamic and static stresses. Earth-Sci. Rev.210:103343. doi: 10.1016/j.earscirev.2020.103343
3
BreimanL. (2001). Random forests. Mach. Learn.45, 5–32. doi: 10.1023/a:1010933404324
4
ChenZ.FengH.LiuX.WangH.HaoC. (2024). Analysis of the influence of driving factors on vegetation changes based on the optimal-parameter-based geographical detector model in the Yima mining area. Forests15:1573. doi: 10.3390/f15091573
5
ChenY.MuX.McVicarR. T.WangY.GuoY.YanK.et al. (2025a). Using an improved radiative transfer model to estimate leaf area index, fractional vegetation cover and leaf inclination angle from Himawari-8 geostationary satellite data. Remote Sens. Environ.318:114595. doi: 10.1016/j.rse.2024.114595
6
ChenJ.ShaoZ.DengX.HuangX.DangC. (2023). Vegetation as the catalyst for water circulation on global terrestrial ecosystem. Sci. Total Environ.895:165071. doi: 10.1016/j.scitotenv.2023.165071
7
ChenY.XieL.LiuX.QiY.JiX. (2024). Identification of high-quality vegetation areas in Hubei province based on an optimized vegetation health index. Forests15:1576. doi: 10.3390/f15091576
8
ChenY.XuE. (2022). New indicators for delineating priority regions for ecosystem conservation based on the criterion of cost-effectiveness. Ecol. Indic.145:109732. doi: 10.1016/j.ecolind.2022.109732
9
ChenY.ZhaoQ.LiuY.ZengH. (2025b). Exploring the impact of natural and human activities on vegetation changes: an integrated analysis framework based on trend analysis and machine learning. J. Environ. Manag.374:124092. doi: 10.1016/j.jenvman.2025.124092
10
ColinT.BenS.RobinO. (2021). Field monitoring the effects of overnight shift work on specialist tactical police training with heart rate variability analysis. Sustainability13:7895. doi: 10.3390/su13147895
11
DengQ.ZhangC.DongJ.LiY.LiY.HuangY. (2024). Variations over 20 years in vegetation dynamics and its coupled responses to individual and compound meteorological drivers in Sichuan province, China. Atmos.15:1384. doi: 10.3390/atmos15111384
12
DongY.YinD.LiX.HuangJ.SuW.LiX. (2021). Spatial–temporal evolution of vegetation NDVI in association with climatic, environmental and anthropogenic factors in the Loess plateau, China during 2000–2015: quantitative analysis based on geographical detector model. Remote Sens13:4380. doi: 10.3390/rs13214380
13
DuanY.DingM.HeY.ZhengH.TellezR. D.SokratovS.et al. (2025a). Global projections of future landslide susceptibility under climate change. Geosci. Front.16:102074. doi: 10.1016/J.GSF.2025.102074
14
DuanY.ZhangX.ZhangH.YangB.ZhaoY.PuC.et al. (2025b). Synergistic drivers of vegetation dynamics in a fragile high-altitude basin of the Tibetan plateau using general regression neural network and geographical detector. Remote Sens17:1829. doi: 10.3390/RS17111829
15
FengJ.ChenG.DuanX.CaiF.ZhaoH.ZhangY.et al. (2025). Time-lag and accumulation responses of vegetation to precipitation in the Jinsha river dry-hot valley at multiple spatial–temporal scales. J. Hydrol.661:133605. doi: 10.1016/j.jhydrol.2025.133605
16
FengY.DuJ.WangY.ZhaoB. (2023). Analysis on spatial distribution and influencing factors of rural tourism characteristic villages in Henan province. Tour. Manag. Technol. Econ.6:1. doi: 10.23977/tmte.2023.060201
17
GuZ.DuanX.ShiY.LiY.PanX. (2018). Spatiotemporal variation in vegetation coverage and its response to climatic factors in the Red River Basin, China. Ecol. Indic.93, 54–64. doi: 10.1016/j.ecolind.2018.04.033
18
GuoB.ZhouY.WangS.TaoH. (2014). The relationship between normalized difference vegetation index (NDVI) and climate factors in the semiarid region: a case study in Yalu Tsangpo river basin of Qinghai-Tibet plateau. J. Mt. Sci.11, 926–940. doi: 10.1007/s11629-013-2902-3
19
HuangX.WangY.WangX.ChenJ.MaJ.LiangY.et al. (2024). Exploring the natural-socioeconomic driving and response mechanisms of ecosystem services interactions to optimize ecosystem management: a case study in the Yarlung Zangbo river basin. Sci. Total Environ.957:177842. doi: 10.1016/j.scitotenv.2024.177842
20
JiaoD.Lius.XuZ.SongL.LiY.LiuR.et al. (2024). Spatio-temporal variations and multi-scale correlations of climate, water, land, and vegetation resources over the past four decades in the Heihe River basin. J. Hydrol. Reg. Stud.55:101941. doi: 10.1016/j.ejrh.2024.101941
21
JinL.HeQ.LiZ.DengM.AbbasA. (2023). Variation characteristics of dust in the Taklimakan Desert. Nat. Hazards120, 2129–2153. doi: 10.1007/s11069-023-06269-3
22
JumanaA.RounakA. (2024). Influence of climate variability and land cover dynamics on the spatio-temporal NDVI patterns in western hydrological regions of Bangladesh. Heliyon10:e32625. doi: 10.1016/j.heliyonJ.2024.E32625
23
KaleemM.AhmadS. A.SultanM.KhadimH.FahadS.LiuQ.et al. (2024). Analyzing vegetation health dynamics across seasons and regions through NDVI and climatic variables. Sci. Rep.14:11775. doi: 10.1038/s41598-024-62464-7
24
KongD.MiaoC.WuJ. (2020). Time lag of vegetation growth on the loess plateau in response to climate factors: estimation, distribution, and influence. Sci. Total Environ.744:140726. doi: 10.1016/j.scitotenv.2020.140726
25
LangY.GaoY. (2025). Dream optimization algorithm (DOA): a novel metaheuristic optimization algorithm inspired by human dreams and its applications to real-world engineering problems. Comput. Methods Appl. Mech. Eng.436:117718. doi: 10.1016/j.cma.2024.117718
26
LepreC.QuinnR. (2022). Aridification and orbital forcing of Eastern African climate during the Plio-Pleistocene. Glob. Planet. Change208:103684. doi: 10.1016/j.gloplacha.2021.103684
27
LiF.WangJ.LiP.DavaasurenD. (2024). Vegetation changes from 2014 to 2023 in the Mongolian plateau permafrost region under climate change. J. Resour. Ecol.15, 1147–1159. doi: 10.5814/j.issn.1674-764x.2024.05.004
28
LiL.YangS.WangZ.ZhuX.TangH. (2010). Evidence of warming and wetting climate over the Qinghai-Tibet plateau. Arct. Antarct. Alp. Res.42, 449–457. doi: 10.1657/1938-4246-42.4.449
29
LiG.YuL.LiuT.BaoY.YuJ.XinB.et al. (2023). Spatial and temporal variations of grassland vegetation on the Mongolian plateau and its response to climate change. Front. Ecol. Evol.11:1067209. doi: 10.3389/fevo.2023.1067209
30
LiuX.DuG.BiH.LiZ.ZhangX. (2024). Normal difference vegetation index simulation and driving analysis of the Tibetan plateau based on deep learning algorithms. Forests15:137. doi: 10.3390/f15010137
31
LiuS.GuY.WangH.LinJ.AoT. (2024). Response of vegetation coverage to climate drivers in the Min-Jiang river basin along the eastern margin of the Tibetan plateau, 2000–2022. Forests15:1093. doi: 10.3390/f15071093
32
LiuW.MoX.LiuS.LuC. (2024). Impacts of climate change on grassland fractional vegetation cover variation on the Tibetan plateau. Sci. Total Environ.939:173320. doi: 10.1016/j.scitotenv.2024.173320
33
LiuH.ZhengH.WuL.DengY.ChenJ.ZhangJ. (2024). Spatiotemporal evolution in the thermal environment and impact analysis of drivers in the Beijing-Tianjin-Hebei urban agglomeration of China from 2000 to 2020. Remote Sens16:2601. doi: 10.3390/rs16142601
34
LiuZ.ZhouW.WangX. (2024). Extreme meteorological drought events over China (1951–2022): migration patterns, diversity of temperature extremes, and decadal variations. Adv. Atmos. Sci.41, 2313–2336. doi: 10.1007/S00376-024-4004-2
35
LiuS.ZhouL.WangH.LinJ.HuangY.ZhouP.et al. (2025). Development of fractional vegetation cover change and driving forces in the Min river basin on the eastern margin of the Tibetan plateau. Forests16:142. doi: 10.3390/f16010142
36
MohanasundaramS.TriambakB.VishalT.ParmeshwarU.SangamS. (2022). Reconstructing NDVI and land surface temperature for cloud cover pixels of Landsat-8 images for assessing vegetation health index in the northeast region of Thailand. Environ. Monit. Assess.195:211. doi: 10.1007/s10661-022-10802-5
37
MehmoodK.AneesS. A.RehmanA.PanS.TariqA.ZubairM.et al. (2024). Exploring spatiotemporal dynamics of NDVI and climate-driven responses in ecosystems: insights for sustainable management and climate resilience. Ecol. Inform.80:102532. doi: 10.1016/j.ecoinf.2024.102532
38
MusaY.AhmadM.MustaphaA.AbdurrashidH. (2022). Recent advances in the chemistry of nitrogen, phosphorus and potassium as fertilizers in soil: a review. Pedosphere33, 385–406. doi: 10.1016/j.pedsph.2022.07.012
39
OliveiraD. R. F. V.VickP. E.BacaniM. V. (2025). Analysis of seasonal environmental fragility using the normalized difference vegetation index (NDVI) and soil loss estimation in the Urutu watershed, Brazil. Nat. Hazards121, 1–25. doi: 10.1007/s11069-024-07091-1
40
OuE.WangQ.LiuJ.RuanX.SongX.ZhangW. (2022). A study of the vegetation growth dynamics in the three Rivers source from 1982 to 2015. Environ. Resour. Ecol. J.6, 37–42. doi: 10.23977/erej.2022.060406
41
PengW.KuangT.TaoS. (2019). Quantifying influences of natural factors on vegetation NDVI changes based on geographical detector in Sichuan, western China. J. Clean Prod., 233, 353–367. doi: 10.1016/j.jclepro.2019.05.355
42
PuG.HanL.ChenL.WanD.TengH. (2025). Elevational dynamics of vegetation changes in response to climate change on the Tibetan plateau. Sci. Rep.15:9813. doi: 10.1038/s41598-025-94896-0
43
RanY.WangX.WangJ.TanJ.JuW. (2024). Warm early summer compensated reduction in photosynthesis caused by 2022 late summer extreme drought over the Tibetan plateau. J. Geophys. Res. Biogeosci.129:e2023JG007859. doi: 10.1029/2023jg007859
44
ShenP.ZhangL.FanR. (2020). Declining geohazard activity with vegetation recovery during first ten years after the 2008 Wenchuan earthquake. Geomorphology352:106989. doi: 10.1016/j.geomorph.2019.106989
45
ShengD.MengX.WangS.LiZ.ShangL.ChenH.et al. (2024). Spatiotemporal variability and environmental controls of temperature sensitivity of ecosystem respiration across the Tibetan plateau. Adv. Atmos. Sci.41, 1821–1842. doi: 10.1007/s00376-024-3167-1
46
SongY.WangJ.GeY.XuC. (2020). An optimal parameters-based geographical detector model enhances geographic characteristics of explanatory variables for spatial heterogeneity analysis: cases with different types of spatial data. GIScience Remote Sens.57, 593–610. doi: 10.1080/15481603.2020.1760434
47
SongX.XieP.SunW.MuX.GaoP. (2024). The greening of vegetation on the loess plateau has resulted in a northward shift of the vegetation greenness line. Glob. Planet. Change237:104440. doi: 10.1016/j.gloplacha.2024.104440
48
SunQ.LiuC.ChenT.ZhangA. (2021). A weighted-time-lag method to detect lag vegetation response to climate variation: a case study in Loess plateau, China, 1982–2013. Remote Sens13:923. doi: 10.3390/rs13050923
49
WangY.ChenX.GaoM.DongJ. (2022). The use of random forest to identify climate and human interference on vegetation coverage changes in Southwest China. Ecol. Indic.144:109463. doi: 10.1016/j.ecolind.2022.109463
50
WangF.MaY.DarvishzadehR.HanC. (2023). Annual and seasonal trends of vegetation responses and feedback to temperature on the Tibetan plateau since the 1980s. Remote Sens15:2475. doi: 10.3390/rs15092475
51
WeiS.DaiY.LiuB.ZhuA.DuanQ.WuL.et al. (2013). A China data set of soil properties for land surface modeling. J. Adv. Model. Earth Syst.5, 212–224. doi: 10.1002/jame.20026
52
WuK.HuZ.WangX.ChenJ.YangH.YuanW. (2024). Widespread increase in sensitivity of vegetation growth to climate variability on the Tibetan plateau. Agric. For. Meteorol.358:110260. doi: 10.1016/j.agrformet.2024.110260
53
XieH.ZhangY.YiG.QinY.LiJ.BieX.et al. (2020). Dynamic characteristics of NDVI values and its response to climatic factors in Western Sichuan plateau. Bull. Soil Water Conserv.40, 286–294. doi: 10.13961/j.cnki.stbctb.2020.04.039
54
XieY.ZhuS.WuP.LiX.WeiX. (2024). Identifying driving factors and their interacting effects on accumulation of heavy metals in cultivated soils based on optimal parameter geographic detector model. J. Geochem. Explor.266:107573. doi: 10.1016/j.gexplo.2024.107573
55
YanX.SunQ. (2023). How to evaluate ecological civilization construction and its regional differences: evidence from China. Sustainability15:12543. doi: 10.3390/su151612543
56
YangH.XuY.LiJ. (2025). Spatial identification of the suitable and potential areas of human activity and its development orientations on the Qingzang plateau. Geogr. Res.44, 2035–2056. In Chinese. doi: 10.11821/dlyj020240900
57
YaoK.HeL.BaiL.LuoH. (2024). Change and driving force analysis of vegetation cover in the Northwest Sichuan plateau. Res. Soil Water Conserv.31, 363–372. doi: 10.13869/j.cnki.rswc.2024.01.033
58
YaoZ.HuangY.ZhangY.YangQ.JiaoP.YangM. (2025). Analysis of the spatial–temporal characteristics of vegetation cover changes in the Loess plateau from 1995 to 2020. Land14:303. doi: 10.3390/land14020303
59
YaoY.ZongH.ZhouL.LiH.FengX. (2025). Root characteristics and soil-fixing ability of the dominant shrubs and herbs in the dry and hot valley of Dadu river in West Sichuan. Acta Ecol. Sin.45, 2798–2810. doi: 10.20103/j.stxb.202405161114
60
YeZ.TianY.ChenZ. (2021). Spatial distribution and susceptibility of geological disasters in Mangkang county. J. Nat. Disasters30, 199–208. doi: 10.13577/j.jnd.2021.0322
61
YinG.HeW.LiuX.XiaY.ZhangH. (2024). Wetting or greening? Probing the global trends in vegetation condition index (VCI). Int. J. Appl. Earth Obs. Geoinf.129:103822. doi: 10.1016/j.jag.2024.103822
62
YouG.ChenT.ShenP.HuY. (2023). Designing an ecological network in Yichang central city in China based on habitat quality assessment. Sustainability15:8313. doi: 10.3390/su15108313
63
YueS.PilonP.CavadiasG. (2002). Corrigendun to “power of the Mann-Kendall and spearman’s rho tests for detecting monotonic trends in hydrological series”. J. Hydrol.259, 254–271. doi: 10.1016/S0022-1694(02)00078-1
64
ZhangD.JiaQ.XuX.YaoS.ChenH.HouX. (2018). Contribution of ecological policies to vegetation restoration: a case study from Wuqi county in Shaanxi province, China. Land Use Pol.73, 400–411. doi: 10.1016/j.landusepol.2018.02.020
65
ZhangX.LiuL.LanM.SongG.XiaoL.ChenJ. (2022). Interpretable machine learning models for crime prediction. Comput. Environ. Urban. Syst.94:101789. doi: 10.1016/j.compenvurbsys.2022.101789
66
ZhangY.ZhangL.WangJ.DongG.WeiY. (2013). Quantitative analysis of NDVI driving factors based on the geographical detector model in the Chengdu–Chongqing region, China. Ecol. Indic.155:110978. doi: 10.1016/j.ecolind.2023.110978
67
ZhaoX.ShenH.GengX.FangJ. (2021). Three-decadal destabilization of vegetation activity on the Mongolian plateau. Environ. Res. Lett.16:034049. doi: 10.1088/1748-9326/abd81d
68
ZhaoA.TianX.JinZ.ZhangA. (2023). The imprint of urbanization on vegetation in the ecologically fragile area: a case study from China’s Loess plateau. Ecol. Indic.154:110791. doi: 10.1016/j.ecolnd.2023.110791
69
ZhaoW.WangH.ZhangH.ZhangL. (2024). Precipitation and anthropogenic activities regulate the changes of NDVI in Zhegucuo valley on the Southern Tibetan plateau. J. Mt. Sci.21, 607–618. doi: 10.1007/s11629-023-8299-8
70
ZhaoD.ZhuS. (2024). Spatiotemporal variation of vegetation coverage and its influencing factors in the dry-hot valley of Jinsha river during 2010–2020. Chin. J. Ecol.43, 2373–2381. doi: 10.13292/j.1000-4890.202408.023
71
ZhengH.ShenG.HeX.YuX.RenZ.ZhangD. (2015). Spatial assessment of vegetation vulnerability to accumulated drought in Northeast China. Reg. Environ. Chang.15, 1639–1650. doi: 10.1007/s10113-014-0719-4
72
ZhouJ.WangM.YuC. (2025). Study on multiple rock landslides in Gongjue area of Eastern Tibet: case study of Sela landslide. Chin. Geol. Bull., 1–13. Prepublish, In Chinese. Available at: https://kns.cnki.net/kcms2/article/abstract?v=sfGpRh49pdHDcSOKqov_GKxWn5_iSzbQllAgpMQmS11nze-wGkJ-dSwa_Srh26ZhUpU9oCzkEI8tROKbOIHxIK8nqNh6yq7KCPvfH5c9R1p2mrqHd8nSfBo7-eXSiJVGHVrRNXxr4JyXbV3mvbBivvX7EXbsJLykow_sqbhqbrJuqmMQWg5P7A==&uniplatform=NZKPT&language=CHS
Summary
Keywords
Sichuan-Tibet Interface, normalized difference vegetation index, growth peak period, spatial–temporal variation, machine learning, optimal parameter geographic detector, driving factors
Citation
Li H, Bai L, Luo J, Chen Z, Yin Z, Li P and Yang H (2025) Study on spatiotemporal variations of NDVI and driving factors during the vegetation growth peak period in Sichuan-Tibet Interface, Southwest China. Front. For. Glob. Change 8:1652361. doi: 10.3389/ffgc.2025.1652361
Received
23 June 2025
Accepted
15 September 2025
Published
26 September 2025
Volume
8 - 2025
Edited by
Bo-Hui Tang, Kunming University of Science and Technology, China
Reviewed by
Bhupendra Singh, VCSG Uttarakhand University, India
Peng Chen, Yangtze University, China
Updates
Copyright
© 2025 Li, Bai, Luo, Chen, Yin, Li and Yang.
This is an open-access article distributed under the terms of the Creative Commons Attribution License (CC BY). The use, distribution or reproduction in other forums is permitted, provided the original author(s) and the copyright owner(s) are credited and that the original publication in this journal is cited, in accordance with accepted academic practice. No use, distribution or reproduction is permitted which does not comply with these terms.
*Correspondence: Haiqing Yang, hqyang2021@cwnu.edu.cn
Disclaimer
All claims expressed in this article are solely those of the authors and do not necessarily represent those of their affiliated organizations, or those of the publisher, the editors and the reviewers. Any product that may be evaluated in this article or claim that may be made by its manufacturer is not guaranteed or endorsed by the publisher.